Energy Drinks in the US through 2023 - Beverage Marketing ...
13
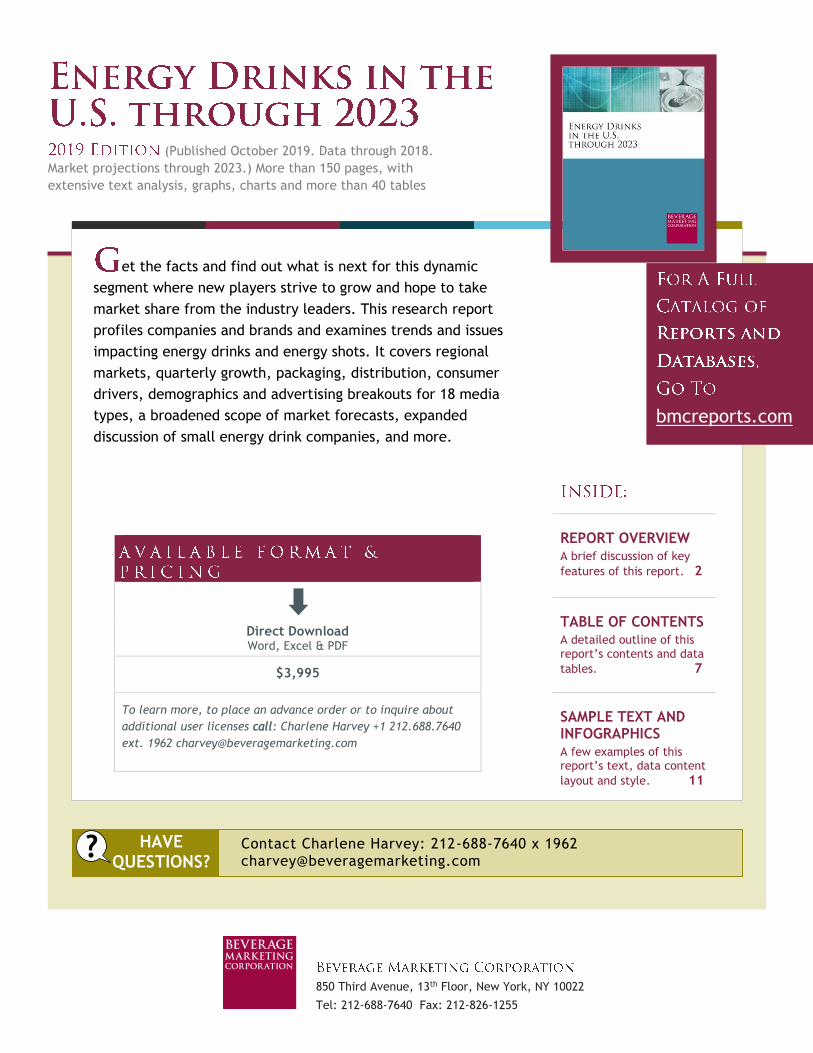
(Published October 2019. Data through 2018. Market projections through 2023.) More than 150 pages, with extensive text analysis, graphs, charts and more than 40 tables 850 Third Avenue, 13 th Floor, New York, NY 10022 Tel: 212-688-7640 Fax: 212-826-1255 et the facts and find out what is next for this dynamic segment where new players strive to grow and hope to take market share from the industry leaders. This research report profiles companies and brands and examines trends and issues impacting energy drinks and energy shots. It covers regional markets, quarterly growth, packaging, distribution, consumer drivers, demographics and advertising breakouts for 18 media types, a broadened scope of market forecasts, expanded discussion of small energy drink companies, and more. bmcreports.com REPORT OVERVIEW A brief discussion of key features of this report. 2 TABLE OF CONTENTS A detailed outline of this report’s contents and data tables. 7 SAMPLE TEXT AND INFOGRAPHICS A few examples of this report’s text, data content layout and style. 11 ? HAVE QUESTIONS? Contact Charlene Harvey: 212-688-7640 x 1962 [email protected] Direct Download Word, Excel & PDF $3,995 To learn more, to place an advance order or to inquire about additional user licenses call: Charlene Harvey +1 212.688.7640 ext. 1962 [email protected]
-
Upload
khangminh22 -
Category
Documents
-
view
0 -
download
0
Transcript of Energy Drinks in the US through 2023 - Beverage Marketing ...
(Published October 2019. Data through 2018.
Market projections through 2023.) More than 150 pages, with
extensive text analysis, graphs, charts and more than 40 tables
850 Third Avenue, 13th Floor, New York, NY 10022
Tel: 212-688-7640 Fax: 212-826-1255
et the facts and find out what is next for this dynamic
segment where new players strive to grow and hope to take
market share from the industry leaders. This research report
profiles companies and brands and examines trends and issues
impacting energy drinks and energy shots. It covers regional
markets, quarterly growth, packaging, distribution, consumer
drivers, demographics and advertising breakouts for 18 media
types, a broadened scope of market forecasts, expanded
discussion of small energy drink companies, and more.
bmcreports.com
REPORT OVERVIEW A brief discussion of key
features of this report. 2
TABLE OF CONTENTS A detailed outline of this report’s contents and data
tables. 7
SAMPLE TEXT AND INFOGRAPHICS A few examples of this report’s text, data content
layout and style. 11
? HAVE QUESTIONS?
Contact Charlene Harvey: 212-688-7640 x 1962 [email protected]
Direct Download Word, Excel & PDF
$3,995
To learn more, to place an advance order or to inquire about
additional user licenses call: Charlene Harvey +1 212.688.7640
ext. 1962 [email protected]
Energy Drinks in the U.S. through 2023 provides in-depth data and analysis, shedding light on various aspects of the market through reliable data and discussions of what the numbers really mean.
Questions answered in this in-depth research study include:
What amount of energy drinks does the typical U.S. consumer drink in a year, and how has that changed?
What are the latest developments in the packaging mix for energy drinks?
Which regions have the strongest markets?
Is "diet" a priority for consumers? What percentage of volume is full- versus low-calorie?
How have brand rankings changed recently?
How have smaller players revitalized the segment lately and what are they doing to differentiate themselves?
What are the growth prospects for the energy drink category?
What is happening in the energy shot and healthy energy (including organic) sub-segments?
What slice of the U.S. market share will slim cans command by 2023? How will that compare with the share held by 16-ounce (and larger)?
How can I contact the leading energy drink and energy shot companies and succinctly ascertain what products they market in this segment?
This comprehensive report offers an in-depth look at the category, companies and brands shaping the market and the forces impacting current and anticipated growth through 2023. This industry report provides sales and volume statistics including total market retail dollar sales, wholesale dollar data and volume data. It also shares statistics and discussion of the energy shot market, as well as an overview of the fledgling market for healthier energy drink options.
Historical, current and projected market statistics, plus authoritative analysis to provide insight and put trends in context.
Regional perspective on the U.S. marketplace, highlighting volume and growth pattern variations from region to region through 2023.
Detailed profiles and analysis of the leading companies and brands, discussions of their marketing activities and distribution strategies as well as company and brand sales volume data and market shares. Coverage includes Red Bull, Monster Beverage (including Monster, NOS and Full Throttle), Vital Pharmaceuticals (VPX), Nutrabolt (C4), Rockstar, PepsiCo (Amp and Kickstart), National Beverage (Rip It), Celsius Holdings, Anheuser-Busch (HiBall) and others.
Analysis of regular vs. reduced calorie energy drink trends.
Data detailing sales by key on- and off-premise distribution channels totaling 100% of market volume.
A detailed analysis of packaging, analyzing volume and share by package size.
Advertising expenditures of the leading energy drink and energy shot companies and a look at category spending by media type (including Internet and Hispanic-targeted advertising).
Consumer demographic profiles comparing consumers of key brands.
Perspective on the energy shot market and healthy energy segment and players, and how they affect the mainstream energy drink market.
Five-year projections for the market and its packaging mix through 2023.
A directory of the leading energy drink companies in the U.S.
Energy Drinks in the U.S. through 2023 October 2019
R E S E A R C H D A T A C O N S U L T I N G
NOTE: The information contained in this report is confidential and solely intended for the
benefit of the immediate recipient hereof.
Copyright 2019 Beverage Marketing Corporation of New York, 850 Third Avenue, New York, New York 10022, (212) 688-7640.
All rights reserved. Reproductions in any form prohibited by law.

Table of Contents
Conte
nts
Energy Drinks in the U.S. through 2023
TABLE OF CONTENTS
i
Copyright 2019 Beverage Marketing Corporation of New York
Reproduction without written permission is strictly prohibited
TABLE OF CONTENTS --------------------------------------------------------------------------------- i DEFINITIONS USED IN THIS REPORT ---------------------------------------------------------------- v INTRODUCTION --------------------------------------------------------------------------------------- vi
Chapter
1. THE U.S. ENERGY DRINK MARKET
The Energy Drink Market ------------------------------------------------------------------------ 1
Overview ---------------------------------------------------------------------------------- 1
Volume and Dollars ----------------------------------------------------------------------- 3
Per Capita Consumption ------------------------------------------------------------------ 5
Growth ------------------------------------------------------------------------------------ 6
Quarterly Growth Trends ----------------------------------------------------------------- 7
Seasonality -------------------------------------------------------------------------------- 8
Recent Issues ----------------------------------------------------------------------------- 8
Exhibits
1.1 U.S. Energy Drink Market Estimated Wholesale and Retail Dollars and Volume
1997 – 2023 ------------------------------------------------------------------------------- 10
1.2 U.S. Energy Drink Market Per Capita Consumption 1997 – 2023 ----------------------- 11
1.3 U.S. Energy Drink Market Compound Annual Growth 2002 – 2023 -------------------- 12
1.4 U.S. Energy Drink Market Volume and Growth by Quarter 2018 – 2019 --------------- 13
1.5 U.S. Energy Drink Market Quarterly Volume Shares in Measured Channels
2003 – 2018 ------------------------------------------------------------------------------- 14
2. ENERGY DRINK REGIONAL MARKETS
Regional Energy Drink Markets ------------------------------------------------------------------ 15
Overview ---------------------------------------------------------------------------------- 15
The West ---------------------------------------------------------------------------------- 16
The South --------------------------------------------------------------------------------- 16
The Midwest ------------------------------------------------------------------------------ 16
The Northeast ----------------------------------------------------------------------------- 17
Per Capita Consumption ------------------------------------------------------------------ 17
Exhibits
2.6 The Regional Energy Drink Markets Estimated Case Volume 2013 – 2023 ------------ 18
2.7 The Regional Energy Drink Markets Case Volume Share 2013 – 2023 ----------------- 19
2.8 The Regional Energy Drink Markets Case Volume Growth 2014 – 2023 --------------- 20
2.9 The Regional Energy Drink Markets Per Capita Consumption 2013 – 2023 ------------ 21
Energy Drinks in the U.S. through 2023
TABLE OF CONTENTS
ii
Copyright 2019 Beverage Marketing Corporation of New York
Reproduction without written permission is strictly prohibited
Chapter
3. REDUCED CALORIE AND REGULAR ENERGY DRINKS
Regular and Low-Calorie Energy Drinks -------------------------------------------------------- 22
Exhibits
3.10 U.S. Energy Drink Market Regular vs. Diet Volume and Share 2006 – 2023 ---------- 24
3.11 U.S. Energy Drink Market Regular vs. Diet Volume Growth 2007 – 2023 -------------- 25
3.12 U.S. Energy Drink Market Regular vs. Diet Wholesale Dollars and Share 2006 – 2023 26
3.13 U.S. Energy Drink Market Regular vs. Diet Wholesale Dollar Growth 2007 – 2023 --- 27
4. ENERGY DRINK DISTRIBUTION CHANNELS
Energy Drink Distribution Channels ------------------------------------------------------------- 28
Overview ---------------------------------------------------------------------------------- 28
Convenience and Gas Stores------------------------------------------------------------- 29
Supermarkets ----------------------------------------------------------------------------- 30
Foodservice ------------------------------------------------------------------------------- 30
Mass Merchandisers ---------------------------------------------------------------------- 31
Drug Stores ------------------------------------------------------------------------------- 32
Others ------------------------------------------------------------------------------------- 32
Exhibits
4.14 U.S. Energy Drink Market Volume by Distribution Channel 2013 – 2023 -------------- 34
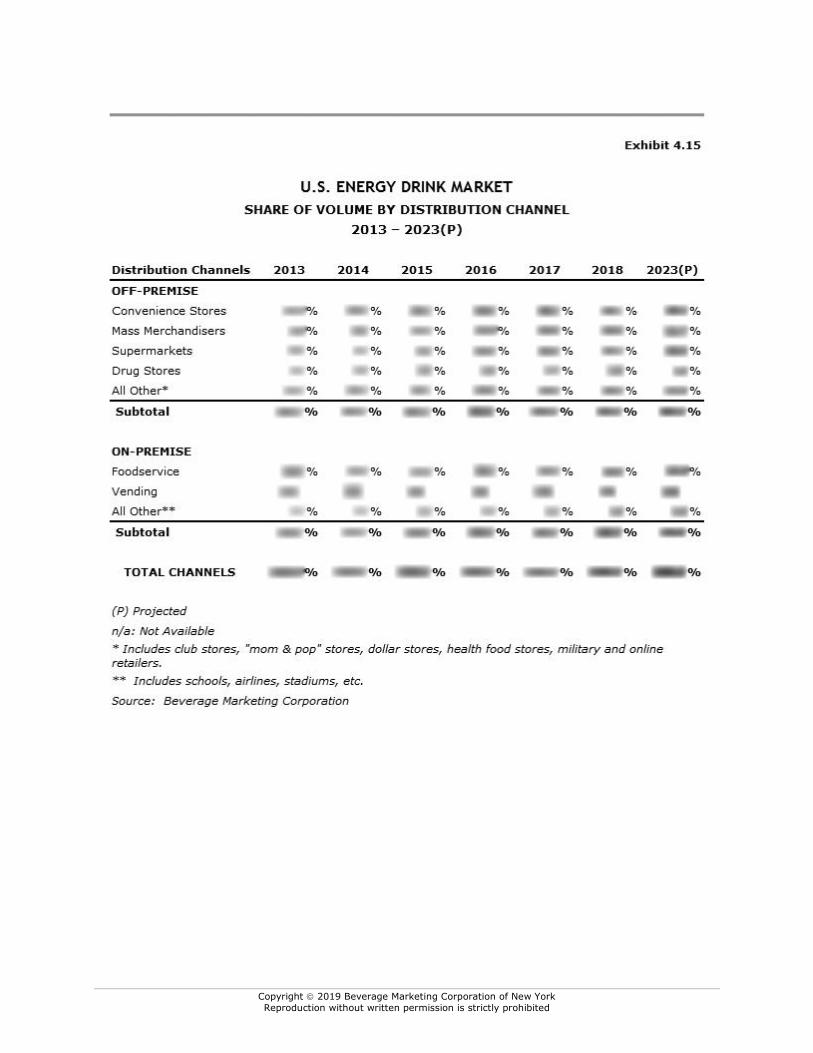
4.15 U.S. Energy Drink Market Share of Volume by Distribution Channel 2013 – 2023 ---- 35
4.16 U.S. Energy Drink Market Change in Volume by Distribution Channel 2014 – 2023 -- 36
5. ENERGY DRINK PACKAGING
Energy Drink Packaging -------------------------------------------------------------------------- 37
Exhibits
5.17 Energy Drink Packaging Volume by Size 1997 – 2023 ---------------------------------- 41
5.18 Energy Drink Packaging Share of Volume by Size 1997 – 2023 ------------------------ 42
5.19 Energy Drink Packaging Change in Volume by Size 1998 – 2023 ---------------------- 43
5.20 Energy Drink Packaging Estimated Wholesale Dollars by Size 1997 – 2023 ----------- 44
5.21 Energy Drink Packaging Share of Wholesale Dollars by Size 1997 – 2023 ------------- 45
5.22 Energy Drink Packaging Change in Wholesale Dollars by Size 1998 – 2023 ----------- 46
6. LEADING ENERGY DRINK COMPANIES AND THEIR BRANDS
The Leading Companies -------------------------------------------------------------------------- 47
Red Bull ------------------------------------------------------------------------------------------ 49
Monster Beverage Corporation -------------------------------------------------------------- 66
Vital Pharmaceuticals, Inc. ------------------------------------------------------------------- 83
Rockstar, Inc. ----------------------------------------------------------------------------------- 85
PepsiCo, Inc. ------------------------------------------------------------------------------------ 90
National Beverage Corporation -------------------------------------------------------------- 96

Energy Drinks in the U.S. through 2023
TABLE OF CONTENTS
iii
Copyright 2019 Beverage Marketing Corporation of New York
Reproduction without written permission is strictly prohibited
Chapter
6. LEADING ENERGY DRINK COMPANIES AND THEIR BRANDS (cont’d)
Nutrabolt ---------------------------------------------------------------------------------------- 97
Celsius Holdings -------------------------------------------------------------------------------- 99
Ferolito, Vultaggio & Sons -------------------------------------------------------------------- 102
Keurig Dr Pepper ------------------------------------------------------------------------------- 103
Anheuser-Busch InBev ------------------------------------------------------------------------ 104
Crunk!!! Energy Drink ------------------------------------------------------------------------- 106
Energy Drink Retail Price Per Case -------------------------------------------------------------- 107
Exhibits
6.23 Leading Energy Drink Brands Estimated Wholesale Dollar Sales 2013 – 2018 -------- 108
6.24 Leading Energy Drink Brands Share of Wholesale Dollar Sales 2013 – 2018 ---------- 109
6.25 Leading Energy Drink Brands Change in Wholesale Dollar Sales 2014 – 2018 -------- 110
6.26 Leading Energy Drink Brands Volume 2013 – 2018 ------------------------------------- 111
6.27 Leading Energy Drink Brands Share of Volume 2013 – 2018 --------------------------- 112
6.28 Leading Energy Drink Brands Change in Volume 2014 – 2018 ------------------------- 113
6.29 U.S. Energy Drink Market Retail Price Per Case by Brand in Supermarkets
2015 – 2018 ------------------------------------------------------------------------------- 114
6.30 U.S. Energy Drink Market Retail Price Per Case by Brand in Drug Stores
2015 – 2018 ------------------------------------------------------------------------------- 115
7. THE ENERGY SHOT AND HEALTHY ENERGY SEGMENTS
Energy Shots ------------------------------------------------------------------------------------- 116
Healthy Energy ----------------------------------------------------------------------------------- 120
Exhibits
7.31 U.S. Energy Shot Market Estimated Wholesale Dollars and Volume 2005 – 2023 ----- 123
7.32 Leading Energy Shot Brands Estimated Wholesale Dollar Sales 2013 – 2018 --------- 124
7.33 Leading Energy Shot Brands Share of Wholesale Dollar Sales 2013 – 2018 ----------- 125
7.34 Leading Energy Shot Brands Change in Wholesale Dollar Sales 2014 – 2018 --------- 126
7.35 U.S. Organic Energy Drink Market Estimated Wholesale Dollars, Volume and Change
2005 – 2023 ------------------------------------------------------------------------------- 127
7.36 U.S. Organic Energy Drink Market Per Capita Consumption 2005 – 2023 ------------- 128
8. ENERGY DRINK ADVERTISING EXPENDITURES
Energy Drink Advertising Expenditures --------------------------------------------------------- 129
Overview ---------------------------------------------------------------------------------- 129
Expenditures by Medium ----------------------------------------------------------------- 133
Energy Drinks in the U.S. through 2023
TABLE OF CONTENTS
iv
Copyright 2019 Beverage Marketing Corporation of New York
Reproduction without written permission is strictly prohibited
Chapter
8. ENERGY DRINK ADVERTISING EXPENDITURES (cont’d)
Exhibits
8.37 Leading Energy Drink Brands Advertising Expenditures 2013 – 2018 ------------------ 135
8.38 Leading Energy Drink Brands Share of Advertising Expenditures 2013 – 2018 -------- 136
8.39 Leading Energy Drink Brands Change in Advertising Expenditures 2014 – 2018 ------ 137
8.40 Energy Drink Advertising Expenditures by Media 2013 – 2018 ------------------------- 138
8.41 Energy Drink Share of Advertising Expenditures by Media 2013 – 2018 --------------- 139
8.42 Energy Drink Change in Advertising Expenditures by Media 2014 – 2018 ------------- 140
9. DEMOGRAPHICS OF THE ENERGY DRINK CONSUMER
Demographics of the Energy Drink Consumer -------------------------------------------------- 141
Overview ---------------------------------------------------------------------------------- 141
Comparative Demographics of Energy Drink Brands ----------------------------------- 145
Comparative Demographics of Energy Drinks versus Energy Shots ------------------- 148
Exhibits
9.43 Demographics of the Energy Drink Consumer 2018 ------------------------------------- 151
9.44 Demographics of the Red Bull Consumer 2018 ------------------------------------------ 153
9.45 Demographics of the Monster Consumer 2018 ------------------------------------------ 155
9.46 Demographics of the Rockstar Consumer 2018 ------------------------------------------ 157
9.47 Demographics of the 5-Hour Energy Consumer 2018 ----------------------------------- 159
10. DIRECTORY OF ENERGY DRINK COMPANIES
Energy Drink Companies ------------------------------------------------------------------------- 161
Copyright 2019 Beverage Marketing Corporation of New York
Reproduction without written permission is strictly prohibited
Since the Red Bull brand broke upon the U.S. scene in 1997, the energy drink category has been
a fast-growth, high-margin phenomenon, not even derailed by the financial crisis and
accompanying recession.
After its U.S. launch in 1997, Austrian pioneer Red Bull and its trademark eight-
ounce slim can quickly drew a torrent of rivals numbering in the hundreds, most
of them mustering caffeine-laden formulas melding hitherto unknown ingredients
like the amino acid taurine — not to mention an edgy, macho positioning intended
to strike a chord with the key target demographic: young males who hang
around convenience stores.
After struggling with an eight-ounce imitation of Red Bull under the granola-
connoting Hansen’s brand, Hansen Natural Corporation launched Monster Energy
as a value play offering twice the volume at a similar $1.99 price. Monster rode
its distinctive claw motif as well as savvy bets on up-and-coming alternative
sports icons into a strong number two position, steadily narrowing the gap against
Red Bull to the point where today they are about even, although Red Bull enjoys
more premium pricing particularly as it has shifted toward 12-ounce cans as a key
part of its sales mix.
Reverberations in the segment were felt from Coca-Cola’s move in August 2014 to
make a minority investment of 16% in Monster Beverage Corporation, which it
had distributed in about half of the U.S. and in some overseas markets. The
sweeping deal, for $2.15 billion, called for Monster to move almost entirely into
the Coke network in North America and to ride its partner into new overseas
markets including China. Interestingly, in early 2020, Coke is defying its partner
by introducing Coca-Cola Energy in the U.S. after already launching it in Europe.
Although the deal between Coke/Monster was the most striking development in
energy in recent years, there has been plenty more activity. Red Bull North
America has continued its long-term move to self-distribute the brand in major
metropolitan areas, terminating other independent houses, particularly so-called
“multi-brand” wholesalers who must answer to other masters than just Red Bull.
Rockstar Energy, after steadily losing ground to Red Bull and Monster quarter
after quarter, went on a growth tear a few years ago that, for a change, was not
driven by deep discounting, but it has since faltered again — although the far
worse performance of its distribution partner PepsiCo’s other energy plays, Amp
and Mountain Dew Kickstart, would seem to insure that it retains a place in the
network for now.
After an inevitable slowdown, the energy drink market has gotten a shot of
adrenaline lately with the emergence of so-called performance energy drinks.

Copyright 2019 Beverage Marketing Corporation of New York
Reproduction without written permission is strictly prohibited
Copyright 2019 Beverage Marketing Corporation of New York
Reproduction without written permission is strictly prohibited