Amber Beverage Group | ANNUAL REPORT 2018
84
-
Upload
khangminh22 -
Category
Documents
-
view
2 -
download
0
Transcript of Amber Beverage Group | ANNUAL REPORT 2018


AMBER BEVERAGE GROUP | ANNUAL REPORT 2018 > CONTENTS > CONSOLIDATED MANAGEMENT REPORT > CONSOLIDATED FINANCIAL STATEMENTS> CHAIRMAN’S STATEMENT > CHIEF FINANCIAL OFFICER’S STATEMENT > INDEPENDENT AUDITOR’S REPORTPAGE 2 PAGE 3

STRATEGIC REPORT
ContentsConsolidated Management ReportThe Group at a Glance 6
Chairman’s Statement 2018 14
Chief Financial Officer’s Statement 18
Our Brands 22Riga Black Balsam® 27Moskovskaya® 31Cosmopolitan Diva® 35Rooster Rojo® 39Cross Keys Gin® 43
Regional performance 46Production 48Latvia 49Russia 50Estonia 51Mexico 52
Distribution 54Latvia 55Lithuania 57Estonia 59United Kingdom 60Australia 62International Sales 64
Our Team 66
Strategy In Action 72
Principal Risks 82
Social Responsibility 90
Consolidated Financial Statements 94
Statement of Managers’ Responsibilities 159
Independent Auditor’s Report 160
AMBER BEVERAGE GROUP | ANNUAL REPORT 2018 > CONTENTS > CONSOLIDATED MANAGEMENT REPORT > CONSOLIDATED FINANCIAL STATEMENTS> CHAIRMAN’S STATEMENT > CHIEF FINANCIAL OFFICER’S STATEMENT > INDEPENDENT AUDITOR’S REPORTPAGE 4 PAGE 5

THE GROUP AT A GLANCE
Amber Beverage Group (ABG) is a leading producer, distributor, logistics provider and retailer of beverages. It operates internationally from its head office in Luxembourg and through its production and distribution companies in Russia, Mexico, the UK, Australia and the Baltics, its historical home.
Net revenue 2018, excluding excise
€ 243 million
Production
33%
Distribution
67%
Our strategic choices
• Deliver quality and value to our consumers, customers and suppliers
• Strengthen our market positions in all key sectors by building and or acquiring brands and companies
• Achieve operational effectiveness and efficiency by applying rigor to everything we do
• Build a truly effective international team with an ambitious, high performance culture
• Generate superior shareholder value through relentless focus on performance
AMBER BEVERAGE GROUP | ANNUAL REPORT 2018 > CONTENTS > CONSOLIDATED MANAGEMENT REPORT > CONSOLIDATED FINANCIAL STATEMENTS> CHAIRMAN’S STATEMENT > CHIEF FINANCIAL OFFICER’S STATEMENT > INDEPENDENT AUDITOR’S REPORTPAGE 6 PAGE 7

Volume
Headquarters
Centralized functions
Volume Net revenue Operating Profit
Core brands
15.1m 9L cases sold
ABG head office is located in Luxembourg. ABG global management team reports to independent Supervisory Board
Along with production and distribution, within their central functions, ABG management and Supervisory Board define, coordinate and oversee ABG’s overall strategy and ensure governance and compliance of ABG affiliates
Products produced by ABG are sold in over 185 countries
Volume, k 9Lcs
Reported movement
Organic movement
Net revenue, m
Reported movement
Organic movement
Operating profit, m
Reported movement
Organic movement
15 140 50%
46%
€242.6 15%
10%
€22.0 59%
58%
15 140 242,6 22,0
10 070 211,6 13.8
2018 2018 2018
2017 2017 2017
Amber Beverage Group
Production
Distribution
Revenue increase 15 % Volume increase 50 %
Revenue increase 18 % Volume increase 110 %
Revenue increase 13 % Volume increase 14 %
Net revenue, mEUR Volume, k9lcs Headcount
15 140
8 022
7 118
242.6
80.92
161.7
2 139
1 440
699
HighlightsProduction 33%
Rest of World 39% Rest of World 58%
Rest of World 21%
Production 53%
Rest of World 8%
Distribution 67%
Baltics 61% Baltics 42%
Baltics 79%
Distribution 47%
Baltics 92%
Other 6%
Russia 9%
Cyprus 17%
UK 12%
Baltics 56%
Other 1%
Russia 30%
Cyprus 18%
UK 4%
Baltics 47%
Sales by markets, 2018 Volumes by sales markets
8 AMBER BEVERAGE GROUP | ANNUAL REPORT 2018AMBER BEVERAGE GROUP | ANNUAL REPORT 2018 > CONTENTS > CONSOLIDATED MANAGEMENT REPORT > CONSOLIDATED FINANCIAL STATEMENTS> CHAIRMAN’S STATEMENT > CHIEF FINANCIAL OFFICER’S STATEMENT > INDEPENDENT AUDITOR’S REPORTPAGE 8 PAGE 9

ABG Milestones: the Origins ABG Milestones: Building For Future
1847
In 1847, Albert Wolfschmidt establishes the factory that produces Kunzen’s Riga Black Herbal balsam
2015
The first Riga Black Balsam® Global Challenge for bartenders takes place
ABG acquires Moskovskaya® Vodka
1900
Latvijas balzams begins operations and opens as Riga State Spirits Warehouse No.1
2003
SPI BV Regional Business Unit becomes ABG’s leading shareholder
Stolichnaya vodka and Moskovskaya® Vodka are now bottled for the global market
2017
Rooster Rojo® is launched for the rapidly growing global tequila category
ABG acquires shares in the UK distribution company Cellar Trends
ABG acquires 100% of Talvis spirit distillery in Tambov, Russia
1752
Pharmacist Abraham Kunze creates his unique formula for the beverage which forms the base of Riga Black Balsam®
1894
The production of Moskovskaya® Vodka begins under the auspices of the Russian Empire’s vodka monopoly
1948
Latvijas balzams begins production of Stolichnaya vodka
The formula was created in Russia ten years earlier in 1938
2012
ABG launches 18 new products, including the new premium quality Riga Black® vodka
2014
Amber Beverage Group is registered on October 24
Amber Logistics open its doors
2016
Moskovskaya® Vodka is rolled out to 68 markets globally
ABG acquires 100% of the tequila producer Fabrica de Tequilas Finos in Tequila, Mexico
2018
Fabrica de Tequilas Finos receives the most industry awards at The Spirits Business Tequila Masters championship
ABG acquires 100% of of Permalko, 100% of Remedia and a majority stake in Think Spirits
The first Latvian premium craft gin Cross Keys® Gin was launched
AMBER BEVERAGE GROUP | ANNUAL REPORT 2018 > CONTENTS > CONSOLIDATED MANAGEMENT REPORT > CONSOLIDATED FINANCIAL STATEMENTS> CHAIRMAN’S STATEMENT > CHIEF FINANCIAL OFFICER’S STATEMENT > INDEPENDENT AUDITOR’S REPORTPAGE 10 PAGE 11

OUR VISION
Growing our business through providing new experience to our customers
Seymour Paul Ferreira Chairman of the Executive Board and CEO
AMBER BEVERAGE GROUP | ANNUAL REPORT 2018 > CONTENTS > CONSOLIDATED MANAGEMENT REPORT > CONSOLIDATED FINANCIAL STATEMENTS> CHAIRMAN’S STATEMENT > CHIEF FINANCIAL OFFICER’S STATEMENT > INDEPENDENT AUDITOR’S REPORTPAGE 12 PAGE 13

value through new product development (NPD), and on driving our four core business objectives:
• Building effective teams; • Delivering quality and value to our customers and
consumers; • Achieving operational effectiveness and efficiency; • Strengthening our market positions and growing
through new business and acquisitions.
ABG continued the process started in 2017 of establishing its headquarters in Luxembourg and added an Independent Supervisory Board lead by Mr. Mark Garber to strengthen our corporate governance for our worldwide operations.
We have restructured our international operations and introduced a new regional structure for Asia Pacific, Europe/Middle East/Africa, America’s and GTR, welcoming on board new regional managing directors and team leaders to strengthen and support our international markets and strategic marketing activities. Supporting our internationally ambitions, we also launched our web portal amberdrinks.eu and the ABG Customer Service Centre this year that brings
the customer experience closer to us and improves our communication with our customers and new international team.
ABG continued to introduce new products and new brands in 2018 including the launch of Cross Keys Gin® – a premium gin which unlocks the Baltic taste, Riga Black Balsam® 100 edition to celebrate the centenary of independence of Latvia, new flavours to our low ABV brands Cosmopolitan Diva® and Lucky Dog® and redesigned and launched new varieties to our core brand range of Moskovskaya®, Riga Black Balsam®, Grand Cavalier®, Rooster Rojo®, we are looking forward to more from our core portfolio in 2019.
Despite the political and commercial challenges faced by the group in 2018 ABG delivered outstanding financial results; EUR 243 million in net revenues (+15% vs 2017), EUR 22 million in operating profit (+59% vs 2017) and EUR 28 million in EBITDA (earnings before interest, tax, depreciation and amortisation charges) (+51% vs 2017) showing that our core strategy is working and with the right focus and team we can continue to deliver the Extraordinary Everyday.
In 2019 we will continue to consolidate the work started in 2018 and to invest in our core brands, capabilities and businesses.
In all our current markets, we will further strengthen our core brands, by developing innovative consumer communication and by investing in our route to market and will continue to seek to lead the market, locally and internationally, with our creative propositions.
In 2019 we will focus on driving growth in our core export markets supported by our focus on our well-known brands – Riga Black Balsam®, Moskovskaya® Vodka, Rooster Rojo®, Grand Cavalier®, Cosmopolitan Diva® - investing appropriately in building their international recognition and brand equity.
ABG will also continue to support and grow our critical third party brands, building our capabilities and our effectiveness to develop our business in line with brand owner expectations across all our owned routes to market.
Supporting our brand and route to market plans will be our continued efforts to improve our overall efficiency both at the Baltics and global markets. With this in mind, we plan to improve our production capabilities further, adding additional focus to purchasing, planning and infrastructure improvements.
I believe that we are well-positioned to continue our ABG journey in 2019.
Chairman’s Statement 2018
Extraordinary Everyday
Dear readers,
As the Chairman of the Management Board of Amber Beverage Group, I’m pleased to present the annual report for 2018 – a year of extraordinary challenges, experiences and success stories.
In 2018 the Amber Beverage Group (ABG or the Group) celebrated its 4th anniversary as a separate division of SPI Group. ABG combined the production and distribution companies of the group in the Baltic region, and provided a launch pad for the beginnings of an extraordinary journey. Over the last four years we have added new production facilities, distribution channels and brands to our portfolio, transforming ABG from a pan-Baltic enterprise into a truly global player able to offer a more direct service and experience to our customers and consumers worldwide.
By the end of 2018 ABG has grown to combine five production companies in Latvia, Estonia, Mexico and Russia, six distribution companies in Latvia, Lithuania, Estonia, the United Kingdom and Australia. We also actively deliver customer experiences through our retail chains in Latvia and Lithuania and provide specific logistic solutions at pan-Baltic level through our Logistics business unit.
Built on our core strategy of growing organically and through acquisition, ABG completed the takeover of Remedia AS in February 2018 – one of the oldest production companies in Estonia – which has allowed us to increase the presence of our brands, by consolidating and upgrading our distribution company in Estonia, adding not only the Remedia portfolio, but significant 3rd party business and firmly establishing ourselves as the number two distribution company in Estonia. We see the potential for additional production synergies with Latvijas balzams as Remedia becomes a specialist small batch production unit for the ABG portfolio.
In April 2018 we increased our holding in Cellar Trends, our UK distribution company, increasing our stake to 70%,
a majority controlling interest in the business. This strategic investment will allow us to grow our presence in one of the largest beverage markets in Europe.
In May 2018 ABG entered the Australian market, acquiring a majority stake in Think Spirits Pty Ltd – one of the largest independent distributors of spirits in the country. The investment in Think Spirits allowed us to take over the distribution for Stolichnaya vodka in Australia, and to launch ABG’s core brands in this important market. We are already seeing excellent results and have a very positive outlook for the future.
In October 2018 and as part of an SPI Group reorganisation, ABG gained a majority controlling interest in Permalko AO –the oldest vodka distillery in Russia adding to our brand portfolio such well-known brands as Gradus® and Russkij Rezerv® and nearly 3 million 9Lt cases of additional business.
The commercial environment in 2018 was very challenging. This was partly due to the political and financial situation in our domestic markets, where a number of factors adversely impacted our overall results. We have seen demand decline in our traditional consumer base, combined with continued excise and duty increases, particularly in Lithuania and Estonia, which combined with the introduction of restrictions on advertising, distribution and promotional activities led in some cases to a 20% drop in off-take. The net effect of which created consumer, trade and pipeline confusion, increased pressure on prices accelerating an ongoing shift from the traditional trade to big retail chains.
As a result we have seen a significant increase in competitive activities designed to drive volume with more aggressive pricing activities, frequently at the expense of margin, in all our key markets.
ABG, however, remains cautious about discounting for volume; we are focusing instead on our revenue management principles of promotion effectiveness, building
Seymour Paul Ferreira
Chairman of the Executive Board and ABG CEO 4 June 2019
AMBER BEVERAGE GROUP | ANNUAL REPORT 2018 > CONTENTS > CONSOLIDATED MANAGEMENT REPORT > CONSOLIDATED FINANCIAL STATEMENTS> CHAIRMAN’S STATEMENT > CHIEF FINANCIAL OFFICER’S STATEMENT > INDEPENDENT AUDITOR’S REPORTPAGE 14 PAGE 15

OUR GROWTH
ABG has ambitious plans for the future organic growth driven by continuous investments in cutting edge IT technologies and relentless improvements of our internal processes, including automation and robotisation of the Group’s primary activities.
Jekaterina Stuģe Chief Financial Officer
AMBER BEVERAGE GROUP | ANNUAL REPORT 2018 > CONTENTS > CONSOLIDATED MANAGEMENT REPORT > CONSOLIDATED FINANCIAL STATEMENTS> CHAIRMAN’S STATEMENT > CHIEF FINANCIAL OFFICER’S STATEMENT > INDEPENDENT AUDITOR’S REPORTPAGE 16 PAGE 17

Chief Financial Officer’s Statement
In 2018, the global performance of ABG was very strong, reaching 15% growth in global net revenues and a 59% increase in operating profit, adding EUR 9.5 million to EBITDA in comparison to 2017. This was achieved through continuous expansion and development of ABG which has grown into a truly global player in the production, distribution, retail and logistics of alcoholic beverages.
Investments
The acquisition of Cellar Trends (UK distributor) and Interbaltija AG (Latvia based HoReCa specialised distributor) in 2017 has contributed to the distribution segment of the Group; while the acquisition of Talvis (a rectified ethyl alcohol producer), has allowed the Group to take control of the supply process from the key raw materials to the finished product on the shelves of retail shops.
Following the global strategy of ABG, the expansion in both distribution and production segments also continued in 2018. Acquisition of the majority shareholding in Think Spirits, a well-known distributor of spirits in Australia, has opened the doors in one of the leading global markets for our own brands Rooster Rojo® tequila, Moskovskaya® Vodka and Riga Black Balsam®. In the production segment, we have strengthened our market position in Estonia by acquiring one of the oldest Estonian producers of alcoholic beverages Remedia that helped us significantly increase our Estonian distributor portfolio and secure a better position in the market. In addition, we are now able to effectively use synergies in the production segment at pan-Baltic level and plan further optimisation in the logistics process on the Estonian market. In late autumn, the Group gained majority control over one of the oldest Russian alcohol producers Permalko. The acquisition of Permalko ties well into the
strategic expansion of the Group as Permalko is not only one of key players on the Russian market, but it also owns a strong brand portfolio in vodka and bitters categories, thereby adding an important stake to the total brand portfolio of the Group.
In 2018, ABG’s investments totaled about EUR 4 million in the asset base. The main investment projects were related to the upgrading of bottling and packaging equipment, the improvement of quality control for finished goods by the installation of new inspection equipment at the production facilities of Latvijas Balzams, the installation of a new labelling machine and the installation of solar panels at the production facility of Fabrica de Tequilas Finos, which will ensure improved production efficiency and lower energy costs.
Net revenue
Based on the comparison of the Group’s financial performance in 2018 versus previous years, mergers and acquisitions (M&A) activities have contributed an additional 5% (EUR 10.4 million) to the total net revenue, thus more than compensating the negative effect from foreign exchange of EUR 1 million mainly caused by the depreciation of the Mexican peso and the Russian ruble against the euro, which
is the functional and presentation currency of ABG. Revenue growth has decelerated in Mexico, where a major private label agreement expired in 2018. Our sales volumes were also adversely effected by new legislative initiatives imposing additional restrictions on advertising and retail.
Operating profit
0
50 000
100 000
150 000
200 000
250 000
Net revenue 2017
211 793
FX e�ect
(1 110)
M&A2018
10 444
OrganicGrowth
21 479
Net revenue2018
242 624
0
5 000
10 000
15 000
20 000
25 000
Operatingprofit 2017
13 836 103 160
5 704
2 191 21 994
FXe�ect
M&A2018
OrganicGrowth
Exceptionalitems
Operating profit 2018
AMBER BEVERAGE GROUP | ANNUAL REPORT 2018 > CONTENTS > CONSOLIDATED MANAGEMENT REPORT > CONSOLIDATED FINANCIAL STATEMENTS> CHAIRMAN’S STATEMENT > CHIEF FINANCIAL OFFICER’S STATEMENT > INDEPENDENT AUDITOR’S REPORTPAGE 18 PAGE 19

At operating profit level, 2018 was a year of great success because, as a result of hard work contributed by local teams and the ABG management, the operating profit has increased by 59% and reached EUR 22 million.
The main drivers of the operating profit growth were driven by the improvement of operations, which was worked through to integrate and align many of our processes across the Group, to operate consistently pursuant to the highest standards and deliver flexible and low cost production and logistics, as well as annualization of Talvis financial results.
During 2018, the Group continued to renegotiate the terms of contracts on the supply of core raw materials, which resulted in material savings, enabling our sales team to launch our products in new export markets.
We are also working hard to shift our focus from volume to profitability and upgraded our customer and margin management tools. We shall proceed with our work on promo efficiency in 2019.
An extraordinary profit item of EUR 2 million relates to adjustments made to the contingent consideration for the acquisition of the remaining shareholding in Cellar Trends.
Some of the financial ratios effectively demonstrate the stability of Group’s financial performance: return on assets (ROA) of 4.81%, return on equity (ROE) of 10.4%, EBITDA margin above 11.58%. Management at both global and local level is continuously working to keep the financial performance metrics stable and improve them within the rapidly expanding Group, which is facing different challenges imposed by economic, legislative and market-specific drivers.
Financing activities
In 2018, a loan facility of EUR 3.6 million was obtained from Luminor Bank AS with the purpose of financing the acquisition of Think Spirits and from Swedbank in the amount of EUR 5 million to finance increasing working capital needs in line with our expanded operations across the world. Over the year, cooperation with the lenders has enabled us to keep financing costs low, which is critical at the Group level, where the net result is influenced by FX risk arising from out-of-euro-zone currencies (mainly Mexican pesos, US dollars, Russian rubles, Australian dollars and British pounds). At the end of the financial year, ABG restructured its borrowing portfolio in close cooperation with Luminor Bank, with the result that the maturity dates of all the borrowings from Luminor Bank have been reset to 31 December 2023 and a two-year grace period has
been granted, with other terms and conditions remaining unchanged. This will benefit cash flow management at the Group level in years to come and enable further investments in both existing and new markets.
Net debt as at 31 December 2018 is EUR 56.6 million (an increase by EUR 7.8 million from 31 December 2017), which is mainly driven by additional borrowings received and net debt acquired from the newly acquired subsidiaries Think Spirits and Permalko in the amount of EUR 3.3 million, who are using overdrafts and similar financial instruments for working capital management purposes.
Cash flow
Both the level of generated profit and the timing of sales in the fourth quarter impacted the Group’s cash flow. Owing to the strong cash flow during the year, the Group could make use of the early payment option offered by some of our major suppliers to receive cash discounts.
The cash pool allows our major subsidiaries to share resources and makes it possible to manage our cash position in the most beneficial and profitable way.
Jekaterina Stuģe
ABG Chief Financial and Operations Officer 4 June 2019
0
3
6
9
12
15
2017 2018
11.21
13.13
0
1
2
3
4
5
6
2017 2018
4.69% 4.81%
0
2
4
6
8
10
12
2017
8.80%
2018
11.58%
0
3
6
9
12
2017 2018
9.59%10.4%
EBITDA per head, kEUR
ROA, %
EBITDA margin, %
ROE, %
AMBER BEVERAGE GROUP | ANNUAL REPORT 2018 > CONTENTS > CONSOLIDATED MANAGEMENT REPORT > CONSOLIDATED FINANCIAL STATEMENTS> CHAIRMAN’S STATEMENT > CHIEF FINANCIAL OFFICER’S STATEMENT > INDEPENDENT AUDITOR’S REPORTPAGE 20 PAGE 21

OUR BRANDS
ABG manages over 600 brands, including more than 130 brands (over 1 000 SKUs) that we own and produce.
Brand Portfolio Management
ABG manages over 600 brands, including more than 130 brands (over 1 000 SKUs) that we own and produce. As one of the leading importers and distributors, our companies from the Baltic States have the honour to represent premier distillers and vintners from all around the world, bringing celebrated brands to Latvia, Lithuania, and Estonia.
With roots in the business stretching back over a century, it is a challenge to keep pace with the ever-changing marketplace, while investing in qualities that matter. However, our insight into the local markets and our technological capabilities give us a very strong competitive advantage.
ABG has used 2018 to further develop the global footprint of its core brands Moskovskaya® Vodka, Rooster Rojo® tequila, Cross Keys Gin®, Riga Black Balsam® and Cosmopolitan Diva®.
While the renewed ambition for Moskovskaya® Vodka is set to deliver 1 million 9 L cases by 2022, the continuous organic growth of Riga Black Balsam® is on track growing its profitability base. Cross Keys Gin® and Rooster Rojo® tequila are launching in new markets every quarter and Cosmopolitan Diva® keeps finding new partners to distribute the brand all over the world.
Gradus® vodka and Russian Reserve® vodka produced by Permalko have successfully enhanced our brand portfolio with great potential in the global markets. At the same time, many new brands are under development, which are planned to be launched globally in 2019.
AMBER BEVERAGE GROUP | ANNUAL REPORT 2018 > CONTENTS > CONSOLIDATED MANAGEMENT REPORT > CONSOLIDATED FINANCIAL STATEMENTS> CHAIRMAN’S STATEMENT > CHIEF FINANCIAL OFFICER’S STATEMENT > INDEPENDENT AUDITOR’S REPORTPAGE 22 PAGE 23

Attractive Brand Portfolio Across Key Categories
Leading International Brand Lines Leading Category Brands
Vodka
Tequila Brandy
Cofee liqueur CiderSparkling wines
AMBER BEVERAGE GROUP | ANNUAL REPORT 2018 > CONTENTS > CONSOLIDATED MANAGEMENT REPORT > CONSOLIDATED FINANCIAL STATEMENTS> CHAIRMAN’S STATEMENT > CHIEF FINANCIAL OFFICER’S STATEMENT > INDEPENDENT AUDITOR’S REPORTPAGE 24 PAGE 25

Riga Black Balsam®
The Legendary Herbal Bitter Riga Black Balsam® is probably the oldest living bitter brand in the world, with a history of craftsmanship dating back over 260 years.
First recorded in 1752, it has been loved and admired by generations. Only natural ingredients are used to craft this unique herbal bitter.
Riga Black Balsam® with its distinguished award-winning natural clay bottle is well-known and sold to customers in 30 international markets, with over 4 million bottles produced every year.
Riga Black Balsam® is beloved by industry experts and the world’s best bartenders, having received more than 100 awards at international fairs and competitions.
The authentic and versatile taste of this legendary herbal bitter makes it an indispensable component for modern mixology and even cuisine.
Today, this brand line is built around four bitters – the original Riga Black Balsam® and its contemporary flavoured variations, Riga Black Balsam Currant® (the original recipe is enriched with blackcurrant juice), Riga Black Balsam Cherry® (enriched with cherry juice) and the rum-based Riga Black Balsam Element®.
Likely the oldest bitter brand available Crafted with passion since 1752
Distinctive, authentic taste An exquisite balance of sweet and bitter flavours
Complex blendable flavour profile An exciting ingredient for modern mixology and cuisine
All-natural ingredients No colorants or flavours added
Secrets of master craftsmanship Single-barrel infusion technology
Unique bottle True to the original centuries-old natural clay design
Recognition of quality Over 100 top international awards and counting
AMBER BEVERAGE GROUP | ANNUAL REPORT 2018 > CONTENTS > CONSOLIDATED MANAGEMENT REPORT > CONSOLIDATED FINANCIAL STATEMENTS> CHAIRMAN’S STATEMENT > CHIEF FINANCIAL OFFICER’S STATEMENT > INDEPENDENT AUDITOR’S REPORTPAGE 26 PAGE 27

“2018 was another great year for the legendary herbal bitter Riga Black Balsam®, showing +11% volume increase from 2017. It was a breakthrough year for the brand in export markets with +30% volume increase from the year before, reaching more than 1/3 of the volume sold outside the brand’s home market. Riga Black Balsam® continued to increase its business in existing largest export markets, such as Russia, Ukraine, Travel Retail, as well as successfully expanding its footprint in new strategic markets: US, UK, Australia and Italy.
Key focus areas for the brand in 2018 were new product development and close cooperation with the Global Bartenders Community. In 2018 full re-branding of Riga Black Balsam® product lines was completed as well as the launch of Riga Black Balsam Cherry® and a limited edition dedicated to Latvia’s centenary.
Riga Black Balsam® was one of the World Bartenders’ Association key supporters and official sponsor of World Cocktail Championship. “
Māris Kalniņš, Global Brand Director
Performance
– 164k 9lcs sold
– Strong 11% growth y-t-y
– Over EUR 10 million generated from brand sales
– Presented in four different flavours (original, black currant, cherry, rum)
– Sold to 23 markets worldwide
Riga Black Balsam®
AMBER BEVERAGE GROUP | ANNUAL REPORT 2018 > CONTENTS > CONSOLIDATED MANAGEMENT REPORT > CONSOLIDATED FINANCIAL STATEMENTS> CHAIRMAN’S STATEMENT > CHIEF FINANCIAL OFFICER’S STATEMENT > INDEPENDENT AUDITOR’S REPORTPAGE 28 PAGE 29

Moskovskaya®
Moskovskaya® Vodka is one of the oldest traditional vodkas with a recipe dating back to the end of the 19th century. The Russian Empire Spirits Monopoly originally licensed two producers of this brand—one in Moscow and one in Riga. We currently produce and market this vodka to over 68 markets worldwide, expanding distribution in US and LATAM markets in recent years.
Capitalising on Moskovskaya® Vodka brand heritage and loyalty to the brand’s core value of simplicity, we are building the brand on a single global positioning platform, attracting new consumers and up-trading loyal ones by introducing Premium Line and Limited Editions.
One of the oldest Russian vodka brands Created for the Russian Empire’s vodka monopoly in 1894
Authentic Russian production process Traditional Russian column filtration at the historical premises
Over 100 years of vodka traditions The current production facility was established in 1900
Smooth taste with character Made according to the Osobaya or ‘the special’ recipe
Highly acclaimed quality Recognized by experts in numerous global competitions
AMBER BEVERAGE GROUP | ANNUAL REPORT 2018 > CONTENTS > CONSOLIDATED MANAGEMENT REPORT > CONSOLIDATED FINANCIAL STATEMENTS> CHAIRMAN’S STATEMENT > CHIEF FINANCIAL OFFICER’S STATEMENT > INDEPENDENT AUDITOR’S REPORTPAGE 30 PAGE 31

“Moskovskaya® Vodka is the main asset of the whole Amber Beverage Group. 2018 was a year for fixing the basics and preparing for the brand’s global relaunch. We unified the recipes, created and market tested the new packaging which is about to be launched at the end of May 2019. The global price strategy was revised to ensure the brand’s sustainability.
With the launch of a limited edition, we introduced new brand symbols which are part of the new brand look. In addition, we developed unique products – Moskovskaya® Infusions which came on the market in March 2019.”
Renatas Alekna, Global Brand Director
Performance
– 376k 9lcs sold in 2018
– Over EUR 8.6 million generated from brand sales
– Sold to 68 markets worldwide
Moskovskaya®
AMBER BEVERAGE GROUP | ANNUAL REPORT 2018 > CONTENTS > CONSOLIDATED MANAGEMENT REPORT > CONSOLIDATED FINANCIAL STATEMENTS> CHAIRMAN’S STATEMENT > CHIEF FINANCIAL OFFICER’S STATEMENT > INDEPENDENT AUDITOR’S REPORTPAGE 32 PAGE 33
Cosmopolitan Diva®
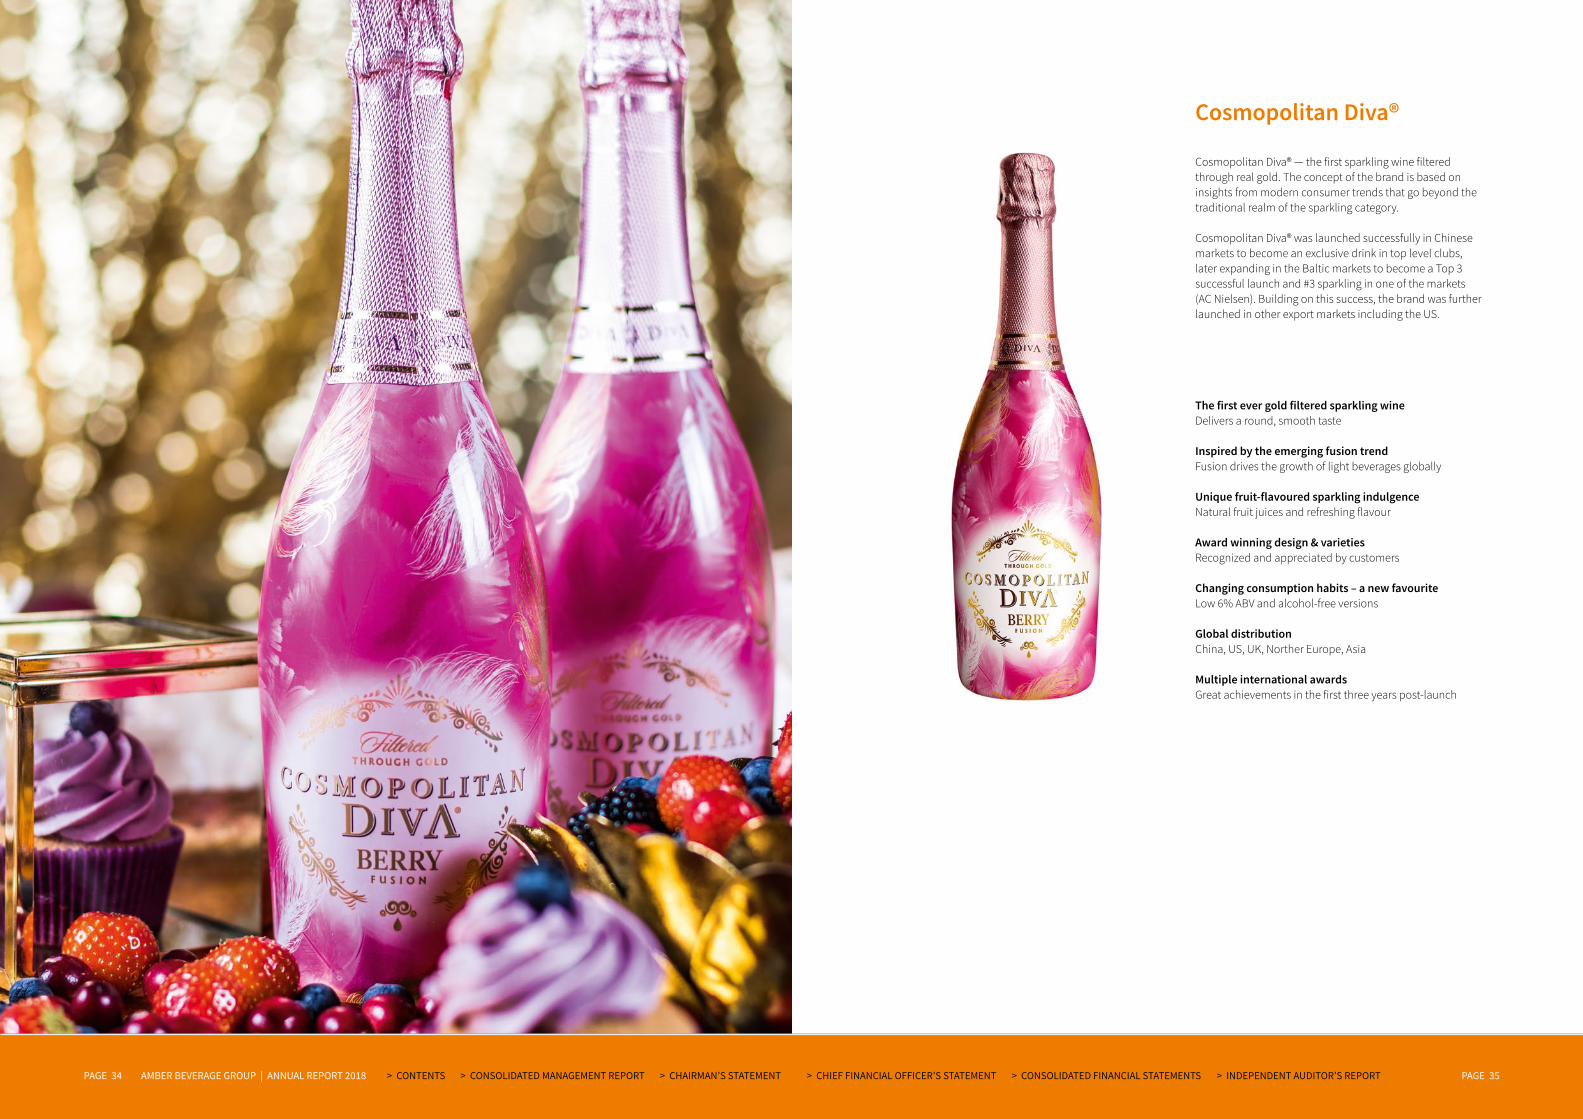
Cosmopolitan Diva® — the first sparkling wine filtered through real gold. The concept of the brand is based on insights from modern consumer trends that go beyond the traditional realm of the sparkling category.
Cosmopolitan Diva® was launched successfully in Chinese markets to become an exclusive drink in top level clubs, later expanding in the Baltic markets to become a Top 3 successful launch and #3 sparkling in one of the markets (AC Nielsen). Building on this success, the brand was further launched in other export markets including the US.
The first ever gold filtered sparkling wine Delivers a round, smooth taste
Inspired by the emerging fusion trend Fusion drives the growth of light beverages globally
Unique fruit-flavoured sparkling indulgence Natural fruit juices and refreshing flavour
Award winning design & varieties Recognized and appreciated by customers
Changing consumption habits – a new favourite Low 6% ABV and alcohol-free versions
Global distribution China, US, UK, Norther Europe, Asia
Multiple international awards Great achievements in the first three years post-launch
AMBER BEVERAGE GROUP | ANNUAL REPORT 2018 > CONTENTS > CONSOLIDATED MANAGEMENT REPORT > CONSOLIDATED FINANCIAL STATEMENTS> CHAIRMAN’S STATEMENT > CHIEF FINANCIAL OFFICER’S STATEMENT > INDEPENDENT AUDITOR’S REPORTPAGE 34 PAGE 35

“2018 was a great year for our Diva! We continued to expand our global distribution and introduced the brand in new markets like the UK, Nordics, Portugal and Poland. Meanwhile, we also achieved noticeable growth in some of the existing markets like the US, Philippines, Panama, which all contributed to overall volume growth. As a truly feminine brand should, Cosmopolitan Diva® is taking care of its looks, so towards the end of the year we introduced upgraded and more premium-looking packaging while maintaining the core design elements that we know our consumers love and appreciate. No doubt that 2019 will bring even more exciting news!”
Evija Sparāne, Global Brand Director
Performance
– Volume sold in 2018 exceeds 95k 9lcs
– Stable 6% growth y-t-y
– 58% growth (y-t-y) for non-alco version
– Present in 18 markets
Cosmopolitan Diva®
AMBER BEVERAGE GROUP | ANNUAL REPORT 2018 > CONTENTS > CONSOLIDATED MANAGEMENT REPORT > CONSOLIDATED FINANCIAL STATEMENTS> CHAIRMAN’S STATEMENT > CHIEF FINANCIAL OFFICER’S STATEMENT > INDEPENDENT AUDITOR’S REPORTPAGE 36 PAGE 37

Rooster Rojo®
Rooster Rojo® tequila was developed and launched globally in 2017. It is produced at our local factory in Tequila, Mexico.
Rooster Rojo® is an extra smooth tequila, produced using only the best ingredients and production techniques which result in preserving the superb natural flavours of its top quality agave. Born in the agave fields of Jalisco, Mexico, it is carefully crafted by using only 100% Agave juices, to ensure exceptional taste and quality that would please even the greatest tequila connoisseur.
Superb 100% agave tequila Received accolades at the Tequila Masters Awards in 2018
Straight from the UNESCO-protected tequila producing region Made in the hart of the Tequila region, Mexico – at the foot of Tequila Hill
Exceptional packaging A tall craft bottle with vintage cork stopper
Strong, memorable brand name The Rooster is the unofficial symbol of Mexico
Unique brand experience For discerning consumers who recognize the difference
Brand positioning = vivid revelation Discovery, escape, transformation, independence
Kosher certified Impressive expansion opportunities in fast-growing global kosher market
Immediate international success First international awards immediately after launch
AMBER BEVERAGE GROUP | ANNUAL REPORT 2018 > CONTENTS > CONSOLIDATED MANAGEMENT REPORT > CONSOLIDATED FINANCIAL STATEMENTS> CHAIRMAN’S STATEMENT > CHIEF FINANCIAL OFFICER’S STATEMENT > INDEPENDENT AUDITOR’S REPORTPAGE 38 PAGE 39

“In 2018, the Rooster Rojo® tequila brand had global distribution expansion not only in Europe, the UK, the Baltics, Greece and Italy, where the brand was first introduced, but also in important markets such as Canada and Australia. The newly launched brand received international recognition five times in a row by winning medals at each of the beverage industry competitions where it was presented. And finally, the J2-Racing team sponsored by Rooster Rojo® tequila successfully finished the season in 2nd place in its class at the VLN championship at the famous Nürburgring track, which gathered an absolute record of more than 400 000 spectators during the highlight of the ADAC 24 hours endurance race.”
Mantas Zlatkus, Global Brand Director
Performance
– Volume of 6.5k 9lcs exceeds last year by 3.6x
– over EUR 0.5 million sales generated from sale of brand
– Sold in 17 markets worldwide
– Presented in Blanco, Repasado, Anejo version
Rooster Rojo®
AMBER BEVERAGE GROUP | ANNUAL REPORT 2018 > CONTENTS > CONSOLIDATED MANAGEMENT REPORT > CONSOLIDATED FINANCIAL STATEMENTS> CHAIRMAN’S STATEMENT > CHIEF FINANCIAL OFFICER’S STATEMENT > INDEPENDENT AUDITOR’S REPORTPAGE 40 PAGE 41

Cross Keys Gin®
1000 miles north of Berlin, between the blooming marshes of Lithuania and stony Estonian islands, lays the crown jewel of Eastern Baltic coast – Rīga, the capital of Latvia. This city has always bred all kinds of rebels: it was the cradle of the Reformation, hub of revolutionaries and homestead of anarchists. Its history has inspired unique and rebellious drinks as well.
The first was the famous Herbal Bitter Riga Black Balsam® – an alchemic experiment of 1752 with its still secret recipe, and the latest is Cross Keys Gin®. Created by the same master distiller who blends Balsam today, the gin takes its name from crossed keys – an ancient symbol of urban hospitality and part of Riga’s heraldry.
Cross Keys® is characterized by rich sweetness of wild flowers and trees blooming in short Northern summers. It is joined by the sappy explosion of birch buds and a refreshing hint of mint on the one hand, and anchored by classical spices like black pepper and cloves on the other.
Baltic summer flavour Classical gin flavour tenderly enriched by chamomile, linden blossoms and botanicals of the legendary herbal bitter Riga Black Balsam®
Pure gift of nature All-natural and pure herbal ingredients carefully gathered to preserve their unique qualities
Authentic crafting process The original recipe requires great care, therefore the gin is handcrafted in small batches
Original clay bottle The traditional Riga Black Balsam ® clay bottle complements the ageing process of gin
Finest art of distillery Craftsmanship perfected since 1900 and enlightened by centuries of tradition
AMBER BEVERAGE GROUP | ANNUAL REPORT 2018 > CONTENTS > CONSOLIDATED MANAGEMENT REPORT > CONSOLIDATED FINANCIAL STATEMENTS> CHAIRMAN’S STATEMENT > CHIEF FINANCIAL OFFICER’S STATEMENT > INDEPENDENT AUDITOR’S REPORTPAGE 42 PAGE 43

“2018 witnessed the launch of the Latvian-distilled premium gin: Cross Keys Gin®. The brand was launched in August and by the end of the year it was listed in eight markets. Its largest markets are Latvia, UK, Italy, and Australia. The brand has already received its first international awards for packaging and liquid.
Gin is one of the few strong spirits categories that has seen a positive dynamic in recent years, with the premium gin segment growing between 7-9%. Our decision to start in this category with a high quality product is strategically thought-out. We have put the best we can offer into this product. Furthermore, we include tried and tested values in this beverage – the herbal combination from the legendary Riga Black Balsam®.”
Māris Kalniņš, Global Brand director
Performance
– Launched in 2018
– Present in eight markets
– Premium class gin unlocking the Baltic taste
Cross Keys Gin®
AMBER BEVERAGE GROUP | ANNUAL REPORT 2018 > CONTENTS > CONSOLIDATED MANAGEMENT REPORT > CONSOLIDATED FINANCIAL STATEMENTS> CHAIRMAN’S STATEMENT > CHIEF FINANCIAL OFFICER’S STATEMENT > INDEPENDENT AUDITOR’S REPORTPAGE 44 PAGE 45

REGIONAL PERFORMANCE
AMBER BEVERAGE GROUP | ANNUAL REPORT 2018 > CONTENTS > CONSOLIDATED MANAGEMENT REPORT > CONSOLIDATED FINANCIAL STATEMENTS> CHAIRMAN’S STATEMENT > CHIEF FINANCIAL OFFICER’S STATEMENT > INDEPENDENT AUDITOR’S REPORTPAGE 46 PAGE 47

Continuous investments in production facilities allow to improve efficiency and financial results
AS Latvijas balzams (LB) is the largest and one of the oldest alcoholic beverage producers in the Baltics. Our production and bottling traditions began in 1900, when the first state alcohol monopoly warehouse was established in Latvia.
Currently, Latvijas balzams operates two alcoholic beverage production facilities in Riga – a production plant for strong alcoholic beverages and a production plant for sparkling wines and light alcoholic beverages. We use ingredients from all around the world and have retained our traditional beverage production technologies. The recipes for some of our signature products date back hundreds of years, for example the formula for Riga Black Balsam® was officially written down in 1752, but our own Moskovskaya® Vodka dates back to the end of the 19th century. Our mission is to deliver excellence in whatever we do.
LB is a leading producer of alcoholic beverages in the Baltic States - we are the market leader in all segments of spirits and sparkling wines, cider and cocktails. Currently, LB produces more than 100 different brands of beverages. Our products are sold in more than 170 export markets through SPI Group, as well as in more than 42 markets by direct export of Latvijas balzams.
A small but significant part of LB’s business is logistics services - this competence has developed especially during the last two years. Mostly, services are provided to affiliated companies, but more and more services are provided to 3rd parties, such as transit services, customs warehouse services, value-added services and bundling, etc. Therefore, available resources can be used more efficiently.
In 2018, Latvijas balzams continued to invest in the development of its production, with a particular focus on increasing efficiency and leaning process in order to maintain competitive cost base for all produced products. Overall, in 2018, Latvijas balzams invested over EUR 3 million in acquiring both fixed and intangible assets. The main investments are:
• Installation of automatic packing and labeling equipment on three high-speed lines;
• A stock management module for improving procurement planning;
• Modernization of a specialized undersized volume line;• Changes in electricity connection input; • Introduction of new bottle shapes in production for one of
our leading brands Riga Sparkling wine, and many others.
In 2018, the production of several new products started, and packaging renewal projects were executed for the following products: Apple Garden winter cider, Lucky Dog black currant, raspberry and lime cider, and others. Among completely new beverages, one must definitely make note of the higher-price segment Cross Keys Gin®, a gin distilled in-house, as well as the Riga Black Balsam® limited series in honour of Latvia’s centenary.
Latvijas Balzams has developed its presence in the production of private label products. As an affirmation of high production quality standards, Latvijas Balzams has been granted an opportunity to produce one of Russia’s largest vodka brands Five Lakes (Пять Озер). Latvijas balzams manages the bottling of this product for the client’s foreign customers.
Performance
€ 75m Standalone net revenue, excluding excise
€ 3m Annual investment in production facilities
> 33% 3rd party private label volume production growth
Latvia
PRODUCTION
AMBER BEVERAGE GROUP | ANNUAL REPORT 2018 > CONTENTS > CONSOLIDATED MANAGEMENT REPORT > CONSOLIDATED FINANCIAL STATEMENTS> CHAIRMAN’S STATEMENT > CHIEF FINANCIAL OFFICER’S STATEMENT > INDEPENDENT AUDITOR’S REPORTPAGE 48 PAGE 49

Our efficient production facility allows to meet customers’ needs in small and mid-sized batches
Remedia AS (Remedia) was the first private equity company to attain the right to produce alcoholic beverages after Estonia regained its independence in 1991. Having initially received a license to produce low alcohol drinks only, in 1990 the company brought the egg liqueur Kiiu Tom to the market, which was made of natural egg yolks. The original recipe was developed in cooperation with Tallinn University of Technology.
In February 2018 ABG acquired a 100% equity stake in Remedia.
During 2018 Remedia was reorganized and switched operations from a production-distribution company to concentrate on production. From May onwards, all sales of the Remedia portfolio on the Estonian market were organized by Amber Distribution Estonia OU (ADE). In 2018 Remedia production output reached 484 000 litres.
As of 1st of August, the Group’s corporate finance resource management system Axapta was introduced in Remedia to improve the accountability and transparency of Remedia
financial results. Introduction of new EPR will facilitate more precise analysis of the profitability of Remedia’s existing products, as well as provide a more accurate basis for price calculations, because the production facility owned by Remedia is totally suitable for tailor made products.
Since acquisition ABG has supported investments in a new labelling station to improve production cycle and provide automatic excise duty stamp labelling for all Remedia products. This investment has made it possible to increase production output to 4 000 units per hour. We also have re-routed the third-party product import by Amber Distribution Estonia through the warehouse in Kiiu, thus bringing synergies to logistic costs in the Estonian market.
The superior quality of our products is highly appreciated by customers
Tambovskoye spirtovoye predpriyatye Talvis JSC (Talvis) is the largest producer of Lux and Alpha spirits in Russia and is listed in the 100 best ecological enterprises of the Russian Federation. Since 2003, Talvis has been part of the SPI Group and joined ABG in late 2017.
With a history dating back over a century, Talvis has mastered the production process of rectified ethyl alcohol in combination with modern technology that allows production capacity of 10 thousand dekaliters (DAL) per day.
Each year over 70 000 tons of grain are processed, providing the raw material – spirit – ffor producers of alcoholic beverages in Russia and abroad. Over 40% of production volume is sold in export markets.
Spirit produced by Talvis is the only source of spirit for production of Stolichnaya vodka that supports the Stoli marketing concept Originally from Russia. The remaining proportion of Talvis spirit is sold within Russia, partly to related company Permalko, remaining to 3rd parties. The quality of Talvis spirit is highly appreciated by the market, allowing the company to choose the most appropriate customer base.
Permalko JSC (Permalko) is one of the oldest producers of spirits in Ural, Russia. The company is ranked among the Top 20 vodka and spirits producers in Russia. Permalko has been part of ABG since 2018 when the ownership was taken over from the SPI Group which acquired a majority stake in 2006.
Permalko has over 120 years history and more than 20 brands/products in its portfolio. The geography of deliveries is extensive and includes not only the Perm region but also many other regions of Russia. Over 10% of volume is sold in export markets.
The main brands of the company that were highly valued by consumers and awarded at professional contests are GRADUS® vodka and Russian Reserve® vodka, which received Gold and Silver Outstanding at International Wine & Spirit Competition (IWSC) in London.
Since inclusion of Permalko in ABG Group, Russian Reserve has been added to the brand portfolio of all ABG distribution entities.
In 2018, a total volume of 1.62 million 9lcs was produced (Nov-Dec 0.33m 9lcs), utilization of production capacity is 44% (Nov-Dec 54%) – there are many opportunities to develop the company.
Sales volume of low-price segment vodka Permskaya reached 603k 9lcs with net revenue EUR 6 million. The sales volume of Gradus® vodka from middle-price segment is 169k 9lcs with net revenue EUR 2 million. In 2018 Permalko also has produced 146k 9lcs of private label products with revenue of EUR 2 million. The major focus by ABG for 2019 will be repositioning of Permalko sales operations to value brands.
Permalko is one of the first producers in the industry to meet the new state requirements on system for accounting of each federal special mark for alcohol products. To comply with the federal requirements, Permalko has made investments over EUR 300 000.
EstoniaRussia
Performance
900 Pallet places in warehouse
4 000 Output capacity of labeling machine, units per hour
1m Production capacity in liters
Performance
2.9m DAL of spirit production in 2018 by Talvis
92.5% Utilised capacity in 2018 in Talvis
169k 9lcs of Gradus sold in 2018
AMBER BEVERAGE GROUP | ANNUAL REPORT 2018 > CONTENTS > CONSOLIDATED MANAGEMENT REPORT > CONSOLIDATED FINANCIAL STATEMENTS> CHAIRMAN’S STATEMENT > CHIEF FINANCIAL OFFICER’S STATEMENT > INDEPENDENT AUDITOR’S REPORTPAGE 50 PAGE 51

Our tequila production facilities are rated in the Top 10 of quality tequila producers, winning industry awards annually
Fabrica de Tequilas Finos S.A. de C.V. (FTF) was established in 1999 and started production in 2000. The company is based in the heart of Tequila, Jalisco, surrounded with agave landscape that has been declared the heritage of the humanity by UNESCO.
In 2001 FTF started producing Tenoch Tequila followed by Stallion, Tonala, Don Camilo, Zapopan, Santos and other brands. All the brands have been marketed with great success in the United States.
In 2016, we launched Rooster Rojo® tequila that has become of the of the ABG core brands with immediate international recognition and over 10 000 followers on social media platforms. In close collaboration with the SPI Group, FTF is producing the premium quality tequila Cenote, as well as serving other private label customers.
Our recent investments in new labelling equipment have increased production efficiency, which in combination with newly installed solar panels (with the financial support of the Mexican government) has made it possible to reduce overheads in the tequila production process.
FTF has a certified quality management system (NSF) and its products have been Kosher and Organic certified.
Mexico
Performance
€ 10.5m Standalone net revenue
123k Private label volume, 9lcs
5 000 Bottles per hour – capacity of new labelling equipment
AMBER BEVERAGE GROUP | ANNUAL REPORT 2018 > CONTENTS > CONSOLIDATED MANAGEMENT REPORT > CONSOLIDATED FINANCIAL STATEMENTS> CHAIRMAN’S STATEMENT > CHIEF FINANCIAL OFFICER’S STATEMENT > INDEPENDENT AUDITOR’S REPORTPAGE 52 PAGE 53

A strong focus on light category products in 2018 resulted in revitalisation of ABG brands and improved volumes and profitability
Latvian distribution segment comprises Amber Distribution Latvia SIA (ADL) - the No. 1 distribution company in Latvia in terms of volume and revenue, and Interbaltija AG AS (IB) – the premium wine and spirits distributor whose main focus is on the HoReCa (hotels-restaurants-cafes) segment.
In 2018 our total volume market share reached 30% (ADL 29%, IB 1%), including 23% volume share of the vodka category, 44% of the RTD (ready-to-drink) category, 58% of the sparkling wine category, 56% of the brandy category, 80% in bitters and 40% in liqueurs (source: IWSR).
We serve more than 4 500 customers around Latvia including off-trade and on-trade supply.
The ADL portfolio comprises over 250 international and local
beverage brands, and our selection of fine wines includes more than 400 labels from 45 winemakers around the world. IB is distributing over 450 brands of which over 50% are imported still wine brands. 2018 was affected by an increase in excise tax in Latvia by 15.2% on strong alcohol, 17.9% on wine and light alcohol, that resulted in an increase in product shelf prices. Despite that the total market volume grew by 2.0%, and our combined market share grew by 6.1% (source: IWSR). Market stability has driven higher demand for promotional support from our customers and has increased competition among spirits distributors with the aim to grow volumes in the key sales accounts. Considering the overall market situation, we concentrated our efforts to work out the most efficient promotional spending strategy and achieved an increase in total Brand Contribution (i.e., gross margin less net advertising and promotional expense) by 14% compared to 2017.
Core brands
Riga Black Balsam® (volume in line with 2017, value +7.8% vs 2017). In 2018, we launched Riga Black Balsam® special centenary edition for Latvia 100. We continued to develop brand by general and specific marketing activities in different channels as well as participated in Positivus2018 festival achieving great visibility.
Moskovskaya® (volume +9.2%, value +16.7% vs. 2017) growth achieved greatly by focus on off-trade promotional activities.
Jim Beam (volume +14.9%, value +19.7% vs 2017). Rapid development has maintained Jim Beam position as No.1 whiskey brand in Latvia. It was achieved with frequent specific
promotional activities with focus on the off-trade segment (price promotions, additional placement, branded displays). Performance in relation to key off-trade clients with aggressive price offers was influenced by competitors’ behaviour.
Bosca (volume +3.7%, value +7.7% vs. 2017). After becoming the No.1 sparkling wine in Latvia in 2016, Bosca has continued its growth with promotional activities across various channels.
Performance
€ 77.1 m Standalone net revenue
30% Volume market share (source: IWSR)
>600 Brands served
Latvia
DISTRIBUTION
AMBER BEVERAGE GROUP | ANNUAL REPORT 2018 > CONTENTS > CONSOLIDATED MANAGEMENT REPORT > CONSOLIDATED FINANCIAL STATEMENTS> CHAIRMAN’S STATEMENT > CHIEF FINANCIAL OFFICER’S STATEMENT > INDEPENDENT AUDITOR’S REPORTPAGE 54 PAGE 55

New product development
We expanded our ABG product portfolio with the launch of Cross Keys Gin® and received a lot of positive feedback from the market.
In 2018, a strong focus was place on light categories of ABG brands. In the RTD category new flavours were introduced (e.g. grapefruit, crab-apple and rowanberry flavours for LB
Cocktails). In 2018 we started the first stage of the Lucky Dog® cider rebranding process and a new Berry & Lime flavour was developed, in addition to which we introduced the Apple Garden Winter edition.
In 2018 we continued to expand the soft drinks category by adding the Thomas Henry brand to our portfolio.
Recognition of our distribution capability
In 2018, we engaged with Treasury Wine Estate (one of the leading still wine producers) and Alcohol Siberia Group that
resulted in strengthening our brand portfolio in still wine and vodka categories.
Efficiency achieved
During 2018 we continued to focus and train our sales team to switch from volume orientation to profitability orientation. We reviewed our portfolio to ensure that we have profitable products that meet consumer needs at all price points.
We introduced an online ordering system for our clients, with the ability to review products and to submit orders 24/7.
Retail
Latvijas balzams stores in Latvia are operated by Bravo, serving 2.7 million customers in 2018 in a network of 48 stores at the end of the year. The stores offer a wide range of alcoholic beverages, representing our own brands as well as a quality
selection of imported beverages. LB stores have the highest total awareness (79%) among specialised alcohol stores in LV market (source: Nielsen).
The ability to restructure internally has enable us to hit the new sales records in stagnating market conditions
Bennet Distributors UAB (BD) is the No1. alcohol importer in Lithuania serving over 7500 customers in its key accounts, HoReCa segment, and in traditional trade channels. BD has a well-developed distribution network throughout Lithuania with sales more than 50 million bottles annually. BD runs a fleet of 30 trucks and vans and has 14 000 m2 in warehouse area.
The largest beverage categories for Lithuania, where BD holds the leading position by value are whisky by 31.6%, brandy by 36.3% and wine by 20.6% share of market (src: IWSR).
BD provides unique local expertise and market knowledge that highly appreciated by and important for brand owners to create, develop and implement a marketing strategy in the Lithuanian beverage market. BD portfolio comprises more than 210 international brands and more than 21 brands owned by ABG.
Financial performance for 2018 has been significantly impacted by government activities imposed from 1st of January in respect to public advertising ban for alcoholic beverages, shortened trading hours in retail chains, increased legal drinking age. These activities has resulted in decline of the total alcohol market (excl. beer) by 5.2% (source: IWSR). Despite this and because of BD’s ability to restructure the sales and marketing activities in the local market, the total BD volume sold has increased by 12.3% vs 2017.
In addition, following the strategic decisions made in 2017 and 2018, BD has worked hard to develop the tobacco brand portfolio that has resulted in almost triple the net profit from tobacco segment compared to 2017 (EUR 557 thousand in 2018 vs EUR 192 thousand in 2017).
Core brands
Despite the declining size of the alcohol market, the business continues to succeed with many of the core brands and new product launches that deliver strong results in the medium to long term.
Moskovskaya®: (volume + 6.2%, value + 9% compared to 2017). A good result in the declining vodka category led mainly by the growth off-trade generated by competitive pricing.
Grand Cavalier® brandy: (volume -2% compared to 2017, value in line with 2017). Sales volume has declined much less than the total brandy category (-14%) and we have been able
to grow our market share by +0.5%. The focus was on off-trade activities and a fair pricing strategy.
Torres brandy: (volume +1%, value + 3% compared to 2017). Increasing market share of the brand and keeping No. 1 premium brandy position in declining brandy category has been a great success story for the sales and marketing team.
Finlandia Vodka: (volume +24%, value +20% compared to 2017). Due to a fair pricing strategy & focus on off-trade activities.
Performance
€ 50.9m Standalone net revenue
36.3% Brandy category market share in 2018 (source: IWSR)
>50m Bottles sold annually
Lithuania
AMBER BEVERAGE GROUP | ANNUAL REPORT 2018 > CONTENTS > CONSOLIDATED MANAGEMENT REPORT > CONSOLIDATED FINANCIAL STATEMENTS> CHAIRMAN’S STATEMENT > CHIEF FINANCIAL OFFICER’S STATEMENT > INDEPENDENT AUDITOR’S REPORTPAGE 56 PAGE 57

Jack Daniels: (volume +10%, value +7% compared to 2017). Due to fair pricing strategy, promotions supported with trade activities (secondary placement, price tags, etc.) & image building activities in on-trade.
New product development
BD has continued to launch new products in the Lithuanian market with a number of successful projects that are expected to provide further value share growth in 2019. Key launches were Russkij Rezerv®, Yamskaya and Five Lakes vodkas, launch of Cenote tequila and non-alcoholic version of Cosmopolitan Diva®.
Efficiency achieved
We constantly review our product portfolio to ensure that we have profitable products that meet consumer needs at all price points.
Strategic decisions on brand and customer portfolios has resulted in 32.4% growth in gross revenues in 2018
Amber Distribution Estonia OU (ADE) is a mid-sized, competitive and dynamically developing player in the Estonian beverage market providing customers with a wide range of international spirits and wine brands.
ADE serves more than 1 600 outlets across Estonia with a portfolio of more than 220 brands. This year, as a result of the ABG expansion, we took over the sales activities and brands of the local spirits producer Remedia OU. This has resulted in additional 19,9 thousand 9lcs sold, an increase of our market presence and overall market share in Estonia.
2018 was affected by an increase in excise tax, imposed by the government on 1st of February. The tax increase resulted in
overall product shelf-prices increase in retail from one side and total market decline by 8,1%. However, our major category of strong spirits faced decline by 7,7% in volume (src: IWSR).
Despite the overall market decline, ADE managed to grow – domestic alcohol volume sales increased by 28,2% vs 2017 and our volume market share increased to 4,5%. Growth was supported mostly by vodka category (+100%), liqueur category (+1744%), and brandy category (+176%) (src: IWSR).
Main challenge in 2018 was merging our existing brand portfolio with portfolio taken over from Remedia, that has had some minor negative impact on total profitability of the business, still has positive outlook for the upcoming periods.
Core brands
Moskovskaya®: (volume +2%, value +8% compared to 2017). Despite a market decline of 8% in the vodka category and strong competition in main-stream segment Moskovskaya® managed to strengthen its position and is still among leading brands in imported vodka category.
Riga Black Balsam® (volume -2%, value +2% compared to 2017). Despite a market decline of 11% in the bitters category, Riga Black Balsam® has strengthened its position. Increase driven by successful
launch of the Riga Black Balsam® Element flavour and expansion of listings in traditional trade chains.
Beam Suntory Whiskeys: (volume +2%, +2% in value vs 2017). Jim Beam has heavily invested in general promotional and marketing activities, keeping key focus on off-trade segment via (price-promotional activities, additional placement, branded displays).
Acquired brands
In 2018, we started distributing the well-known vodka brand Zeljonaya Marka which has been one of the main drivers for growth in vodka category.
Performance
€ 7.4m Standalone net revenue
28.2% Volume share increase in 2018 (source: IWSR)
>1 600 Outlets served in 2018
Estonia
AMBER BEVERAGE GROUP | ANNUAL REPORT 2018 > CONTENTS > CONSOLIDATED MANAGEMENT REPORT > CONSOLIDATED FINANCIAL STATEMENTS> CHAIRMAN’S STATEMENT > CHIEF FINANCIAL OFFICER’S STATEMENT > INDEPENDENT AUDITOR’S REPORTPAGE 58 PAGE 59

Further integration in ABG has helped to grow the business through distribution of new and well-known brands in the UK market
In 2018, Cellar Trends (CT) continued the process of deeper integration into ABG. This integration process included the launch of several ABG brands within the CT portfolio including Moskovskaya® and Rooster Rojo®. In addition to this, the distribution of the Stoli portfolio, including Stolichnaya and Elit, was transferred to the business. Adding the Stoli portfolio has taken the business to the next level, helping it to exceed the 550 thousands 9lcs benchmark.
These changes were made during a period of significant political and economic uncertainty in the UK, with Brexit dominating the headlines, and continued intense competition in the market combining to make for a challenging and contracting trading environment. This was particularly true at
Christmas where many sections of the trade struggled – spirits in the off trade fell by 1.6% in the period and this would have been more had it not been for the boom in the gin category, a category in which CT is yet to find traction.
Whilst the addition of the ABG brands adds stability to the portfolio, it remains the case that third party brands form a critical pillar of CT’s performance. Whilst Faustino represents nearly 39% of the 552 thousand 9lcs volume in the business, the wine sector is typified by lower margins. Within spirits, the Luxardo portfolio is a core element with 17% of overall volumes.
Core Brands
Stolichnaya: 2018 was a year of stabilisation for the brand with price increases required across the market. This, combined with a large amount of stock already in the market, meant that the year was challenging for volumes. By the end of the year the brand was in a better position, but heavily reliant on support funding with limited scope for consumer activation.
Faustino Rioja: Whilst remaining the second largest rioja brand in the UK, Faustino dropped off the highs of 2017, a record breaking year. In part this was a reflection of the overall Spanish wine market which fell 10%, but also due to changes in promotional strategy within the largest account ASDA where a new type approach pulled consumers to the category, but not to the brand – a fate shared by the leading competitive brand.
Luxardo: Sambuca continues to be a price sensitive market in decline with consumers switching away from the shot category. This, combined with a delist in a major trade on account, caused overall portfolio volumes to drop by 2.5% in the year.
Luc Belaire: Whilst not continuing the growth seen previously, Belaire remained a buoyant brand in the portfolio with volumes up 4%. This would have been higher apart from stock arriving from outside the UK in the key Christmas period. The brand continues to be driven by a strong social media presence and innovative use of POS.
Performance
€ 29m Standalone net revenue
>55 Brands served
475 000 Cases of Faustino brand sold in 2018
United Kingdom New brands
A star performer in the portfolio for the year was Bumbu rum which, along with Bayou, gained a listing within ASDA retail chains. This drove 100% growth on the brand.
Substantial progress has been made in re-establishing Elit in the prestige trade with volumes up by 13% on 2017.
Efficiencies
CT is continually looking at methods to improve efficiency in the operation. This includes giving the sales team a clear prioritisation structure for the brand portfolio, seeking and delivering increased automation in finance routines and aligning everyone behind a profit focus.
AMBER BEVERAGE GROUP | ANNUAL REPORT 2018 > CONTENTS > CONSOLIDATED MANAGEMENT REPORT > CONSOLIDATED FINANCIAL STATEMENTS> CHAIRMAN’S STATEMENT > CHIEF FINANCIAL OFFICER’S STATEMENT > INDEPENDENT AUDITOR’S REPORTPAGE 60 PAGE 61

By acquiring Think Spirits, the ABG is strengthening the global market presence
In 2018, ABG acquired a 90% stake in Think Spirits PRY LTD (TS), one of the biggest on-trade focused distributer of spirits in Australia. Brands are selectively sourced from international suppliers not affiliated with other Australian distributors or corporates. Products are distributed by leveraging the sales channels of large scale buyers such as Woolworths, Metcash (ALM) and Coles. The business has also established strong relationships with its end-users (i.e. bartenders).
2018 was characterised as a year of transition from being a family-owned company to becoming a part of a global group.
Even with the focus on the transaction and transformation of the company, the team managed to turn out an outstanding performance. 2018 full year sales volumes grew by 22%, gross revenue grew by 28% from AUD 17.7 million to AUD 22.7 million in 2018.
2018 in Australia was characterised by a slowdown in residential real estate markets and subdued consumer spending, while overall economic growth remained solid at 2.3%. Subdued consumer spending has resulted in downward pressure on retail and wholesale pricing and margins.
Core brands
Stolichnaya: In November 2018 TS took over distribution rights of the brand in Australia and in two months sold more than 4.8 thousand 9Lcs thus becoming the largest brand by revenue in the portfolio.
Seedlip: With healthy lifestyle in growth, this UK produced non-alcoholic spirit brand grew strongly turning out 3.4 thousand 9Lc / 1.3mAUD gross sales and annual growth of 700% vs previous year when it was introduced in the market.
Little Drippa – cocktail coffee is a non-alcoholic cold extracted coffee designed by bartenders for cocktails. Its exposure in on-trade channels is growing and in 2018 sales reached 7.5 thousand 9Lc / 1.1mAUD in gross sales and a growth by 56% vs prior year.
Crystal Head – vodka with an original head-shaped packaging and high-quality ingredients are its key success in the market. The brand sold 2.2 thousand 9Lc / 1.8mAUD in gross sales and grew by 376% vs previous year.
Chateu Tananda – a locally produced brandy with historic heritage, in 2018 sold 4.3 thousand 9Lc / 1.6mAUD in gross sales and grew by 20%.
Performance
€ 6 m Standalone net revenue
4 859 9lcs of Stolichnaya sold in the market since distribution takeover in November 2018
>700% Sales growth of Seedlip (non-alco spirit)
Australia New brands
During 2018, TS took on several new high value brands, including Gin Mare gin, Italicus liqueur, Shackleton whisky, Tamnavulin whisky and Carpano vermouth.
Other events
The company has improved efficiency of the finance function by introducing ABG group reporting procedures. Additional highly experienced sales and marketing staff was brought on board to assist in the introduction of new brands.
AMBER BEVERAGE GROUP | ANNUAL REPORT 2018 > CONTENTS > CONSOLIDATED MANAGEMENT REPORT > CONSOLIDATED FINANCIAL STATEMENTS> CHAIRMAN’S STATEMENT > CHIEF FINANCIAL OFFICER’S STATEMENT > INDEPENDENT AUDITOR’S REPORTPAGE 62 PAGE 63

We are constantly innovating our products and sales channels to get closer to our customers and their needs wherever they are
The international sales segment covers sales of goods under brands owned by the Group outside the Baltic market. These sales include sale of products under brands owned by the Group produced in our facilities of Latvijas balzams (Latvia), Fabrica de Tequilas Finos (Mexico), Remedia (Estonia), as well as the sale of Moskovskaya® Vodka brand.
In 2018 export revenues excluding Moskovskaya® Vodka grew 34% vs. 2017, while volumes grew by 19%. We have successfully expanded list of priority brands, launching Cross Keys Gin® and actively selling Rooster Rojo® on top of a 22.6% growth in Riga Black Balsam® sales and a 34% increase in Cosmopolitan Diva® sales compared to 2017.
In 2018, we launched amberdrinks.eu - a website that is used by our customers worldwide for order placement and follow-up on outstanding balances, as well as for advertising and as a promotional expenditure reporting tool.
In the autumn of 2018, the single-point-of-contact concept - ABG Customer Service Centre - was introduced with the goal to serve the customers from one company, whenever Amber Beverage Group products are produced in order to optimize ordering, delivery, invoice and payment processes.
Moskovskaya® (volume -10%, value -19% compared to 2017) volume sales volumes reached 235 thousand 9lcs with the main decline coming from our core markets in Spain and Italy that underwent price repositioning to boost sales in the long term.
Riga Black Balsam® (volume +22.6%, value +23% compared to 2017) is described by significant growth in Russian market +32% compared to 2017 and expansion to three new geographies in 2018.
Cosmopolitan Diva® (volume +14.7%, value +58% compared to 2017) expanded to new customers and countries globally, adding four new markets in 2018.
Rooster Rojo® (volume + 371%) expanding to Austria, Canada, Greece, Italy, GTR Latvia, Malta, The Netherlands, United Kingdom.
New brands
The Group’s new Cross Keys® brand was successfully launched in four markets in 2018 with a positive market response and healthy outlooks for 2019 and upcoming periods.
Efficiency achieved
During 2018, foundations for future growth were established with investments in the international sales team. We added Managing Director EMEIA & GTR, Sales Area Director position in Latin America and in Asia Pacific. Moskovskaya® Vodka clearly helped us to establish more new contacts with new customers globally and we plan to capitalise on this strength and continue to add more product ranges to already existing contracts, as well as further expand our global footprint.
Performance
€ 3.9 m Net revenue
235k 9lcs of Moskovskaya® vodka sold worldwide (excluding Baltics)
23 Riga Black Balsam® markets
International Sales
AMBER BEVERAGE GROUP | ANNUAL REPORT 2018 > CONTENTS > CONSOLIDATED MANAGEMENT REPORT > CONSOLIDATED FINANCIAL STATEMENTS> CHAIRMAN’S STATEMENT > CHIEF FINANCIAL OFFICER’S STATEMENT > INDEPENDENT AUDITOR’S REPORTPAGE 64 PAGE 65

OUR TEAM
AMBER BEVERAGE GROUP | ANNUAL REPORT 2018 > CONTENTS > CONSOLIDATED MANAGEMENT REPORT > CONSOLIDATED FINANCIAL STATEMENTS> CHAIRMAN’S STATEMENT > CHIEF FINANCIAL OFFICER’S STATEMENT > INDEPENDENT AUDITOR’S REPORTPAGE 66 PAGE 67

Corporate Governance: ABG Supervisory Board
Jekaterina Stuģe Member
Todd Culyba Member
Florian Andreas Wopfner Member
Sergey Kovanda Member
Jeffrey Scott Hopmayer * Member
Seymour Paul Ferreira Member
Arturs Evarts Secretary
Mark Garber Non-Executive Chairman
* Until 1 March 2019
The main functions of the Supervisory Board are:
• To provide a corporate governance framework • To provide strategic direction for the Group’s development • To provide expertise and guidance in relation to the Group’s international operations • To supervise key areas of the Group’s operations, performance and compliance
Our team
Seymour Paul Ferreira, ABG Chief Executive Officer
Arturs Evarts, ABG Chief Legal Officer
Jekaterina Stuģe, ABG Finance and Operations
Līga Sleņģe, ABG HR
AMBER BEVERAGE GROUP | ANNUAL REPORT 2018 > CONTENTS > CONSOLIDATED MANAGEMENT REPORT > CONSOLIDATED FINANCIAL STATEMENTS> CHAIRMAN’S STATEMENT > CHIEF FINANCIAL OFFICER’S STATEMENT > INDEPENDENT AUDITOR’S REPORTPAGE 68 PAGE 69

Pepijn Janssens, ABG Marketing
Walter Kooijman, Managing Director, EMEIA and Global Travel and Retail
Charles Henagan, Managing Director, Americas
Patrick Borg, Managing Director, Asia-Pacific
Pāvels Fiļipovs, Managing Director, Latvia and Estonia
Marek Kuklis, Managing Director, Lithuania
AMBER BEVERAGE GROUP | ANNUAL REPORT 2018 > CONTENTS > CONSOLIDATED MANAGEMENT REPORT > CONSOLIDATED FINANCIAL STATEMENTS> CHAIRMAN’S STATEMENT > CHIEF FINANCIAL OFFICER’S STATEMENT > INDEPENDENT AUDITOR’S REPORTPAGE 70 PAGE 71

STRATEGY IN ACTION
AMBER BEVERAGE GROUP | ANNUAL REPORT 2018 > CONTENTS > CONSOLIDATED MANAGEMENT REPORT > CONSOLIDATED FINANCIAL STATEMENTS> CHAIRMAN’S STATEMENT > CHIEF FINANCIAL OFFICER’S STATEMENT > INDEPENDENT AUDITOR’S REPORTPAGE 72 PAGE 73

Strategy in action
The main pillars of ABG strategic activities are to:
Deliver
Strengthen
Achieve
Build
Generate
quality and value to our consumers, customers and suppliers
our market positions in all key sectors by building and or acquiring brands and companies
operational effectiveness and efficiency by applying rigor to everything we do
a truly effective international team with an ambitious, high performance culture
superior shareholder value through relentless focus on performance
What we do
Deliver Consumer experience
ABG puts the consumer at the heart of everything we do. At the core of our consumer focus is a drive to deliver epic brand experiences.
We have developed a deep understanding of the states of customer needs and our local teams continuously generate actionable insights in respect to consumer usage and attitudes, lifestyle preferences and consumption occasions in each of our focus markets.
We leverage these insights to ensure we deliver consumer and customer value propositions across a wide scope of profitable consumption occasions, either with our own brands, partner brands or private labels.
Deliver
Strengthen
Business intelligence
We build our consumer and market understanding by ensuring simple, focused and transparent business intelligence systems across the business and scaling insights rapidly, effectively and efficiently.
We undertake meaningful market research to understand emerging consumer trends both globally and in our individual local markets and seek to develop new brand concepts and products that match these trends ahead of our competitors.
Deliver
Achieve
Effective and efficient new product development
We execute a world-class NPD process to bring high quality, profitable products to the market within short lead times from concept to market.
Our NPD process is focused on delighting consumers with ongoing new category innovations, which also makes commercial sense for ABG and our trade partners.
74 AMBER BEVERAGE GROUP | ANNUAL REPORT 2018AMBER BEVERAGE GROUP | ANNUAL REPORT 2018 > CONTENTS > CONSOLIDATED MANAGEMENT REPORT > CONSOLIDATED FINANCIAL STATEMENTS> CHAIRMAN’S STATEMENT > CHIEF FINANCIAL OFFICER’S STATEMENT > INDEPENDENT AUDITOR’S REPORTPAGE 74 PAGE 75

What we do
Deliver
Achieve
Generate
Product portfolio analyses
We perform ongoing detailed reviews of our product portfolio, to ensure that we have attractive products that meet consumer needs at all price points and which perform according to external benchmarks and clear internal standards.
Deliver
Achieve
Generate
Brand portfolio management
We carefully review all opportunities to add further distribution partner brands to our local portfolios, to offer a complementary and profitable brand portfolio which covers all relevant product categories and price segments.
We engage with our trade partners to ensure that the ABG portfolio address their respective category objectives and act as a category management partner and value generator.
Deliver
Achieve
Generate
New Brands
We perform ongoing detailed reviews of market tendencies and we make innovations by developing and launching new brands. New brands and innovations are strategic priorities for ABG.
What we do
Strengthen
Achieve
Build
Generate
Mergers and Acquisitions (M&A)
ABG drive value by boldly acquiring foothold-businesses in key markets. 2018 was year of global expansion and growth, ABG performed acquisition of producer in Estonia – Remedia and acquisition of major control of Russian producer – Permalko, and performed acquisition of major stakes of UK distributor Cellar Trends and Australian distributor Think Spirits.
Deliver
Achieve
Generate
Brand building
We create brand experiences through new products and services and their further development and building. Our recent developed brands are Mosco Pink and Cross Keys Gin®
Deliver Value-added trade relationships
Through our own distribution businesses and working with independent distribution partners in global markets, ABG has developed unique capabilities and competitive advantages in relation to the critical aspects of route-to-market management.
We focus our engagement model with all customer tiers and channels, on delivering value propositions across all five key dimensions of customer value creation, prioritised by segment.
We employ sales teams that serve the differing needs of on-trade and off-trade customer segments.
We are proud of our heartland distribution coverage - 98% of weighted distribution across the Baltic region
AMBER BEVERAGE GROUP | ANNUAL REPORT 2018 > CONTENTS > CONSOLIDATED MANAGEMENT REPORT > CONSOLIDATED FINANCIAL STATEMENTS> CHAIRMAN’S STATEMENT > CHIEF FINANCIAL OFFICER’S STATEMENT > INDEPENDENT AUDITOR’S REPORTPAGE 76 PAGE 77

What we do
Deliver
Achieve
Generate
Quality improvement
We constantly aim to ensure that product quality is of the highest standard and seek to improve at every opportunity, whether this is new packaging or improved liquids.
Achieve Cost reduction
The Group strives to reduce production cost by means of the constant improvement of production processes. In 2018 Latvijas balzams continued the LEAN project that has showed immediate results in bottling area efficiency.
In addition, we work on the elimination of costs that are not adding value or reallocating resources to deliver optimum returns by centralisation of all Group Back up functions, as well as logistics and warehousing.
Achieve Targeted capital investment
In 2018 our focus for investments was to the production site Caka in order to automatize packaging and de-palletizing zone, improve bottling capacities at our production sites in Perm and Mexico, implement warehouse management system in our raw materials warehouses, and other investments to increase production efficiency and our competitiveness.
What we do
Deliver
Generate
Marketing effectiveness
2018 was a year of strategic investments in core brands, including development and launch of a new gin brand Cross Keys Gin®.
We build awareness of our brands by differentiated digital marketing, as well as developing innovative point of sale activation materials and continuously enhancing packaging.
We tactically build local capabilities to activate brand experiences in all channels during key shopper purchase and consumer consumption occasions.
Achieve
Generate
Group’s buying power
The Group reorganized purchasing department functions and responsibilities with a strong focus on acquiring raw materials under competitive terms – price, quality and stock levels. ABG has developed a procurement process in order to ensure the efficient use of resources and to minimize suppliers and financial risks that ABG could face. Procurement process is governed by respective procedure, which sets out key procurement principles, competences, processes, procurement committee and information exchange during the procurement process within ABG
Achieve
Generate
Capacity
The Group has over 10m dal (decalitre) of bottling capacity at its two bottling sites located in Latvia and facilities in Russia, Estonia and Mexico. At the moment, total capacity utilization of 40% gives us a strong platform for future growth without significant investments.
AMBER BEVERAGE GROUP | ANNUAL REPORT 2018 > CONTENTS > CONSOLIDATED MANAGEMENT REPORT > CONSOLIDATED FINANCIAL STATEMENTS> CHAIRMAN’S STATEMENT > CHIEF FINANCIAL OFFICER’S STATEMENT > INDEPENDENT AUDITOR’S REPORTPAGE 78 PAGE 79
What we do
Achieve Global functions
Our markets are supported by a global structure and shared service centre designed to drive efficiency, share best practice, impart knowledge and help to build capability at a local level, as well as set the standards for governance of controls, compliance and ethics.
Build Our people
We want all our employees to reach their full potential and play their part in the success of our business. To achieve this, we have created a diverse and inclusive culture, with shared values and a common purpose.
Generate Performance management
We continued development of the Business Intelligence (BI) tool that enables us to analyse the profitability of the Group online and within different dimensions.
In 2018 we started the Robotic Automatization Process (RPA) project, allowing us to shift the workload from technical performance of routine operations to problem-solving mode.
We also upgraded our customer and margin management tools to switch from volume to profitability as a key performance indicator.
What we do
Generate Working capital management
We monitor our investment in working capital and ensure that we have efficient and sufficient working capital to support the business and its growth.
Achieve
Generate
Systems
The Group continue to invest in its IT systems, to ensure that newly acquired subsidiaries can be fully integrated with easy to implement processes and procedures developed by ABG.
AMBER BEVERAGE GROUP | ANNUAL REPORT 2018 > CONTENTS > CONSOLIDATED MANAGEMENT REPORT > CONSOLIDATED FINANCIAL STATEMENTS> CHAIRMAN’S STATEMENT > CHIEF FINANCIAL OFFICER’S STATEMENT > INDEPENDENT AUDITOR’S REPORTPAGE 80 PAGE 81

Principal risks
ABG believes that the following risks are the principal ones that its business is exposed to. The steps taken by ABG to manage and mitigate these risks are listed below. If any of these risks occur in practice, ABG’s business, financial condition and performance might be affected and the value of its shares might decline. Some of these risks are beyond the control of the Group and this list is not comprehensive, as other risks and uncertainties may arise in a changing business environment.
RiskDescription and impact
How we manage and mitigate
Economic and political change
Deliver
Strengthen
The Group’s results are affected by economic conditions persisting in its key geographic markets and the level of consumer confidence and spending.
The Group mainly operates in the Baltic markets, where there is a risk of economic and regulatory uncertainty, as well as high influence from the Russian economy.
In addition, local laws and regulations are not always fully transparent, can be difficult to interpret and may be applied inconsistently.
Ongoing political tensions between Russia, EU member states and the US are creating instability throughout Eastern Europe.
Uncertainty regarding Brexit scenarios and timing drives consumer habits.
We monitor and analyse economic indicators and consumer consumption, which directly influences our product portfolio and new product development.
For the most part, countries in which we are operating are EU member States and, therefore, are subject to EU regulation. We monitor the economic conditions within the market, review our product portfolio and routes to the market and adjust our activities accordingly.
We are looking for ways to diversify our market presence and look for business and investment opportunities outside Europe.
Taxes
Deliver
Strengthen
Generate
Increases in taxes could adversely affect the demand for the Group’s products, which is extremely sensitive to fluctuations in excise duties, since they represent the largest component of the sales price of alcoholic beverages.
The Group may be exposed to tax liabilities resulting from tax audits. The Group has faced, is currently facing and may in the future face, audits and other reviews by tax authorities.
Changes in tax laws and their interpretation and increased enforcement actions and penalties may alter the environment in which the Group is operating. In addition, certain tax positions taken by the Group are based on industry practice and external tax advice or assumptions, involving a significant degree of judgment.
We constantly work on building trust through proactive and evidence-based engagement, deepening our relationship and reputation with governments, industry and other stakeholders.
We provide dedicated training and build the capabilities of our team through a curriculum focusing on indirect tax, trade and regulatory affairs, alcohol policy, campaigning and scenario planning.
82 AMBER BEVERAGE GROUP | ANNUAL REPORT 2018AMBER BEVERAGE GROUP | ANNUAL REPORT 2018 > CONTENTS > CONSOLIDATED MANAGEMENT REPORT > CONSOLIDATED FINANCIAL STATEMENTS> CHAIRMAN’S STATEMENT > CHIEF FINANCIAL OFFICER’S STATEMENT > INDEPENDENT AUDITOR’S REPORTPAGE 82 PAGE 83

RiskDescription and impact
How we manage and mitigate
Talent
Build
The Group’s success depends on the skills of key personnel and its ability to retain such personnel.
As a member of local professional associations, we are up to date on the latest employment trends within markets. The Group pursues a remuneration policy aiming to retain, motivate and attract key personnel. Every other year, we participate in Hay Group remuneration surveys to receive remuneration comparative data for each market separately. As a matter of routine, we review team performance and individual performance for which bonuses are awarded for the successful fulfillment of KPIs.
Every two years, we conduct a potential planning process which ensures that high performers (talents) are analysed, recognised and succession planning processes are in place.
We also conduct an employee engagement and satisfaction study – Amber Climate. The latest Climate study was conducted at the end of 2018 and it showed that the strongest advantages of ABG companies from an employee point of view are the approachable management, overall team spirit and the employer’s image. Compared to the previous study in the spring of 2017, respondents are more satisfied with their managers, teams and work environment – new offices and stores. The salary and bonus system was marked as good. Overall employee participation rate was 89% from all Group employees, which is a very high participation rate.
The Group invests in training for all levels of employees, in team spirit strengthening and in clever recruitment to ensure that the best talents are approached, and employee turnover is low as possible.
RiskDescription and impact
How we manage and mitigate
Consumer preferences
Deliver
Consumers move away from our brands to alternative products.
Suboptimal routes to consumers and customers.
A less efficient business model compared to key competitors.
We develop a highly diversified portfolio of brands to ensure coverage of consumer occasions and price points.
We systematically review emerging consumer and route-to-customer trends including potential disruptive technologies.
We continuously assess the existing business model looking for optimization opportunities, business efficiencies and value-added investments.
Marketplace and competition
Deliver
Achieve
Build
ABG is operating in a highly competitive environment and faces pressure from both local and international spirits producers, which may result in the downward revision of prices and loss of market share.
Changes in the Group’s distribution channels may also have an adverse effect on its profitability and business.
The Group’s revenue is mainly derived from a limited number of customers. The Group may not be able to maintain its relationships with these customers, or renegotiate agreements on favourable terms, or collect payments from some customers, which will affect its financial situation.
We continually evaluate our route-to-consumer and adapt our business model as appropriate. We cover directly traditional and small format stores and work closely with wholesaler partners. We trade across all channels and actively manage our profit mix. Also, key retailers bear notable risk. The share of key retailers like RIMI and Maxima delivers 28% of ABG businesses, while at the same time they are responsible for 50% of retail market in Baltics. Our broad distribution network enables us to limit the impact of key retailers on our current and future business.
AMBER BEVERAGE GROUP | ANNUAL REPORT 2018 > CONTENTS > CONSOLIDATED MANAGEMENT REPORT > CONSOLIDATED FINANCIAL STATEMENTS> CHAIRMAN’S STATEMENT > CHIEF FINANCIAL OFFICER’S STATEMENT > INDEPENDENT AUDITOR’S REPORTPAGE 84 PAGE 85
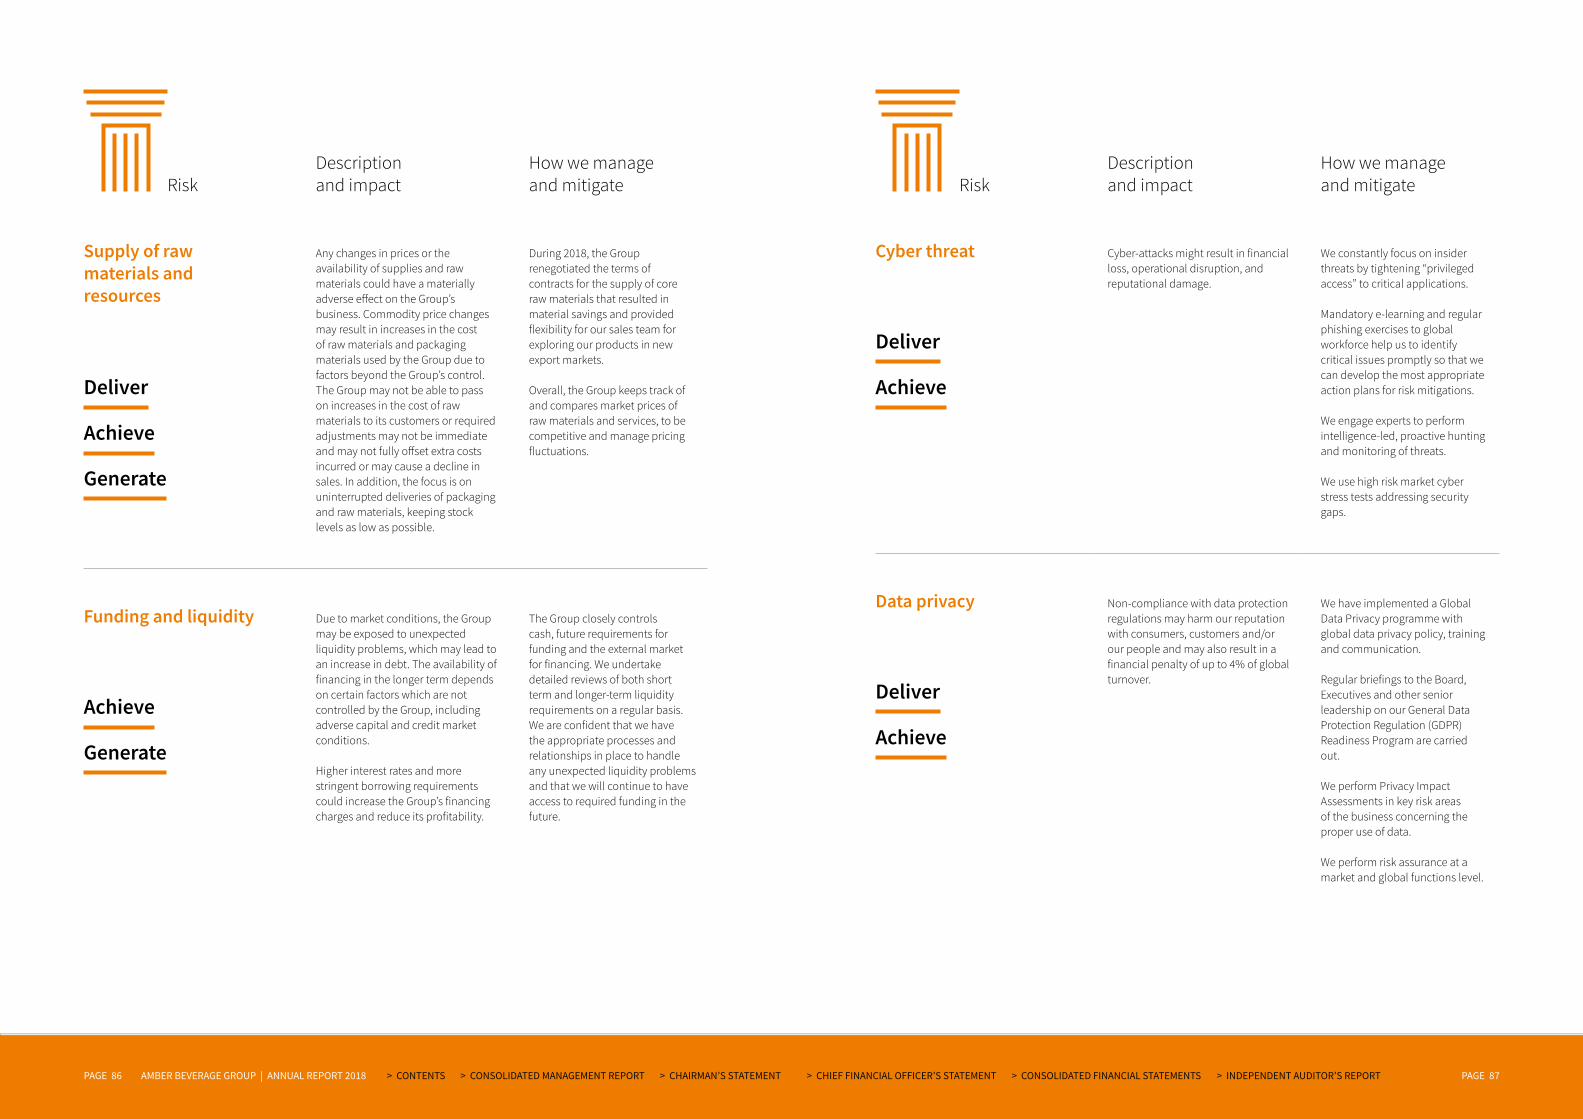
RiskDescription and impact
How we manage and mitigate
Supply of raw materials and resources
Deliver
Achieve
Generate
Any changes in prices or the availability of supplies and raw materials could have a materially adverse effect on the Group’s business. Commodity price changes may result in increases in the cost of raw materials and packaging materials used by the Group due to factors beyond the Group’s control. The Group may not be able to pass on increases in the cost of raw materials to its customers or required adjustments may not be immediate and may not fully offset extra costs incurred or may cause a decline in sales. In addition, the focus is on uninterrupted deliveries of packaging and raw materials, keeping stock levels as low as possible.
During 2018, the Group renegotiated the terms of contracts for the supply of core raw materials that resulted in material savings and provided flexibility for our sales team for exploring our products in new export markets.
Overall, the Group keeps track of and compares market prices of raw materials and services, to be competitive and manage pricing fluctuations.
Funding and liquidity
Achieve
Generate
Due to market conditions, the Group may be exposed to unexpected liquidity problems, which may lead to an increase in debt. The availability of financing in the longer term depends on certain factors which are not controlled by the Group, including adverse capital and credit market conditions.
Higher interest rates and more stringent borrowing requirements could increase the Group’s financing charges and reduce its profitability.
The Group closely controls cash, future requirements for funding and the external market for financing. We undertake detailed reviews of both short term and longer-term liquidity requirements on a regular basis. We are confident that we have the appropriate processes and relationships in place to handle any unexpected liquidity problems and that we will continue to have access to required funding in the future.
RiskDescription and impact
How we manage and mitigate
Cyber threat
Deliver
Achieve
Cyber-attacks might result in financial loss, operational disruption, and reputational damage.
We constantly focus on insider threats by tightening “privileged access” to critical applications.
Mandatory e-learning and regular phishing exercises to global workforce help us to identify critical issues promptly so that we can develop the most appropriate action plans for risk mitigations.
We engage experts to perform intelligence-led, proactive hunting and monitoring of threats.
We use high risk market cyber stress tests addressing security gaps.
Data privacy
Deliver
Achieve
Non-compliance with data protection regulations may harm our reputation with consumers, customers and/or our people and may also result in a financial penalty of up to 4% of global turnover.
We have implemented a Global Data Privacy programme with global data privacy policy, training and communication.
Regular briefings to the Board, Executives and other senior leadership on our General Data Protection Regulation (GDPR) Readiness Program are carried out.
We perform Privacy Impact Assessments in key risk areas of the business concerning the proper use of data.
We perform risk assurance at a market and global functions level.
AMBER BEVERAGE GROUP | ANNUAL REPORT 2018 > CONTENTS > CONSOLIDATED MANAGEMENT REPORT > CONSOLIDATED FINANCIAL STATEMENTS> CHAIRMAN’S STATEMENT > CHIEF FINANCIAL OFFICER’S STATEMENT > INDEPENDENT AUDITOR’S REPORTPAGE 86 PAGE 87

RiskDescription and impact
How we manage and mitigate
Brand Protection and IP
Deliver
Achieve
Generate
Look-alike products and brands, as well as counterfeit products are damaging brand equity and may heavy impact sales
We carefully evaluate the brands in the development phase in order to make sure that the brand would be trademarked and would therefore enjoy the protection granted under the respective regulatory regimes and protect business and intellectual property. We maximize the business’ competitive position monitoring the competitive environment, in order to promptly identify possible unfriendly actions and counterfeit cases.
Major litigations and fraud
Deliver
Achieve
Generate
Any major litigation could have a materially adverse effect on the Group’s business, resulting in financial losses or the leakage of information.
We implement a litigation avoidance strategy, i.e. ABG constantly adapts and improves its practices to avoid potential conflicts. This is achieved by continuously reviewing transaction documents, developing and upgrading contracts drafts to be used in business activities, as well as providing recommendations for business, operation aand compliance measures in order to meet legislative requirements and avoid claims. We developed and follow the respective policies and procedures in order to minimize the risk of fraud and the leakage of information. We train managers and other employees to make sure that they are promptly informed of requirements and are prepared to conduct or avoid specific actions, which could trigger the risk of claims. We respond to risky situations promptly, reviewing and preparing to mitigate them during the course of regular management meetings. We seek professional assistance in cases where it is required in order to protect the Group’s interests.
RiskDescription and impact
How we manage and mitigate
Product quality issues
Deliver
Achieve
Generate
Products quality deviation may lead to costumers’ disappointment and brand image deterioration.
We constantly aim to ensure that products quality is the highest quality is of the highest standard and seek to improve at every opportunity, whether this is new packaging or improved liquids. This is reached through continues investments in production upgrade bringing modern technologies in product quality evaluation.
Geopolitical and macroeconomic instability, sanction regime compliance
Deliver
Achieve
Strengthen
Risk of broad geopolitical turmoil and the resurgence of macroeconomic crisis.
Non-compliance with AML and sanctions could result major penalties from state authorities.
We continually evaluate the geopolitical and macroeconomic situation and perform the best efforts to minimize risk.
We developed and follow the respective policies and procedures in order to make ABG compliant with AML and sanctions requirements.
AMBER BEVERAGE GROUP | ANNUAL REPORT 2018 > CONTENTS > CONSOLIDATED MANAGEMENT REPORT > CONSOLIDATED FINANCIAL STATEMENTS> CHAIRMAN’S STATEMENT > CHIEF FINANCIAL OFFICER’S STATEMENT > INDEPENDENT AUDITOR’S REPORTPAGE 88 PAGE 89

SOCIAL RESPONSIBILITY
AMBER BEVERAGE GROUP | ANNUAL REPORT 2018 > CONTENTS > CONSOLIDATED MANAGEMENT REPORT > CONSOLIDATED FINANCIAL STATEMENTS> CHAIRMAN’S STATEMENT > CHIEF FINANCIAL OFFICER’S STATEMENT > INDEPENDENT AUDITOR’S REPORTPAGE 90 PAGE 91

Social Responsibility
Society
We work to ensure that our business activities have a positive impact on the well-being of our employees and on society in general
We take care of our employees by providing good working conditions, social guarantees, and benefits.
Environment
We continuously work to ensure a responsible approach to environmental issues
Each year we deliver over 1000 tons of materials for recycling.
Market
Amber Beverage Group responds to consumer needs and preferences
We follow the principles of ethical marketing communication and observe all current legislation regarding marketing communication and advertising in 175 markets.
Work Safety
We provide a stable and dynamic working environment with growth opportunities for our employees
We work with the ISO 9001:2015 certified manufacturing control system and maintain HACCP production principles.
Economy
We actively participate in the development of the local business environment
We are active members in national associations of:
• producers of alcoholic beverages in Latvia, Russia and Mexico
• Entrepreneurs, employers and investors in Latvia, Lithuania, the United Kingdom and Russia
• Retailers and distributors in Latvia and the United Kingdom
• and many others
AMBER BEVERAGE GROUP | ANNUAL REPORT 2018 > CONTENTS > CONSOLIDATED MANAGEMENT REPORT > CONSOLIDATED FINANCIAL STATEMENTS> CHAIRMAN’S STATEMENT > CHIEF FINANCIAL OFFICER’S STATEMENT > INDEPENDENT AUDITOR’S REPORTPAGE 92 PAGE 93

CONSOLIDATED FINANCIAL STATEMENTS
AMBER BEVERAGE GROUP | ANNUAL REPORT 2018 > CONTENTS > CONSOLIDATED MANAGEMENT REPORT > CONSOLIDATED FINANCIAL STATEMENTS> CHAIRMAN’S STATEMENT > CHIEF FINANCIAL OFFICER’S STATEMENT > INDEPENDENT AUDITOR’S REPORTPAGE 94 PAGE 95

Primary Statements Consolidated Statement of Comprehensive Income
Notes
2018EUR 000
2017EUR 000
Revenue 371 132 313 455
Excise and duties (128 508) (101 662)
Net revenue 5 242 624 211 793
Cost of goods sold 6.1 (169 497) (156 743)
Gross profit 73 127 55 050
Selling expenses 6.2 (37 291) (28 141)
General and administration expenses 6.3 (18 996) (15 271)
Net impairment losses of financial assets (366) (627)
Other operational income 6 971 5 366
Other operational expenses (1 023) (1 982)
Merger and acquisition related costs (428) (559)
Operating profit 21 994 13 836
Finance income 9 1 375 1 558
Finance costs 9 (7 898) (2 252)
Profit before tax 15 471 13 142
Corporate income tax 10 (834) 434
Profit for the period 14 637 13 576
Attributable to:
Equity holders of the parent 13 487 12 549
Non-controlling interest 1 150 1 027
14 637 13 576
Other comprehensive income(can not be subsequently reclassified to profit or loss) 1 660 (2 109)
Total comprehensive income for period 16 297 11 467
Attributable to:
Equity holders of the parent 15 147 10 440
Non-controlling interest 1 150 1 027
16 297 11 467
Seymour Paul Ferreira Chairman of the Board of Managers
These consolidated financial statements on pages 94 to 158 were approved by the Board of Managers on 4 June 2019 and signed on its behalf by:
ContentsPrimary Statements 97
Consolidated Statement of Comprehensive Income 97Consolidated Statement of Financial Position 98Consolidated Statement of Changes in Equity 100Consolidated Statement of Cash Flows 102
Notes to Consolidated Financial Statements 103
Accounting Information and Policies 1031. General Information 1032. Basis of Preparation 1043. Changes in IFRS Standards and Interpretations 1054. Critical Assumptions and Estimates 108
Results for the Year 1095. Segment Reporting 1096. Operating Profit 1136.1. Costs of Goods Sold 1146.2. Selling Expenses 1146.3. General and Administrative Expenses 1157. Auditor’s Remuneration 1158. Staff Costs 1169. Finance Income and Costs 11610. Corporate Income Tax 117
Operating Assets and Liabilities 11911. Business Combinations and Reorganization 11912. Intangible Assets 12413. Property, Plant and Equipment 12814. Investment Properties 13015. Working Capital 131
Risk Management and Capital Structure 13416. Risk Management 13417. Borrowings 14018. Finance Lease Liabilities 14319. Capital Management 14420. Share Capital and Share Premium 14521. Pooling Reserve 14522. Non-Controlling Interest 146
Other Financial Information 14723. Operating Lease Commitments 14724. Commitments and Contingencies 14725. Related Party Transactions 15126. Cash and Cash Equivalents 15327. Group Information 15428. Other Accounting Policies 15529. Reclassification of Comparatives 15830. Events After the Balance Sheet Date 158
AMBER BEVERAGE GROUP | ANNUAL REPORT 2018 > CONTENTS > CONSOLIDATED MANAGEMENT REPORT > CONSOLIDATED FINANCIAL STATEMENTS> CHAIRMAN’S STATEMENT > CHIEF FINANCIAL OFFICER’S STATEMENT > INDEPENDENT AUDITOR’S REPORTPAGE 96 PAGE 97

Consolidated Statement of Financial Position
Assets
Consolidated Statement of Financial Position
Equity and liabilities
Notes12/31/2018
EUR 00012/31/2017
EUR 00012/31/2016
EUR 000
Non-current assets
Intangible assets 12 56 160 51 065 39 449
Property, plant and equipment 13 51 650 51 784 34 729
Investment properties 14 1 912 664 684
Loans to related parties 25.2 23 458 27 728 39 403
Other non-current financial assets 2 943 2 970 829
Deferred tax asset 10.3 26 28 1 668
Total non-current assets 136 149 134 239 116 762
Current assets
Inventories 15.1 67 260 57 281 46 512
Trade and other receivables 15.2 111 527 84 240 62 010
Loans to related parties 25.2 1 027 53 2
Corporate income tax 1 329 431 786
Cash and cash equivalents 26 4 048 4 166 4 360
Total current assets 185 191 146 171 113 670
Total assets 321 340 280 410 230 432
Notes12/31/2018
EUR 00012/31/2017
EUR 00012/31/2016
EUR 000
Capital and reserves
Share capital 20 13 13 104 537
Share premium 20 132 553 132 553 -
Foreign exchange revalutation reserve 259 (707) (364)
Pooling reserve 21 (17 673) (21 783) -
Revaluation reserve of derivatives (176) (49) (114)
Retained earnings 23 897 11 678 10 214
Profit for the period 13 487 12 549 11 294
Total attributable to majority shareholders 152 360 134 254 125 567
Non-controling interest 6 295 4 575 9 617
Total equity 158 655 138 829 135 184
Liabilities
Non-current liabilities
Interest bearing loans and borrowings 17 22 841 25 709 17 155
Finance lease liabilities 18 2 032 913 793
Trade and other payables 15.4 50 - -
Deferred tax liability 10.3 64 - 3 689
Derivatives 175 49 134
Total non-current liabilities 25 162 26 671 21 771
Current liabilities
Interest bearing loans and borrowings 17 37 820 27 269 23 641
Finance lease liabilities 18 831 557 586
Trade and other payables 15.4 57 893 59 993 29 187
Taxes payable 15.3 40 979 27 091 20 113
Total current liabilities 137 523 114 910 73 527
Total libilities 162 685 141 581 95 298
Total equity and liabilities 321 340 280 410 230 482
Seymour Paul Ferreira Chairman of the Board of Managers
These consolidated financial statements on pages 94 to 158 were approved by the Board of Managers on 4 June 2019 and signed on its behalf by:
Seymour Paul Ferreira Chairman of the Board of Managers
These consolidated financial statements on pages 94 to 158 were approved by the Board of Managers on 4 June 2019 and signed on its behalf by:
AMBER BEVERAGE GROUP | ANNUAL REPORT 2018 > CONTENTS > CONSOLIDATED MANAGEMENT REPORT > CONSOLIDATED FINANCIAL STATEMENTS> CHAIRMAN’S STATEMENT > CHIEF FINANCIAL OFFICER’S STATEMENT > INDEPENDENT AUDITOR’S REPORTPAGE 98 PAGE 99

Consolidated Statement of Changes in Equity
Attributable to the equity holders of the parent
Share capital
EUR 000
Share Premium
EUR 000
Foreign exchange
revalutation reserve
EUR 000
Pooling reserve
EUR 000
Derivatives revaluation
reserve EUR 000
Retained earningsEUR 000
Currentperiodresult
EUR 000Total
EUR 000
Non-controling interest
EUR 000Total
equity
31 December 2016 104 537 – (364) – (114) 10 214 11 294 125 567 9 617 135 184
Transfer of prior period result – – – – – 11 294 (11 294) – – –
Dividend payment – – – – – (4 000) – (4 000) – (4 000)
Issue of share capital 13 132 553 – – – – – 132 566 – 132 566
Profit for the period – – – – – – 12 549 12 549 1 027 13 576
Other comprehesive income – – (343) – 64 (1 830) – (2 108) – (2 108)
Total comprehensive income – – (343) – 64 (1 830) 12 549 10 441 1 027 11 468
Reclassification of reserve due to reorganisation of the Group (104 537) – – – – (4 000) – (108 537) – (108 537)
Acquired during the period – – – (21 783) – – – (21 783) (6 069) (27 853)
31 December 2017 13 132 553 (706) (21 783) (50) 11 678 12 549 134 254 4 575 138 828
Effect of changes in accounting policies – – – – – (330) - (330) - (330)
1 January 2018 13 132 553 (707) (21 783) (50) 11 348 12 549 133 923 4 575 138 498
Transfer of prior period result – – – – – 12 549 (12 549) – – –
Dividend payment – – – – – – – – (93) (93)
Profit for the period – – – – – – 13 487 13 487 1 150 14 637
Other comprehesive income – – 966 821 (126) – – 1 660 – 1 660
Total comprehensive income – – 966 821 (126) – 13 487 15 147 1 150 16 297
Effect of changes in accounting policies – – – – – (330) – (330) – (330)
Acquired during the period – – – 3 289 – – – 3 289 663 3 952
31 December 2018 13 132 553 259 (17 673) (176) 23 897 13 487 152 360 6 295 158 655
AMBER BEVERAGE GROUP | ANNUAL REPORT 2018 > CONTENTS > CONSOLIDATED MANAGEMENT REPORT > CONSOLIDATED FINANCIAL STATEMENTS> CHAIRMAN’S STATEMENT > CHIEF FINANCIAL OFFICER’S STATEMENT > INDEPENDENT AUDITOR’S REPORTPAGE 100 PAGE 101

Consolidated Statement of Cash Flows
Notes2018
EUR 0002017
EUR 000
Cash flow from operating activities
Profit for the period before taxation 15 471 13 142
Adjustments for:
Deprecation and amortization charge 6 6 093 4 776
Impairment reversal of property, plant and equipment 13 (96) –
Net gain on sales and disposal of fixed assets and intangibles (369) (26)
Interest income 9 (1 242) (1 558)
Interest expense 9 2 333 2 015
22 190 18 349
Working capital changes:
Increase in inventories (2 949) (2 049)
Increase in trade and other receivables (14 307) (9 850)
Increase in trade and other payables 12 481 7 985
Cash generated from operations 17 415 14 435
Corporate income tax paid (3 176) (726)
Net cash generated from operating activities 14 239 13 709
Cash flows used in investing activities
Payments to acquire property, plant and equipment (4 174) (3 139)
Payments to acquire intangible assets (948) (2 964)
Proceeds from disposal of property, plant and equipment and investment properties 1 143 148
Payment for acquisition of subsidiary, net of cash acquired (12 088) (5 387)
Dividends paid (93) –
Net cash used in investing activities (16 160) (11 342)
Cash flows used in/ generated from financing activities
Proceeds from issue of share capital – 13
Interest paid (1 540) (2 015)
Change in overdraft 16 562 1 526
Borrowings received 4 560 12 040
Borrowings from related party 1 903 5 351
Repayment of borrowings (18 737) (18 728)
Finance lease payments (945) (748)
Net cash used in/ generated from financing activities 1 803 (2 561)
Net change in cash and cash equivalents (118) (194)
Cash and cash equivalents at the beginnging of the period 4 166 4 360
Cash and cash equivalents at the end of the period 4 048 4 166
1. General Information
These consolidated financial statements were approved and authorised for issue by the Board of Managers of Amber Beverage Group Holding S.à r.l. (the Parent Company) on 4 June 2019.
The Parent Company was incorporated on 26 September 2017 under the laws of Grand Duchy of Luxembourg with the registered number B218246 as Amber Beverage Group Holding S.à r.l. The Parent Company’s registered office is at 42 Rue de la Vallee, Luxembourg.
As of 31 December 2018 Amber Beverage Group (the Group or ABG) consists of following companies – the Parent Company, Amber Beverage Group SIA (Latvia), Latvijas balzams AS (Latvia), Amber Distribution Latvia SIA (Latvia), Bravo SIA (Latvia), Amber Distribution Estonia OU (Estonia), Bennet Distributors UAB (Lithuania), Amber IP Brands S.à r.l. (Luxembourg), Fabrica de Tequilas Finos S.A. de C.V.
(FTF) (Mexico), Interbaltija AG AS (Latvia), Amber Beverage Group UK Limited (the UK), Cellar Trends Holding Ltd (the UK), Cellar Trends Ltd (the UK), Tamboskoye spirtovoye predpriyatiye “Talvis” OA (Russia), Permalko OA (Russia) – acquired in 2018, Remedia AS (Estonia) – acquired in 2018, and Think Spirits Pty Ltd (Australia) – acquired in 2018.
The Parent Company, together with its subsidiaries (the Group), is involved in the production and distribution of branded spirits in the European Union (the EU) and global markets.
The approval of the consolidated financial statements of the Group at a meeting of shareholders shall be postponed if, disputing the correctness of separate positions in the consolidated financial statements, the postponement is requested by shareholders who represent at least one tenth of the equity capital.
Notes to Consolidated Financial StatementsAccounting Information and Policies
This section describes the basis of preparation of the consolidated financial
statements and the Group’s accounting policies that are applicable to the financial
statements as a whole. Accounting policies, critical accounting estimates and
judgements that are specific to a note are included in the note to which they
relate. This section also explains new accounting standards, amendments and
interpretations, that the Group has adopted in the current financial year or will
adopt in subsequent years.
AMBER BEVERAGE GROUP | ANNUAL REPORT 2018 > CONTENTS > CONSOLIDATED MANAGEMENT REPORT > CONSOLIDATED FINANCIAL STATEMENTS> CHAIRMAN’S STATEMENT > CHIEF FINANCIAL OFFICER’S STATEMENT > INDEPENDENT AUDITOR’S REPORTPAGE 102 PAGE 103

3. Changes in IFRS Standards and Interpretations
The following new and amended IFRS and interpretations became effective in 2018, but have no significant impact on the operations of the Group and these consolidated financial statements:
IFRS 9 Financial instruments (issued in July 2014 and effective for annual periods beginning on or after 1 January 2018). Key features of the new standard are:
• Financial assets are required to be classified into three measurement categories: those to be measured subsequently at amortised cost, those to be measured subsequently at fair value through other comprehensive income (FVOCI) and those to be measured subsequently at fair value through profit or loss (FVPL).
• Classification for debt instruments is driven by the entity’s business model for managing the financial assets and whether the contractual cash flows represent solely payments of principal and interest (SPPI). If a debt instrument is held to collect, it may be carried at amortised cost if it also meets the SPPI requirement. Debt instruments that meet the SPPI requirement that are held in a portfolio where an entity both holds to collect assets’ cash flows and sells assets may be classified as FVOCI. Financial assets that do not contain cash flows that are SPPI must be measured at FVPL (for example, derivatives). Embedded derivatives are no longer separated from financial assets but are included in assessing the SPPI condition.
• Investments in equity instruments are always measured at fair value. However, management can make an irrevocable election to present changes in fair value in other comprehensive income, provided the instrument is not held for trading. If the equity instrument is held for trading, changes in fair value are presented in profit or loss.
• Most of the requirements in IAS 39 for classification and measurement of financial liabilities were carried forward unchanged to IFRS 9. The key change is that an entity is required to present the effects of changes in own credit risk of financial liabilities designated at fair value through profit or loss in other comprehensive income.
• IFRS 9 introduces a new model for the recognition of impairment losses – the expected credit losses (ECL) model. There is a ‘three stage’ approach which is based on the change in credit quality of financial assets since initial recognition. In practice, the new rules mean that entities have to record an immediate loss equal to the 12-month ECL on initial recognition of financial assets that are not credit impaired (or lifetime ECL for trade receivables). Where there has been a significant increase in credit risk, impairment is measured using lifetime ECL rather than 12-month ECL. The model includes operational simplifications for lease and trade receivables.
• Hedge accounting requirements were amended to align accounting more closely with risk management. The standard provides entities with an accounting policy choice between applying the hedge accounting requirements of IFRS 9 and continuing to apply IAS 39 to all hedges because the standard currently does not address accounting for macro hedging.
For financial instruments, no changes in the measurement principles are identified.
The Group chose the option of not restating the comparative information for prior periods. Differences in the carrying amounts of financial assets resulting from adoption of IFRS 9 are recognised in retained earnings as at 1 January 2018 (see Note 16.5).
2. Basis of Preparation
The consolidated financial statements of the Group have been prepared in accordance with International Financial Reporting Standards (IFRS) as issued by the International Accounting Standards Board (IASB) and as adopted by the EU under the historical cost convention. These consolidated financial statements for the period are the forth financial statements of the Group that has been prepared in accordance with IFRS.
Going Concern
These consolidated financial statements have been prepared on a going concern basis as the Managers believe there are no material uncertainties that lead to significant doubt about the Group’s ability to continue as a going concern in the foreseeable future.
To maintain comparability of financial information presented, several income and expense positions in the consolidated statement of comprehensive income for 2017 has been reclassified (see Note 29).
Group Reorganisations
In 2014 the Amber Beverage Group was formed through a reorganisation of S.P.I. Regional Business Unit B.V. in which Amber Beverage Group SIA became a new parent entity of the Group.
In 2017 the further reorganisation process was performed according to which the newly established company – Amber Beverage Group Holding S.à r.l. became a new parent entity of the Group. As the reorganisation does not involve a business combination, it was accounted as a capital reorganisation using predecessor accounting method. Accordingly, although the Amber Beverage Group Holding S.à.r.l. was established during 2017, these consolidated financial statements have been prepared as a continuation of the existing Group and include financial performance and cash flows of the Group from the beginning of 2018 as well as comparative financial information for 2017 and 2016 (Consolidated statement of financial position only).
Basis for Measurement
The consolidated financial statements have been prepared on a historical cost basis, except for derivative financial instruments that are recognised at fair value.
Basis of Consolidation
The consolidated financial statements incorporate the financial statements of the Parent Company and entities controlled by the Parent Company (its subsidiaries). Control is achieved when the Group is exposed, or has rights, to variable
returns from its involvement with the investee and can affect those returns through its power over the investee. Specifically, the Group controls an investee if, and only if, the Group has:
• Power over the investee (i.e. existing rights that give it the current ability to direct the relevant activities of the investee);
• Exposure, or rights, to variable returns from its involvement with the investee;
• The ability to use its power over the investee to affect its returns.
Generally, there is a presumption that most of voting rights result in control. To support this presumption and when the Group has less than a majority the voting or similar rights of an investee, the Group considers all relevant facts and circumstances in assessing whether it has power over an investee, including:
• The contractual arrangement with the other vote holders of the investee;
• Rights arising from other contractual arrangements;• The Group’s voting rights and potential voting rights.
The Group re-assesses whether it controls an investee if facts and circumstances indicate that there are changes to one or more of the three elements of control. Consolidation of a subsidiary begins when the Group obtains control over the subsidiary and ceases when the Group loses control of the subsidiary. Assets, liabilities, income and expenses of a subsidiary acquired or disposed of during the year are included in the consolidated financial statements from the date the Group gains control until the date the Group ceases to control the subsidiary.
Subsidiaries
Subsidiaries are part of the Group from the date of their acquisition, being the date on which the Group obtains control, and continue to be part of the Group until the date that such control ceases. Control comprises the power to govern the financial and operating policies of the investee to obtain benefit from its activities and is achieved through direct or indirect ownership of voting rights currently exercisable or convertible potential voting rights or by way of contractual agreement. The subsidiary financial statements are prepared for the same reporting year as the parent company and are based on consistent accounting policies. All intra-group balances and transactions including unrealised profit arising from them are eliminated in full.
A change in the ownership interest of a subsidiary, without loss of control, is accounted for as an equity transaction. If the Group loses control of a subsidiary it: (i) derecognises the assets (including goodwill) and liabilities of the subsidiary; (ii) de recognises the carrying amount of any non-controlling interest; (iii) derecognises the cumulative translation differences recorded in equity; (iv) recognises the fair value of the consideration received; (v) recognises the fair value of
any investment retained; (vi) recognises any surplus or deficit in profit or loss; (vii) recognises the parent’s share of any components previously recognised in other comprehensive income to profit or loss or retained earnings, as appropriate.
Functional and presentation currency
The functional and presentation currency of the main Group entities is euro (EUR) as the European Union is the primary economic environment in which the Group’s subsidiaries operate. These consolidated financial statements are presented in thousand euros (unless stated differently).
In preparing the financial statements of each individual group entity, transactions in currencies other than the entity’s functional currency (foreign currencies) are
recognised at the rates of exchange prevailing at the dates of the transactions. At the end of each reporting period, monetary items denominated in foreign currencies are retranslated at the rates prevailing at that date.
Exchange differences on monetary items are recognised in the statement of comprehensive income in the period in which they arise except for exchange differences on foreign currency borrowings relating to assets under construction for future productive use, which are included in the cost of those assets.
Reporting period
These consolidated financial statements cover the period from 1 January 2018 to 31 December 2018.
AMBER BEVERAGE GROUP | ANNUAL REPORT 2018 > CONTENTS > CONSOLIDATED MANAGEMENT REPORT > CONSOLIDATED FINANCIAL STATEMENTS> CHAIRMAN’S STATEMENT > CHIEF FINANCIAL OFFICER’S STATEMENT > INDEPENDENT AUDITOR’S REPORTPAGE 104 PAGE 105

IFRS 15 Revenue from Contracts with Customers (issued on 28 May 2014 and effective for annual periods beginning on or after 1 January 2018). The new standard introduces the core principle that revenue must be recognised when the goods or services are transferred to the customer, at the transaction price. Any bundled goods or services that are distinct must be separately recognised, and any discounts or rebates on the contract price must generally be allocated to the separate elements. When the consideration varies for any reason, minimum amounts must be recognised if they are not at significant risk of reversal. Costs incurred to secure contracts with customers must be capitalised and amortised over the period when the benefits of the contract are consumed.
The new standard does not have a material impact on the Group’s consolidated financial statements as the accounting principles for the absolute majority of Group’s revenues are the same under the new IFRS 15 regulations.
Amendments to IFRS 15, Revenue from Contracts with Customers – The amendments do not change the underlying principles of the standard but clarify how those principles should be applied. The amendments clarify how to identify a performance obligation (the promise to transfer a good or a service to a customer) in a contract; how to determine whether a company is a principal (the provider of a good or service) or an agent (responsible for arranging for the good or service to be provided); and how to determine whether the revenue from granting a licence should be recognised at a point in time or over time. In addition to the clarifications, the amendments include two additional reliefs to reduce cost and complexity for a company when it first applies the new standard.
Amendments to IFRS 15 has no impact on Group’s consolidated financial statements nor respective disclosures.
Classification and Measurement of Share-based Payment Transactions – Amendments to IFRS 2 – The amendments mean that non-market performance vesting conditions will impact measurement of cash-settled share-based payment transactions in the same manner as equity-settled awards. The amendments also clarify classification of a transaction with a net settlement feature in which the entity withholds a specified portion of the equity instruments, that would otherwise be issued to the counterparty upon exercise (or vesting), in return for settling the counterparty’s tax obligation that is associated with the share-based payment. Such arrangements will be classified as equity-settled in their entirety. Finally, the amendments also clarify accounting for cash-settled share based payments that are modified to become equity-settled, as follows (a) the share-based payment is measured by reference to the modification-date fair value of the equity instruments granted as a result of the modification; (b) the liability is derecognised upon the modification, (c) the equity-settled share-based payment is recognised to the extent that the services have been rendered up to the modification date, and (d) the difference between the carrying amount of the liability as at the
modification date and the amount recognised in equity at the same date is recorded in profit or loss immediately.
Amendments to IFRS 2 has no impact on Group’s consolidated financial statements nor respective disclosures as the Group has not accounted for share-based payment transactions.
Applying IFRS 9 Financial Instruments with IFRS 4 Insurance Contracts – Amendments to IFRS 4 – The amendments address concerns arising from implementing the new financial instruments standard, IFRS 9, before implementing the replacement standard that IASB is developing for IFRS 4. These concerns include temporary volatility in reported results. The amendments introduce two approaches. (1) The amended standard will give all companies that issue insurance contracts the option to recognise in other comprehensive income, rather than profit or loss, the volatility that could arise when IFRS 9 is applied before the new insurance contracts standard is issued (‘overlay approach). (2) In addition, the amended standard will give companies whose activities are predominantly connected with insurance an optional temporary exemption from applying IFRS 9 until 2021. The entities that defer the application of IFRS 9 will continue to apply the existing financial instruments standard - IAS 39. The amendments to IFRS 4 supplement existing options in the standard that can already be used to address the temporary volatility.
Amendments to IFRS 4 has no impact on Group’s consolidated financial statements nor respective disclosures as the Group does not issue insurance contracts.
Annual Improvements to IFRSs 2014–2016 Cycle – IFRS 1 was amended to delete some of the short-term exemptions from IFRSs after those short-term exemptions have served their intended purpose. The amendments to IAS 28 clarify that venture capital organisations or similar entities have an investment-by- investment choice for measuring investees at fair value. Additionally, the amendment clarifies that if an investor that is not an investment entity has an associate or joint venture that is an investment entity, the investor can choose on an investment-by-investment basis to retain or reverse the fair value measurements used by that investment entity associate or joint venture when applying the equity method.
The Annual Improvements to IFRS’s 2014-2016 Cycle does not have any impact on Group’s consolidated financial statements nor disclosures.
Transfers of Investment Property - Amendments to IAS 40 – The amendment clarified that to transfer to, or from, investment properties there must be a change in use. This change must be supported by evidence; a change in intention, in isolation, is not enough to support a transfer.
Amendments to IAS 40 does not have any impact on Group’s consolidated financial statements nor respective disclosures.
IFRIC 22 Foreign Currency Transactions and Advance Consideration – (Effective for annual periods beginning on or after 1 January 2018). The interpretation applies where an entity either pays or receives consideration in advance for foreign currency-denominated contracts. The interpretation clarifies that the date of transaction, i.e. the date when the exchange rate is determined, is the date on which the entity initially recognises the non-monetary asset or liability from advance consideration. However, the entity needs to apply judgement in determining whether the prepayment is monetary or non-monetary asset or liability based on guidance in IAS 21, IAS 32 and the Conceptual Framework.
Interpretation does not have any impact on Group’s consolidated financial statements nor respective disclosures.
Certain new standards and interpretations have been published that become effective for the accounting periods beginning on 1 January 2019 or later periods or are not yet endorsed by the EU:
IFRS 16 Leases (issued in January 2016 and effective for annual periods beginning on or after 1 January 2019). It will result in almost all leases being recognised on the balance sheet by lessees, as the distinction between operating and finance leases is removed. Under the new standard, an asset (the right to use the leased item) and a financial liability to pay rentals are recognised. The only exceptions are short-term and low-value leases.
The Group has set up a project team which has reviewed all of the Group’s leasing arrangements over the last year in light of the new lease accounting rules in IFRS 16. The standard will affect primarily the accounting for the Group’s operating leases.
For the existing operating lease commitments, the Group expects right-of-use assets and lease liabilities of approximately EUR 5.59 million on 1 January 2019.
Operating cash flows will increase and financing cash flows decrease by approximately EUR 1.9 million in 2019 as repayment of the principal portion of the lease liabilities will be classified as cash flows from financing activities.
The Group’s activities as a lessor are not material and hence the Group does not expect any significant impact on the financial statements. However, some additional disclosures will be required from next year.
The Group will apply the standard from its mandatory adoption date of 1 January 2019. The Group intends to apply the simplified transition approach and will not restate comparative amounts for the year prior to first adoption. Right-of-use assets for leases will be measured on transition at the amount of the lease liability on adoption (adjusted for any prepaid or accrued lease expenses).
IFRIC 23 Uncertainty over Income Tax Treatments (effective for annual periods beginning on or after 1 January 2019, not yet endorsed in the EU).
Prepayment Features with Negative Compensation - Amendments to IFRS 9 (effective for annual periods beginning on or after 1 January 2019).
Long-term Interests in Associates and Joint Ventures – Amendments to IAS 28 (effective for annual periods beginning on or after 1 January 2019; not yet adopted by the EU).
Annual improvements to IFRS’s 2015-2017 cycle (effective for annual periods beginning on or after 1 January 2019, not yet endorsed in the EU). The amendments include changes that affect 4 standards:
• IFRS 3 - Business Combinations• IFRS 11 - Joint Arrangements• IAS 12 - Income Taxes• IAS 23 - Borrowing costs.
Plan Amendment, Curtailment or Settlement – Amendments to IAS 19 (effective for annual periods beginning on or after 1 January 2019; not yet adopted by the EU).
Amendments to the Conceptual Framework for Financial Reporting (effective for annual periods beginning on or after 1 January 2020; not yet adopted by the EU).
Definition of a business – Amendments to IFRS 3 (effective for annual periods beginning on or after 1 January 2020; not yet adopted by the EU).
Definition of materiality – Amendments to IAS 1 and IAS 8 (effective for annual periods beginning on or after 1 January 2020; not yet adopted by the EU).
IFRS 17, Insurance Contracts (effective for annual periods beginning on or after 1 January 2021; not yet adopted by the EU).
Sale or Contribution of Assets between an Investor and its Associate or Joint Venture - Amendments to IFRS 10 and IAS 28 (effective date to be determined by the IASB; not yet adopted by the EU).
The Group has elected not to adopt these standards, revisions and interpretations in advance of their effective dates. The Group anticipates that the adoption of all standards, revisions and interpretations will have no material impact on the financial statements of the Group in the period of initial application except as for implementation of IFRS 16 as discussed before.
AMBER BEVERAGE GROUP | ANNUAL REPORT 2018 > CONTENTS > CONSOLIDATED MANAGEMENT REPORT > CONSOLIDATED FINANCIAL STATEMENTS> CHAIRMAN’S STATEMENT > CHIEF FINANCIAL OFFICER’S STATEMENT > INDEPENDENT AUDITOR’S REPORTPAGE 106 PAGE 107

Results for the Year
This section explains the results and performance of the Group for the year ended
31 December 2018. Disclosures are provided for segmental information, operating
profit, finance income and costs, and taxation.
5. Segment Reporting
In identifying its segments, management follows the Group’s business specific. The Group is considered to have two main reportable segments: Production and Distribution segment.
Each of these segments is managed separately as each of business areas require different approaches. All inter-segment transfers are carried out at arm’s length prices.
Net revenue comprises the fair value of the consideration received or receivable for the sale of goods and services in the ordinary course of the Group’s activities. Net revenue is reduced for estimated customer returns, discounts, rebates, and other similar allowances. Net revenue is shown net of value-added tax, excise and duties or other sales taxes. Net revenue is recognized to the extent that it is probable that future economic benefits will flow to the Group and these can be measured reliably.
4. Critical Assumptions and Estimates
The key assumptions concerning the future and other key sources of estimation uncertainty at the reporting date, that have a significant risk of causing a material adjustment to the carrying amount of assets and liabilities within the next financial year are described below. The Group based its assumptions and estimates on parameters available when the consolidated financial statements were prepared. However, estimates and underlying assumptions are reviewed on an ongoing basis. Revisions to accounting estimates are recognised in the period in which the estimate is revised, if the revision affects only that period, or in the period of the revision and future periods, if the revision affects both current and future periods.
Impairment of goodwill
The Group’s impairment test for goodwill is based on a value-in-use calculations using a discounted cash flow model. The cash flows are derived from the Group’s five-year plans for goodwill impairment testing purposes and three-year plans for trademark impairment testing purposes. The recoverable amount is most sensitive to the discount rate used for the discounted cash flow model as well as the expected future cash inflows and the growth rate used
for extrapolation purposes. The key assumptions used to determine the recoverable amount for the different cash generating units, including a sensitivity analysis, as further explained in Note 12. The Group tests annually whether goodwill has suffered any impairment.
Provisions for inventory obsolescence
Provisions are made with reference to the ageing of inventory balances and the view of management as to whether amounts are recoverable. Provision for inventory obsolescence are determined with consideration to latest sales forecasts.
Production DistributionManagement/ Oth-
er/ Eliminations Consolidated
2018EUR 000
2017EUR 000
2018EUR 000
2017EUR 000
2018EUR 000
2017EUR 000
2018EUR 000
2017EUR 000
Net revenue
Third party net revenue 80 903 68 317 290 228 245 138 (128 507) (101 662) 242 624 211 793
Intersegment net revenue 34 579 27 269 8 064 3 051 (42 643) (30 320) – –
Segment net revenue 115 482 95 586 298 292 248 189 (171 150) (131 982) 242 624 211 793
Operating profit 14 617 6 404 6 852 9 313 525 (1 881) 21 994 13 836
Finance income 1 375 1 558
Finance costs (7 898) (2 252)
Income tax (834) 434
Net profit 14 637 13 576
Third party segment revenue of includes the excise and duties which is excluded via eliminations.
AMBER BEVERAGE GROUP | ANNUAL REPORT 2018 > CONTENTS > CONSOLIDATED MANAGEMENT REPORT > CONSOLIDATED FINANCIAL STATEMENTS> CHAIRMAN’S STATEMENT > CHIEF FINANCIAL OFFICER’S STATEMENT > INDEPENDENT AUDITOR’S REPORTPAGE 108 PAGE 109

Production DistributionManagement/ Oth-
er/ Eliminations Consolidated
2018EUR 000
2017EUR 000
2018EUR 000
2017EUR 000
2018EUR 000
2017EUR 000
2018EUR 000
2017EUR 000
Assets
Non-current segment assets 56 102 55 307 30 480 32 381 23 140 15 824 109 722 103 512
Current segment assets 75 447 54 496 105 501 88 476 1 887 2 716 182 835 145 688
Segment assets 131 549 109 803 135 981 120 857 25 027 18 540 292 557 249 200
Deferred tax assets 26 28
Current tax receivable 1 329 431
Loans to related parties 24 485 27 781
Other non-current assets 2 943 2 970
Total assets 321 340 280 410
Liabilities
Non-current segment liabilities (764) (663) (1 317) (249) – – (2 081) (912)
Current segment liabiltiies (5 897) (30 637) (93 191) (53 868) (616) (3 137) (99 704) (87 642)
Segment liabilities (6 661) (31 300) (94 508) (54 117) (616) (3 137) (101 785) (88 554)
Deferred tax liabilities (64) –
Loans and borrowings (60 661) (52 978)
Derivatives (175) (49)
Total liabilities (162 685) (141 581)
Other disclosures
Capital expenditure 4656 5 711 2 242 951 768 1 974 7 666 8 636
Depreciation and amortisation 3 956 2 809 1 750 1 670 387 297 6 093 4 776
Acquisition of goodwill – – 5 799 9 346 – – 5 799 9 346
0
10 000
20 000
30 000
40 000
50 000
60 000
70 000
80 000
Year 2017
Year 2018
Latv
ia
Lith
uani
a
UK
Cypr
us
Russ
ia
Aust
ralia
USA
Oth
er
Esto
nia
USA 3%
Australia 2%
Russia 9%
Cyprus 17%
UK 12%
Baltics 56%
USA 6%
Russia 1%
Cyprus 21%
UK 7% Baltics 64%
Sales by markets, 2018 Sales by markets, 2017
The Group is domiciled in Luxembourg, with the primary activities carried out in Baltic countries (Latvia, Lithuania and Estonia). The amount of its net revenues from external customers broken down by location of the customers is shown in the following graph:
AMBER BEVERAGE GROUP | ANNUAL REPORT 2018 > CONTENTS > CONSOLIDATED MANAGEMENT REPORT > CONSOLIDATED FINANCIAL STATEMENTS> CHAIRMAN’S STATEMENT > CHIEF FINANCIAL OFFICER’S STATEMENT > INDEPENDENT AUDITOR’S REPORTPAGE 110 PAGE 111

The total non-current assets other than financial instruments and deferred tax assets, broken down by location of assets, are shown in the following graphs:
The EBITDA (Earnings before interest, tax, depreciation and amortization costs) is calculated as following:
Other20 871
Russia15 559
Mexico12 402 UK
7 504
Baltics53 387
Other14 983
Russia16 777
Mexico12 807
UK7 946
Baltics50 999
2018 2017
6. Operating Profit
Operating profit for the period has been arrived at after charging (classifying expenses by nature):
2018 EUR 000
2017EUR 000
Revenue 371 132 313 455
Excise and duties (128 508) (101 662)
Net revenue 242 624 211 793
Cost of inventories (7 099) (5 063)
Advertising, marketing and promotional costs (13 384) (12 598)
Logistic costs (12 421) (9 236)
Staff costs (34 494) (27 484)
Indirect costs of production (14 033) (13 353)
Other operating income 6 970 5 578
Net impairment loss on financial assets (366) (627)
Depreciation and amortisation – cost of goods sold (1 960) (1 058)
Depreciation and amortisation – selling costs (1 185) (1 144)
Depreciation and amortisation – administration costs (2 948) (2 574)
Total depreciation and amortisation (6 093) (4 776)
M&A related costs (428) (559)
Operating profit 21 994 13 836
2018EUR 000
2017EUR 000
Operating profit 21 994 13 836
Add-back for:
Depreciation and amortisation 6 093 4 776
EBITDA 28 087 18 613
AMBER BEVERAGE GROUP | ANNUAL REPORT 2018 > CONTENTS > CONSOLIDATED MANAGEMENT REPORT > CONSOLIDATED FINANCIAL STATEMENTS> CHAIRMAN’S STATEMENT > CHIEF FINANCIAL OFFICER’S STATEMENT > INDEPENDENT AUDITOR’S REPORTPAGE 112 PAGE 113
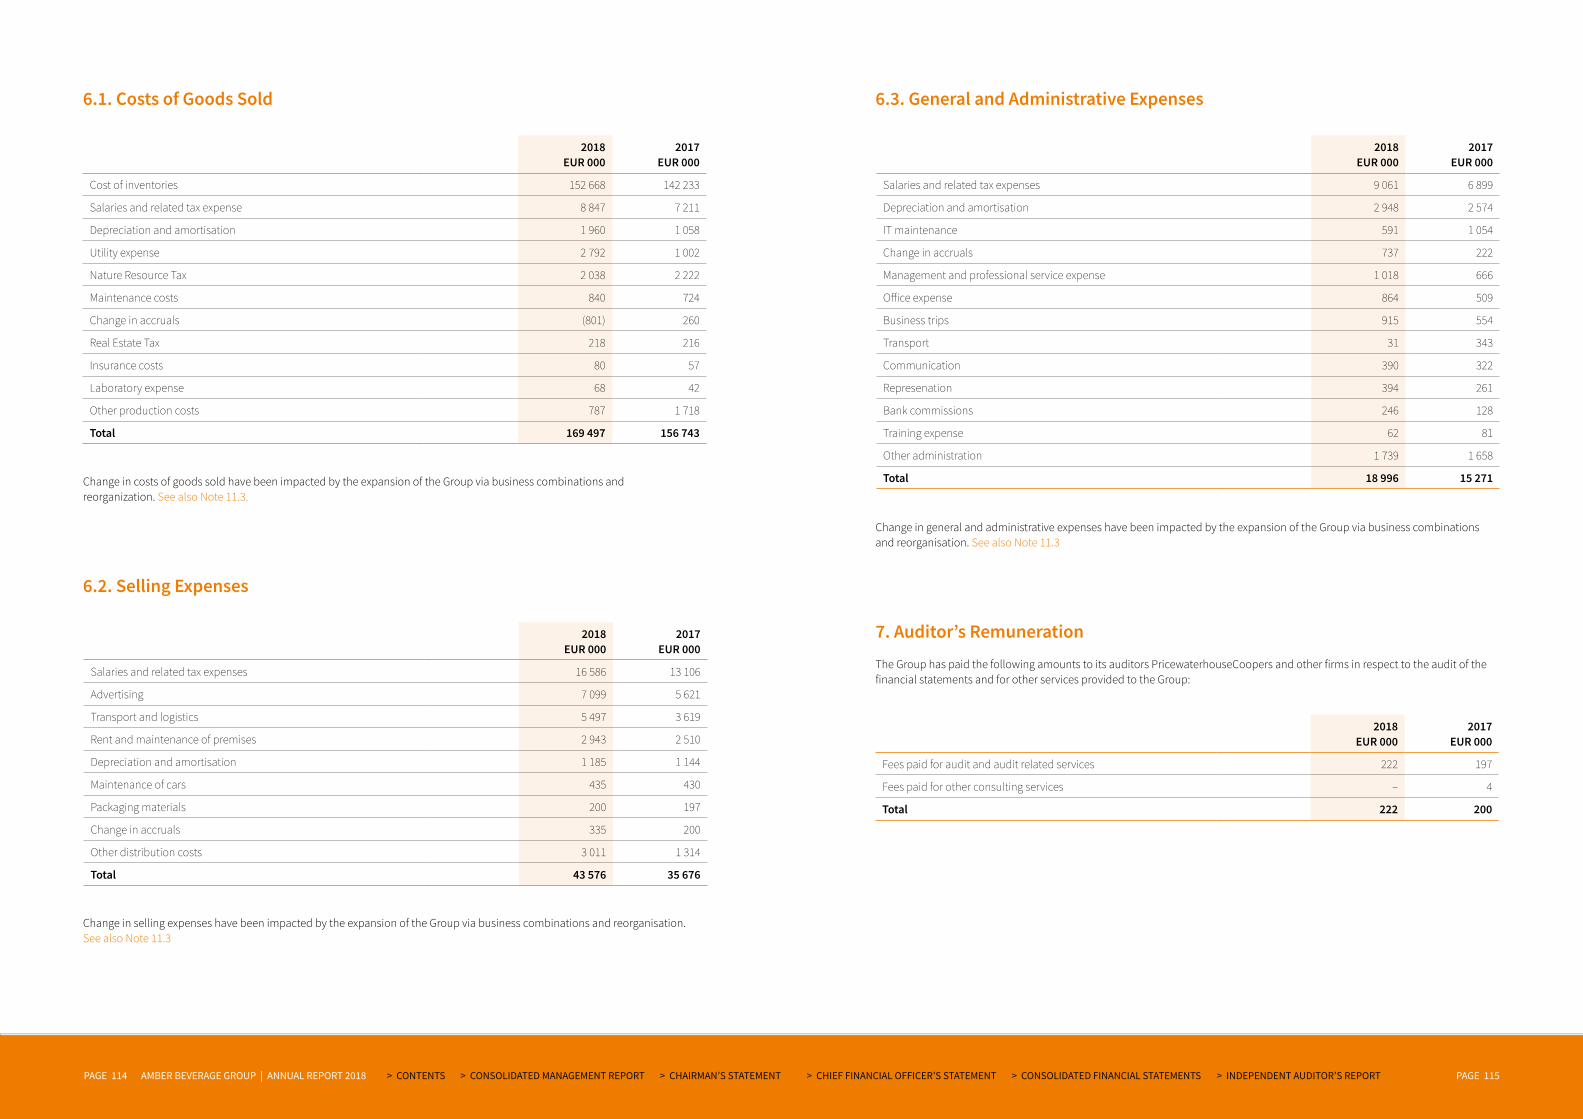
6.1. Costs of Goods Sold
7. Auditor’s Remuneration
The Group has paid the following amounts to its auditors PricewaterhouseCoopers and other firms in respect to the audit of the financial statements and for other services provided to the Group:
6.3. General and Administrative Expenses
6.2. Selling Expenses
Change in costs of goods sold have been impacted by the expansion of the Group via business combinations and reorganization. See also Note 11.3.
Change in general and administrative expenses have been impacted by the expansion of the Group via business combinations and reorganisation. See also Note 11.3
Change in selling expenses have been impacted by the expansion of the Group via business combinations and reorganisation. See also Note 11.3
2018EUR 000
2017EUR 000
Cost of inventories 152 668 142 233
Salaries and related tax expense 8 847 7 211
Depreciation and amortisation 1 960 1 058
Utility expense 2 792 1 002
Nature Resource Tax 2 038 2 222
Maintenance costs 840 724
Change in accruals (801) 260
Real Estate Tax 218 216
Insurance costs 80 57
Laboratory expense 68 42
Other production costs 787 1 718
Total 169 497 156 743
2018EUR 000
2017EUR 000
Fees paid for audit and audit related services 222 197
Fees paid for other consulting services – 4
Total 222 200
2018EUR 000
2017EUR 000
Salaries and related tax expenses 9 061 6 899
Depreciation and amortisation 2 948 2 574
IT maintenance 591 1 054
Change in accruals 737 222
Management and professional service expense 1 018 666
Office expense 864 509
Business trips 915 554
Transport 31 343
Communication 390 322
Represenation 394 261
Bank commissions 246 128
Training expense 62 81
Other administration 1 739 1 658
Total 18 996 15 271
2018EUR 000
2017EUR 000
Salaries and related tax expenses 16 586 13 106
Advertising 7 099 5 621
Transport and logistics 5 497 3 619
Rent and maintenance of premises 2 943 2 510
Depreciation and amortisation 1 185 1 144
Maintenance of cars 435 430
Packaging materials 200 197
Change in accruals 335 200
Other distribution costs 3 011 1 314
Total 43 576 35 676
AMBER BEVERAGE GROUP | ANNUAL REPORT 2018 > CONTENTS > CONSOLIDATED MANAGEMENT REPORT > CONSOLIDATED FINANCIAL STATEMENTS> CHAIRMAN’S STATEMENT > CHIEF FINANCIAL OFFICER’S STATEMENT > INDEPENDENT AUDITOR’S REPORTPAGE 114 PAGE 115

8. Staff Costs
Personnel expenses incurred by the Group during the period are analysed as follows:
10. Corporate Income Tax
10.1. Corporate Income Tax Components
2018EUR 000
2017EUR 000
Wages and salaries 28 086 22 477
Social security contributions 6 464 5 007
Total 34 550 27 484
2018 2017
Production 862 569
Wholesale & Retail 543 441
Other 734 651
Total 2 139 1 661
The average number of persons employed by the Group during the period, including managers was as follows:
9. Finance Income and Costs
2018EUR 000
2017EUR 000
Finance income:
Interest income 1 242 1 558
Other financial income 133 -
Total finance income 1 375 1 558
Finance costs:
Interest costs (2 333) (2 015)
Foreign exchange loss, net (5 260) (151)
Other financial costs (305) (86)
Total finance costs (7 898) (2 252)
Net finance income/ (costs) (6 523) (694)
Corporate income tax comprises current and deferred tax of the reporting year. Corporate income tax for the reporting period is included in the financial statements based on the management’s calculations prepared in accordance with requirements of tax legislation of each company of the Group. Deferred tax assets/liabilities are
written off in the profit and loss account of the reporting period based on the legislative changes resulting in a change in deferred tax base. Income taxes are recognized through profit or loss unless they relate to items recognized directly in equity.
2018EUR 000
2017EUR 000
Current tax expense 802 2 940
Change in deferred tax 32 (3 374)
Tax charge/ (credit) 834 (434)
10.2. Reconciliation of Accounting Profit to Income Tax Charges
2018EUR 000
2017EUR 000
Profit before tax 15 471 13 142
Income tax credit calculated at effective tax rate (20.1% 2018; 15% 2017) 3 111 1 971
Adjusting for:
Permanent differences (2 258) 739
Change in allowance for deferred tax asset (19) (3 144)
Income tax expense/ (credit) recognized in profit or loss 834 (434)
Income tax is calculated at 20.1% as this represents the tax rate applicable for the key jurisdictions of profit generation.
AMBER BEVERAGE GROUP | ANNUAL REPORT 2018 > CONTENTS > CONSOLIDATED MANAGEMENT REPORT > CONSOLIDATED FINANCIAL STATEMENTS> CHAIRMAN’S STATEMENT > CHIEF FINANCIAL OFFICER’S STATEMENT > INDEPENDENT AUDITOR’S REPORTPAGE 116 PAGE 117

12/31/2017EUR 000
Acquire through re-
organisation of the Group
EUR 000
Charged to income statement
EUR 000
Charged to OCI
EUR 00012/31/2018
EUR 000
Temporary differences
Property, plant and equipment 940 39 (106) – 873
Tax loss carried forwards (5 050) – 859 – (4 191)
Other provisions and accruals (294) (34) 129 – (199)
Allowance for deferred tax asset 4 376 19 (19) (821) 3 555
(28) 24 863 (821) 38
Deferred tax asset (28) (26)
Deferred tax liabilities – 64
(28) 38
10.3. Movements in Deferred Tax Components
Year ended 31 December 2018
Operating Assets and Liabilities
This section describes the assets used to generate the Group’s performance and the
liabilities incurred. Liabilities relating to the Group’s financing activities are included
in this section. This section also provides detailed disclosures on the Group’s recent
acquisitions of subsidiaries.
11. Business Combinations and Reorganization
Business combinations are accounted for using the acquisition method. The cost of any acquisition is measured as the aggregate of the consideration transferred, measured at acquisition date fair value and the amount of any non-controlling interest in the acquiree. For each business combination, the acquirer measures the non-controlling interest in the acquiree either at fair value or at the proportionate share of the acquirer’s identifiable net assets.
Acquisition costs incurred are expensed and included within merger and acquisition (M&A) related costs.
When the Group acquires a business, it assesses the financial assets and liabilities assumed for appropriate classification and designation in accordance with the contractual terms, economic circumstances and pertinent conditions as at the acquisition date. This includes the separation of embedded derivatives in host contracts by the acquiree.
Goodwill is initially recognised at cost being the excess of the aggregate of the consideration transferred and the amount recognised for non-controlling interest over the net identifiable assets acquired and liabilities assumed. If this consideration is lower than the fair value of the net assets of the subsidiary acquired, the difference is recognised in the statement of comprehensive income.
After initial recognition goodwill is measured at cost less any accumulated impairment losses. For impairment testing, goodwill acquired in a business combination is from the acquisition date allocated to each of the Group’s cash generating units that are expected to benefit from the combination irrespective of whether
assets or liabilities of the acquisition are assigned to those units.
Where goodwill forms part of a cash generating unit and part of the operation within that unit is disposed of, the goodwill associated with the operation disposed of is included in the carrying amount of the operation when determining the gain or loss on disposal of the operation. Goodwill disposed of in this circumstance is measured based on the relative values of the operation disposed of and the portion of the cash generating unit retained.
Purchases of controlling interests in subsidiaries from entities under common control
Purchases of controlling interests in subsidiaries from entities under common control are accounted for prospectively from the date of acquisition, using the pooling of interest’s method.
The assets and liabilities of the subsidiary transferred under common control are recorded in these consolidated financial statements at the historical cost of the controlling entity (the Predecessor). Related goodwill inherent in the Predecessor’s original acquisition is also recorded in the consolidated financial statements. Any difference between the total book value of net assets, including the Predecessor’s goodwill, and the consideration paid is accounted for in the consolidated financial statements as an adjustment to the shareholders’ equity via pooling reserve.
AMBER BEVERAGE GROUP | ANNUAL REPORT 2018 > CONTENTS > CONSOLIDATED MANAGEMENT REPORT > CONSOLIDATED FINANCIAL STATEMENTS> CHAIRMAN’S STATEMENT > CHIEF FINANCIAL OFFICER’S STATEMENT > INDEPENDENT AUDITOR’S REPORTPAGE 118 PAGE 119

Acquisition of subsidiaries
The initial accounting for a business combination involves identifying and determining the fair values to be assigned to the acquiree’s identifiable assets, liabilities and contingent liabilities and the cost of the combination. If the initial accounting for a business combination can be determined only provisionally by the end of the period in which the combination is
affected because either the fair values to be assigned to the acquiree’s identifiable assets, liabilities or contingent liabilities, or the cost of the combination can be determined only provisionally, the Group accounts for the combination using those provisional values. The Group recognises any adjustments to those provisional values because of completing the initial accounting within twelve months of the acquisition date.
11.1. Acquisitions in 2018
2018 2017
RemediaEUR 000
Think Spirits
EUR 000Total
EUR 000
Interbaltija AG
EUR 000
Cellar Trends
EUR 000Total
EUR 000
Assets
Intangible assets 17 – 17 26 – 26
Property, plant and equipment 1 223 193 1 416 25 459 484
Inventories 916 2 253 3 169 1 719 5 600 7 319
Trade receivables and other receivables 727 3 089 3 816 1 137 9 832 10 969
Cash and cash equivalents 111 126 237 82 979 1 061
Liabilities
Non-current bank liabilities (103) (37) (140) – – –
Trade payables (182) (1 894) (2 076) (542) (6 812) (7 354)
Other AP (1 071) (526) (1 597) (574) (2 052) (2 626)
Borrowings (18) (2 950) (2 968) (310) – (310)
Total identifiable net assets acquired 1 620 254 1 874 1 563 8 006 9 569
Negative goodwill arising on acquisition (20) – (20) – – –
Goodwill arising on acquisition – 5 799 5 799 1 637 7 709 9 346
Purchase consideration 1 600 6 053 7 653 3 200 15 715 18 915
Cash paid 1 600 5 431 7 031 2 240 4 508 6 748
Contingent consideration – 622 622 960 11 207 12 167
Total purchase consideration 1 600 6 053 7 653 3 200 15 715 18 915
Net cash acquired on acquisition 111 126 237 82 979 1 061
Cash paid (1 600) (5 431) (7 131) (2 240) (4 508) (6 748)
Net cash flow on acquisition (1 489) (5 305) (6 794) (2 158) (3 529) (5 687)
Remedia AS
On 20 February 2018, the Group acquired 100% of voting shares of Remedia AS, an unlisted company based in Estonia and specialising in the production and distribution of alcoholic beverages in Estonia. The Group acquired Remedia AS in accordance with the Group’s strategy on strengthening the
position in off-trade distribution segment in Estonia. As the result of business combination, the negative goodwill in amount of EUR 20 thousand was recognized in the income statement as Other operating income.
Think Spirits Pty Ltd
On 23 May 2018, the Group acquired 90% of voting shares of Think Spirits Pty Ltd, an unlisted company based in Australia, whose main activity is Building the Brands of alcoholic and non-alcoholic beverages in the Australian market. The Group acquired Think Spirits Pty ltd in accordance with the Groups strategy on strengthening the global position of distribution division.
The goodwill of EUR 5 799 thousand comprises the synergies arising from the acquisition and the fair value of put and call options as stipulated in the share purchase agreement.
The goodwill is fully recognised entirely to the distribution division. None of the goodwill recognised is expected to be deductible for income tax purposes. Contingent consideration for the purchase consideration consists of estimated payments for the remaining part of Think Spirits shares.
Since the date of acquisition, Remedia has contributed EUR 1.68 million of revenues and loss before tax of EUR 339 thousand. Think Spirits has contributed EUR 10 million of revenues and EUR 79 thousand of profit before tax from continuing operations of the Group. If the combinations had taken place at the beginning of the year, revenue from continuing operations would have been EUR 1.95 million for Remedia and EUR 13.9 million for Think Spirits and loss before tax from continuing operations for the Group would have been EUR 536 thousand for Remedia and EUR 204 thousand for Think Spirits respectively.
AMBER BEVERAGE GROUP | ANNUAL REPORT 2018 > CONTENTS > CONSOLIDATED MANAGEMENT REPORT > CONSOLIDATED FINANCIAL STATEMENTS> CHAIRMAN’S STATEMENT > CHIEF FINANCIAL OFFICER’S STATEMENT > INDEPENDENT AUDITOR’S REPORTPAGE 120 PAGE 121
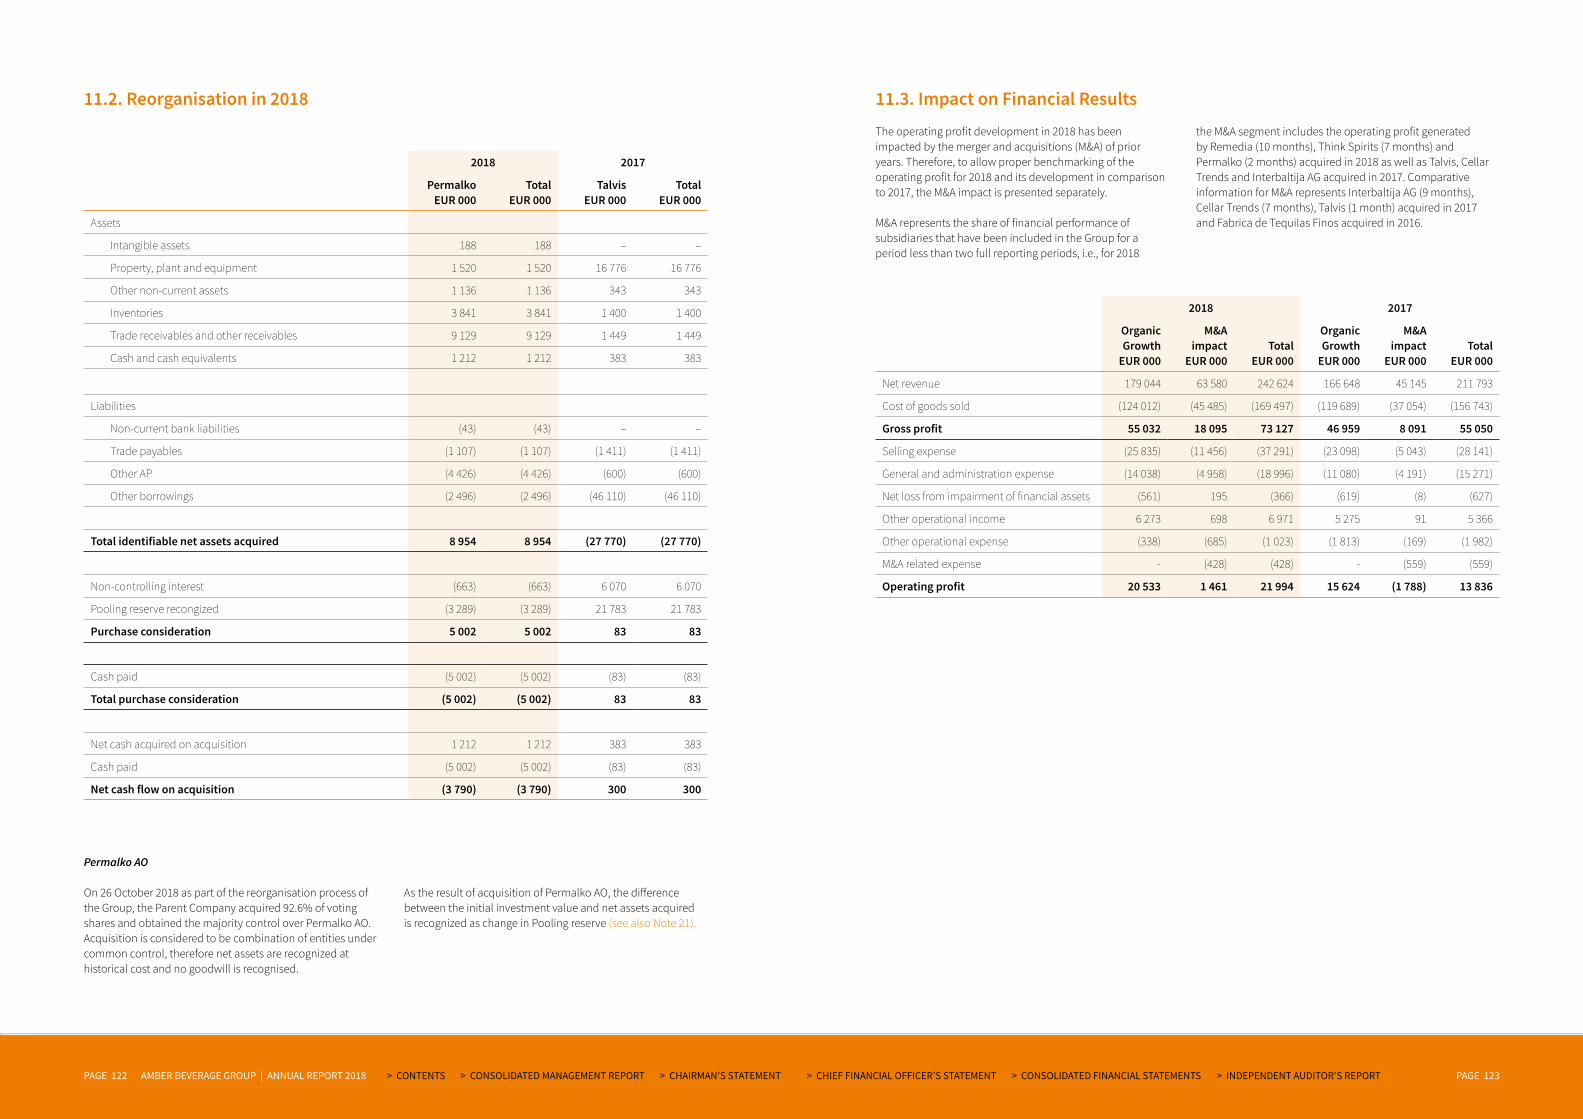
11.2. Reorganisation in 2018 11.3. Impact on Financial Results
The operating profit development in 2018 has been impacted by the merger and acquisitions (M&A) of prior years. Therefore, to allow proper benchmarking of the operating profit for 2018 and its development in comparison to 2017, the M&A impact is presented separately.
M&A represents the share of financial performance of subsidiaries that have been included in the Group for a period less than two full reporting periods, i.e., for 2018
the M&A segment includes the operating profit generated by Remedia (10 months), Think Spirits (7 months) and Permalko (2 months) acquired in 2018 as well as Talvis, Cellar Trends and Interbaltija AG acquired in 2017. Comparative information for M&A represents Interbaltija AG (9 months), Cellar Trends (7 months), Talvis (1 month) acquired in 2017 and Fabrica de Tequilas Finos acquired in 2016.
Permalko AO
On 26 October 2018 as part of the reorganisation process of the Group, the Parent Company acquired 92.6% of voting shares and obtained the majority control over Permalko AO. Acquisition is considered to be combination of entities under common control, therefore net assets are recognized at historical cost and no goodwill is recognised.
As the result of acquisition of Permalko AO, the difference between the initial investment value and net assets acquired is recognized as change in Pooling reserve (see also Note 21).
2018 2017
Organic Growth
EUR 000
M&A impact
EUR 000Total
EUR 000
Organic Growth
EUR 000
M&A impact
EUR 000Total
EUR 000
Net revenue 179 044 63 580 242 624 166 648 45 145 211 793
Cost of goods sold (124 012) (45 485) (169 497) (119 689) (37 054) (156 743)
Gross profit 55 032 18 095 73 127 46 959 8 091 55 050
Selling expense (25 835) (11 456) (37 291) (23 098) (5 043) (28 141)
General and administration expense (14 038) (4 958) (18 996) (11 080) (4 191) (15 271)
Net loss from impairment of financial assets (561) 195 (366) (619) (8) (627)
Other operational income 6 273 698 6 971 5 275 91 5 366
Other operational expense (338) (685) (1 023) (1 813) (169) (1 982)
M&A related expense - (428) (428) - (559) (559)
Operating profit 20 533 1 461 21 994 15 624 (1 788) 13 836
2018 2017
PermalkoEUR 000
TotalEUR 000
TalvisEUR 000
TotalEUR 000
Assets
Intangible assets 188 188 – –
Property, plant and equipment 1 520 1 520 16 776 16 776
Other non-current assets 1 136 1 136 343 343
Inventories 3 841 3 841 1 400 1 400
Trade receivables and other receivables 9 129 9 129 1 449 1 449
Cash and cash equivalents 1 212 1 212 383 383
Liabilities
Non-current bank liabilities (43) (43) – –
Trade payables (1 107) (1 107) (1 411) (1 411)
Other AP (4 426) (4 426) (600) (600)
Other borrowings (2 496) (2 496) (46 110) (46 110)
Total identifiable net assets acquired 8 954 8 954 (27 770) (27 770)
Non-controlling interest (663) (663) 6 070 6 070
Pooling reserve recongized (3 289) (3 289) 21 783 21 783
Purchase consideration 5 002 5 002 83 83
Cash paid (5 002) (5 002) (83) (83)
Total purchase consideration (5 002) (5 002) 83 83
Net cash acquired on acquisition 1 212 1 212 383 383
Cash paid (5 002) (5 002) (83) (83)
Net cash flow on acquisition (3 790) (3 790) 300 300
AMBER BEVERAGE GROUP | ANNUAL REPORT 2018 > CONTENTS > CONSOLIDATED MANAGEMENT REPORT > CONSOLIDATED FINANCIAL STATEMENTS> CHAIRMAN’S STATEMENT > CHIEF FINANCIAL OFFICER’S STATEMENT > INDEPENDENT AUDITOR’S REPORTPAGE 122 PAGE 123

12. Intangible Assets
The Group main categories of intangible assets accounted by the Group are goodwill, trademarks and respective registration costs and computer software and licences. The following accounting policies are used for accounting of these assets.
(a) Goodwill
Goodwill on acquisition of subsidiaries is included in intangible assets. Separately recognized goodwill is tested annually for impairment and carried at cost less accumulated impairment losses. Impairment losses on goodwill are not reversed. Gains and losses on the disposal of an entity include the carrying amount of goodwill of the entity sold.
Goodwill is allocated to cash-generating units for the purpose of impairment testing. The allocation is made to those cash-generating units or groups of cash-generating units that are expected to benefit from the business combination in which the goodwill arose.
(b) Trademarks and trademark registration costs
Trademarks are recognized at purchase price including expenses incidental thereto or at production cost. Trademarks have indefinite useful life. Trademark registration expenses across the world are treated as intangible assets and are presented as part of other intangible assets. Such expenses are capitalized based on invoices and amortized over a period of three years by using straight-line method.
(c) Computer software and licences
Internal as well as external costs associated with developing or maintaining computer software programmes are recognized as an expense as incurred. Acquired computer software licences are capitalized on the basis of the costs incurred to acquire and bring to use the specific software. These costs are amortized over their estimated useful lives of three to five years.
Impairment of non-financial assets
Assets that have an indefinite useful life, are not subject to amortisation and are tested annually for impairment.
Assets that are subject to amortisation are reviewed for impairment whenever events or changes in circumstances indicate that the carrying amount may not be recoverable. An impairment loss is recognised for the amount by which the asset’s carrying amount exceeds its recoverable amount. The recoverable amount is the higher of an asset’s fair value less costs to sell and value in use. For the purposes of assessing impairment, assets are grouped at the lowest levels for which there are separately identifiable cash flows (cash-generating units). Non-financial assets other than goodwill that suffered an impairment are reviewed for possible reversal of the impairment at each reporting date.
Goodwill arising through business combinations and brand have been allocated for impairment testing purposes to five cash-generating units (CGU) based on the core functional activity and the ownership of intellectual property. This represents the lowest level within the Group at which goodwill and brand are monitored for internal management purposes.
Cash generating units
The Group has identified the cash generating units, used in the impairment review of intangible assets with indefinite lives, to be for production units (grain and agave) and distribution units (Baltics, the UK and Australia). Impairment test is performed separately for Moskovskaya® trademark.
GoodwillEUR 000
BrandsEUR 000
Conces-sions,
licences and other
intangi-ble assets
EUR 000
Advances for in-
tangible assets
EUR 000Total
EUR 000
As at 31.12.2016
Cost value 22 618 14 778 3 178 78 40 652
Accumulated amortisation – – (1 203) – (1 203)
Net book value 22 618 14 778 1 975 78 39 449
2017
Additions 9 346 2 072 850 32 12 300
Disposals – – (24) – (24)
Acquired through business combination (Note 11.1) – – 26 – 26
Reclassification – – 10 (10) –
Amortisation – – (686) – (686)
Total 31 964 16 850 2 151 100 51 065
As at 31.12.2017
Cost value 31 964 16 850 3 937 100 52 851
Accumulated amortisation and impairment – – (1 786) – (1 786)
Net book value 31 964 16 850 2 151 100 51 065
2018
Additions 5 799 – 537 411 6 747
Acquired through business combination (Note 11.1) – – 17 – 17
Acquired through reorganisation of the Group (Note 11.2) – 188 – – 188
Amortisation – (25) (838) – (863)
FX differences (1 053) 100 (41) – (994)
Reclassification – 35 53 (88) –
Total 36 710 17 148 1 879 423 56 160
As at 31.12.2018
Cost value 36 710 17 172 4 464 423 58 769
Accumulated amortisation and impairment – (24) (2 585) – (2 609)
Net book value 36 710 17 148 1 879 423 56 160
AMBER BEVERAGE GROUP | ANNUAL REPORT 2018 > CONTENTS > CONSOLIDATED MANAGEMENT REPORT > CONSOLIDATED FINANCIAL STATEMENTS> CHAIRMAN’S STATEMENT > CHIEF FINANCIAL OFFICER’S STATEMENT > INDEPENDENT AUDITOR’S REPORTPAGE 124 PAGE 125

Segment level summary of goodwill is presented as following:
The following table sets out the key assumptions for those CGUs that have significant goodwill allocated to them:
The trademark portfolio is presented as following:
Impairment review
Assessment of the recoverable amount of an intangible asset, the useful economic life of an asset, or that an asset has an indefinite life, requires management estimate and judgement. Impairment reviews are carried out to ensure that intangible assets, including trademarks, are not carried at above their recoverable amounts. The tests are dependent on management’s estimates and judgements, in particular in relation to the forecasting of future cash flows, the discount rates applied to those cash flows and the expected long-term growth rates. Such estimates and judgements are subject to change as a result of changing economic conditions and actual cash flows may differ from forecasts.
The Group tests whether goodwill and the book value of trade-marks have suffered any impairment on an annual basis. The
management has identified six cash generated units (CGUs) – Production Grain, Production Agave, Distribution Baltics, Distribu-tion the United Kingdom (UK), Distribution Australia (AUS). Trade-mark Moskovskaya® is treated as separate CGU for impairment test purposes.
For the 2018 and previous reporting periods, the recoverable amount of the CGUs was determined based on value-in-use calculations which require the use of assumptions. The calculations use cash flow projections based on financial budgets approved by management covering a three-year period. Cash flows beyond the three-year peri-od are extrapolated using the estimated growth rates stated below. These growth rates are consistent with forecasts included in industry reports specific to the industry in which each CGU operates.
12/31/2018EUR 000
12/31/2017 EUR 000
12/31/2016EUR 000
Production grain 5 935 5 935 5 935
Production agave 5 594 6 008 6 008
Distribution Baltics 12 312 12 312 10 675
Distribution UK 7 312 7 710 –
Distribution AUS 5 557 – –
Total: 36 710 31 965 22 618
12/31/2018EUR 000
12/31/2017EUR 000
12/31/2016EUR 000
Moskovskaya 14 778 14 778 14 778
KAH 1 666 1 555 –
Other brands 704 517 –
Total: 17 148 16 850 14 778
Production Distribution Trademark
2018 Grain Agave Baltics UK AUS Moskovskaya®
Sales volume growth, % 1 9 2,3 2 5 46
Sales price growth, % (0,3) 0,0 0,7 1,2 (0) (5,2)
EBITDA margin, % 12 4 6 3 5 n/a
Replacement CAPEX 3 041 – 1 202 – – n/a
Discount Rate 10% 13,0% 10,0% 10,0% 10,0% 10,4%
Terminal value growth 2,5% 2,0% 2,5% 2,5% 2,5% 2,5%
Profit margin base growth – – – – – 93,7
Production Distribution Trademark
2017 Grain Agave Baltics UK AUS Moskovskaya®
Sales volume growth, % 2 8 2 2 n/a 3
Sales price growth, % 2 5,3 2 2 n/a 2
EBITDA margin, % 14 7 5 4 n/a –
Replacement CAPEX 1 623 – 681 – n/a –
Discount Rate 10% 13,4% 10,0% 10,0% n/a 10,4%
Terminal value growth 2,5% 3,5% 2,5% 2,5% n/a 2,5%
Profit margin base growth – – – – – 33
Key assumptions used in the value-in-use calculations are as following:
• Sales volume – Average annual growth rate over the five-year forecast period; based on past performance and management’s expectations of market development.
• Sales price– small annual percentage increases assumed in all markets based on historic data;
• Growth in spirits market – assumed to be static or slightly declining in all markets based on recent historic trends;
• Growth in tequila market – assumed to be growing up to 9% per annum for next 5 years in all markets based on recent historic trends;
• Raw material cost – assumed to be at average industry cost;
• Agave price inflation – 10% annual percentage increase for next 5 years assumed based on recent market research data;
• Market share – through Group companies specific actions outlined in detailed internal plans, market share to be grown overall;
• Annual capital expenditure – Expected cash costs in the CGUs. This is based on the historical experience of management, and the planned refurbishment expenditure. No incremental revenue or cost savings are assumed in the value-in-use model as a result of this expenditure.
• Discount rates – rates reflect the current market assessment of the risks specific to each operation. The discount rate was estimated based on an average guideline of companies adjusted for the operational size of the Group and specific regional factors;
• The assumed growth rate used to extrapolate cash flows beyond the forecast period reflects management expectation and takes into consideration growth achieved to date, current strategy and expected spirits market growth.
Sensitivity to change in key assumptions
Impairment testing for the year ended 31 December 2018 has identified the following cash-generating units as being sensitive to reasonably possible changes in assumptions:
The recoverable amount of Production Agave CGU is estimated to exceed the carrying value by EUR 755 thousand. The recoverable amount of this CGU would equal its carrying amount if the key assumptions were to change as following:
• Average EBITDA margin would decrease from 4% to 3%• Discount rate would increase from 13% to 14.25%• Long-term growth rate would decrease from 2% to 0% It remains possible that changes in assumptions could arise in excess of those indicated before.
For all intangibles with an indefinite life, other than the cash generating units in the table above, the Management has concluded that no reasonable possible change in the key assumptions on which it has determined the recoverable amounts would cause their carrying values to exceed their recoverable amounts.
AMBER BEVERAGE GROUP | ANNUAL REPORT 2018 > CONTENTS > CONSOLIDATED MANAGEMENT REPORT > CONSOLIDATED FINANCIAL STATEMENTS> CHAIRMAN’S STATEMENT > CHIEF FINANCIAL OFFICER’S STATEMENT > INDEPENDENT AUDITOR’S REPORTPAGE 126 PAGE 127

13. Property, Plant and Equipment
Recognition and measurement
Items of property, plant and equipment (PPE) are measured at cost less accumulated depreciation and accumulated impairment losses.
Cost includes expenditure that is directly attributable to the acquisition of the asset. The cost of self-constructed assets includes the cost of materials and direct labour, any other costs directly attributable to bringing the assets to a working condition for their intended use, and capitalised borrowing costs. Purchased software that is integral to the functionality of the related equipment is capitalised as part of that equipment.
Subsequent costs are included in the asset’s carrying amount or recognised as a separate asset, as appropriate, only when it is probable that future economic benefits associated with the item will flow to the Group and the cost of the item can be measured reliably. The carrying amount of the replaced part is derecognised. All other repairs and maintenance are charged to the statement of comprehensive income during the financial period in which they are incurred.
Gains and losses on disposal of an item of property, plant and equipment are determined by comparing the proceeds from disposal with the carrying amount of property, plant and equipment, and are recognised net within other income in statement of comprehensive income.
Depreciation
Depreciation is calculated over the depreciable amount, which is the cost of an asset, or other amount substituted for cost, less its residual value. Depreciation is recognised in statement of comprehensive income on a straight-line basis over the estimated useful lives of each part of an item of property, plant and equipment, since this most closely reflects the expected pattern of consumption of the future economic benefits embodied in the asset.
The following useful lives are used in the calculation of depreciation:
Buildings and their components: 10 – 71 years Machinery and equipment: 2 – 25 years Other tangible assets: 2 – 25 years
Leased assets are depreciated over the shorter of the lease term and their useful lives unless it is reasonably certain that the Group will obtain ownership by the end of the lease term. Freehold land is not depreciated.
Properties in the course of construction for production, supply or administrative purposes are carried at cost, less any recognised impairment loss. Depreciation of these assets, on the same basis as other property assets, commences when the assets are ready for their intended use.
Depreciation methods, useful lives and residual values are reviewed at each financial year-end and adjusted if appropriate. Impairment losses are recognised as an expense in the statement of comprehensive income.
Gains and losses on disposals are determined by comparing the proceeds with the carrying amount and are recognized in the consolidated statement of comprehensive income within “Other operational income” or “Other operational expense” respectively.
Impairment of non-financial assets
Assets that are subject to amortisation are reviewed for impairment whenever events or changes in circumstances indicate that the carrying amount may not be recoverable. An impairment loss is recognised for the amount by which the asset’s carrying amount exceeds its recoverable amount. The recoverable amount is the higher of an asset’s fair value less costs to sell and value in use. For the purposes of assessing impairment, assets are grouped at the lowest levels for which there are separately identifiable cash flows (cash-generating units). Non-financial assets other than goodwill that suffered an impairment are reviewed for possible reversal of the impairment at each reporting date.
Land and
buildingsEUR 000
Machinery and equip-
mentEUR 000
Other PPE
EUR 000
Leasehold improve–
mentsEUR 000
Construc-tion in
progressEUR 000
Advances for PPE
EUR 000Total
EUR 000
As at 12/31/2016
Cost value 41 037 22 388 7 849 216 2 970 151 74 611
Accumulated depreciation and impairment (14 194) (19 448) (5 339) (26) (875) – (39 882)
Net book value 26 843 2 940 2 510 190 2 095 151 34 729
2017
Additions 29 1 399 88 2 871 590 3 978
Disposals – (56) (306) – 22 – (340)
Acquired through business combination (Note 11.1) – 342 142 – – – 484
Acquired through reorganisa-tion of the Group (Note 11.2) 14 394 2 245 94 – 43 – 16 776
Reclassification 1 222 2 681 (194) 11 (3 178) (542) –
FX differences (7) 239 (4) – – – 228
Depreciation (2 060) (1 935) (22) (54) – – (4 071)
Total 40 421 6 457 2 619 235 1 853 199 51 784
As at 12/31/2017
Cost value 56 675 27 280 7 619 315 2 728 199 94 816
Accumulated depreciation and impairment (16 254) (20 823) (5 000) (80) (875) – (43 032)
Net book value 40 421 6 457 2 619 235 1 853 199 51 784
2018
Additions 57 2 217 293 72 3 840 16 6 495
Disposals (21) (177) (30) (3) (543) – (774)
Reclassification 748 3 292 (611) – (4 588) (197) (1 356)
Acquired through business combination (Note 11.1) 922 394 100 – – – 1 416
Acquired through reorganisa-tion of the Group (Note 11.2) 887 310 38 – 285 – 1 520
FX differences (2 070) (307) (22) – (5) – (2 404)
Depreciation (2 574) (1 809) (679) (65) – – (5 127)
Reversal of impairment – – – – 96 – 96
Total 38 370 10 377 1 708 239 938 18 51 554
As at 12/31/2018
Cost value 57 119 32 059 7 053 372 1 717 18 98 338
Accumulated depreciation and impairment (18 749) (21 682) (5 345) (133) (779) – (46 688)
Net book value 38 370 10 377 1 708 239 938 18 51 650
AMBER BEVERAGE GROUP | ANNUAL REPORT 2018 > CONTENTS > CONSOLIDATED MANAGEMENT REPORT > CONSOLIDATED FINANCIAL STATEMENTS> CHAIRMAN’S STATEMENT > CHIEF FINANCIAL OFFICER’S STATEMENT > INDEPENDENT AUDITOR’S REPORTPAGE 128 PAGE 129

The gross carrying value of fully depreciated property, plant and equipment that is still in use is EUR 22 632 thousand (2017: EUR 22 832 thousand).
Fixed assets of the Group with the net book value of EUR 21.5 million as at 31.12.2018 (2017: EUR 34 million) are pledged under the conditions of the Mortgage and Commercial
pledge agreements as the security for loans from the credit institutions (see Note 17).
The Group has acquired several assets during the finance lease transactions. The net book value of these assets as at 31 December 2018 is EUR 2 244 thousand (31.12.2017: EUR 2 244 thousand; 31.12.2016: EUR 1 675 thousand).
Investment properties consists of several land plots and commercial buildings in Riga, Latvia, which are held for rental income generation purposes. The fair value of investment properties is estimated to be EUR 2 011 thousand (2017: EUR 1 850 thousand). The fair value in 2018 was assessed by independent valuation expert.
Direct income in amount of EUR 156 thousand (2017: EUR 39 thousand) and direct expense in amount of EUR 118 thousand (2017: EUR 39 thousand) from rent of investment property was recognised in the statement of comprehensive income.
2018EUR 000
2017EUR 000
Opening balance 664 684
Reclassification 1 352 –
Depreciation (104) (20)
Closing balance 1 912 664
Inventories
Inventories are stated at the lower of cost and net realisable value. Net realisable value is the estimated selling price in the ordinary course of business, less the estimated costs of com-pletion and selling expenses. When the net realisable value of inventories is lower than its cost, provisions are created to reduce the value of inventories to its net realisable value.
The cost of inventories is based on the first-in-first-out method and includes expenditure incurred in acquiring the inventories and bringing them to their existing location and condition. In the case of manufactured inventories and work in progress, cost includes an appropriate share of production overheads based on normal operating capacity.
Trade receivables
Trade receivables are amounts due from customers for merchandise sold or services performed in the ordinary course of business. If collection is expected in one year or
less, they are classified as current assets. If not, they are presented as non-current assets.
Trade receivables are recognised initially at invoiced amount and subsequently measured at amortised cost using the effective interest method, less provision for impairment. Provisions are recognized according to simplified approach of expected credit loss method.
Trade payables
Trade payables are obligations to pay for goods or services that have been acquired in the ordinary course of business from suppliers. Accounts payable are classified as current liabilities if payment is due within one year or less. If not, they are presented as non-current liabilities.
Trade payables are carried at cost which is the fair value of the consideration to be paid in the future for goods and services received, billed to the Group, unless the effect of discounting is material.
14. Investment Properties
15. Working Capital
Investment properties are land, buildings or part of buildings held by the Group to earn rentals or for capital appreciation rather than use in the production or supply of goods or services or for administrative purposes or sale in the ordinary course of business and are not occupied by the Group. Investment properties is initially recognised at acquisition cost. Subsequently investment properties
is carried at their cost less any accumulated depreciation and any accumulated impairment losses. The depreciation is calculated using the straight-line method. Applied depreciation rates are based on estimated useful life set for respective asset categories. The useful lives are reviewed, and adjusted if appropriate, at each end of the financial year.
15.1. Inventories
12/31/2018EUR 000
12/31/2017EUR 000
12/31/2016EUR 000
Raw materials 16 940 15 467 13 760
Finished goods and merchandize 42 869 39 683 29 711
Production in progress 6 389 3 394 2 993
Goods on the way 2 451 481 1 641
Other 657 300 8
Provisions for obsolete stock (2 046) (2 044) (1 601)
Total 67 260 57 281 46 512
Inventories of the Group with the book value as of 31.12.2018 of 62 million (31.12.2017: EUR 51 million) are pledged in accordance with the terms of Commercial
pledge agreements as the security for loans from the credit institutions (see Note 17).
AMBER BEVERAGE GROUP | ANNUAL REPORT 2018 > CONTENTS > CONSOLIDATED MANAGEMENT REPORT > CONSOLIDATED FINANCIAL STATEMENTS> CHAIRMAN’S STATEMENT > CHIEF FINANCIAL OFFICER’S STATEMENT > INDEPENDENT AUDITOR’S REPORTPAGE 130 PAGE 131

12/31/2018EUR 000
12/31/2017EUR 000
12/31/2016EUR 000
Gross trade receivables 81 290 63 679 42 885
Allowance for doubtful debts (2 230) (1 058) (1 490)
Net trade receivables 79 060 62 621 41 395
Receivables from related parties 24 571 20 155 18 439
Other debtors and prepayments 7 896 1 464 2 176
Total 111 527 84 240 62 010
Information about major customers
Concentration of credit risk of Trade receivables with the customers of similar characteristics as at 31 December 2018 is 18% (31.12.2017: 22%; 31.12.2016: 31%).
Receivables from related party represent debt of S.P.I. Spirits (Cyprus), as Latvijas balzams is manufacturing alcoholic beverages for S.P.I. Spirits (Cyprus), based on Private label agreement in relation to Stolichnaya trademark.
Trade receivables with the book value as at 31.12.2018 of EUR 62 million (31.12.2017: EUR 48 million; 31.12.2016: 43 million) of the Group are pledged under the conditions of the Commercial pledge agreements as the security for loans from the credit institutions (see Note 17).
15.2. Trade and Other Receivables
15.3. Taxes Payable
15.4. Trade and Other Payables
12/31/2018EUR 000
12/31/2017EUR 000
12/31/2016EUR 000
Excise tax 30 239 18 582 15 200
Value added tax 6 474 5 172 3 917
Corporate income tax 433 2 146 128
Other 3 833 1 191 868
Total 40 979 27 091 20 113
12/31/2018EUR 000
12/31/2017EUR 000
12/31/2016EUR 000
Trade payables 39 595 36 303 22 173
Accrued expense 8 162 4 391 2 117
Payables to related parties 3 005 3 368 2 453
Vacation reserve 1 735 1 602 1 282
Contingent consideration 3 991 12 167 –
Salaries payable 1 081 936 914
Advances received 82 221 100
Deferred income 69 104 21
Other payables 223 901 127
Total 57 943 59 993 29 187
Out of that:
Non-current 50 – –
Current 57 893 59 993 29 187
AMBER BEVERAGE GROUP | ANNUAL REPORT 2018 > CONTENTS > CONSOLIDATED MANAGEMENT REPORT > CONSOLIDATED FINANCIAL STATEMENTS> CHAIRMAN’S STATEMENT > CHIEF FINANCIAL OFFICER’S STATEMENT > INDEPENDENT AUDITOR’S REPORTPAGE 132 PAGE 133

Risk Management and Capital Structure
This section sets out the policies and procedures applied to manage the group’s
capital structure and the financial risks the group is exposed to. ABG considers the
following components of its balance sheet to be capital: borrowings and equity.
ABG manages its capital structure to achieve capital efficiency, provide flexibility
to invest through the economic cycle and give efficient access to debt markets at
attractive cost levels.
16. Risk Management
The Group’s activity is exposed to various financial risks, including credit risk, currency risk and interest rate risk. The Management of the Group considers and adopts risk management policy for each of the risk. The Group’s
management regularly carries out financial risk assessment and monitoring in order to reduce the negative impact of financial risks on the Group’s performance.
16.1. Interest Rate Risk
The following table demonstrates the sensitivity to a reasonably possible change in interest rates on the Group’s floating rate loans and borrowings which at the end of 31 December 2018 are not hedged. With all other variables
being constant the Group’s profit before tax is affected through the impact on floating rate borrowings as follows:
12/31/2018EUR 000
12/31/2017EUR 000
12/31/2016EUR 000
Financial liabilities at floating rate 38 929 24 281 23 858
Total 38 929 24 281 23 858
Effect on profit before tax
Currency of the borrowingChange in basis
points2018
EUR 0002017
EUR 000
EUR +30 92 73
-30 (92) (73)
RUB +30 9 –
-30 (9) –
AUD +30 12 –
-30 (12) –
The assigned movement in basis points for interest rate sensitivity analysis is based upon the currently observable market environment.
The Group cash balances are held in bank and earn
immaterial levels of interest. Management has concluded that reasonable changes in the EURIBOR rates will have an immaterial impact on interest income earned on the Group cash balances. No interest rate sensitivity has been included in relation to the Group’s cash balances.
16.2. Market Risk
Market risk is the risk that the fair value of future cash flows of a financial instrument will fluctuate because of changes in market prices. The Group’s exposure is primarily to the financial risks of changes in foreign currency exchange rates
and interest rates. Financial instruments affected by market risk include loans and borrowings and derivative financial instruments (see also Note 17).
16.3. Sensitivity Analysis
The Parent Company recognises that movements in certain risk variables (such as interest rates or foreign exchange rates) might affect the value of its derivatives and also the amounts recorded in its equity and its statement of comprehensive income for the period. Therefore, the Parent Company has assessed:
• What would be reasonably possible changes in the risk variables at the end of the reporting period;
• The effects on statement of comprehensive income and equity, if such changes in the risk variables were to occur (see also Note 16.1 and 16.4).
16.4. Foreign Currency Risk
The Group operates internationally and is exposed to foreign currency risk arising mainly from the U.S. dollars, Australian dollars, Russian rubles, pounds Sterling and Mexican pesos fluctuations resulting from purchase of raw materials and consumables.
The Group’s significant open currency position at the end of the reporting period is:
12/31/2018Units 000
12/31/2017Units 000
12/31/2016 Units 000
Financial assets in RUB 1 031 775 171 781 –
Financial liabilities in RUB (191 891) (488 065) (1 214)
Open position in RUB, net 839 884 (316 284) (1 214)
Open position in RUB calculated in EUR, net 10 536 (4 558) (19)
Financial assets in USD 1 645 891 5 495
Financial liabilities in USD (1 828) (1 033) (1 389)
Open position in USD, net (183) (142) 4 106
Open position in USD calculated in EUR, net (160) (136) 3 924
AMBER BEVERAGE GROUP | ANNUAL REPORT 2018 > CONTENTS > CONSOLIDATED MANAGEMENT REPORT > CONSOLIDATED FINANCIAL STATEMENTS> CHAIRMAN’S STATEMENT > CHIEF FINANCIAL OFFICER’S STATEMENT > INDEPENDENT AUDITOR’S REPORTPAGE 134 PAGE 135

12/31/2018Units 000
12/31/2017Units 000
12/31/2016 Units 000
Financial assets in GBP 10 605 9 839 –
Financial liabilities in GBP (8 624) (15 060) (6)
Open position in GBP net 1 981 (5 221) (6)
Open position in GBP calculated in EUR, net 2 215 (5 885) (7)
Financial assets in MXN 35 462 25 299 1 781
Financial liabilities in MXN (44 873) (34 092) –
Open position in MXN net (9 411) (8 793) –
Open position in MXN calculated in EUR, net (418) (372) 82
Financial assets in AUD 7 577 – –
Financial liabilities in AUD (1 545) – –
Open position in AUD net 6 032 – –
Open position in AUD calculated in EUR, net 3 719 – –
The following table demonstrates the sensitivity to a reasonably possible change in currency rates on outstanding financial assets and liabilities. With all other variables held constant, the Group’s profit before tax is affected as follows:
2018 2017
Change in currency rate
Effect on equity, EUR 000
Change in currency rate
Effect on equity, EUR 000
RUB +10% (958) +10% 414
-10% 1 171 -10% (506)
USD +10% 15 +10% 13
-10% (18) -10% (15)
GPB +10% (202) +10% 535
-10% 246 -10% (653)
MXN +10% 38 +10% 34
-10% (47) -10% (41)
AUD +10% (338) n/a –
-10% 413 n/a –
16.5. Credit Risk
Credit risk is the risk that a counter-party will not meet its obligations under a financial instrument or customer contract, leading to a financial loss. The Group is exposed to credit risk from its operating activities (primarily for trade receivables) and from its financing activities, foreign exchange transactions and other financial instruments.
The Group has the following financial assets that are subject to the expected credit loss model: • trade receivables for sales of finished goods and providing of services; • loans to related parties.
While cash and cash equivalents are also subject to the impairment requirement of IFRS 9, the identified impairment loss was immaterial. Impairment loss related to intercompany loans and receivables is considered to the immaterial as the cash-flow is managed at the Group level.
Trade receivables
The Group applies the IFRS 9 simplified approach to measuring expected credit losses which uses lifetime expected loss allowance for all trade receivables. To measure the expected credit losses, trade receivables have been grouped based on shared credit risk characteristics and the days past due. The expected loss rates are based on the payment profiles of sales over a period of 36 month before 31 December 2018 or 1 January 2018 respectively and the corresponding historical credit losses experienced within this period. The historical loss rates are adjusted to reflect current and forward-looking information on macroeconomic factors affecting the ability of the customers to settle the receivables. On that basis, the loss allowance as at 31 December 2018 and 1 January 2018 (on adoption of IFRS 9) was determined for trade receivables, as follows:
31 December 2018 Total Not due 1-90 91-180 181-270 270-360 361-
Gross carrying amount - Trade receivables 81 290 63 814 14 819 749 113 61 1 734
Expected loss rate 0,30% 0,75% 10% 50% 100% 100%
Loss allowance 2 230 192 111 75 57 61 1 734
1 January 2018 Total Not due 1-90 91-180 181-270 270-360 361-
Gross carrying amount – Trade receivables 63 679 46 688 14 925 969 115 268 714
Expected loss rate 0,30% 0,75% 10% 50% 100% 100%
Loss allowance 1 388 139 112 97 58 268 714
2018 EUR 000
2017 EUR 000
31 December – calculated under IAS 39 1 058 1 490
Amounts restated through opening retained earnings 330 -
Opening loss allowance as at 1 January 2018 – calculated under IFRS 9 1 388 1 490
Acquired through business combination 1 212 194
Increase in loss allowance recognized in profit or loss during the year 333 277
Receivables written off during the year as uncollectible (356) (474)
FX adjustment (75) –
Unused amounts reversed (272) (429)
At 31 December 2018 2 230 1 058
AMBER BEVERAGE GROUP | ANNUAL REPORT 2018 > CONTENTS > CONSOLIDATED MANAGEMENT REPORT > CONSOLIDATED FINANCIAL STATEMENTS> CHAIRMAN’S STATEMENT > CHIEF FINANCIAL OFFICER’S STATEMENT > INDEPENDENT AUDITOR’S REPORTPAGE 136 PAGE 137

Trade receivables are written off when there is no reasonable expectation of recovery. Indicators that there is no reasonable expectation of recovery include legal assessment and customer’s existence. Impairment losses
on trade receivables are presented as net impairment losses within operating profit. Subsequent recoveries of amounts previously written off are credited against the same line item.
Previous accounting policy for impairment of trade receivables
A provision for impairment is established when there is objective evidence that the Group will not be able to collect all amounts according to the original terms of receivables. Significant financial difficulties of the debtor, probability that the debtor will enter bankruptcy or financial reorganization, and default or delinquency in payments are considered
indicators that the trade receivable is impaired. The amount of the impairment is the difference between the asset’s carrying amount and the present value of estimated future cash flows, discounted at the original effective interest rate. Impairment loss is recognised in the statement of comprehensive income.
16.6. Liquidity Risk
Liquidity risk is the risk that the Group will not be able to meet its financial obligations as they fall due. The Group manages liquidity risk by maintaining adequate cash reserves and borrowing facilities, by continuously monitoring forecast and actual cash flows and matching the maturity profiles of financial assets and liabilities.
The table below summarises the maturity profile of the Group’s undiscounted financial liabilities at 31 December 2018.
As at 31 December 2018 the Group has further EUR 13 340 thousand (31.12.2017: EUR 11 835 thousand; 31.12.2016: EUR 6 071 thousand) of undrawn facilities available under the terms of credit line agreements with financial institutions.
12/31/2017
Financial liabilities
Less than 1 year
EUR 000
Between 2 and 5 years
EUR 000
More than 5 years
EUR 000Total
EUR 000
Interest bearing loans and borrowings (Note 17) 29 602 18 560 4 807 52 969
Interest payable 1 207 2 560 228 3 995
Finance leases (Note 18) 594 828 – 1 422
Derivatives – 49 – 49
Trade and other payables 39 892 – – 39 892
Total: 71 295 21 997 5 035 98 327
12/31/2016
Financial liabilities
Less than 1 year
EUR 000
Between 2 and 5 years
EUR 000
More than 5 years
EUR 000Total
EUR 000
Interest bearing loans and borrowings (Note 17) 18 839 21 921 31 40 791
Interest payable 652 560 – 1 212
Finance leases (Note 18) 594 828 – 1 422
Derivatives – 134 – 134
Trade and other payables 24 627 – – 24 627
Total: 44 712 23 443 31 68 186
12/31/2018
Financial liabilities
Less than 1 year
EUR 000
Between 2 and 5 years
EUR 000
More than 5 years
EUR 000Total
EUR 000
Interest bearing loans and borrowings (Note 17) 35 310 25 321 29 60 660
Interest payable 1 756 1 813 1 3 570
Finance leases (Note 18) 815 2 047 – 2 863
Derivatives – 175 – 175
Trade and other payables 84 690 – – 84 690
Total: 122 572 29 356 30 151 958
16.7. Fair Value Measurement
Management assessed that cash and cash equivalents, trade receivables, loans issued, trade payables and other current liabilities approximate their carrying amounts largely due to the short-term maturities of these instruments.
The carrying amounts of the Group’s financial instruments are a reasonable approximation of their fair values.
Fair value hierarchy
The Group uses the following hierarchy for determining and disclosing the fair value of financial instruments by valuation technique:
• Level 1: quoted (unadjusted) prices in active markets for identical assets or liabilities.
• Level 2: other techniques for which all inputs which have a significant effect on the recorded fair value are observable, either directly or indirectly.
• Level 3: techniques which use inputs which have a significant effect on the recorded fair value that are not based on observable market data.
All Group’s financial assets and financial liabilities can be classified in Level 3 of fair value hierarchy. Except for cash, which can be classified in Level 2. The fair value of financial assets and financial liabilities approximates to their book value.
AMBER BEVERAGE GROUP | ANNUAL REPORT 2018 > CONTENTS > CONSOLIDATED MANAGEMENT REPORT > CONSOLIDATED FINANCIAL STATEMENTS> CHAIRMAN’S STATEMENT > CHIEF FINANCIAL OFFICER’S STATEMENT > INDEPENDENT AUDITOR’S REPORTPAGE 138 PAGE 139

16.8 Financial Assets and Financial Liabilities
12/31/2018EUR 000
12/31/2017EUR 000
12/31/2016EUR 000
Financial assets
Financial assets at amortised costs
Trade receivables 103 631 80 610 59 834
Loans to related parties 24 485 27 781 39 405
Other assets 2 632 2 553 -
Other receivables 3 802 2 575 1 702
Cash and cash equivalents 4 048 4 166 4 360
Total 138 598 117 685 105 301
Financial liabilities
Liabilities at amortized cost
Trade and other payables 98 853 86 981 49 294
Loans from credit institutions 55 140 35 891 40 735
Loans from related parties 5 521 17 087 61
Finance lease liabilities 2 863 1 470 1 379
Derivative financial instruments
Used for hedging 175 49 134
Total 162 552 141 478 91 603
Current interest-bearing loans and borrowings
Interest rate % Maturity
12/31/2018EUR 000
12/31/2017EUR 000
12/31/2016EUR 000
Obligations under finance lease contracts (Note 18) 831 557 586
Bank overdrafts – Luminor EONIA + 2.05% 12/31/2019 21 921 11 192 11 554
Bank overdrafts – Swedbank 3M EURIBOR + 2% 06/30/2019 2 518 1 889 1
Bank overdrafts – Sberbank MosPrime 3M+1.11% 08/11/2019 641 – –
Bank overdrafts – OTP bank MosPrime 1M+0.7% 08/23/2020 2 509 – –
Bank overdrafts – Scotpac 1M BBSY + 4% 05/16/2019 4 090 – –
Bank overdrafts – Royal Bank of Scotland 3% 10/14/2019 2 734 – –
EUR 7.9m bank loan – Swedbank (Latvijas balzams) 3М EURIBOR + 2.20% 5/31/2021 1 392 4 808 5 940
EUR 8.9m bank loan – Luminor (Latvijas balzams)2 1М EURIBOR + 2.2% 12/31/2023 – 1 795 1 795
EUR 5m bank loan – Luminor (Amber Distribution Latvia)2 1M EURIBOR +2.50% 12/31/2023 – 1 017 1 017
EUR 0.6m bank loan – Luminor (Amber Distribution Latvia)2 3M EURIBOR + 2.50% 12/31/2023 – 85 84
EUR 1m bank loan – Luminor (Amber Distribution Latvia)2 3M EURIBOR + 2.50% 12/31/2023 – 143 143
EUR 12m bank loan – Luminor (Amber Beverage Group)2 3M EURIBOR + 2.3% 9/30/2021 – 2 363 2 363
EUR 4,9m bank loan – Swedbank AB (Bennet Distributors)1 3M EURIBOR + 2.2% 5/8/2018 – 3 081 714
EUR 2,9m bank loan – Swedbank AS (Bennet Distributors)1 3M EURIBOR + 2.2% 5/31/2021 980 – –
EUR 1m bank loan – Luminor (Amber Beverage Group)2 3M EURIBOR + 2.3% 3/31/2022 – 205 –
Accrued interest on bank loans – 9 –
Loans from related parties (EUR) 3% 12/31/2020 12 6 30
Loans from related parties (MXN) 15% 12/31/2019 1 023 676 –
Total current interest–bearing loans and borrowings 38 651 27 826 24 227
Borrowings are recognised initially at fair value, net of transaction costs incurred. Borrowings are subsequently carried at amortised cost; any difference between the proceeds (net of transaction costs) and the redemption value is recognised in statement of comprehensive income over the period of the borrowings using the effective interest method.
General and specific borrowing costs directly attributable to the acquisition, construction or production of qualifying assets, which are assets that necessarily take a substantial period of time to get ready for their intended
use or sale, are added to the costs of those assets, until such time as the assets are substantially ready for their intended use or sale. Borrowings are classified as current liabilities unless the Group has an unconditional right to defer settlement of the liability for at least 12 months after the end of the reporting period. In case of breach of covenants, the related borrowings are classified as current although their contractual maturity may exceed 12 months from the reporting date.
17. Borrowings
AMBER BEVERAGE GROUP | ANNUAL REPORT 2018 > CONTENTS > CONSOLIDATED MANAGEMENT REPORT > CONSOLIDATED FINANCIAL STATEMENTS> CHAIRMAN’S STATEMENT > CHIEF FINANCIAL OFFICER’S STATEMENT > INDEPENDENT AUDITOR’S REPORTPAGE 140 PAGE 141

Non-current interest-bearing loans and borrowings
Interest rate % Maturity
12/31/2018EUR 000
12/31/2017EUR 000
12/31/2016EUR 000
Obligations under finance lease contracts (Note 18) 2 032 913 793
EUR 12m bank loan – Luminor (Amber Beverage Group)2 3M EURIBOR + 2.3% 9/30/2021 – 6 499 8 862
EUR 1m bank loan – Luminor (Amber Beverage Group)2 3M EURIBOR + 2.3% 3/31/2022 – 665 –
EUR 8.9m bank loan – Luminor (Latvijas balzams)2 1М EURIBOR + 2.2% 12/31/2023 1 346 898 2 693
EUR 7.9m bank loan – Swedbank (Latvijas balzams) 3М EURIBOR + 2.20% 5/31/2021 2 089 – –
EUR 1m bank loan – Luminor (Amber Distribution Latvia)2 3M EURIBOR + 2.50% 12/31/2023 500 464 607
EUR 0.6m bank loan – Luminor (Amber Distribution Latvia)2 3M EURIBOR + 2.50% 12/31/2023 292 270 356
EUR 5m bank loan – Luminor (Amber Distribution Latvia)2 1M EURIBOR +2.50% 12/31/2023 763 508 1 525
EUR 4,9m bank loan – Swedbank AB (Bennet Distributors)1 3M EURIBOR + 2.2% 5/8/2018 – – 3 081
EUR 2,9m bank loan – Swedbank AS (Bennet Distributors)1 3M EURIBOR + 2.2% 5/31/2021 1 434 – –
EUR 7m bank loan – Luminor (Amber Beverage Group Holding)2 3M EURIBOR + 2.3% 12/31/2023 7 089 – –
EUR 1.5m bank loan – Luminor (Amber Beverage Group Holding)2 3M EURIBOR + 2.3% 12/31/2023 1 556 – –
EUR 3.6m bank loan – Luminor (Amber Beverage Group Holding)2 3M EURIBOR + 2.3% 12/31/2023 3 286 – –
Loans from related parties (EUR) 3% 12/31/2020 – 5 428 31
Loans from related parties (RUB) 6-11% 12/31/2020 4 273 6 388 –
Loans from related parties (USD) 1.575% 12/22/2025 28 – –
Loans from related parties (GBP) 7,25% 12/29/2022 184 4 589 –
Total non-current interest-bearing loans and borrowings 24 872 26 622 17 948
Total interest-bearing loans and borrowings 63 523 54 448 42 175
1 In April 2018 Bennet Distributors refinanced its borrowing from
Swedbank AB (Lithuania) to Swedbank AS (Latvia) and extended the
maturity period of the borrowing until 31 May 2021.
2 In December 2018 the Group restructured its short-term and long-term
borrowings from Luminor Bank AS Latvian branch. According to that the
group overdraft, as well as loans obtained for acquisition of Fabrica de
Tequilas Finos, Interbaltija AG and Think Spirit by Amber Beverage Group
SIA were transferred to the Parent Company. In addition, the maturity
date and repayment schedule for these loans and other borrowings
received from Luminor Bank AS Latvian branch by other entities of the
Group were prolonged until 31 December 2023.
Fulfilment of the Group’s liabilities is secured and enforced by:
(i) The mortgage of largest part of real estate owned by the Group;
(ii) Commercial pledge of All Group’s movable property (except items owned by Talvis AO, Permalko AO, and Cellar Trends Limited) as aggregation of property on the date of pledging as well as future aggregation of property;
(iii) All pledged shares of the Parent Company and subsidiaries, and any other shares that may be acquired in the future.
The Group is subject to certain covenants related primary to its borrowings from Luminor Bank AS Latvian branch, Swedbank AS and banks in Russia. Non-compliance with such covenants may result in negative consequences for the Group including increase of applied interest rates. According to estimations by the Management as at 31 December 2018 and 31 December 2017 the Group has complied with all the covenants.
Leases are classified as finance leases whenever the terms of the lease transfer substantially all the risks and rewards of ownership to the lessee. All other leases are classified as operating leases.
The Group as lessee
Assets held under finance leases are initially recognised as assets of the Group at their fair value at the inception of the lease or, if lower, at the present value of the minimum lease payments. The corresponding liability to the lessor is included in the consolidated statement of financial position as a finance lease obligation.
Lease payments are apportioned between finance expenses and reduction of the lease obligation so as to achieve a constant rate of interest on the remaining balance of the liability. Finance expenses are recognised immediately in statement of comprehensive income, unless they are directly attributable to qualifying assets, in which case they are capitalised in accordance with the Group’s general policy on borrowing costs. Contingent
rentals are recognised as expenses in the periods in which they are incurred.
Operating lease payments are recognised as an expense on a straight-line basis over the lease term, except where another systematic basis is more representative of the time pattern in which economic benefits from the leased asset are consumed. Contingent rentals arising under operating leases are recognised as an expense in the period in which they are incurred.
In the event that lease incentives are received to enter into operating leases, such incentives are recognised as a liability. The aggregate benefit of incentives is recognised as a reduction of rental expense on a straight-line basis, except where another systematic basis is more representative of the time pattern in which economic benefits from the leased asset are consumed.
18. Finance Lease Liabilities
AMBER BEVERAGE GROUP | ANNUAL REPORT 2018 > CONTENTS > CONSOLIDATED MANAGEMENT REPORT > CONSOLIDATED FINANCIAL STATEMENTS> CHAIRMAN’S STATEMENT > CHIEF FINANCIAL OFFICER’S STATEMENT > INDEPENDENT AUDITOR’S REPORTPAGE 142 PAGE 143

19. Capital Management
The Group’s management manages the capital structure on going concern basis. During the reporting period there were no changes in capital management objectives, policies or processes to ensure capital sufficiency, the management of the Group proposes to leave the profit of reporting period not distributed.
The Group’s management controls the net debt to equity (gearing ratio). During the reporting the gearing ratio is 39% (31.12.2017: 37%; 31.12.2016: 30%) and ratio equity to total assets is 47% (31.12.2017: 48%; 31.12.2016: 54%).
Minimum lease
payments12/31/2018
EUR 000
Present value of
minimum lease
payments12/31/2018
EUR 000
Minimum lease
payments12/31/2017
EUR 000
Present value of
minimum lease
payments12/31/2017
EUR 000
Minimum lease
payments12/31/2016
EUR 000
Present value of
minimum lease
payments12/31/2016
EUR 000
Amounts payable under finance leases:
Within one year 881 831 579 557 594 586
In the second to fifth year inclusive 2 099 2 032 936 913 828 793
Over five years – – – – – –
2 980 2 863 1 515 1 470 1 422 1 379
less future finance charges (117) – (45) – (43) –
Present value of minimum lease payments 2 863 2 863 1 470 1 470 1 379 1 379
Less amounts included in current liabilities (831) (557) (586)
Amounts included in non-current liabilities 2 032 913 793
12/31/2018EUR 000
12/31/2017EUR 000
12/31/2016EUR 000
Cash and cash equivalents 4 048 4 166 4 360
Interest bearing loans and borrowings (60 660) (52 978) (40 796)
Financial leases (2 863) (1 470) (1 379)
Total net debt (59 475) (50 282) (37 815)
Cash and cash
equiva-lents
EUR 000
Finance lease due
after 1 year
EUR 000
Finance lease due
within 1 year
EUR 000
Borrowings due after
1 yearEUR 000
Borrowings due within
1 yearEUR 000
TotalEUR 000
Net debt as at 31 December 2016 4 360 (793) (586) (17 155) (23 641) (37 815)
Cash flows (1 638) – (748) – 18 728 16 342
New leases and borrowings – (838) – (1 040) (11 000) (12 878)
Other non-cash movement 1 444 718 777 (7 514) (11 356) (15 931)
Net debt as at 31 December 2017 4 166 (913) (557) (25 709) (27 269) (50 282)
Cash flows (1 567) – (945) (10 000) (19 299) (31 811)
New leases and borrowings – (2 369) – (4 560) (7 903) (14 832)
Other non-cash movement 1 449 1 250 671 17 428 16 651 37 449
Net debt as at 31 December 2018 4 048 (2 032) (831) (22 841) (37 820) (59 476)
20. Share Capital and Share Premium
The Parent Company Amber Beverage Group Holding S.à r.l. was established on 26 September 2017. The share capital of the Parent Company as at 31 December 2018 is EUR 12 500 (31.12.2017: EUR 12 500) and consists of 12 500 shares with par value of EUR 1 each. Share capital has been fully paid. As the result of Group reorganization started in 2017 and finalized in 2018, the shareholders of the Parent Company have contributed the share premium in amount of EUR 132 million.
As at 31.12.2016 (before the reorganisation) the share capital of the Parent Company Amber Beverage Group SIA is EUR 104 536 523, consisting of 104 536 523 shares with par value of EUR 1 each.
21. Pooling Reserve
In 2017 the Group acquired majority shareholding in Tambovskoye spirtovoye predpriyatye “Talvis” AO from the related party S.P.I. Production B.V. (70.95%) and minority shareholder (1.91%). As the transaction was treated as part of SPI Group reorganisation, the assets and liabilities were accounted at their book values on the date of acquisition.
In 2018 the Group acquired majority shareholding in Permalko AO from the related party S.P.I. Production B.V.
(92.6%). As the transaction was treated as part of SPI Group reorganisation, the assets and liabilities were accounted at their book values on the date of transaction.
See details of pooling reserve calculation in Note 11.2.
AMBER BEVERAGE GROUP | ANNUAL REPORT 2018 > CONTENTS > CONSOLIDATED MANAGEMENT REPORT > CONSOLIDATED FINANCIAL STATEMENTS> CHAIRMAN’S STATEMENT > CHIEF FINANCIAL OFFICER’S STATEMENT > INDEPENDENT AUDITOR’S REPORTPAGE 144 PAGE 145

22. Non-Controlling Interest
2018EUR 000
2017EUR 000
Opening balance 4 575 9 617
Acquired through reorganisation of the Group (Note 11.2) 663 (6 069)
Current period charge to statement of comprehensive income 1 150 1 027
Settlement against dividends (93) –
Closing balance 6 295 4 575
Other Financial Information
This section includes additional financial information that are either required by
the relevant accounting standards or management considers these to be material
information for shareholders.
23. Operating Lease Commitments
The Group has concluded several agreements for the operating lease of assets. Total lease payments made for the reporting year are EUR 2 545 thousand (2016: EUR 1 955 thousand).
According to the signed lease agreements, the Group has the following non-cancellable lease liabilities:
24. Commitments and Contingencies
12/31/2018EUR 000
12/31/2017EUR 000
12/31/2016EUR 000
Payable in 1 year 1 411 1 479 1 463
Payable in 2-5 years 289 544 824
Total 1 700 2 023 2 287
24.1. Guarantees Issued
The Group entity - Latvijas balzams AS - has issued a guarantee to Luminor Bank AS Latvian branch for the related company S.P.I. Spirits (Cyprus) Ltd of EUR 13.2 million, resulting from Overdraft agreement signed in July 2007. The guarantee is valid until the fulfilment of all overdraft contract obligations and the deadline is defined as 30 June 2019. S.P.I. Spirits (Cyprus) Limited pays a guarantee fee in
amount equal to the annual interest rate of 6.3% of the used overdraft amount.
Taking into account the financial position of the SPI Group companies it is not expected that the Group shall fulfil the warranty or guarantee obligation, as a result no provisions have been recognised in the financial statements.
24.2. Guarantees Received
In 2018 the Group entity - Bennet Distributors UAB - has changed the security for excise tax payment to State Revenue Authority of Republic of Lithuania from previously used guarantee issued by Swedbank AB to insurance agreement with AAS BTA. The previously issued guarantee by Swedbank AB was ceased on 8 February 2018.
In 2015 Luminor Bank AS Latvian Branch has issued two guaranties to the Group entities Latvijas balzams AS and Amber Distribution Latvia SIA for total maximal amount of EUR 783 thousand. The applied interest rate is EONIA + 2.05%, maturity date – 31.12.2019.
AMBER BEVERAGE GROUP | ANNUAL REPORT 2018 > CONTENTS > CONSOLIDATED MANAGEMENT REPORT > CONSOLIDATED FINANCIAL STATEMENTS> CHAIRMAN’S STATEMENT > CHIEF FINANCIAL OFFICER’S STATEMENT > INDEPENDENT AUDITOR’S REPORTPAGE 146 PAGE 147

24.3. Trademark Related
Moskovskaya case
SPI Group is the owner of a number of world-famous vodka trademarks (sometimes also referred to as “Soviet vodka brands”) in most countries of the world. One of the key “Soviet brands” in the trademark portfolio of the Group is Moskovskaya®. The history of Moskovskaya® trademark goes back to the Soviet times, namely, to the 1960s-70s, when the Soviet State Enterprise SOJUZPLODOIMPORT, under instructions of the USSR Ministry of Foreign Trade, started to commercialize Russian vodka around the world, mainly STOLICHNAYA and MOSKOVSKAYA®.
In order to facilitate and protect such business, the trademark Moskovskaya® was registered in a number of countries in the world (including in the USSR) in the name of aforementioned Soviet State Enterprise SOJUZPLODOIMPORT.
Due to the liberalization of the Soviet economy, which was the result of the famous “PERESTROYKA”, the management of SOJUZPLODOIMPORT was instructed by the competent USSR authority to convert the State Enterprise into a private entity. Such transformation started in September 1990 and ended in January 1992. The transformation procedure was initiated with the mutual consent of the competent USSR authority and the employees of SOJUZPLODOIMPORT and was conducted in accordance with applicable law.
As a result of the transformation initiated in September 1990, the Soviet State Enterprise SOJUZPLODOIMPORT was converted into the private entity ( joint stock company) with the same name, and in January 1992 the Joint Stock Company SOJUZPLODOIMPORT was duly registered as the legal successor of Soviet State Enterprise SOJUZPLODOIMPORT.
As the legal successor of Soviet State Enterprise SOJUZPLODOIMPORT, the Joint Stock Company SOJUZPLODOIMPORT inherited all assets of the former, including the worldwide trademark portfolio which included MOSKOVSKAYA® trademark registrations.
It should be noted that both the USSR and the Russian Federation state authorities were well aware of SOJUZPLODOIMPORT’s transformation into the private entity and not only consented, but also actively assisted in the worldwide promotion of Soviet vodka brands by the joint stock company SOJUZPLODOIMPORT. None of those authorities ever questioned validity of the transformation of the state enterprise, as well as its successor’s title to the trademarks worldwide. Moreover, on a number occasions Russian State authorities directly and indirectly confirmed validity of title of Joint Stock Company SOJUZPLODOIMPORT to the trademarks. This was the case until 2000.
In 1997 a group of investors acquired the controlling shareholding in the Joint Stock Company
SOJUZPLODOIMPORT. Later, SPI Group was created and SOJUZPLODOIMPORT became a part of this group.
The new shareholders invested considerable resources into the company and conducted its restructuring. The IP portfolio was also restructured and divided between the Russian and the Dutch companies of SPI Group.
In 2000, a campaign was initiated at the top level of the Russian government for the re-nationalization of the Soviet vodka brands lawfully owned by SPI Group. As part of this campaign the Russian national registrations of the Soviet brands were seized for the benefit of the Russian Federation and (after more than eight years of acquiescence and recognition of its validity by the Russian authorities) the transformation of the State enterprise SOJUZPLODOIMPORT into the private company was declared void in Russia.
It should be noted than neither SPI Group, nor its shareholders participated in the allegedly invalid transformation of the State enterprise SOJUZPLODOIMPORT into the private company. Private company SOJUZPLODOIMPORT was acquired in 1997, more than 5 years after the allegedly void transformation of the State enterprise SOJUZPLODOIMPORT into the private entity was concluded.
Since 2003, a state enterprise of the Russian Federation named FKP (Federal Treasury Enterprise) SOJUZPLODOIMPORT has claimed recognition of its ownership of Soviet vodka brands owned by SPI Group in a number of jurisdictions. SPI is actively defending those lawsuits.
Amber Beverage Group, through its subsidiary, holds the title for MOSKOVSKAYA® trademark registrations in various jurisdictions, a number of which are subject to ongoing disputes.
Austria: In August 2014 the Regional Court of Linz, Austria, rendered a decision in a case filed by FKP in 2005 by which the court ordered the trademarks in Austria to be transferred to FKP. This decision was reversed by the appeals court in December 2014 and FKP appealed to the Cassation Court of Austria which ordered the appeals court to consider the possible binding effect of the Dutch decisions. On February 5, 2018, the appeals court ruled in favor of SPI. The appeals court held that the Dutch decisions had no binding effect in Austria and went on to criticize the Dutch courts’ approach, finding that the Dutch courts: a) wrongly found that an invalidity of the Russian privatization would not be subject to any limitation period, b) ignored the fact that the privatization had been accepted by all parties for years until political power in Russia changed in 1999/2000, and c) ignored considerations on the merits of Russian limitation law. FKP appealed to the Austrian Supreme Court, which decided in June 2018 to return the case to the appeals court for further consideration. On September 5, 2018, the
Appeals Court issued a decision negative to SPI. SPI filed an extraordinary appeal on October 8, 2018. On December 20, 2018, the Austrian Supreme Court decided to stay the proceedings until there is a final judgment in the Dutch proceedings.
Lebanon: In 2011, SPI was successful in defending its trademark in Lebanon, both in the first instance and on appeal. FKP’s appeal to the cassation court remains pending.
Australia: In Australia, a motion to stay the proceedings was filed by SPI as a result of the Russian Federation’s failure to provide discovery. On November 20, 2017 the Federal Court of Australia ordered that the case be stayed until further notice. The Court confirmed that the Russian Federation was the “real plaintiff” in the proceeding, and suspended the case unless the Russian Federation produces documents that it has been withholding for years. The Russian Federation did not produce the relevant documents by the deadline of November 30, 2018, and SPI is seeking formal dismissal of FKP’s claim.
Armenia: In July 2014, FKP filed a claim against the trademark registrar in Armenia seeking cancellation of the Stolichnaya trademarks there. In February 2019, the Administrative Court fully rejected FKP’s claims and found that FKP does not have legal standing to present a claim against SPI. FKP may appeal this decision.
Greece: In July 2014, SPI received a decision in its favour in the Athens Court of First Instance in respect of a claim filed by FKP to terminate SPI’s rights to the Stolichnaya
and Moskovskaya trademarks. In the meantime, FKP filed a new lawsuit in Greece in December 2015 seeking acknowledgment of the res judicata of the judgments of the Russian court and The Hague Court of Appeals and seeking declaration of ownership of the dispute trademarks. There was a hearing in March 2018 and a decision is expected in 2019.
Vietnam: In April 2014, SPI was informed that certain international registrations in Vietnam had been transferred to FKP. As a result, the SPI cannot currently sell its products in that market. SPI believes such a transfer was illegal and is challenging the action and sales in Vietnam have stopped pending resolution.
The Netherlands: In March 2015, the court rendered a decision, the result of which was the cancellation of the contested Benelux trademarks and/or their transfer to FKP. The court also ordered SPI to cease the use of the trademark STOLI in Benelux. SPI filed an appeal and FKP filed a cross-appeal. In January 2018 the appellate court ordered SPI to provide a report regarding the Benelux sales of Stolichnaya and Moskovskaya in order to determine the amount of damages that will have to be paid by Spirits International B.V. The January 2018 judgment is being appealed to the Dutch Supreme Court and a hearing before the Dutch Supreme Court was held in January 2019. A decision is currently expected in 2019. In July 2018 FKP initiated preliminary relief proceedings. The preliminary relief judge ordered Spirits to provide a bank guarantee in the amount of EUR 6 million, subject to a proceeding on the merits to analyze the report on Benelux sales.
24.4. Lawsuit Related
Ierosme case
In 2015 the Groups subsidiary Latvijas balzams AS carried out a reorganization by way of merger with Daugavgrivas 7 SIA. Daugavgrivas 7 SIA was a defendant in the lawsuit against Interjeru iekārtošanas un restaurācijas firma “Ierosme” SIA. The claim relates to construction work done for a total amount of EUR 248 thousand, including fines and interest. Daugavgrivas 7 SIA has filed the counter claim for the compensation of losses for the total amount of EUR 882 thousand. Latvijas balzams joined as a defendant in the lawsuit against Interjeru iekārtošanas un restaurācijas firma “Ierosme” SIA as a limited liability company Daugavgrivas 7 legal successor.
On 14 October 2016 the Latvian Supreme Court ruled Interjeru iekārtošanas un restaurācijas firma “Ierosme” SIA claim against Latvijas balzams for debt of EUR 111 thousand and the amount of penalty of EUR 75 thousand of the recovery, and Latvijas balzams counterclaim against Interjeru iekārtošanas un restaurācijas firma “Ierosme” SIA
for damages of EUR 882 thousand and offsetting and judged to dismiss both claims.
On 19 January 2017 Interjeru iekārtošanas un restaurācijas firma “Ierosme” SIA has appealed a cassation with request to set aside the judgment in relation to rejection of Latvijas balzams debt and penalty recovery and refer the case for retrial. The hearing date is not known yet. The outcome of the case is not clearly stated at this moment, but according to the managements assessments it will be in favor of Latvijas balzams. The financial statements include provisions for the principal amount, but the potential penalties and statutory interest, which could arise from the negative result of the lawsuit, have not been recognized.
AMBER BEVERAGE GROUP | ANNUAL REPORT 2018 > CONTENTS > CONSOLIDATED MANAGEMENT REPORT > CONSOLIDATED FINANCIAL STATEMENTS> CHAIRMAN’S STATEMENT > CHIEF FINANCIAL OFFICER’S STATEMENT > INDEPENDENT AUDITOR’S REPORTPAGE 148 PAGE 149

Break Cigarillos case
In 2015 subsidiary of the Group - Bennet Distributors UAB - has received notice from Lithuanian tax authorities, concerning “Break Blue” and “Break Original” cigarillos. In the Tax authority inspection certificate, it was stated that based on the conclusions of the examination reports the tobacco products “Break Original” and “Break Blue” are not considered as cigarillos, as products do not match the description of cigarillos (the outer wrapper of the natural tobacco does not cover them in full, including their filters), but should be considered cigarettes. State Tax Inspectorate recommended Bennet to declare and to pay the excise duty for the tobacco products (“Break Blue” and “Break Original”) according to the excise rate applied to cigarettes, which would imply obligation to pay additional EUR 627 thousand of excise duty.
Bennet has informed the producer of the Break Blue” and “Break Original” products - Scandinavian Tobacco Group of the situation. Scandinavian Tobacco Group assured Bennet Distributors that cigarillos BREAK are cigarillos and they clearly meet the definition of cigars and cigarillos stated under applicable regulations and assured that this fact was supported with court decisions in other countries.
On 23 July 2015 tax authorities issued a decision obliging Bennet Distributors to pay the tax difference. Bennet Distributors has appealed against this decision to the Commission on Tax Disputes, which after evaluating the situation cancelled the first decision of the tax authorities. The tax authorities filed an appeal about the latter decision of the Commission on Tax Disputes to court. The court hearings are pending.
Liepaja fire case
SIA “Amber Distribution Latvia” is a distributor of Red Bull products in the territory of Latvia. As distributor Amber Distribution Latvia has carried out marketing activities including, inter alia, placing of POS materials (including refrigerators) owned and supplied by Red Bull GmbH in “Maxima” stores, owned by Maxima Latvija SIA retail chain. One of the refrigerators was placed in Maxima retail store located at XL sala shopping centre 62 Klaipedas street, Liepaja, Latvia.
On late August 21, 2016 fire incident took place in that retail store, resulting in damages done by fire, smoke and soot to Maxima and several other retail stores located at XL sala shopping centre. Maxima`s insurer, Compensa has started a legal action against Amber Distribution Latvia in Daugavpils court, claiming the amount of EUR 918 329,18 (insurance indemnity paid to Maxima Latvija SIA) in this case. Claim is
based on experts conclusions and opinion regarding cause of fire. According to said conclusions, most probable place of origin of fire was on the place where Red Bull refrigerator was placed and most probable cause of fire was damage in electrical installation.
Amber Distribution Latvia does not see strong evidences that fire started particularly in Red Bull refrigerator or any other reasons why Amber Distribution Latvia could be held responsible for the fire. Therefore Amber Distribution Latvia does not recognize Compensa claim in full and finds it groundless. The case has not yet been examined at first instance.
The parties are considered related when one party has a possibility to control the other one or has significant influence over the other party in making financial and operating decisions. Related parties of the Parent company are subsidiaries, associates and shareholders who could control or who have significant influence over the Parent company in accepting operating business decisions, key management personnel of the Parent company including members of Supervisory Board and close family members of any above-mentioned persons, as well as entities over which those persons have a control or significant influence.
Balances and transactions between the Parent Company and its subsidiaries, which are related to the Parent Company, have been eliminated on consolidation and are not disclosed in this note. Details of transactions between the Group and other related parties (related through the S.P.I. Group S.à.r.l.) are disclosed below.
The main shareholder of the Group, which owns 94% of shares of the Parent Company is S.P.I. Group S.à.r.l. which is incorporated in Luxembourg and its majority shareholder is Mr. Yuri Shefler.
25. Related Party Transactions
25.1. Trading Transactions
Outstanding balances at the year-end are unsecured and interest free and settlement occurs in cash. There have been no guarantees provided or received for any related party receivables or payables. For the year ended 31 December 2018, the Group has not recorded any impairment of
receivables relating to amounts owed by related parties (2017: nil; 2016: nil). This assessment is undertaken each financial year through examining the financial position of the related party and the market in which the related party operates.
Amounts owed by related parties Amounts owed to related parties
12/31/2018EUR
12/31/2017EUR
12/31/2016EUR
12/31/2018EUR
12/31/2017EUR
12/31/2016EUR
Parent Company 493 – – 33 – –
Other related parties 24 078 20 155 18 439 2 971 3 368 2 452
Total controlled by the Ultimate controlling party 24 571 20 155 18 439 3 004 3 368 2 452
Sale of services and goods Purchase of services and goods
2018EUR 000
2017EUR 000
2018EUR 000
2017EUR 000
Parent Company 44 – 2 –
Other related parties 48 194 52 439 5 512 3 262
Total controlled by the Ultimate controlling party 48 238 52 439 5 514 3 262
AMBER BEVERAGE GROUP | ANNUAL REPORT 2018 > CONTENTS > CONSOLIDATED MANAGEMENT REPORT > CONSOLIDATED FINANCIAL STATEMENTS> CHAIRMAN’S STATEMENT > CHIEF FINANCIAL OFFICER’S STATEMENT > INDEPENDENT AUDITOR’S REPORTPAGE 150 PAGE 151

25.2. Loans From and To Related Parties
12/31/2018EUR 000
12/31/2017EUR 000
12/31/2016EUR 000
Loans to related parties
Issued to Parent company
Non-current portion 23 329 27 385 39 403
Current portion 806 – –
Total: 24 135 27 385 39 403
Issued to other related companies
Non-current portion 129 343 –
Current portion 221 53 2
Total: 350 396 –
Total loans to reated parties 24 485 27 781 39 405
Loans from related parties
Received from Parent company
Non-current portion 184 9 990 –
Current portion – 1 –
Totals: 184 9 991 –-
Received from other related companies
Non-current portion 4 301 6 415 31
Current portion 1 035 681 30
Total: 5 336 7 096 61
Total loans to reated parties 5 520 17 087 61
Loans to and from related parties have been issued to and received from related parties within SPI Group. The non-cur-rent loans issued to related parties are not secured and are maturing in 2022-2025. The Group has applied fixed interest rate of 3%-7% (2017: 3%) for the long-term loans issued deter-mined based on Transfer Pricing study. Current portion of loans to related parties mainly consists of accrued interest on long term loans.
The long-term loans from related parties term is maturing in 2022-2025, with fixed interest rate of 3%-11%. The short-term loans from related parties are maturing in 2019, with fixed interest rate of 15%.
25.3. Compensation to Key Management Personnel
2018EUR 000
2017EUR 000
Short-term employee benefits 2 078 1 559
Social security costs 421 377
Total 2 499 1 936
The key management represents the statutory representatives, including proxies and members of Supervisory Board of the Group.
26. Cash and Cash Equivalents
Cash and cash equivalents include cash in hand, deposits held at call with banks, other short-term highly liquid investments with original maturities of
three months or less. Bank overdrafts are shown within borrowings in current liabilities on the statement of financial position.
12/31/2018EUR 000
12/31/2017EUR 000
12/31/2016EUR 000
Cash at bank 3 780 3 728 3 988
Petty cash 2 1 1
Cash in shops 111 168 297
Cash in transit 155 269 74
Total 4 048 4 166 4 360
AMBER BEVERAGE GROUP | ANNUAL REPORT 2018 > CONTENTS > CONSOLIDATED MANAGEMENT REPORT > CONSOLIDATED FINANCIAL STATEMENTS> CHAIRMAN’S STATEMENT > CHIEF FINANCIAL OFFICER’S STATEMENT > INDEPENDENT AUDITOR’S REPORTPAGE 152 PAGE 153

27. Group Information
ABG was formed in 2014 after reorganization of Baltic Business Unit of SPI Group. From 2014 till 2017 the Parent Company and the holding company of the ABG was Amber Beverage Group SIA.
In 2017 the next phase of reorganization was started, that resulted in incorporation of Amber Beverage Group S.à r.l. and transferring the holding functions to the new establishment. In consolidated financial statements this reorganization is accounted as transaction under common control.
1 Cellar Trends Limited is 100% owned by Cellar Trends Holding Limited
2 On 16 May 2018 the Parent company started the acquisition process of
Australian distributor of alcoholic beverages Think Spirits Pty Ltd. by
acquiring 90% of share capital of the Company.
3 The control over producer of alcoholic beverages Permalko AO was
acquired through the reorganization of the Group and on 26 October
2018 and is treated as common control transaction in these consolidated
financial statements.
4 100% of share capital of Estonian producer of alcoholic beverages
Remedia AS was acquired on 20 February 2018.
5 Until 29 December 2017 Amber Beverage Group SIA was the holding
company of ABG Group
6 The 40% of share capital of Cellar Trends Holding Limited was acquired
on 12 April 2017. In 2018 the acquisition process was continued by
acquiring 30% of share capital of Cellar Trends Holding Ltd.
7 ADL IP SIA was established on 22 December 2016 with a purpose to
manage intellectual property owned by the Group. On 30 November 2017
the liquidation process of the company was initiated. On 20 July 2018 the
liquidation was finished, and the Company was deregistered from the
Commerce Register of Latvia
Name Principal activities
Country of in-corporation/ operations
% Equity interest
2018
% Equity interest
2017
Amber Distribution Latvia SIA Distribution Latvia 100% 100%
Amber Distribution Estonia OU Distribution Estonia 100% 100%
Bennet Distributions UAB Distribution Lithuania 100% 100%
Interbaltija AG AS Distribution Latvia 100% 100%
Cellar Trends Limited 1 Distribution the UK 70% 40%
Think Spirits Pty Ltd 2 Distribution Australia 90% –
Latvijas balzams AS Production of alcoholic beverages Latvia 89.99% 89.99%
Tambovskoye spirtovoye predpiyatyie Talvis AO Rectification of ethyl alcohol Russia 72.87% 72.87%
Fabrica de Tequilas Finos, S.A. De C.V. Production of alcoholic beverages Mexico 100% 100%
Permalko AO 3 Production of alcoholic beverages Russia 92.6% –
Remedia AS 4 Production of alcohol beverages Estonia 100% –
Bravo SIA Retail sales Latvia 100% 100%
Amber Beverage Group SIA 5 Management services Latvia 100% 100%
Amber IP Brands S.à r.l. IP management Luxemburg 100% 100%
Amber Beverage Group UK Limited Holding activities the UK 100% 100%
Cellar Trends Holding Limited 6 Holding activities the UK 70% 40%
ADL IP SIA 7 Dormant Latvia – 100%
28. Other Accounting Policies
The principal accounting policies adopted in the preparation of these consolidated financial statements are set out below. These policies have been consistently applied, unless otherwise stated.
Revenue from contracts with customers
The Group is in the business of production and distribution of alcoholic beverages. Revenue from contracts with customers is recognised when control of the goods are transferred to the customer at an amount that reflects the consideration to which the Group expects to be entitled in exchange for those goods or services. The Group has generally concluded that it is the principal in its revenue arrangements because it typically controls the goods before transferring them to the customer.
Sale of finished goods
Revenue from sale of finished goods is recognised at the point in time when control of the asset is transferred to the customer, generally on delivery of the finished goods. The normal credit term is 30 to 90 days upon delivery.
In determining the transaction price for the sale of finished goods, the Group considers the effects of variable consideration.
(i) Variable consideration
If the consideration in a contract includes a variable amount, the Group estimates the amount of consideration to which it will be entitled in exchange for transferring the goods to the customer. The variable consideration is estimated at contract inception and constrained until it is highly probable that a significant revenue reversal in the amount of cumulative revenue recognised will not occur when the associated uncertainty with the variable consideration is subsequently resolved. Some contracts for the sale of finished goods provide customers with volume rebates and rights to return that gives rise to variable consideration.
• Volume rebates
The Group provides retrospective volume rebates to certain customers once the quantity of products purchased during the period exceeds a threshold specified in the contract. Rebates are offset against amounts payable by the customer. To estimate the variable consideration for the expected future rebates, the Group applies the most likely amount method for contracts with a single-volume. The selected method best predicts the amount of variable consideration is primarily driven by the number of volume thresholds contained in the contract. The Group then applies the requirements on constraining estimates of variable consideration and recognises reduction of revenues.
• Rights of return
Certain contracts in specific jurisdictions provide a customer with a right to return the goods within a specified period. The Group uses the expected value method to estimate the goods that will not be returned because this method best predicts the amount of variable consideration to which the Group will be entitled. The requirements in IFRS 15 on constraining estimates of variable consideration are also applied in order to determine the amount of variable consideration that can be included in the transaction price. For goods that are expected to be returned, instead of revenue, the Group recognises a refund liability. A right of return asset (and corresponding adjustment to cost of sales) is also recognised for the right to recover products from a customer.
(ii) Contract assets - Trade receivables
A receivable represents the Group’s right to an amount of consideration that is unconditional (i.e., only the passage of time is required before payment of the consideration is due). Refer to accounting policies of financial assets in Section 11 Financial instruments.
Revenue from providing of services
Revenue from providing of services (mainly logistic services) is recognized in the accounting period in which the services are rendered in the amount to which the Group has a right to invoice. Customers are invoiced on monthly basis and consideration is payable when invoiced.
Financing components
The Group does not expect to have any contracts where the period between the transfer of the promised goods or services to the customer and payment by the customer exceeds one year. As a consequence, the Group does not adjust any of the transaction prices for the time value of money.
Financial assets
(i) Classification
From 1 January 2018, the Group classifies its financial assets in the following measurement categories:
• those to be measured subsequently at fair value (either through OCI or through profit or loss), and
• those to be measured at amortised cost.
The classification depends on the entity’s business model for managing the financial assets and the contractual terms of the cash flows.
AMBER BEVERAGE GROUP | ANNUAL REPORT 2018 > CONTENTS > CONSOLIDATED MANAGEMENT REPORT > CONSOLIDATED FINANCIAL STATEMENTS> CHAIRMAN’S STATEMENT > CHIEF FINANCIAL OFFICER’S STATEMENT > INDEPENDENT AUDITOR’S REPORTPAGE 154 PAGE 155

For assets measured at fair value, gains and losses will either be recorded in profit or loss or OCI. For investments in equity instruments that are not held for trading, this will depend on whether the Group has made an irrevocable election at the time of initial recognition to account for the equity investment at fair value through other comprehensive income (FVOCI).
The Group reclassifies debt investments when and only when its business model for managing those assets changes.
(ii) Recognition and derecognition
Regular way purchases and sales of financial assets are recognised on trade-date, the date on which the Group commits to purchase or sell the asset. Financial assets are derecognised when the rights to receive cash flows from the financial assets have expired or have been transferred and the Group has transferred substantially all the risks and rewards of ownership.
(iii) Measurement
At initial recognition, the Group measures a financial asset at its fair value plus, in the case of a financial asset not at fair value through profit or loss (FVPL), transaction costs that are directly attributable to the acquisition of the financial asset. Transaction costs of financial assets carried at FVPL are expensed in profit or loss.
Financial assets with embedded derivatives are considered in their entirety when determining whether their cash flows are solely payment of principal and interest.
Debt instruments
Subsequent measurement of debt instruments depends on the Group’s business model for managing the asset and the cash flow characteristics of the asset. There are three measurement categories into which the Group classifies its debt instruments:
• Amortised cost: Assets that are held for collection of contractual cash flows where those cash flows represent solely payments of principal and interest are measured at amortised cost. Interest income from these financial assets is included in finance income using the effective interest rate method. Any gain or loss arising on derecognition is recognised directly in profit or loss and presented in other gains/(losses) together with foreign exchange gains and losses. Impairment losses are presented as separate line item in the statement of profit or loss.
• FVOCI: Assets that are held for collection of contractual cash flows and for selling the financial assets, where the assets’ cash flows represent solely payments of principal and interest, are measured at FVOCI. Movements in the carrying amount are taken through OCI, except for the recognition of impairment gains or losses, interest
income and foreign exchange gains and losses which are recognised in profit or loss. When the financial asset is derecognised, the cumulative gain or loss previously recognised in OCI is reclassified from equity to profit or loss and recognised in other gains/(losses). Interest income from these financial assets is included in finance income using the effective interest rate method. Foreign exchange gains and losses are presented in other gains/(losses) and impairment expenses are presented as separate line item in the statement of profit or loss.
• FVPL: Assets that do not meet the criteria for amortised cost or FVOCI are measured at FVPL. A gain or loss on a debt investment that is subsequently measured at FVPL is recognised in profit or loss and presented net within other gains/(losses) in the period in which it arises.
Equity instruments
The Group subsequently measures all equity investments at fair value. Where the Group’s management has elected to present fair value gains and losses on equity investments in OCI, there is no subsequent reclassification of fair value gains and losses to profit or loss following the derecognition of the investment. Dividends from such investments continue to be recognised in profit or loss as other income when the Group’s right to receive payments is established.
Changes in the fair value of financial assets at FVPL are recognised in other gains/(losses) in the statement of profit or loss as applicable.
Impairment
From 1 January 2018, the Group assesses on a forward-looking basis the expected credit losses associated with its debt instruments carried at amortised cost and FVOCI. The impairment methodology applied depends on whether there has been a significant increase in credit risk.
For trade receivables, the Group applies the simplified approach permitted by IFRS 9, which requires expected lifetime losses to be recognised from initial recognition of the receivables, see Note 16.5 for further details.
Financial liabilities
Financial liabilities are recognised initially at fair value plus directly attributable transaction costs and subsequently measured at amortised cost using the effective interest method.
(v) Accounting policies applied until 31 December 2017
The Group has applied IFRS 9 retrospectively but has elected not to restate comparative information. As a result, the comparative information provided continues to be accounted for in accordance with the Group’s previous accounting policy.
The Group classifies its financial instruments in the following categories:
• Loans and receivables;• Financial assets at fair value at fair value through profit or
loss;• Financial liabilities at amortised cost.
The classification depends on the purpose for which the financial instruments were acquired. Management determines the classification of its financial instruments at initial recognition.
Recognition and derecognition
Regular way purchases and sales of financial assets are recognised on trade-date, the date on which the Group commits to purchase or sell the asset. Financial assets are derecognised when the rights to receive cash flows from the financial assets have expired or have been transferred and the Group has transferred substantially all the risks and rewards of ownership.
Measurement
At initial recognition, the Group measures a financial asset at its fair value plus, in the case of a financial asset not at fair value through profit or loss, transaction costs that are directly attributable to the acquisition of the financial asset. Loans and receivables are subsequently carried at amortised cost using the effective interest method. Gains or losses arising from changes in the fair value of financial instruments at fair value through other comprehensive income are recognised in other comprehensive income. Interest on loans and receivables is calculated using the effective interest method is recognised in the statement of comprehensive income. Details on how the fair value of financial instruments is determined are disclosed in Note 16.7.
Impairment of financial assets
A provision for impairment is established when there is objective evidence that the Group will not be able to collect all amounts according to the original terms of receivables. Significant financial difficulties of the debtor, probability that the debtor will enter bankruptcy or financial reorganization, and default or delinquency in payments are considered indicators that the trade receivable is impaired. The amount of the impairment is the difference between the asset’s carrying amount and the present value of estimated future cash flows, discounted at the original effective interest rate. Impairment loss is recognised in the statement of comprehensive income.
Financial liabilities
Borrowings are recognized initially at fair value, net of transaction costs incurred. Borrowings are subsequently measured at amortised cost. Any difference between the
proceeds (net of transaction costs) and the redemption value is recognized in statement of comprehensive income over the period of the borrowings using the effective interest rate method. Borrowings are classified as current liabilities unless the Group has an unconditional right to defer settlement of the liability for at least 12 months after the end of the reporting period. In case of breach of covenants, the related borrowings are classified as current although their contractual maturity may exceed 12 months from the reporting date.
Derivative financial instruments
Derivatives are initially recognized at fair value as at the date when the contract is concluded. Derivatives are subsequently measured at fair value. The method of recognizing the resulting gain and loss depends on whether the derivative is designated as a hedging instrument, and if so, the nature of the item being hedged. The Group designates derivatives as hedges of an interest rate changes of its borrowings (cash flow hedge).
The effective portion of changes in the fair value of derivatives that are designated and qualify for cash flow hedges is recognized in equity item “Derivatives revaluation reserve”. The gain or loss relating to the ineffective portion is recognized immediately in the statement of comprehensive income.
Amounts accumulated in equity are reclassified in the statement of comprehensive income in the periods when the hedged item effects statement of comprehensive income. The gain or loss relating to the effective portion of interest rate swaps hedging variable rate borrowings is recognized in the statement of comprehensive income within “Finance costs”. The gain or loss relating to the ineffective portion is recognized in the statement of comprehensive income within “Other expenses”.
Share capital and share premium
Ordinary shares are classified as share capital. The excess of consideration received from the shareholders and the nominal value of ordinary shares is classified as share premium.
Employee benefits
Short-term employee benefits, including salaries and social security contributions, bonuses and paid vacation benefits are included in the statement of comprehensive income on an accrual basis.
The Group has no legal or constructive obligation to make pensions or similar benefit payments beyond the payments to the state pension insurance and to the state funded pension schemes in different jurisdictions in accordance with local legislation requirements.
AMBER BEVERAGE GROUP | ANNUAL REPORT 2018 > CONTENTS > CONSOLIDATED MANAGEMENT REPORT > CONSOLIDATED FINANCIAL STATEMENTS> CHAIRMAN’S STATEMENT > CHIEF FINANCIAL OFFICER’S STATEMENT > INDEPENDENT AUDITOR’S REPORTPAGE 156 PAGE 157

29. Reclassification of Comparatives
30. Events After the Balance Sheet Date
In February 2019 through common control transaction, the ABG acquired 100% of international distributor of alcoholic beverages DDE Holding Ltd incorporated in Cyprus.
In March 2019 Bennet Distributors UAB signed a short term loan facility agreement with BlueOrange Bank AS in amount of EUR 13 million for net working capital financing purposes. Loan is repayable till 2 January 2020.
In May 2019, the Group finalized the acquisition of Cellar Trends – the distributor of alcoholic beverages in the UK by acquiring remaining 30% of share capital of Cellar Trends Holding Limited.
There were no other subsequent events since the last date of the financial period until the date of signing these consolidated financial statements, which require adjustment to or disclosure in these consolidated financial statements.
2017EUR 000
(reported) Reclassified
2017EUR 000
(restated)
Revenues 313 455 – 313 455
Excise and duties – (101 662) (101 662)
Net revenue 313 455 (101 662) 211 793
Cost of sales (257 960) 101 217 (156 743)
Gross profit 55 495 (445) 55 050
Selling expense (36 642) 966 (35 676)
General and administration expense (15 594) 323 (15 271)
Net gain/loss on impairment of financial assets – (627) (627)
Other operational income 13 113 (212) 12 901
Other operational expense (1 977) (5) (1 982)
M&A related costs (559) – (559)
Operating profit 13 836 – 13 836
Finance income 1 558 – 1 558
Finance costs (2 252) – (2 252)
Profit before tax 13 142 – 13 142
Corporate income tax 434 – 434
Profit for the period 13 576 – 13 576
Statement of Managers’ Responsibilities
The managers are responsible for preparation of the consolidated financial statements in accordance with applicable law and regulations. Under that law the managers have elected to prepare the financial statements in accordance with International Financial Reporting Standards (“IFRS”) as adopted by the European Union.
In preparing the consolidated financial statements, the managers should:
• select suitable accounting policies and apply them consistently;
• make judgements and estimates that are reasonable;• prepare the financial statements on a going concern
basis, unless it is inappropriate to presume that the Group will continue in business as a going concern.
The managers are responsible for ensuring that proper accounting records are kept, which disclose with reasonable accuracy, at any time, the financial position of the Group and which enable the managers to ensure that the consolidated financial statements comply with the IFRS as adopted by the EU. This responsibility includes designing, implementing and maintaining such internal control as the managers determine is necessary to enable the preparation of consolidated financial statements that are free from material misstatement, whether due to fraud or error. The managers are also responsible for safeguarding the assets of the Group, and hence for taking reasonable steps for the prevention and detection of fraud and other irregularities.
Seymour Paul Ferreira Chairman of the Board of Managers
Approved by the Board of Managers and signed on its behalf on 4 June 2019 by:
AMBER BEVERAGE GROUP | ANNUAL REPORT 2018 > CONTENTS > CONSOLIDATED MANAGEMENT REPORT > CONSOLIDATED FINANCIAL STATEMENTS> CHAIRMAN’S STATEMENT > CHIEF FINANCIAL OFFICER’S STATEMENT > INDEPENDENT AUDITOR’S REPORTPAGE 158 PAGE 159

INDEPENDENT AUDITOR’S REPORT
AMBER BEVERAGE GROUP | ANNUAL REPORT 2018 > CONTENTS > CONSOLIDATED MANAGEMENT REPORT > CONSOLIDATED FINANCIAL STATEMENTS> CHAIRMAN’S STATEMENT > CHIEF FINANCIAL OFFICER’S STATEMENT > INDEPENDENT AUDITOR’S REPORTPAGE 160 PAGE 161

Audit report to the shareholders ofAmber Beverage Group Holding S.à r.l.
Our opinion
In our opinion, the accompanying consolidated financial statements give a true and fair view of the consolidated financial position of Amber Beverage Group Holding S.à r.l. (the “Company”) and its subsidiaries (the “Group”) as at 31 December 2018, and of its consolidated financial performance and its consolidated cash flows for the year then ended in accordance with International Financial Reporting Standards (IFRSs).
What we have audited
The Group’s consolidated financial statements comprise:
• the consolidated statement of financial position as at 31 December 2018;
• the consolidated statement of comprehensive income for the year then ended;
• the consolidated statement of changes in equity for the year then ended;
• the consolidated statement of cash flows for the year then ended; and
• the notes to the consolidated financial statements, which include a summary of significant accounting policies.
PricewaterhouseCoopers, Société coopérative, 2 rue Gerhard Mercator, B.P.
1443, L-1014 Luxembourg, T : +352 494848 1, F : +352 494848 2900, www.pwc.lu
Cabinet de révision agréé. Expert-comptable (autorisation gouvernementale
n°10028256) R.C.S. Luxembourg B65 477 - TVA LU25482518
Basis for opinion
We conducted our audit in accordance with the Law of 23 July 2016 on the audit profession (Law of 23 July 2016) and with International Standards on Auditing (ISAs) as adopted for Luxembourg by the “Commission de Surveillance du Secteur Financier” (CSSF). Our responsibilities under the Law of 23 July 2016 and ISAs as adopted for Luxembourg by the CSSF are further described in the “Responsibilities of the “Réviseur d’entreprises agréé” for the audit of the consolidated financial statements” section of our report.
We believe that the audit evidence we have obtained is sufficient and appropriate to provide a basis for our opinion.
We are independent of the Group in accordance with the International Ethics Standards Board for Accountants’ Code of Ethics for Professional Accountants (IESBA Code) as adopted for Luxembourg by the CSSF together with the ethical requirements that are relevant to our audit of the consolidated financial statements. We have fulfilled our other ethical responsibilities under those ethical requirements.
Other information
The Board of Managers is responsible for the other information. The other information comprises the information stated in the consolidated annual report including the consolidated management report but does not include the consolidated financial statements and our audit report thereon.
Our opinion on the consolidated financial statements does not cover the other information and we do not express any form of assurance conclusion thereon.
In connection with our audit of the consolidated financial statements, our responsibility is to read the other information identified above and, in doing so, consider whether the other information is materially inconsistent with the consolidated financial statements or our knowledge obtained in the audit, or otherwise appears to be materially misstated. If, based on the work we have performed, we conclude that there is a material misstatement of this other information, we are required to report that fact. We have nothing to report in this regard.
Responsibilities of the Board of Managers for the consolidated financial statements
The Board of Managers is responsible for the preparation and fair presentation of the consolidated financial statements in accordance with IFRSs, and for such internal control as the Board of Managers determines is necessary to enable the preparation of consolidated financial statements that are free from material misstatement, whether due to fraud or error.
In preparing the consolidated financial statements, the Board of Managers is responsible for assessing the Group’s ability to continue as a going concern, disclosing, as applicable, matters related to going concern and using the going concern basis of accounting unless the Board of Managers either intends to liquidate the Group or to cease operations, or has no realistic alternative but to do so.
AMBER BEVERAGE GROUP | ANNUAL REPORT 2018 > CONTENTS > CONSOLIDATED MANAGEMENT REPORT > CONSOLIDATED FINANCIAL STATEMENTS> CHAIRMAN’S STATEMENT > CHIEF FINANCIAL OFFICER’S STATEMENT > INDEPENDENT AUDITOR’S REPORTPAGE 162 PAGE 163

Responsibilities of the “Réviseur d’entreprises agréé” for the audit of the consolidated financial statements
The objectives of our audit are to obtain reasonable assurance about whether the consolidated financial statements as a whole are free from material misstatement, whether due to fraud or error, and to issue an audit report that includes our opinion. Reasonable assurance is a high level of assurance, but is not a guarantee that an audit conducted in accordance with the Law of 23 July 2016 and with ISAs as adopted for Luxembourg by the CSSF will always detect a material misstatement when it exists. Misstatements can arise from fraud or error and are considered material if, individually or in the aggregate, they could reasonably be expected to influence the economic decisions of users taken on the basis of these consolidated financial statements.
As part of an audit in accordance with the Law of 23 July 2016 and with ISAs as adopted for Luxembourg by the CSSF, we exercise professional judgment and maintain professional scepticism throughout the audit. We also:
• identify and assess the risks of material misstatement of the consolidated financial statements, whether due to fraud or error, design and perform audit procedures responsive to those risks, and obtain audit evidence that is sufficient and appropriate to provide a basis for our opinion. The risk of not detecting a material misstatement resulting from fraud is higher than for one resulting from error, as fraud may involve collusion, forgery, intentional omissions, misrepresentations, or the override of internal control;
• obtain an understanding of internal control relevant to the audit in order to design audit procedures that are appropriate in the circumstances, but not for the purpose of expressing an opinion on the effectiveness of the Group’s internal control;
• evaluate the appropriateness of accounting policies
used and the reasonableness of accounting estimates and related disclosures made by the Board of Managers;
• conclude on the appropriateness of the Board of Managers’ use of the going concern basis of accounting and, based on the audit evidence obtained, whether a material uncertainty exists related to events or conditions that may cast significant doubt on the Group’s ability to continue as a going concern. If we conclude that a material uncertainty exists, we are required to draw attention in our audit report to the related disclosures in the consolidated financial statements or, if such disclosures are inadequate, to modify our opinion. Our conclusions are based on the audit evidence obtained up to the date of our audit report. However, future events or conditions may cause the Group to cease to continue as a going concern;
• evaluate the overall presentation, structure and content of the consolidated financial statements, including the disclosures, and whether the consolidated financial statements represent the underlying transactions and events in a manner that achieves fair presentation;
• obtain sufficient appropriate audit evidence regarding the financial information of the entities and business activities within the Group to express an opinion on the consolidated financial statements. We are responsible for the direction, supervision and performance of the Group audit. We remain solely responsible for our audit opinion.
We communicate with those charged with governance regarding, among other matters, the planned scope and timing of the audit and significant audit findings, including any significant deficiencies in internal control that we identify during our audit.
Restriction on Distribution and Use
This report, including the opinion, has been prepared for and only for the Shareholders and the Board of Managers in accordance with the terms of our engagement letter and is not suitable for any other purpose. We do not accept any responsibility to any other party to whom it may be distributed.
PricewaterhouseCoopers, Société coopérative Represented by
Andrei Chizhov Luxembourg, 4 June 2019
AMBER BEVERAGE GROUP | ANNUAL REPORT 2018 > CONTENTS > CONSOLIDATED MANAGEMENT REPORT > CONSOLIDATED FINANCIAL STATEMENTS> CHAIRMAN’S STATEMENT > CHIEF FINANCIAL OFFICER’S STATEMENT > INDEPENDENT AUDITOR’S REPORTPAGE 164 PAGE 165

AMBER BEVERAGE GROUP | ANNUAL REPORT 2018166


![L-nnn-yy-[LICENSEE]-ELPAC-VVV AMBER Sensitive information ...](https://static.fdokumen.com/doc/165x107/6326029f6d480576770c9276/l-nnn-yy-licensee-elpac-vvv-amber-sensitive-information-.jpg)