Energy conversion strategies in the European paper industry – A case study in three countries
12
Energy conversion strategies in the European paper industry – A case study in three countries Jobien Laurijssen a,⇑ , André Faaij b , Ernst Worrell b a Centre of Competence Paper and Board, IJsselburcht 3, 6825 BS Arnhem, The Netherlands b Copernicus Institute, Utrecht University, Van Unnikgebouw, Heidelberglaan 2, 3584 CS Utrecht, The Netherlands article info Article history: Received 13 January 2012 Received in revised form 27 February 2012 Accepted 1 March 2012 Available online 27 April 2012 Keywords: Energy conversion strategies Paper industry CO 2 abstract The pulp and paper industry both uses and produces large amounts of energy and rising fuel prices bring along significant challenges to the sector. Several strategies can be applied in order to remain competitive e.g. an increase in energy efficiency, a switch in fuel and/or a novel energy conversion technology. In this study, we investigate if improved energy conversion strategies can reduce energy costs, primary energy use and CO 2 emissions of paper mills within different European countries (The Netherlands, Poland and Sweden). Our results show that differences in history and availability of resources has led to different conversion strategies in the three countries. We found that a natural gas combined cycle, which is largely implemented in The Netherlands due to long term domestic availability of natural gas, has the lowest pri- mary energy demand. Due to a long history of low electricity prices, CHP has not been common in Swe- den. Many Swedish mills use biomass as an energy source and due to low CO 2 emissions of the national grid the CO 2 emission profile of the Swedish paper industry is very low. Our results imply that future con- version routes for the Swedish paper and board industry are again wood based; in case of increasing elec- tricity prices these would be biomass gasification based CHP solutions. With a reduction of 800 kg CO 2 / ton paper on average, a switch from coal to biomass would reduce CO 2 emissions in the Polish pulp and paper industry with approximately 0.6 Mton/year. A carbon price of 20–25 €/ton would, according to our results, be enough to provoke this switch. Due to the high share of natural gas, the CO 2 emission reduc- tion potential of the Dutch paper industry (1.5 Mton/year) is even larger than in Poland. Due to high bio- mass prices and relative low CO 2 emission profile of natural gas, a carbon prices of more than 60 €/ton CO 2 would be needed to provoke a switch in The Netherlands. Provided with few alternatives, the most effective strategy in The Netherlands would be an increase in energy efficiency. Ó 2012 Elsevier Ltd. All rights reserved. 1. Introduction The pulp and paper industry both uses and produces large amounts of energy. It accounts for about 5% of the total final energy use in IEA member countries, which is about 15% of the final use in the industry sector [1]. The European pulp industry, in 2008, pro- duced 26% of the world’s total pulp production [2]. Paper exports in 2008 accounted for nearly 17 Mton of Europe’s production total of some 99 Mton. Less than 6 Mton of Europe’s paper needs (87.9 Mton) were imported [2]. The European paper and board industry needs to stay competitive with emerging centres of the paper industry in e.g. Asia and South America. Energy costs have a large impact on the performance of pulp and paper companies, resulting in a drive to reduce energy consumption. The total specific energy consumption for the production of pulp and paper decreased from 16.1 GJ/ton in 1990 to 13.8 GJ/ton in 2008 in CEPI member states [3]. Moreover, the European paper and board indus- try is a leader in the use of renewable energy sources, with a frac- tion of 55% biomass in its total fuel use [3]. The industry has also invested heavily in combined heat and power generation (CHP), and sustained efforts have reduced specific CO 2 emissions with al- most 40% from 1990 (0.57 ton CO 2 /ton product) to 2009 (0.35 ton CO 2 /ton product) [3]. Despite these efforts, energy has become one of the major cost components with a share of over 30% for some mills [4] and rising fuel prices (including biomass sources) bring along significant challenges to the sector. Rising energy prices have increased the importance to control energy costs in industries’ strategies. The ongoing efforts in improving energy efficiency only partly compensate for this effect. Even though the increase in energy prices is a global phenomenon, large differences in energy costs exist, even between different European countries and even for paper mills with similar energy efficiencies. Reasons are diverse and include differences in energy 0306-2619/$ - see front matter Ó 2012 Elsevier Ltd. All rights reserved. http://dx.doi.org/10.1016/j.apenergy.2012.03.001 ⇑ Corresponding author at: Centre of Competence Paper and Board, IJsselburcht 3, 6825 BS Arnhem, The Netherlands. Tel.: +31 (0) 26 365 35 16; fax: +31 (0) 26 365 35 20. E-mail address: [email protected] (J. Laurijssen). Applied Energy 98 (2012) 102–113 Contents lists available at SciVerse ScienceDirect Applied Energy journal homepage: www.elsevier.com/locate/apenergy
Transcript of Energy conversion strategies in the European paper industry – A case study in three countries
Applied Energy 98 (2012) 102–113
Contents lists available at SciVerse ScienceDirect
Applied Energy
journal homepage: www.elsevier .com/ locate/apenergy
Energy conversion strategies in the European paper industry – A case studyin three countries
Jobien Laurijssen a,⇑, André Faaij b, Ernst Worrell b
a Centre of Competence Paper and Board, IJsselburcht 3, 6825 BS Arnhem, The Netherlandsb Copernicus Institute, Utrecht University, Van Unnikgebouw, Heidelberglaan 2, 3584 CS Utrecht, The Netherlands
a r t i c l e i n f o a b s t r a c t
Article history:Received 13 January 2012Received in revised form 27 February 2012Accepted 1 March 2012Available online 27 April 2012
Keywords:Energy conversion strategiesPaper industryCO2
0306-2619/$ - see front matter � 2012 Elsevier Ltd. Ahttp://dx.doi.org/10.1016/j.apenergy.2012.03.001
⇑ Corresponding author at: Centre of Competence Pa6825 BS Arnhem, The Netherlands. Tel.: +31 (0) 26 36520.
E-mail address: [email protected] (J. Laurijssen)
The pulp and paper industry both uses and produces large amounts of energy and rising fuel prices bringalong significant challenges to the sector. Several strategies can be applied in order to remain competitivee.g. an increase in energy efficiency, a switch in fuel and/or a novel energy conversion technology. In thisstudy, we investigate if improved energy conversion strategies can reduce energy costs, primary energyuse and CO2 emissions of paper mills within different European countries (The Netherlands, Poland andSweden). Our results show that differences in history and availability of resources has led to differentconversion strategies in the three countries. We found that a natural gas combined cycle, which is largelyimplemented in The Netherlands due to long term domestic availability of natural gas, has the lowest pri-mary energy demand. Due to a long history of low electricity prices, CHP has not been common in Swe-den. Many Swedish mills use biomass as an energy source and due to low CO2 emissions of the nationalgrid the CO2 emission profile of the Swedish paper industry is very low. Our results imply that future con-version routes for the Swedish paper and board industry are again wood based; in case of increasing elec-tricity prices these would be biomass gasification based CHP solutions. With a reduction of 800 kg CO2/ton paper on average, a switch from coal to biomass would reduce CO2 emissions in the Polish pulp andpaper industry with approximately 0.6 Mton/year. A carbon price of 20–25 €/ton would, according to ourresults, be enough to provoke this switch. Due to the high share of natural gas, the CO2 emission reduc-tion potential of the Dutch paper industry (1.5 Mton/year) is even larger than in Poland. Due to high bio-mass prices and relative low CO2 emission profile of natural gas, a carbon prices of more than 60 €/tonCO2 would be needed to provoke a switch in The Netherlands. Provided with few alternatives, the mosteffective strategy in The Netherlands would be an increase in energy efficiency.
� 2012 Elsevier Ltd. All rights reserved.
1. Introduction
The pulp and paper industry both uses and produces largeamounts of energy. It accounts for about 5% of the total final energyuse in IEA member countries, which is about 15% of the final use inthe industry sector [1]. The European pulp industry, in 2008, pro-duced 26% of the world’s total pulp production [2]. Paper exportsin 2008 accounted for nearly 17 Mton of Europe’s production totalof some 99 Mton. Less than 6 Mton of Europe’s paper needs(87.9 Mton) were imported [2]. The European paper and boardindustry needs to stay competitive with emerging centres of thepaper industry in e.g. Asia and South America. Energy costs havea large impact on the performance of pulp and paper companies,resulting in a drive to reduce energy consumption. The total
ll rights reserved.
per and Board, IJsselburcht 3,35 16; fax: +31 (0) 26 365 35
.
specific energy consumption for the production of pulp and paperdecreased from 16.1 GJ/ton in 1990 to 13.8 GJ/ton in 2008 in CEPImember states [3]. Moreover, the European paper and board indus-try is a leader in the use of renewable energy sources, with a frac-tion of 55% biomass in its total fuel use [3]. The industry has alsoinvested heavily in combined heat and power generation (CHP),and sustained efforts have reduced specific CO2 emissions with al-most 40% from 1990 (0.57 ton CO2/ton product) to 2009 (0.35 tonCO2/ton product) [3]. Despite these efforts, energy has becomeone of the major cost components with a share of over 30% forsome mills [4] and rising fuel prices (including biomass sources)bring along significant challenges to the sector.
Rising energy prices have increased the importance to controlenergy costs in industries’ strategies. The ongoing efforts inimproving energy efficiency only partly compensate for this effect.Even though the increase in energy prices is a global phenomenon,large differences in energy costs exist, even between differentEuropean countries and even for paper mills with similar energyefficiencies. Reasons are diverse and include differences in energy

J. Laurijssen et al. / Applied Energy 98 (2012) 102–113 103
sources available, types of energy conversion, local electricityprices, and taxation or subsidy schemes. The type of fuel used isstrongly related to the local availability of raw material, historicdevelopment and government policies [5]. Pulp and paper are com-modity goods that are traded on an international market. Increasedenergy costs in a paper mill’s cost structure can weaken the com-petitive position of paper mills that face high energy prices. Thismight even be true for mills with a relatively low specific energyuse and a good CO2 emission profile in countries where the avail-able energy is expensive.
Many studies have investigated the potential of new energy con-version technologies in terms of CO2 emission reduction and costs(e.g. [6]). Most of these studies deal with energy conversion forelectricity production or district heating. (e.g. [7–10]). Several stud-ies evaluate energy conversion strategies in the pulp and paperindustry, but most of these studies have an exclusive focus on blackliquor gasification (e.g. [11–15]). To our knowledge, no studies areknown that focus on a comparison of current paper industries’ en-ergy conversion strategies in different countries or on the impactof future energy conversion strategies on cross-country differencesin energy cost, primary energy use and related CO2 emissions.
The European paper industry operates on a world market wherea level playing field is hard to be secured. Energy prices have beenrising and, with the adoption of emission trading, so are the costsfor CO2 emissions. In order to stay competitive, for paper mills,controlling energy costs is a key strategy. Part of this strategy isthe choice for an efficient energy conversion technology and alow cost energy source (including CO2 emission related cost). Thedevelopments of energy and CO2 prices in the future are, however,insecure and ongoing technological developments have increasedthe number of applicable energy conversion options. Therefore,to determine an optimal energy conversion route is challengingand complicated. The aim of this study is to analyse which energyconversion strategies can offset energy price differences and re-duce primary energy use and CO2 emissions for paper mills withindifferent European countries. Three case study countries have beenselected (the Netherlands, Poland and Sweden), all countries hav-ing a thriving paper industry (>2 Mton paper production/year)and individually having a large variation in available natural re-sources. We focus on inter-European differences, so that we cancompare and analyse similarities and differences in cross-countryimpacts of European policies.
At first, an overview of the Dutch, Swedish en Polish pulp andpaper industries’ structure is given, including an overview of thedomestically available resources for pulp and energy production.We further make a selection of current and possible alternative en-ergy conversion routes for the paper industry in each case studycountry. We then calculate energy costs, primary energy use andCO2 emissions of the paper and board industry, associated witheach of the selected energy conversion strategies. We take into ac-count different paper grades as their heat and electricity demandratios vary [16], which can influence the choice for a certain typeof technology. We put special attention to the impact of futureCO2 price levels on the competitiveness of the selected energy con-version routes. Finally, results are discussed, which includes a crosscountry comparison of different alternatives. We reflect on the roleof European policies in the strategic decision for future energy con-version options in the individual countries.
1 The wording with respect to integration is not used uniformly throughouliterature and discussions. In this report, following the definition of [5] an integratedmill is defined as a mill where virgin pulp making is integrated with paper making onthe same site. The term non-integrated mill is used for mills using recycled fibre andmills that buy pulp from the market. Market pulp mills only produce pulp for sale tothe market. In Europe about 18% of all mills in the pulp and paper industry areintegrated mills although different degrees of integration occur [5].
2 Currently, electricity prices are historically high in Sweden, although not 20%they are still well below European averages.
2. Paper industry structure and related energy conversionroutes in three case study countries
In the following section a description of the Dutch, Swedish enPolish pulp and paper industries’ structure is given, including thedominant industrial energy conversion routes. We also discuss
the countries’ main energy sources and electricity mix. Table 1summarises the main characteristics in the selected countries.
2.1. The Netherlands
The Dutch paper and board industry consists of 23 productionlocations that provide direct employment to about 4300 employ-ees. Together, the Dutch paper and board mills were responsiblefor a production of 3 Mton paper in 2008 with a turnover of 1.8billion Euros [17]. About 74% of the produced paper is exported.The Dutch paper industry mainly uses recovered fibres as feed-stock and (domestic) biomass is hardly available. More than 80%of the fibre raw material input is recovered paper. All Dutch papermills are non-integrated mills,1 including those mills that use virginfibres as feedstock.
The Netherlands is a significant producer (and exporter) of nat-ural gas. It is the second largest producer of natural gas in the EUand it depends on energy imports for oil and hard coal. The Dutchelectricity mix is mainly based on natural gas (63%) and hard coal(23%) [18]. Electricity prices are almost 10% above European aver-age [19]. The Dutch paper industry runs for approximately 97% onnatural gas [5]. Its total annual energy use is about 31 PJ. Approx-imately 75% of the production locations have a CHP installation in-stalled, the other mills produce heat in boilers and buy electricityfrom the grid.
2.2. Sweden
The Swedish paper and board industry consist of 41 paper millsand 41 pulp mills. Together, the Swedish pulp and paper mills pro-duced 3.8 Mton market pulp and 11.4 Mton paper and board in2010 [20]. Sweden is the 2nd largest pulp producer of Europe (afterFinland) and the 3rd largest producer of paper in Europe (afterGermany and Finland). About 85% of the market pulp and 88% ofthe produced paper is exported [20]. Biomass resources are widelyavailable and the Swedish paper industry is mainly virgin fibre-based. Only 17% of the fibre raw material input is recovered paper,50% is chemical pulp, 30% is mechanical pulp and 3% is semi-chem-ical pulp. About 68% of the pulp produced in Sweden is processedin integrated mills [20]. In integrated mills, the exhaust heat of thepulping process (from incinerating black liquor) is used in thepapermaking process, which reduces the need for steam produc-tion via current energy conversion routes.
More than a third of the energy supply in Sweden depends onimports. Energy imports are mainly oil from Russia and Norwaywith some small quantities of hard coal imports. Domestic energyproduction is mainly limited to electricity generation. About half ofthe electricity generated in Sweden is produced from nuclear en-ergy, the other half from renewables (where hydropower plays asubstantial role) [21]. Due to the low presence of fossil fuel re-sources, CO2 emissions related to Swedish electricity productionare very low (±0.4 kg CO2/kW h). Electricity prices have been morethan 20% lower than European averages [19] over the last years2,and a substantial amount of electricity in the Swedish paper industryis purchased from the grid. In some mills, exhaust steam from blackliquor recovery is used in a steam turbine to produce electricity.On average, however, paper producers in Sweden produce only
t
,

Table 1Main characteristics of Dutch, Swedish and Polish pulp and paper industries with regard to production and energy conversation routes.
NL SE PL
Production (Mton) Market pulp 0 4 1Paper 3 11 3
Fibre share Recycled 80% 17% 37%Virgin 20% 83% 63%
Integrated mills (%) ±0% 68% UnknownMain domestic energy source Natural gas Biomass Coal and BiomassDominant energy conversion routes in P&P industry CHP (gas) Recovery heat Boiler (coal/biomass)
Boiler (gas) Boiler (biomass) Recovery heatGrid electricity mix (%) 63% gas 23% coal 50% nuclear 50% hydro 92% coal
104 J. Laurijssen et al. / Applied Energy 98 (2012) 102–113
approximately 25% of their power demand [20]. Heat demand ismostly covered by black liquor recovery and by additional heat boil-ers. Heat boilers in the Swedish paper and board industry are mainlyfuelled with biomass (89%) or oil (9%) [5].
2.3. Poland
In Poland, 39 paper and board mills and five pulp mills of vari-ous sizes are in operation. Their total annual production is approx-imately 1 Mton pulp and 3 Mton paper. From the 39 paper mills, 21are smaller than 10,000 ton a year and the two largest paper mills(with production capacities above 500,000 tons a year), togethercontribute to over 50% of the total paper production in Poland[22]. The production of pulp in Poland is taking place at five com-panies. In three companies chemical pulp is produced by the Kraftmethod, the two others produce mechanical pulp [22].
Coal is the dominant fuel in Poland and accounts for around 65%of the total primary energy consumption in 2006 [23]. Poland hasthe largest coal reserves of Europe; it is the 9th largest coal produc-ing country in the world and the 5th largest coal exporting country.About 38% of natural gas consumption is produced in Poland. Rus-sian imports cover about 47% of the domestic consumption of nat-ural gas in Poland [24]. Poland is also dependent on the import ofoil, since its domestic production only covers about 8% of itsdomestic consumption. Due to large coal reserves, electricity in Po-land is for over 90% produced from coal, including both hard coaland lignite. The remaining electricity is mainly produced by oil,gas and renewables. Electricity prices are almost 10% below Euro-pean averages [19]. Energy sources used in the Polish pulp and pa-per industry are mainly biomass (69%) and coal (25%) [5]. SeveralPolish paper mills are integrated and have relatively cheap steamfrom black liquor recovery. Most non-integrated mills producesteam with a boiler on biomass and/or coal. Electricity is boughtfrom the grid or produced on location by means of a steam turbine.
3. Methodology
First, we describe the approach to calculate energy costs, pri-mary energy use and CO2 emissions for current and several alter-native energy conversion routes in the three case studycountries. The heat and electricity demand ratio of a paper mill de-pends for a large part on the paper grade produced [5,16]. This ra-tio might affect the choice for an energy conversion technology asthe heat to power ratio of the conversion technology is adapted toeither the heat or the power demand ratio of the mill. Since the fo-cus in this study is on energy conversion, and also because of dataavailability, we assume a fixed and equal energy demand, for threepaper grades, in all three countries. The assumption of equal en-ergy intensities for paper mills in different countries is not realistic.Different mill sizes and differences in cross-country energy pricescan largely influence energy-efficiency. Therefore, we explore theimpact of differences in energy intensities on our results in a sen-
sitivity analysis. Table 2 shows our assumptions for corrugatedboard, graphical paper, and tissue. We further assume a referencecapacity of 150 kton paper production/year for all paper mills.
Energy conversion technologies are assessed using the follow-ing parameters: capital cost, O&M cost, thermal efficiency, electri-cal efficiency, estimated lifetime, fuel type(s), capacity and scalingfactor. Energy sources are assessed by: current price, price volatil-ity and carbon content. Energy conversion routes (combination ofconversion technology and energy source) are evaluated accordingto energy costs, primary energy use and CO2 emissions. For eachconversion route the energy costs are calculated according to for-mula (1):
CoE ¼ ða � IÞ þ O&Mþ F � Bþ CO2 ð1Þ
CoE is the cost of energy (€/year), a the annuity factor (year�1), I theinitial investment (€), O&M the operation and maintenance costs (€/year), F the fuel and electricity costs (€/year), B the benefits of en-ergy delivery (€/year) and CO2 is the carbon emission costs (€/year).
To annualize costs the annuity factor is used:
a ¼ r=ð1� ð1þ rÞ � LÞ ð2Þ
L is the lifetime (year), r the interest rate (%), and a is the annuityfactor.
In order to derive installation costs at capacities other than forwhich prices are provided by literature or by other sources, thecosts at the capacities under consideration are calculated (3):
Cost2
Cost1¼ Size2
Size1
� �R
ð3Þ
Cost1 is the cost of the subject at the reference capacity (Size1) (€),Cost2 the cost of the subject at the capacity under consideration(Size2) (€), Size1 the size/capacity of the reference subject in(MW), Size2 the size/capacity of the subject under considerationin (MW), and R is the technology specific scaling factor (generallyin the range of 0.6–0.9).
In chemical pulp mills, black liquor is generated during a pro-cess in which cellulose is separated from lignin. Black liquor is usedas an energy source in the mill. Since it is not a product that istraded on the market (except for some situations where the pulpmill’s energy plant is outsourced [25]), there is no market pricefor lignin and there are ongoing discussions about how it shouldbe valued [26]. Some studies assume that no price should be ac-counted to black liquor, as it is a left-over stream from the pulpingprocess [27]. In Svensson et al. [26] it is assumed that the price oflignin is 50% higher than the price of by-products. Other studieseven propose that lignin should possibly be valued at a price equiv-alent to oil (e.g. [28,29]). In this study, we value black liquor at aprice equivalent to the price of pulpwood. In order to reflect thedifferent approaches found in literature, we take into account aprice range of black liquor in our calculations (Table 4).
Primary energy use is the energy content of the fuel needed togenerate the required heat and electricity for paper production. We

Table 2Typical heat and electricity demand by paper grade [16].
Paper grade Power demand(kW h/ton)
Heat demand(MJ/ton)
Heat-to-powerratio
Corrugatedboard
350 4500 3.6
Printingpaper
600 5000 2.3
Tissue 1300 5500 1.2
Table 3Overview of selected current and alternative energy conversion routes in the threecase study countries.
Country Current routes Alternative routes
Technology Fuel Technology Fuel
Netherlands Boiler Natural gas Boiler BiomassSteam turbine Natural gas Steam turbine BiomassGas turbine Natural gas BIG/CC BiomassCombinedcycle
Natural gas
Sweden Boiler Biomass BIG/CC BiomassBoiler Oil BLG/CC Black
liquorRecovery boiler Black
liquorGas turbine Natural gas
Steam turbine Biomass Combinedcycle
Natural gas
Poland Boiler Coal Steam turbine BiomassBoiler Biomass BLG/CC Black
liquorRecovery boiler Black
liquorGas turbine Natural gas
Steam turbine Coal Combinedcycle
Natural gas
J. Laurijssen et al. / Applied Energy 98 (2012) 102–113 105
assume that on-site fuel use is determined by heat demand of theprocess in combination with thermal efficiency of the respectiveconversion route. Depending on electrical efficiency of the conver-sion route and electricity demand of the process, there is either ashortage or excess of electricity produced on site. In case of short-age, we add primary energy use from grid based electricity, assum-ing 40% efficiency3, to the on-site fuel use. In cases of excesselectricity production, electricity delivered is assumed to replacegrid electricity produced with 40% efficiency, and a consequentamount of primary energy is deducted from on-site fuel use. Finan-cial revenues for surplus electricity production are assumed to be90% as compared to the price of buying electricity.
In cases where there is a shortage of electricity produced on-site, CO2 emissions are calculated as the CO2 emissions from on-site fuel use plus CO2 emissions related to the electricity that ispurchased from the grid. For conversion routes with excess elec-tricity produced on site, we calculate total CO2 emissions as theCO2 emissions from on-site fuel use minus CO2 emissions relatedto avoided production of grid electricity. In both cases we assumethe average CO2 figures of the national grid. We will discuss on theimpact of this assumption in the discussion section.
4. Conversion routes and data
4.1. Selected energy conversion routes
Several technologies are able to fulfil the energy needs of paperand board producing plants. Table 3 gives an overview of selectedcurrent and alternative energy conversion routes in the three casestudy countries. Current energy routes in the Dutch paper industryare: a gas-heated boiler in combination with electricity from thegrid, a gas-heated boiler with steam turbine, a gas turbine and acombined cycle (CC) on natural gas. As alternatives routes we haveselected several biomass-based options in combination with cur-rent technologies. In some of these routes, a gasification step isneeded. In this study, we distinguish biomass gasification (BIG)and black liquor gasification (BLG).
Current energy conversion routes in the Swedish paper industryinclude a biomass boiler, an oil boiler and a recovery boiler, all incombination with electricity from the grid. In some cases a steamturbine is used to produce electricity for own usage. As alternativeenergy conversion routes for Sweden, we have selected differenttypes of combined heat and power technologies.4 Current energy
3 The efficiency of grid based electricity varies per country and per region inEurope. At this moment, there is a rapid increase in interconnectivity of national gridsin Europe. Moreover, we observe an increasing share of renewable energy sources andde-centralised electricity production in Europe. Given these trends, we were unable tofind country-specific grid efficiencies for our case study countries. We thereforeassume 40% efficiency for electricity generation as a European average.
4 We have included two alternative energy conversion routes in Sweden that arebased on natural gas. It is important to mention that Sweden has no known largenatural gas resources and has not built any nation-wide gas grid. A high pressure gasgrid only exists in western Sweden where a gas pipes transport the gas from Malmoto Gothenburg and further North up to Stenungsund. Only a small share of theSwedish pulp and paper industry operates in this area.
5 Since Poland has many smaller sized mills, capacities of these mills may be lowerresulting in increased investment costs. This effect will be discussed later.
conversion routes in the Polish paper industry are diverse. We in-clude boilers fuelled by coal and biomass in combination with elec-tricity from the grid. We further consider a boiler on coal incombination with a steam turbine and recovery heat in combinationwith electricity from the grid. As alternative energy conversionroutes for Poland, we have selected several natural gas and biomassbased combined heat and power technologies.
4.2. Price and cost data
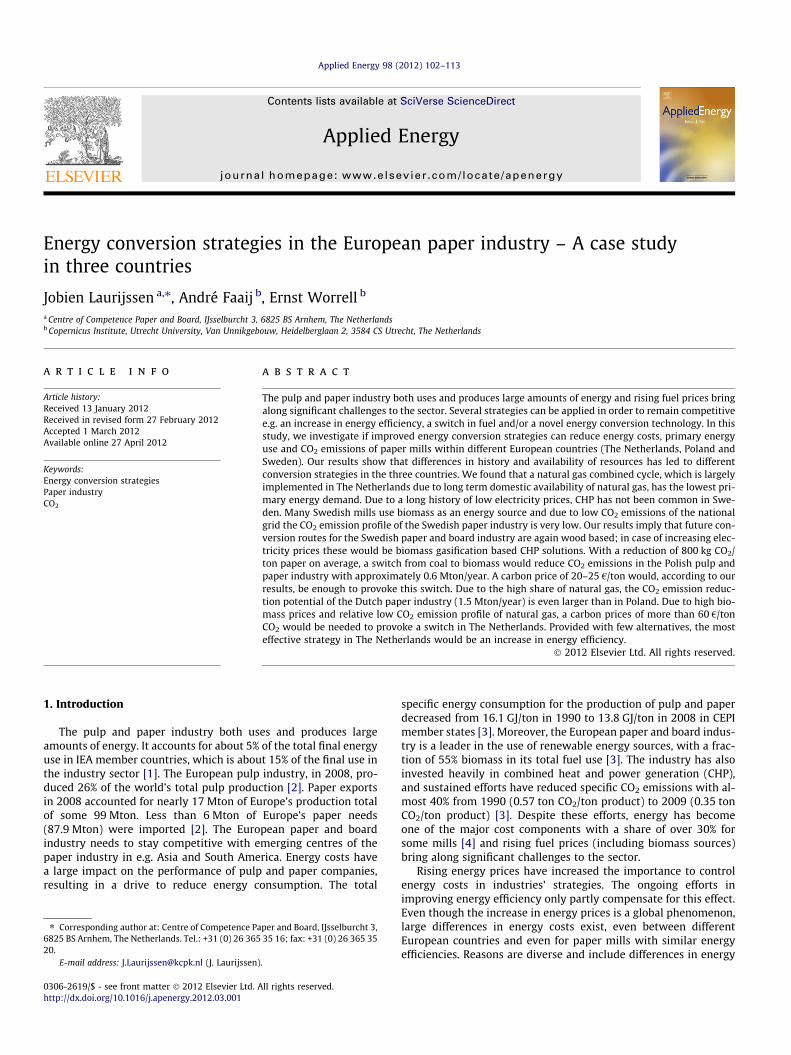
Table 4 gives an overview of CO2 emissions factors and fuelprices in the different countries. Some prices (e.g. oil) are similarfor the three countries under consideration, whereas other prices(e.g. electricity) vary largely from one nation to the other. We haveindicated current fuel and electricity prices, as well as price ranges.Price ranges are based on fuel price histories and future energyprice predictions [30]. The price of CO2 is assumed to be 15 €/tonCO2. We apply a CO2 price range of 10–50 €/ton CO2.
Table 5 gives an overview of estimated investment costs of thedifferent technologies at indicated reference capacities. For thecombined cycles based on biomass and black liquor gasification,we have applied a range of 20% in investment costs as these areimmature technologies and investment costs figures are thereforeinsecure. For each technology also estimated operation and main-tenance costs and applied thermal and electrical efficiencies areshown. For all technologies, we assume a scaling factor of 0.7, atechnical life time of 25 years and an interest rate of 10%. All costsare related to our reference paper production capacity of 150 ktonper year.5
5. Results
5.1. Primary energy demand
Fig. 1 shows primary energy demand and current energy costsfor production of printing paper, with assumed fixed final energydemand, via selected current (C) and alternative (A) energy conver-sion routes in the three European countries. Conversion routes, inFig. 1, are ranked according to primary energy use.
,
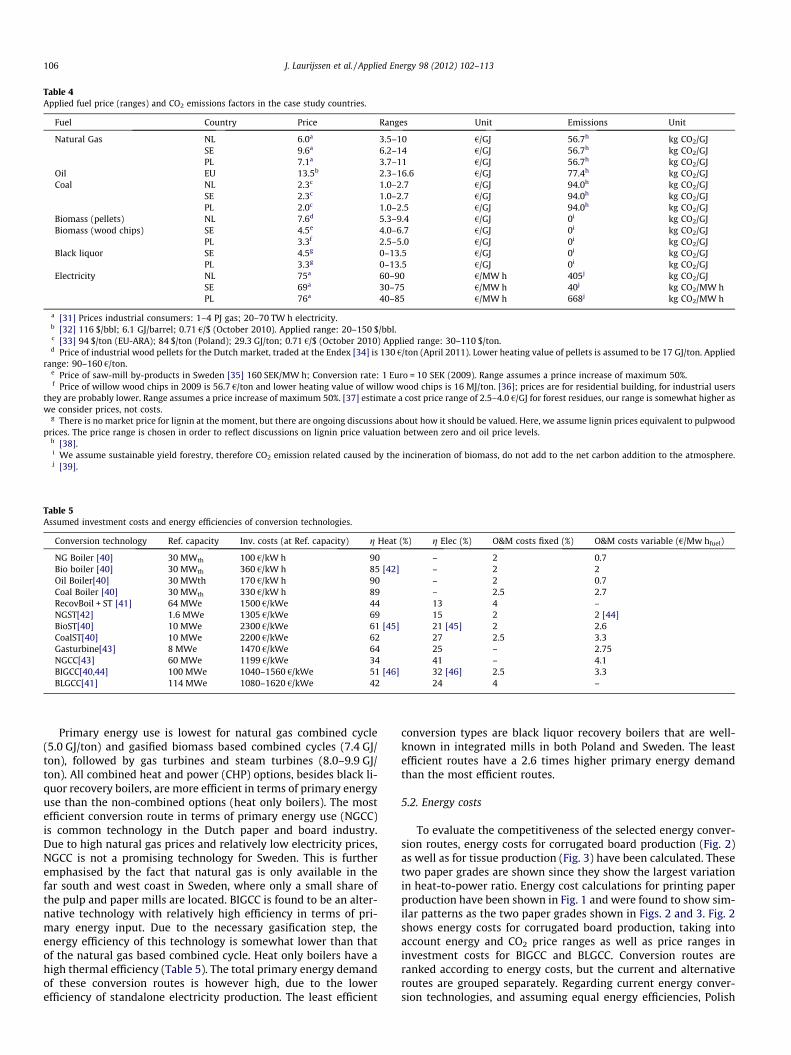
Table 4Applied fuel price (ranges) and CO2 emissions factors in the case study countries.
Fuel Country Price Ranges Unit Emissions Unit
Natural Gas NL 6.0a 3.5–10 €/GJ 56.7h kg CO2/GJSE 9.6a 6.2–14 €/GJ 56.7h kg CO2/GJPL 7.1a 3.7–11 €/GJ 56.7h kg CO2/GJ
Oil EU 13.5b 2.3–16.6 €/GJ 77.4h kg CO2/GJCoal NL 2.3c 1.0–2.7 €/GJ 94.0h kg CO2/GJ
SE 2.3c 1.0–2.7 €/GJ 94.0h kg CO2/GJPL 2.0c 1.0–2.5 €/GJ 94.0h kg CO2/GJ
Biomass (pellets) NL 7.6d 5.3–9.4 €/GJ 0i kg CO2/GJBiomass (wood chips) SE 4.5e 4.0–6.7 €/GJ 0i kg CO2/GJ
PL 3.3f 2.5–5.0 €/GJ 0i kg CO2/GJBlack liquor SE 4.5g 0–13.5 €/GJ 0i kg CO2/GJ
PL 3.3g 0–13.5 €/GJ 0i kg CO2/GJElectricity NL 75a 60–90 €/MW h 405j kg CO2/GJ
SE 69a 30–75 €/MW h 40j kg CO2/MW hPL 76a 40–85 €/MW h 668j kg CO2/MW h
a [31] Prices industrial consumers: 1–4 PJ gas; 20–70 TW h electricity.b [32] 116 $/bbl; 6.1 GJ/barrel; 0.71 €/$ (October 2010). Applied range: 20–150 $/bbl.c [33] 94 $/ton (EU-ARA); 84 $/ton (Poland); 29.3 GJ/ton; 0.71 €/$ (October 2010) Applied range: 30–110 $/ton.d Price of industrial wood pellets for the Dutch market, traded at the Endex [34] is 130 €/ton (April 2011). Lower heating value of pellets is assumed to be 17 GJ/ton. Applied
range: 90–160 €/ton.e Price of saw-mill by-products in Sweden [35] 160 SEK/MW h; Conversion rate: 1 Euro = 10 SEK (2009). Range assumes a prince increase of maximum 50%.f Price of willow wood chips in 2009 is 56.7 €/ton and lower heating value of willow wood chips is 16 MJ/ton. [36]; prices are for residential building, for industrial users
they are probably lower. Range assumes a price increase of maximum 50%. [37] estimate a cost price range of 2.5–4.0 €/GJ for forest residues, our range is somewhat higher aswe consider prices, not costs.
g There is no market price for lignin at the moment, but there are ongoing discussions about how it should be valued. Here, we assume lignin prices equivalent to pulpwoodprices. The price range is chosen in order to reflect discussions on lignin price valuation between zero and oil price levels.
h [38].i We assume sustainable yield forestry, therefore CO2 emission related caused by the incineration of biomass, do not add to the net carbon addition to the atmosphere.j [39].
Table 5Assumed investment costs and energy efficiencies of conversion technologies.
Conversion technology Ref. capacity Inv. costs (at Ref. capacity) g Heat (%) g Elec (%) O&M costs fixed (%) O&M costs variable (€/Mw hfuel)
NG Boiler [40] 30 MWth 100 €/kW h 90 – 2 0.7Bio boiler [40] 30 MWth 360 €/kW h 85 [42] – 2 2Oil Boiler[40] 30 MWth 170 €/kW h 90 – 2 0.7Coal Boiler [40] 30 MWth 330 €/kW h 89 – 2.5 2.7RecovBoil + ST [41] 64 MWe 1500 €/kWe 44 13 4 –NGST[42] 1.6 MWe 1305 €/kWe 69 15 2 2 [44]BioST[40] 10 MWe 2300 €/kWe 61 [45] 21 [45] 2 2.6CoalST[40] 10 MWe 2200 €/kWe 62 27 2.5 3.3Gasturbine[43] 8 MWe 1470 €/kWe 64 25 – 2.75NGCC[43] 60 MWe 1199 €/kWe 34 41 – 4.1BIGCC[40,44] 100 MWe 1040–1560 €/kWe 51 [46] 32 [46] 2.5 3.3BLGCC[41] 114 MWe 1080–1620 €/kWe 42 24 4 –
106 J. Laurijssen et al. / Applied Energy 98 (2012) 102–113
Primary energy use is lowest for natural gas combined cycle(5.0 GJ/ton) and gasified biomass based combined cycles (7.4 GJ/ton), followed by gas turbines and steam turbines (8.0–9.9 GJ/ton). All combined heat and power (CHP) options, besides black li-quor recovery boilers, are more efficient in terms of primary energyuse than the non-combined options (heat only boilers). The mostefficient conversion route in terms of primary energy use (NGCC)is common technology in the Dutch paper and board industry.Due to high natural gas prices and relatively low electricity prices,NGCC is not a promising technology for Sweden. This is furtheremphasised by the fact that natural gas is only available in thefar south and west coast in Sweden, where only a small share ofthe pulp and paper mills are located. BIGCC is found to be an alter-native technology with relatively high efficiency in terms of pri-mary energy input. Due to the necessary gasification step, theenergy efficiency of this technology is somewhat lower than thatof the natural gas based combined cycle. Heat only boilers have ahigh thermal efficiency (Table 5). The total primary energy demandof these conversion routes is however high, due to the lowerefficiency of standalone electricity production. The least efficient
conversion types are black liquor recovery boilers that are well-known in integrated mills in both Poland and Sweden. The leastefficient routes have a 2.6 times higher primary energy demandthan the most efficient routes.
5.2. Energy costs
To evaluate the competitiveness of the selected energy conver-sion routes, energy costs for corrugated board production (Fig. 2)as well as for tissue production (Fig. 3) have been calculated. Thesetwo paper grades are shown since they show the largest variationin heat-to-power ratio. Energy cost calculations for printing paperproduction have been shown in Fig. 1 and were found to show sim-ilar patterns as the two paper grades shown in Figs. 2 and 3. Fig. 2shows energy costs for corrugated board production, taking intoaccount energy and CO2 price ranges as well as price ranges ininvestment costs for BIGCC and BLGCC. Conversion routes areranked according to energy costs, but the current and alternativeroutes are grouped separately. Regarding current energy conver-sion technologies, and assuming equal energy efficiencies, Polish

Fig. 1. Primary energy use (left hand axis) and energy costs (right hand axis) for production of printing paper for current and alternative energy conversion routes in Poland,Sweden and The Netherlands.
Fig. 2. Energy costs for the production of corrugated board via different energy conversion routes in Poland, Sweden and The Netherlands. Bandwidths indicate minimum andmaximum energy costs within applied fuel price and CO2 price ranges and investment cost ranges for BIGCC and BLGCC (see Tables 4 and 5).
J. Laurijssen et al. / Applied Energy 98 (2012) 102–113 107
mills have lowest energy costs for corrugated board production. Acoal-fuelled steam turbine is, at current price levels, the most effi-cient energy conversion route (36 €/ton) from an economic point ofview. Due to the relatively low pulpwood prices in Poland, and ourassumption that the black liquor price equals the pulpwood price,recovery boilers are also competitive. The range is energy costs(18–158 €/ton) is however high, due to the chosen bandwidth inblack liquor pricing (Table 4). At current (historically) high electric-ity prices, the most competitive current conversion route in Swe-den is a steam turbine on biomass (51 €/ton). Heat boilersbecome an economically better alternative at lower electricityprice levels. At assumed reference energy prices, the natural gascombined cycle (52 €/ton) is the most competitive technology inThe Netherlands. Its large cost range (2–130 €/ton) shows that thisconversion route is highly sensitive to i.e. changes in gas and elec-tricity prices as well as scale.
Fig. 2 shows that some of the identified alternative conversionroutes are competitive at current price levels. The biomass fedsteam turbine and black liquor gasification in Poland are most com-petitive (41 €/ton). Biomass gasification in Sweden is, according toour results, also an economically viable option (38–92 €/ton). Thealternatives for the Dutch corrugated board industry seem less
promising. This is because all of our selected alternatives are basedon biomass, and the prices of imported biomass pellets in The Neth-erlands are relatively high (Table 4). The heat-to-power ratio in en-ergy demand varies between different paper grades. This can affectthe choice for a certain energy conversion route. Fig. 3 shows en-ergy costs for tissue production, according to the selected energyconversion routes. The heat-to-power demand ratio of tissue ismuch lower (1.2) than the heat-to-power ratio for corrugated boardproduction (3.6). We compare Figs. 2 and 3 to see how this affectsthe competitiveness of different energy conversion routes.
Fig. 3 shows that energy costs for tissue production, in general,are a factor two to three higher than for corrugated board produc-tion due to higher energy consumption. For tissue production, acoal-fuelled steam turbine in Poland (116 €/ton) is, at assumedprice levels, again the most efficient energy conversion route froman economic point of view. The biomass fed steam turbine (121 €/ton) is the most economic Swedish route. Apart from the biomassboiler in Sweden, heat only boilers are the least economic choicesamong the current options. This can be explained by the high elec-tricity use in tissue production. The Swedish biomass boiler is leastaffected due to the relatively low electricity prices in Sweden. Eventhough current Swedish electricity prices are well above their

Fig. 3. Energy costs for tissue production via different energy conversion routes in Poland, Sweden and The Netherlands. Bandwidths indicate minimum and maximumenergy costs within applied fuel price and CO2 price ranges and investment cost ranges for BIGCC and BLGCC (see Tables 4 and 5).
Fig. 4. CO2 emissions and energy costs related to the production of printing paper via different current and alternative energy conversion routes in Poland, Sweden and TheNetherlands. Black dots indicate current technology routes. White dots refer to the selected alternative conversion routes.
108 J. Laurijssen et al. / Applied Energy 98 (2012) 102–113
average of the last ten years, they still belong to the lowest of Eur-ope. At current price levels a natural gas combined cycle (125 €/ton)is the most competitive technology in The Netherlands, but the en-ergy costs range (74–221 €/ton) is, also in this case, very large.
Considering the selected alternative conversion routes, it ap-pears that several of them are able to generate energy at competi-tive costs. Most economical alternative routes, are the Swedish(115 €/ton) and Polish (120 €/ton) routes that are based on (gasi-fied) biomass or black liquor. The biomass fed steam turbine, whichwas found to be the most economic option for corrugated boardproduction, has slightly higher energy costs (123 €/ton) than thegasification routes, but is still an economically viable alternative.It can further be seen that most combined cycles rank a little better,in terms of energy production costs, than in the case of corrugatedboard production because of a better match in heat-to-power ratiobetween tissue production and combined cycle technology.
5.3. CO2 emissions
In Fig. 4, CO2 emissions from printing paper production for theselected conversion routes are plotted against energy costs. Fig. 4
shows that the coal-fuelled steam turbine in Poland, that wasfound to be the most efficient technology in terms of economics,is one of the worst in terms of CO2 emissions (0.75 ton CO2/ton pa-per). Only the Polish heat only boiler on coal and the NGCC in Swe-den have higher CO2 emissions. The NGCC route in Sweden has analmost two times higher CO2 emission profile as compared to thesame conversion route in The Netherlands. The reason is that dueto its electricity production, the NGCC replaces grid-based electric-ity, which in The Netherlands has a much higher CO2 profile than inSweden (Table 4). In this study, we assume that average grid mixelectricity is replaced. We will discuss the impact of this assump-tion, as compared to the replacement of marginal electricity pro-duction, later. Several of the analysed conversion routes arefound to have negative CO2 emissions. All of these are bio-basedtechnologies with combined heat and power production. The rea-son for these negative CO2 emissions can be found in the assump-tion that CO2 emissions from the incineration of biomass are zero.Due to power production, CO2 emissions from grid-based electric-ity are avoided.
Among current energy conversion routes, the Swedish ones (ex-cept for the oil boiler) perform by far better than the routes in The

Fig. 5. Energy costs of printing paper production in The Netherlands for selected conversion routes at different carbon prices.
Fig. 6. Energy costs of printing paper production in Sweden for selected conversion routes at different carbon prices.
6 At such high carbon prices, electricity prices will be affected as well. We have notaken into account the effect of carbon price related electrity price increases on ourresults, but we will discuss this later.
J. Laurijssen et al. / Applied Energy 98 (2012) 102–113 109
Netherlands and Poland (apart from the Polish recovery boiler).Due to its current good performance, the CO2 emission reductionpotential in the Swedish paper industry is low. CO2 emissions ofthe Dutch paper and board industry are, compared to the othercountries, average to high, even though the CO2 emission factorof natural gas, as compared to other fossil fuels, is rather low. Thisis due to the large share of bio-based energy already present in theEuropean pulp and paper industry.
Most of the selected alternative conversion routes perform bet-ter in terms of CO2 emissions than the current routes. From theseroutes, the ones that appear to be economically competitive arethe BLGCC and biomass-based steam turbine routes in Polandand the BIGCC and BLGCC routes in Sweden, although these tech-nologies are not commercial yet. A switch from coal-based to bio-mass-based combined heat and power routes in Poland wouldreduce CO2 emissions by approximately 800 kg CO2/ton paper onaverage. The share of coal in the energy mix used in the Polish pulpand paper industry is approximately 25% [5].With an annual paperproduction of 3 Mton, the CO2 emission reduction potential in thePolish pulp and paper industry is therefore approximately0.6 Mton/year. A switch from natural gas to biomass based CHPin The Netherlands would reduce CO2 emissions with approxi-mately 500 kg CO2/ton paper depending on the type of CHP. Witha share of 97% of natural gas in the energy mix of the Dutch paperand board industry and an annual paper production of 3 Mton, theCO2 emission reduction potential in the Dutch pulp and paperindustry is approximately 1.5 Mton/year. The bio-based conversion
routes that are necessary to establish this reduction are, however,under current conditions in The Netherlands not economicallyviable.
6. Sensitivity analysis
6.1. CO2 prices
In order to study the impact of future CO2 price levels on thecompetitiveness of selected energy conversion routes, we have cal-culated energy costs of printing paper production for all selectedconversion routes at different carbon prices (Figs. 5–7). In Fig. 5,results are shown for the Dutch conversion options. Results showthat a biomass boiler outcompetes a natural gas boiler at a price of60 €/ton CO2 or higher.6 A steam turbine on biomass is more costeffective than a steam turbine on natural gas at a price of 45–50 €/ton CO2. The BIGCC route, due to its negative CO2 emission profile,is the only conversion route where energy costs decrease withincreasing CO2 prices. At a price of 40 €/ton CO2 or higher, BIGCC en-ergy costs are lower than energy costs for a natural gas steam tur-bine. BIGCC is the most cost-effective option in The Netherlands ata carbon price of 65–70 €/ton or higher. The total energy costs inthat scenario (all other assumptions being equal) are calculated at
t

Fig. 7. Energy costs of printing paper production in Poland for selected conversion routes at different carbon prices.
Fig. 8. Energy costs of printing paper production for current conversion routes: sensitivity analysis on effect of differences in energy efficiency in Sweden and Poland.
Fig. 9. Energy costs of printing paper production for alternative conversion routes: sensitivity analysis on effect of differences in energy efficiency in Sweden and Poland.
110 J. Laurijssen et al. / Applied Energy 98 (2012) 102–113
90 €/ton paper, which is almost 30% higher than current energycosts. In Fig. 6, energy costs of printing paper production for selected
conversion routes in Sweden are calculated at different carbonprices. Fig. 6 shows that energy costs for all fossil fuel based

J. Laurijssen et al. / Applied Energy 98 (2012) 102–113 111
conversion routes increase rapidly with increasing carbon prices.The bio-based conversion routes are, under our assumptions, hardlyaffected by changes in carbon prices. Energy costs of the bio-basedcombined heat and power options, just slightly decrease due to elec-tricity generation replacing grid based electricity that also has a lowcarbon profile. Under the new carbon emission trading systemperiod (2013–2020), where CO2 emission credits are allocated basedon the paper grade produced, the effect on increasing CO2 priceswill, however, have a positive impact on the economics of the papermill. This effect will be discussed later. The impact of carbon priceson energy costs of printing paper production in Poland is shown inFig. 7. Results show that BLGCC is the most economic conversionroute at a carbon price of approximately 20 €/ton CO2 or higher. Alsothe steam boiler on biomass is competitive at relatively low CO2
prices (±25 €/ton CO2). Energy costs for both conversion routes arefor all carbon prices scenarios competitive, also when compared tothe other case study countries (Figs. 5 and 6).
6.2. Energy efficiency
As described in Section 3, we have assumed fixed and equal en-ergy intensities for the individual paper grades produced in allthree case study countries. This assumption is not realistic as dif-ferences in mill sizes and differences in cross-country energyprices can strongly influence energy-efficiency developments inthe paper industry. In order to investigate the effect of thisassumption on energy costs of printing paper production, espe-cially with regard to cross-country differences, sensitivity analysesare shown in Figs. 8 and 9. Electricity and heat demand of printingpaper production as shown in Table 2 are assumed to be represent-ing the Dutch situation. We explore the effect of differences in en-ergy intensity in Poland and Sweden on the competitiveness ofconversion routes in Fig. 8 (current routes) and Fig. 9 (alternativeroutes). The results from the sensitivity analyses in Figs. 8 and 9show that energy intensity has a large absolute effect on energycosts. A 20% increase in energy intensity increases energy costswith almost the same percentage in all conversion routes. The rel-ative effect of changes in energy intensity is found to be rather sim-ilar for different conversion routes and different countries. In thediscussion section, we will further elaborate on the impact of en-ergy efficiency in relation to energy strategies, energy policiesand cross-country differences in energy costs.
7. Discussion and conclusion
The importance to control energy costs has become increasinglyimportant for the European paper industry. In order to reduce en-ergy costs in paper production, several strategies can be applied,for example an increase in energy efficiency of production, a switchin fuel and/or the uptake of a novel energy conversion technology.The efficiency of the applied strategy is for a certain part depen-dent on country-specific factors. The aim of this research has beento investigate whether improved energy conversion strategies canoffset energy price differences and reduce primary energy use andCO2 emissions for paper mills within different European countries.In this final section, we will draw conclusion based on our results.We will consider the reliability of data used and assumptions madethroughout this study and discuss the possible impact of EU Emis-sion Trading Scheme III (EU ETS III). We will conclude with recom-mendations for further work.
7.1. Conclusion on results
Our results show that differences in history and availability of re-sources has led to clearly different conversion strategies in the three
European countries. We found small differences in the ranking ofmost promising conversion routes for the three different paperand board grades. This is the results of variations in heat-to-powerdemand ratios between the selected paper and board grades. InFig. 1, it was shown that the most energy efficient conversion tech-nologies are based on natural gas. We found that a natural gas com-bined cycle has the lowest primary energy demand and the highestsensitivity to energy (gas and electricity) prices. This technologicalroute is most economic when electricity prices are high and gasprices are low (large spark spread). The fact that the Dutch paperindustry has a low primary energy use can be considered almost adirect result of Dutch history and current availability of gas. Fig. 1shows that CHP is a very suitable conversion technology for the pa-per industry as it leads to low primary energy demands. Due to along history of low electricity prices, CHP has not been so commonin Sweden. Most Swedish paper mills produce only heat and there-fore have a relatively high primary energy demand. However, due tothe large abundance of wood, many Swedish mills use biomass as anenergy source (either as black liquor in integrated mills, or as woodresidues in stand-alone paper mills). Because of this and due to lowCO2 emissions related to national electricity production, the CO2
emission profile of the Swedish paper industry is very low (Fig. 4).Our results imply that the most promising future conversion routesfor the Swedish paper and board industry are again wood based.Depending on future electricity prices, these would either be heatonly options, or biomass gasification based CHP solutions.
The Polish paper and board industry faces relatively low energycosts, due to the availability of both coal and biomass at low prices.These fuels are mostly used in heat only boilers, which results inrelatively high primary energy demand for Polish mills. Figs. 2, 3and 7 have shown that at current CO2 prices, both biomass- andcoal-based technologies offer competitive conversion routes in Po-land. With a reduction of 800 kg CO2/ton paper on average, a switchfrom coal to biomass would reduce CO2 emissions in the Polish pulpand paper industry with approximately 0.6 Mton/year. A carbonprice of 20–25 €/ton would, according to our results, be enough toprovoke this switch in Poland. If CO2 prices would increase, thecoal-based energy conversion strategies will become more expen-sive. The Polish industry should therefore increase their use of bio-mass. Since the electricity mix in Poland is also dominated by coal,the on-site production of electricity (CHP) from biomass would, inthe case of high CO2 prices, be a beneficial strategy.
A switch from natural gas to biomass in the Dutch paper indus-try would reduce CO2 emissions by approximately 500 kg CO2/tonpaper. Due to the high share of natural gas, the CO2 emission reduc-tion potential of the Dutch paper industry is, with approximately1.5 Mton/year, even larger than in Poland that has a comparable an-nual paper production. Energy costs for Dutch mills are high ascompared to the other case study countries. Due to the lack ofdomestically available biomass, most of the biomass based alterna-tives do not seen promising alternatives in the near future, unlessprices for imported biomass decrease. A Dutch switch to biomasswould therefore not be an effective energy strategy (Fig. 4). Dueto high biomass prices and given the relative low CO2 emission pro-file of natural gas, a carbon prices of more than 60 €/ton CO2 wouldbe needed to provoke a switch in The Netherlands. At such high car-bon prices, however, Dutch mills would be outcompeted by theSwedish and Polish bio-based mills that benefit from stable ordecreasing energy costs at increasing carbon prices (Figs. 6 and7). Provided with few alternatives, the most effective strategy inThe Netherlands would be an increase in energy efficiency.
7.2. Discussion of data quality, methodology and assumptions
One of the main uncertainties in our results is related to thequality of data on prices and costs. Fuel prices are highly volatile

112 J. Laurijssen et al. / Applied Energy 98 (2012) 102–113
which increases uncertainty of results. We have tried to reduceuncertainties by working with data-ranges, based on historic pricefigures, current price levels and future price predictions. Error barsin Figs. 2 and 3 indicate the impact of assumptions and chosenprice-ranges on calculated energy costs. Band widths of some con-version routes (especially the combined cycle routes) are so largethat they can be the cheapest or most expensive conversion option,depending on e.g. specific gas and electricity prices.
In order to simplify our analysis, we did not differentiate be-tween marginal and average electricity production from the grid.In cases where electricity produced on site replaces electricity fromthe gird, however, it is actually the marginal production that is re-placed, not the average. Especially in the Swedish case studies (andto a smaller extent the Dutch case studies), this might have led tounderestimations of the CO2 avoidance potential of certain routes.Although the average CO2 emissions from the Swedish grid arevery low due to large contributions of hydropower and nuclear en-ergy, cogeneration is under normal circumstances the marginalgeneration in Sweden. In the Nordic and North European powermarkets it is mainly coal-fired condensing power plants that havethe highest variable cost and thus work as the marginal source ofelectricity. As Sweden is a part of this larger electricity market,and exchanges electricity with its neighbouring countries, coalcondensing could be considered the marginal source in Swedenas well as in the rest of the EU when considering a fully deregu-lated European electricity market with no restrictions on transfercapacity [47]. Our assumption of national average grid mixreplacement probably influences the Polish results the least, astheir national grid is mainly coal based. Another important issueis that we did not take into account the effect of carbon prices onthe price of electricity. In our sensitivity analysis we discuss carbonprices of more than 50 €/ton. Such high carbon prices will also af-fect the prices of electricity from the grid, but the extent to whichprices are affected depends on the fuel used to produce the elec-tricity. In the case of Sweden, for example, the average price ofelectricity will only be partly affected while the marginal electric-ity price will largely increase. With increasing carbon prices andresulting increasing electricity prices, the cost effectiveness ofbio-based CHP options will most certainly increase. We have alsonot taken into account differences between day and night tariffsof electricity. Especially in the case of CHP this is an important is-sue. Due to increased base load capacity in e.g. The Netherlandselectricity prices during night are declining which affects the com-petitiveness of CHP. Flexibility in CHP (e.g. the possibility to in-crease or decrease the amount of electricity production whileremaining the required steam production) is becoming an increas-ingly important conversion strategy (see also [48]). Another uncer-tainty lies in investment cost estimates of selected conversiontechnologies. Cost data were taken from literature. Especially forbiomass and black liquor gasification technologies, there appearedto be large variations in investment cost figures found in literature;also when taking into account scaling factors. We have assumed a20% uncertainty range for these technologies.
A crucial assumption within this study concerns equal energyefficiencies in paper production in all case study countries. Thisassumption is partly caused by lack of data and partly by the needto reduce the amount of variables in order to focus on differencesin energy conversion technologies. The impact of this assumptionhas been studied in a sensitivity analysis and was found to be high:a 20% reduced energy efficiency results in an energy cost increaseof almost 20%. Our relative outcomes give good insights, but abso-lute energy cost figures and resulting cross-country differences inenergy costs should be interpreted with care. Especially since inpractice, it is likely that paper mills facing high energy prices(e.g. The Netherlands) have a more energy efficient production pro-cess in order to stay competitive. Moreover, the paper industry
structure in the different countries varies largely with regard toscale. It is expected that large paper mills in e.g. Sweden have beenable to increase energy efficiency to a higher degree than the smal-ler paper mills in e.g. Poland, due to increased cost effectiveness ofenergy reduction measures at larger scale. Similar scale-effects canbe expected in the uptake of novel energy conversion technologies.
7.3. EU Emission Trading Scheme (EU ETS)
In the past, European policies have focused mainly on CO2 emis-sion reduction and sustainable energy production while less onenergy efficiency. Our results show that there are, in many cases,trade-offs between the three. The EU ETS is a key instrument inEuropean climate policy. Based on experiences from the first yearsof the EU ETS the design has been changed for period 2013–2020(EU ETS III). Two major changes compared to the first two tradingperiods are (a) the EU-wide allocation plan instead of national allo-cation plans and (b) auctioning (instead of grandfathering) as thedominating allocation method. From 2013 on, the power sector willneed to buy all carbon credits via auctioning. Other industrial sec-tors (without potential carbon leakage) will start with 80% free allo-cation in 2013 which is reduced to 30% in 2020. CO2 allowances forthe European pulp and paper industry will be based on benchmarks.As the sector is recognised as globally operating and prone to inter-national competition (carbon leakage), mills will receive a volumerepresenting 100% of the identified benchmark values for free. Thesebenchmarks represent the emissions from heat consumption in themills per tonne of pulp and paper produced; they are based on CO2
emissions of the top 10% installations in every pulp and paper grade.The chosen reference fuel is natural gas. Remaining emissions forheat and electricity production will have to be matched by creditsbought at the CO2 market or government auctions.
In previous allocation periods, the allocation of CO2 emissioncredits was decided for by the individual countries according totheir national allocation plans (NAPs). Although the NAPs differedper country (in terms of allocation method, base year, etc.), mostmember states allocated allowances (for free) based on historicemissions, projected emissions or business as usual (BAU) scenarios.With the new European allocation method, all paper mills will beallocated based on natural gas based benchmark values (ton CO2/ton paper). This means that paper mills with biomass based conver-sion routes will most likely be rewarded with more CO2 credits thanbefore, whereas the coal fired paper mills will see a large reductionin emission credits. For the natural gas based paper mills the impactof the new allocation method depends mainly on the mill’s energyefficiency as compared to the energy efficiency of the top 10% millsthat have set the benchmark value. Moreover, since free allowancesare allocated to heat use only, mills will have to buy emission creditsfor electricity production (also in the case of CHP). This means thatmills with a low heat-to-power ratio (e.g. tissue mills) will is mostcases be affected harder than mills with a relative high heat-to-power ratio (e.g. corrugated board mills). Mills with an outsourcedCHP plant will receive emission credits for the heat used in the pro-cess (according to the benchmark value). Mills that deliver heat tononETS (and nonCL) sectors will receive emission credits for theheat produced. The latter brings good opportunities for paper millswith a biomass based CHP to deliver excess heat to e.g. district heat-ing. For mills with a CHP plant, the consequences of the new tradingsystem can also be negative. They have to buy emission credits re-lated to the electricity produced on site. Although the same is truefor electricity producers, it is not a given that grid based electricityprices will rise as a consequence of the auctioning. Several electric-ity production companies already have included these types of costs(wind fall profits) in the current electricity prices. Since the produc-tion of electricity will put extra costs to paper mills, the competitiveposition of CHP might, in that case, decline.

J. Laurijssen et al. / Applied Energy 98 (2012) 102–113 113
7.4. Recommendations
The European Pulp and Paper industry is an energy intensiveindustry. Surprisingly there is only limited research done on theenergy intensity of this industry especially when taking into ac-count possible differences between European countries. Due tolack of data, we were not able to include cross country differencesin energy-efficiency in this study. Our results indicated a highimpact of energy efficiency on energy conversion strategies andcompetitiveness of the industry in general, and we therefore rec-ommend further research in this field. Moreover, the effects of anincreasingly deregulated and interconnected electricity marketon the conversion strategies in the European pulp and paper indus-try could be further explored, especially by taken into accountmore explicitly the differences between marginal and average gridbased electricity as well as the effect of increasing carbon prices onthe competitiveness of CHP.
References
[1] International Energy Agency (IEA). Industrial energy-related technologies andsystems (IETS). <http://www.iea-iets.org/oslo/iea-iets.nsf/id/B125F39E3F992679C125711E00454065?OpenDocument> [accessed 29.12.11].
[2] CEPI. Confederation of European Paper Industries. Sustainability report; 2009.[3] CEPI. Confederation of European Paper Industries. Key statistics; 2009.[4] CEPI. http://www.cepi.org/Content/Default.asp?PageID=54 [accessed
29.12.11].[5] Ecofys. Methodology for the free allocation of emission allowances in the EU
ETS post 2012. Sector report for the pulp and paper industry, by order of theEuropean Commission; November 2009. <http://www.ec.europa.eu/clima/policies/ets/benchmarking/docs/bm_study-pulp_and_paper_en.pdf>.
[6] Schmidt J, Leduc S, Dotzauer E, Kindermann G, Schmid E. Cost-effective CO2
emission reduction through heat, power and biofuel production from woodybiomass: a spatially explicit comparison of conversion technologies. ApplEnergy 2010;87:2128–41.
[7] Basu P, Butler J, Leon MA. Biomass co-firing options on the emission reductionand electricity generation costs in coal-fired power plants. Renew Energy2011;36:282–8.
[8] Möst D, Fichtner W. Renewable energy sources in European energy supply andinteractions with emission trading. Energy Policy 2010;38:2898–910.
[9] Difs K, Wetterlund E, Trygg L, Söderström M. Biomass gasification opportunitiesin a district heating system. Biomass Bioenergy 2010;34:637–51.
[10] Kalina J. Retrofitting of municipal coal fired heating plant with integratedbiomass gasification gas turbine based cogeneration Block. Energy ConversManage 2010;51:1085–92.
[11] Eriksson H, Harvey S. Black liquor gasification—consequences for both industryand society. Energy 2004;29:581–612.
[12] Joelsson JM, Gustavsson L. CO2 emission and oil use reduction through blackliquor gasification and energy efficiency in pulp and paper industry. Resources,Conserv Recycling 2008;52:747–63.
[13] Carlsson P, Wiinikkaa H, Marklunda M, Grönberga C, Petterssona E, LidmanaM, et al. Experimental investigation of an industrial scale black liquor gasifier.1. The effect of reactor operation parameters on product gas composition. Fuel2010;89:4025–34.
[14] Pettersson K, Harvey S. CO2 emission balances for different black liquorgasification biorefinery concepts for production of electricity or second-generation liquid biofuels. Energy 2010;35:1101–6.
[15] Naqvi M, Yan J, Dahlquist E. Black liquor gasification integrated in pulp andpaper mills: a critical review. Bioresource Technol 2010;101:8001–15.
[16] Laurijssen J, Marsidi M, Westenbroek A, Worrell E, Faaij A. Paper and biomassfor energy? The impact of paper recycling on energy and CO2 emissions.Resources, Conserv Recycling 2010;54:1208–18.
[17] Koninklijke Vereniging van Nederlandse Papier-en kartonfabrieken. AnnualStatistics; 2008.
[18] European Commission. Netherlands – Energy Mix Fact Sheet. European Commission Website. <http://ec.europa.eu/energy/energy_policy/doc/factsheets/mix/mix_nl_en.pdf> [Cited 01.07].
[19] Eurostat, Statistical Office of the European Communities. Energy statistics-prices. Electricity prices for industrial consumers (€/kW h). on-line database<http://epp.eurostat.ec.europa.eu> [accessed 06.10].
[20] Swedish Forest Industries Federation. Pulp & Paper Statistics 2010; Stockholm,Sweden. <http://www.forestindustries.se/web/Statistics_2010.aspx> [accessed23.12.11].
[21] European Commission. Sweden – Energy Mix Fact Sheet. EuropeanCommission Website. <http://ec.europa.eu/energy/energy_policy/doc/factsheets/mix/mix_se_en.pdf> [Cited 01.07].
[22] Malinowski T, Michniewicz, M. Overview of the Polish paper industry,Institute of Biopolymers and Chemical Fibers, Lodz, Poland. Presented atEcotarget 3rd open workshop, Słok, Poland; 16–17 October, 2007.
[23] Nilsson LJ, Pisarek M, Buriak J, Oniszk-Poplawska A, Bucko P, Ericsson K, et al.Energy policy and the role of bioenergy in Poland. Energy Policy 2006;34:2263–78.
[24] European Commission. Poland – Energy Mix Fact Sheet. European CommissionWebsite. <http://ec.europa.eu/energy/energy_policy/doc/factsheets/mix/mix_pl_en.pdf> [Cited 01.07].
[25] Holmberg H, Tuomaala M, Haikonen T, Ahtila P. Allocation of fuel costs andCO2-emissions to heat and power in an industrial CHP plant: case integratedpulp and paper mill, Appl Energy, [accessed 26.12.11].
[26] Svensson E, Berntssona T, Strömberg A-B. Benefits of using an optimizationmethodology for identifying robust process integration investments underuncertainty – a pulp mill example. Energy Policy 2009;37:813–24.
[27] Karlsson M. The MIND method: a decision support for optimization ofindustrial energy systems – principles and case studies. Appl Energy2011;88:577–89.
[28] Axelsson E. Process integration to facilitate lignin separation: technoeconomicevaluation and comparison with increased electricity production. Chalmersenergy conference 26/1/2011.
[29] Axelsson E, Berntsson T. Profitability and off-site CO2-emission reduction fromenergy savings in the pulp and paper industry in different future energymarkets. Int J Energy Res 2011. http://dx.doi.org/10.1002/er.185.
[30] International Energy Agency. World energy outlook 2009, Paris; 2009.[31] Eurostat, Statistical Office of the European Communities. Energy statistics-
prices. Prices for industrial consumers. On-line database <http://epp.eurostat.ec.europa.eu> [accessed 10.10].
[32] International Energy Agency. Oil market report. <http://omrpublic.iea.org/>[accessed 04.11].
[33] <http://e-coal.com> Prices for October 2010. [accessed 04.11].[34] <www.endex.nl> Prices of wood pellets. [accessed 04.11].[35] Olsson O, Vinterbäck J, Dahlberg A, Porsö C. Price mechanisms for wood fuels.
Deliverable 3.2. EUBioNet 3. Solutions for biomass fuel market barriers andraw material availability; April 2010. <http://www.eubionet.net/default.asp?SivuID=25484>.
[36] Stolarski M, Szczukowski S, Tworkowski J. Ekonomiczne aspekty produkcjibiomasy wierzby w systemie Eko-Salix. (Economical aspects of willowbiomass production in Eco-Salix system-in Polish with English summary)Roczniki Nauk Roln. Seria G 2010;97:82–9.
[37] Wit M, Faaij A. European biomass resource potential and costs. BiomassBioenergy 2010;34:188–202.
[38] Vreuls HHJ, Zijlema PJ. Nederlandse lijst van energiedragers en standaard CO2
emissiefactoren – Versie; December 2009. <http://www.broeikasgassen.nl>.[39] International Energy Agency. CO2 Emissions from fuel combustion; 2007.[40] Borjesson M, Ahlgren EO. Biomass gasification in cost-optimized district
heating systems—a regional modelling analysis. Energy Policy 2010;38:168–80.
[41] Larson ED, Consonni S, Katofsky RE, Iisa K, James Frederick Jr W. An assessmentof gasification-based biorefining at Kraft pulp and paper mills in the UnitedStates, Part B: Results. TAPPI J 2009;8:27–35.
[42] Fritzson A, Berntsson T. Energy efficiency in the slaughter and meat processingindustry – opportunities for improvements in future energy markets. J FoodEng 2006;77:792–802.
[43] Marel J van der, Goudappel E, Ebbinge Wubben B. Techno-EconomischeParameters SDE WKK. 2008 Jacobs Consultancy, Leiden; 31 maart 2008.
[44] Gustavsson L, Holmberg J, Dornburg V, Sathre R, Eggers T, Mahapatra K, et al.Using biomass for climate change mitigation and oil use reduction. EnergyPolicy 2007;35:5671–91.
[45] Joanneum Research. Interim report <http://www.cres.gr/biocogen/pdf/solid%20biomass.pdf> [accessed 10.10].
[46] Stahl K. Biomass IGCC at Värnamo Sweden – Past and Future. GCEP EnergyWorkshop; April 27, 2004. <http://gcep.stanford.edu/pdfs/energy_workshops_04_04/biomass_stahl.pdf>.
[47] Trygg L, Amiri S. European perspective on absorption cooling in a combinedheat and power system – a case study of energy utility and industries inSweden. Appl Energy 2007;84:1319–37.
[48] Marshman DJ, Chmelyk T, Sidhu MS, Gopaluni RB, Dumont GA. Energyoptimization in a pulp and paper mill cogeneration facility. Appl Energy2010;87:3514–25.