Climate Change Policy in European Countries and its effects on industry
24
FACULTY OF ECONOMICS AND APPLIED ECONOMIC SCIENCES CENTER FOR ECONOMIC STUDIES ENERGY, TRANSPORT & ENVIRONMENT KATHOLIEKE UNIVERSITEIT LEUVEN WORKING PAPER SERIES n°2003-5 Stef PROOST (K.U.Leuven-CES-ETE) and Denise VAN REGEMORTER (K.U.Leuven-CES-ETE) March 2003 secretariat: Isabelle Benoit KULeuven-CES Naamsestraat 69, B-3000 Leuven (Belgium) tel: +32 (0) 16 32.66.33 fax: +32 (0) 16 32.69.10 e-mail: [email protected] http://www.kuleuven.be/ete Climate change policy in European countries and its effects on industry
-
Upload
independent -
Category
Documents
-
view
4 -
download
0
Transcript of Climate Change Policy in European Countries and its effects on industry

FACULTY OF ECONOMICS AND APPLIED ECONOMIC SCIENCES CENTER FOR ECONOMIC STUDIES ENERGY, TRANSPORT & ENVIRONMENT
KATHOLIEKE UNIVERSITEIT
LEUVEN
WORKING PAPER SERIES
n°2003-5
Stef PROOST (K.U.Leuven-CES-ETE)
and
Denise VAN REGEMORTER (K.U.Leuven-CES-ETE)
March 2003
secretariat: Isabelle Benoit KULeuven-CES
Naamsestraat 69, B-3000 Leuven (Belgium) tel: +32 (0) 16 32.66.33 fax: +32 (0) 16 32.69.10
e-mail: [email protected] http://www.kuleuven.be/ete
Climate change policy in European countries and its effects on industry
1
CLIMATE CHANGE POLICY IN EUROPEAN COUNTRIES AND ITS EFFECTS ON INDUSTRY1
Stef Proost Denise Van Regemorter Center for Economic Studies KULeuven Belgium Contact: [email protected] ABSTRACT In this paper we discuss the effects of different climate change policies on industrial activity. We compare the effects of carbon taxes, grandfathered permits, technology standards and voluntary agreements. We survey first the insights from economic theory and from model experiments for the US. Next we use a general equilibrium model, to assess the effect of different climate change policies on industrial activity per sector and per member country in the EU. We pay particular attention to the effects of policies where EU member states exempt their energy-intensive sectors from abatement efforts. The main findings are that, in the EU, the effects on industrial activity and the welfare costs of carbon abatement policies that use tradeable permits or carbon taxes are small when no industrial sectors are exempted. When one member country exempts its energy intensive sector, this will have a small positive impact on its activity level but will generate an extra welfare cost for the EU.
1 We acknowledge financial support of the Flemish Region in Belgium (PBO-contract). We thank Johan Eyckmans, Haroon.s.Kheshgi and Madhu Khanna for helpful comments on a first version. An earlier version of this paper has been presented at the Symposium on Climate Change and Environmental Policy, University of Illinois at Urbana –Champaign, November 2002

2
KEYWORDS Environmental policy, taxes, marketable permits, industry, climate change policy

3
Introduction The EU has committed itself to comply with the Kyoto protocol and thus to reduce its emissions of greenhouse gasses. How to reach these goals is still the subject of intense policy debates and many studies. When a union of countries joins an agreement that caps total emissions, there are three types of policy issues to be solved 2. First one needs to decide what share of the efforts is done within the EU (world-wide emission trading with non-EU countries accepted or not etc.). Next one needs to allocate reduction efforts over different EU-member countries because it are, in the end, the member countries that control most policy instruments. Finally the EU can help and guide the policy processes of the member countries by proposing EU wide implementation of policy instruments as there are tradable permits, carbon taxes, product standards etc.. The first question, what share of efforts is to be done within the EU is still somewhat open. The second question has been solved in 1998, when member countries agreed to national emission caps in the so-called “burden sharing agreement”. The last question: what policy instruments will actually be used to reach the objectives is the hottest topic because it will determine the real efforts and burden of the different polluting sectors. Different carbon tax proposals have been advanced but none has been accepted. The main policy proposal under discussion at present is a proposal of EU wide emission trading for a selected set of energy intensive industries (Commission, 2001). It is no surprise that it is difficult to agree on the choice of policy instruments. At present the carbon intensive industrial sectors are the most active in lobbying. The stakes for the carbon intensive firms are high as their profits and equity value may be strongly affected (see Keohane, Revesz, Stavins (1998) for a political economy approach to this). This may be even more so in the EU member states as the industry in each member state is afraid that their competitors in the other member states may face
2 See Braden & Proost (1997) for an overview of theoretical issues and Proost and Braden (1998) for some early work on climate change policies in the EU.

4
more favourable policy regimes. Lobbying by the transport sector and household energy users is more limited as the ultimate incidence of carbon taxes on household income groups will be dissipated and will be relatively small if labour markets work appropriately (Proost and Van Regemorter,(1995)). In this paper we discuss the effects of different climate change policies on industrial activity. Our focus is on the US and the EU. In the first section we use economic theory insights to compare the effects of carbon taxes, grandfathered permits, technology standards and voluntary agreements. Next we look into the results of Bovenberg & Goulder (2002). They studied the effects on industrial activity of carbon taxes and tradable permits in the US with a general equilibrium model. They tested the effects on activity and equity values of different compensation policies for the energy intensive sectors. Next we turn to the EU and examine the effects of different carbon polices with a general equilibrium model. We compare first the effects of policies that use different instruments: domestic permits, EU wide permits and carbon taxes recycled via higher transfers or via lower social security contributions. All these policies are applied uniformily. Next we focus on the effects of policies where one country exempts its energy intensive industry. This will be our interpretation of the voluntary agreements that are used in many countries for the energy intensive sectors. In the last chapter we draw conclusions. In our paper we focus on the activity effects of different climate change policies and less on the overall welfare effects. The overall welfare effects have been surveyed by several authors including IPCC (2001) and Weyant (1999). The activity results we study are also confined to the case where the rest of the world (non US or non EU) do not change their policies. So our analysis is at the level of a federation rather than at the world level. Jensen and Rasmussen (2000) also study the effects of different policy instruments on activity levels by industry but they focus on one member country (Denmark) only. There are several caveats in our analysis. First we focus on a given emission reduction objective for a country or a group of country. Adding flexibility to this constraint by using world wide emission trading or world wide emission taxes will relax the constraint. Second, we do not discuss interactions between the world-wide climate change negotiations and world-wide trade and the choice of local policy instruments. These interactions exist and can be important via carbon leakage effects. So can the use of import tariffs for energy intensive goods imported from non-annex B countries be an effective policy instrument on top of a permit or carbon tax policy. Third we limit our analysis to an analysis of a few “pure” instruments and do not discuss variations on these instruments or combinations of instruments that can be interesting. Finally, our analysis is limited to measuring effects on sectoral activity and total welfare, this is only one of the inputs in a more detailed and dedicated political economy approach of the choice of policy instruments.

5
1. THEORETICAL PRESCRIPTIONS OR WHAT DO WE REALLY KNOW BEFORE WE START USING MODELS?
1.1. Introduction In order to reach a CO2 emission reduction target one has the choice between different policy instruments: a carbon or an energy tax, tradable permits, a technology standard, voluntary agreements or a combination of these instruments. The pros and cons of these instruments have been studied extensively. The best choice will depend on the implementation details, on the precise objectives pursued and on the characteristics of the sector. Over the last 10 years, a much more refined theory on the efficiency of different policy instruments has evolved. We discuss the main issues in three sections of increasing complexity. We study first a closed economy and disregard the rest of the economy. Next we discuss the interactions of this policy problem with the rest of the economy. Finally we analyse the effects in an open economy. The distinction closed and open economies is highly relevant when we want to compare policy making in the USA and for European countries. The US has an export share of GDP of 10%, a country as France has an export share of 30% but smaller countries like Belgium and the Netherlands have an export share of over 50%. When selecting policy instruments, economists tend to focus on the efficiency objective. In its simplest interpretation, this means minimum abatement costs, in its more elaborate version this means taking into account the secondary effects on all other distorted markets. There is however still a large discrepancy between the recent theoretical developments on the relative efficiency of instruments and the political acceptability discussions where not only different objectives but also often very different frameworks are used to assess policy choices. We will try to highlight some of these differences in this text.
6
1.2. Choice of instruments in a closed economy
1.2.1. Theory in a first best world
We are interested in the problem where one country wants to comply with an internationally agreed cap on emissions. It is of interest to compare the view of an industrial sector and a welfare point of view for the country as a whole. We do this mainly graphically3 and assume that there is no international trade in emissions, that the economy is perfectly competitive and that there are no other distortions or transaction costs. In Figure 1 we depict the demand and supply of output for a carbon intensive sector. In the absence of any expected emissions policy we start in an equilibrium A1. In this equilibrium, the sector earns a gross profit A1 C B and this profit is at the equilibrium sufficient to attract equity and other capital in order to pay for the costs of capacity. Next we introduce four different carbon policies: a carbon tax, grand fathered tradable permits, a technology standard and a voluntary agreement. A carbon tax means that firms will make abatement costs (more energy efficient production, less carbon intensive fuels) and will pay emission taxes on the remaining emissions per unit of output. The extra abatement costs shift the supply curve upward to Sabat and the tax on remaining emissions shifts the supply curve higher to S carbon tax . The new equilibrium is A2 and the resulting welfare loss (gross because we do not account for reduced climate change damages in this text) is the increased abatement cost (the upward shift of the supply curve or GFDC) plus the market distortion triangle A2 A1 D. This welfare cost corresponds to the cost of using the two techniques to reduce emissions in an optimal combination: reduce emissions per unit of output and reduce the output level. The welfare loss is the net result of a large gain in tax revenue(the shaded rectangle), a large loss in producer surplus (now EFG instead of A1BC) and a large loss in consumer surplus (J A2 A1 E).
3 One can find more extensive graphical analysises in Bovenberg and Goulder (2001) and Fullerton (2001).

7
In the case of a carbon tax, the abatement costs are in general the smaller component of the welfare loss because there exists, besides fuel switching and energy saving, no easy technological solution for the abatement of the CO2 emissions. The result will be an important emission tax to be paid by industry, reduced output levels and reduced profits. The net effect on producer surplus of a carbon tax will depend on the abatement possibilities and on the elasticity of demand and supply. With a more elastic demand, a smaller part of the increased marginal cost (difference between S and S carbon tax) can be passed on to consumers so that the output reduction is larger and the loss in producer surplus is larger too. The elasticity of supply (or slope of the marginal cost functions in our case of perfect competition) will determine how large is the initial producer surplus. The elasticity of supply will also determine what share of the increase in marginal cost can be passed to consumers, if the elasticity of supply is large, the producer can pass on a large part of the cost increase to consumers. The elasticity of supply has to do with the importance of the fixed factor (capital or land). When an industry is very capital intensive (and this capital is specific), the elasticity of supply will be small and this industry will have to absorb an important part of the increase in marginal cost so that its producer surplus will be reduced more strongly.
Figure 1 Effects of environmental policies in partial equilibrium
Output
Price
Demand
S=Marg Cost of production
SAbat= S + abatement cost per unit of product
Scarbon tax
A2
A3
A1
D
Carbon tax
G
C
F
J
E
O1O3O2
Carbon tax payments
B
A tradeable permit scheme will generate the same shift in supply curves and gives rise to the same equilibrium A2. The explanation is simple: with perfect competition, one knows that the marginal production cost equals the resource cost before emission abatement, plus the abatement cost per unit of product plus the cost of the permits for the remaining emissions per unit of product. If the total emission reduction that is required is identical, the equilibrium permit price will be equal to the carbon tax and the equilibrium will be the same. Policy makers poorly understand this point: one commonly assumes that a tradable permit scheme will give rise to lower consumer prices. The source of the misunderstanding is the idea that firms use average cost

8
pricing. When average cost pricing is used, the tradable permits that are received reduce total production costs and therefore average costs so that prices can be decreased compared to a system of carbon taxes. This reasoning only holds if firms adopt average cost pricing but this is not in the interest of the firm itself so this is not a credible assumption. The main difference between carbon taxes and tradable permits is the distribution of the gains and losses. With grand fathered permits there will be no tax revenues, the loss in consumer surplus will be identical to the loss in the carbon tax case and the carbon tax revenue has now been converted to producer surplus for the existing producers. This means a high increase in profits if demand is not too elastic. One of the main differences between a carbon tax and a tradable emission permit scheme is that an industrial sector can lobby to obtain a larger share of the emission permits. This may be more difficult in the case of a uniform carbon tax. For a given emission reduction per sector, the welfare loss of a technology standard will depend on the degree to which the standard will be differentiated according to the differences in marginal abatement costs within the sector. If the marginal abatement costs differ strongly among firms but the standards do not, the abatement costs will be much higher than the abatement costs incurred with a carbon tax. If the technology standards are perfectly differentiated, we can assume that the abatement costs to reduce emissions per unit of output are exactly equal to the costs caused by a carbon tax. This would lead to equilibrium A3 with a lower price increase because the remaining emissions are not taxed. This equilibrium is of course more interesting for industry and consumers but it can not be compared to the equilibrium A1 or A2 because it has a lower total emission reduction: what is missing is the emission reduction corresponding to the decrease in output from O3 to O2. In the case of an emission standard, the only way to make up for this difference is to use stricter technology standards and this leads to a higher overall welfare cost of emission reduction than in the case of an emission tax or tradable permits. The reason is that the two techniques of emission reduction (lower emission per unit of output and lower output) are not used in an optimal combination. Again the carbon intensive industries may be relatively successful in negotiating lower efforts than in the case of a carbon tax. As we have asymmetric information between the policy maker and the firms and the stakes are higher for the more carbon intensive industry, the energy-intensive industry has a larger interest in lobbying efforts and may very well come out with relatively low efforts. The fourth instrument that is particularly fashionable in the EU is a volontary agreement at sector level. We concentrate here on those agreements where a technological standard (emissions per unit of output) has to be reached. This instrument has generated a lot of recent research work (see Alberini and Segerson (2002), Khanna (2001)). Any voluntary scheme is somewhat different. For environmental effectiveness, one needs two conditions: sufficient participation and sufficient abatement by every participant. Sufficient participation can be achieved via either sticks or carrots. Carrots can be effective but have a cost: government funds are needed say for subsidies for emission reduction and this will increase output levels. The major stick is the threat to use instruments that have a more negative effect on the profit level: carbon taxes or absolute and stricter caps on emissions. The effectiveness depends on the credibility of the threat: if new laws and regulations need to be produced to enforce the stick (say voting a carbon tax), this will be less credible than removing an exemption from a

9
general law. The effectiveness will also depend on the presence of free riding. When a target is agreed with an industrial sector, individual firms may free ride and rely on the others to make the abatement efforts. The abatement effort itself will also be the result of the negotiation process between sector and regulator. This result will again depend on the credibility of the threat. The actual effort by industry will be an outcome of negotiations in which the government has less information about the abatement costs. Table 1 summarizes the sectoral effects one can expect in a first best closed economy. It is clear from this table that the carbon intensive sectors will avoid a carbon tax and prefer other instruments. At first sight, existing firms will favour grand fathered tradable permits. In practice most industrial lobby groups prefer technology standards and or voluntary agreements. The explanation for this preference is not obvious. One possibility is that the demand function is perceived as very price elastic at the level of the firm so that they prefer to control the level playing field by imposing technological standards upon all firms of the sector rather than to risk that one firm may get a more favourable allocation of emission rights.
Table 1 Sectoral effects of different instruments (assessment in a partial equilibrium framework).4
Abatement cost Consumer surplus
Producer surplus
Tax revenue in this sector
Carbon tax Minimum Strong Decrease Strong decrease Strong increase Tradeable permits (grandfathered)
Minimum if low transaction cost
Strong Decrease Smaller decrease (high price elasticity) and otherwise increase
None
Technology standard
Higher (insufficient differentiation and because of lower output volume effects)
Small decrease Small decrease None
4 The total gross welfare cost is obtained by adding the consumer and producer surplus as well as the tax revenue – the abatement costs are already integrated in the producer surplus . This is a gross measure because the changes in environmental damage are not included.
10
Voluntary agreements
Higher (Insufficient differentiation, lower output effects and incomplete participation)
Small decrease Small decrease Decrease if subsidies are needed to buy participation
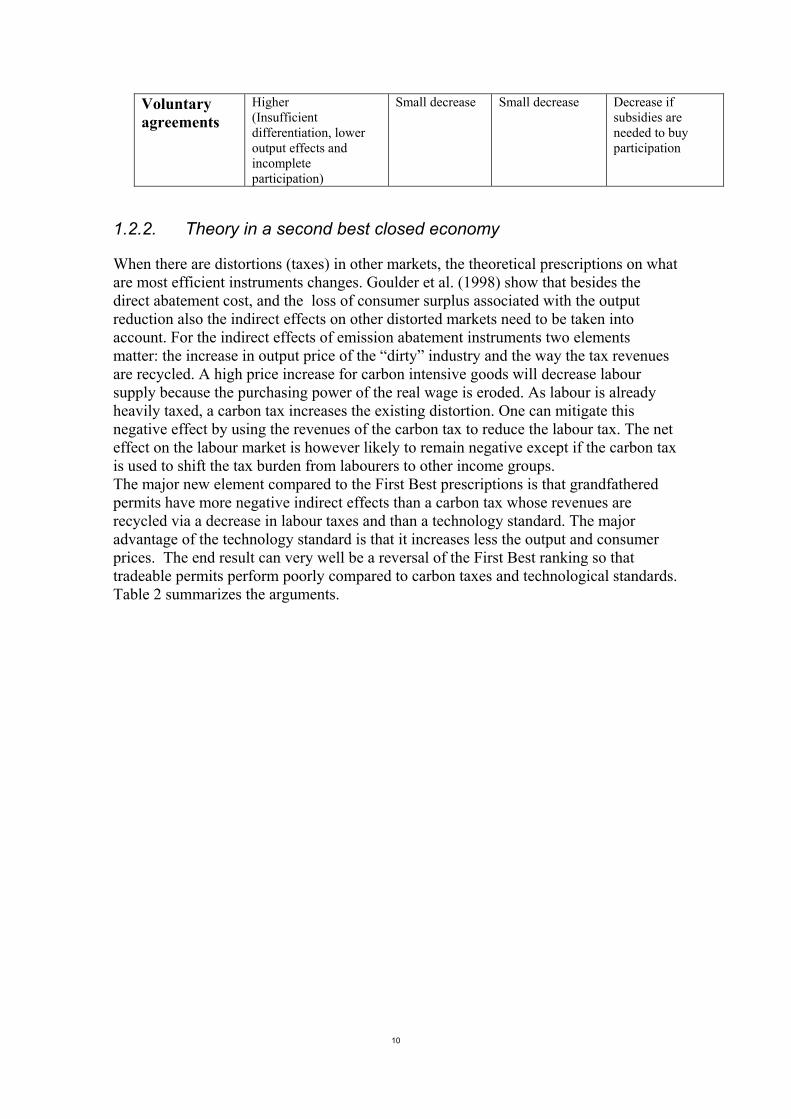
1.2.2. Theory in a second best closed economy
When there are distortions (taxes) in other markets, the theoretical prescriptions on what are most efficient instruments changes. Goulder et al. (1998) show that besides the direct abatement cost, and the loss of consumer surplus associated with the output reduction also the indirect effects on other distorted markets need to be taken into account. For the indirect effects of emission abatement instruments two elements matter: the increase in output price of the “dirty” industry and the way the tax revenues are recycled. A high price increase for carbon intensive goods will decrease labour supply because the purchasing power of the real wage is eroded. As labour is already heavily taxed, a carbon tax increases the existing distortion. One can mitigate this negative effect by using the revenues of the carbon tax to reduce the labour tax. The net effect on the labour market is however likely to remain negative except if the carbon tax is used to shift the tax burden from labourers to other income groups. The major new element compared to the First Best prescriptions is that grandfathered permits have more negative indirect effects than a carbon tax whose revenues are recycled via a decrease in labour taxes and than a technology standard. The major advantage of the technology standard is that it increases less the output and consumer prices. The end result can very well be a reversal of the First Best ranking so that tradeable permits perform poorly compared to carbon taxes and technological standards. Table 2 summarizes the arguments.

11
Table 2 Ranking of policy instruments in a second best environment
Abatement efficiency
Other efficiency effects
Total efficiency or total welfare cost
Effect on profits
Carbon tax recycled via reduced labour taxes
Best Good if correct tax revenue recycling
Best Strongly negative
Grand fathered tradable permits
Best if low transaction costs
Bad Mediocre Positive
Technology standard
Mediocre, depends on degree of detail
Good Mediocre Weakly negative
Voluntary agreements
Mediocre Good Mediocre Weakly negative
Parry et al (1999) compared carbon taxes and grand fathered tradable permits and found that the welfare cost of using grand fathered permits can be much higher (0.8 to 4 times higher) than with a carbon tax. Goulder et al.(1999) compared emission taxes, grand fathered tradable permits, technology standards and fuel taxes in the case of NOx emissions. They found again that correctly recycled taxes and “efficient”(this means perfectly differentiated) technology standards are more efficient than permit systems.
1.3. Choice of instruments in an open economy There are three additional elements when one considers an open rather than a closed economy. First in an open economy, the demand functions (cfr. Fig 1) are more price- elastic and this reduces the possibilities to pass the increased costs to the consumers. Second, the consumers of the produced “dirty” goods are not necessarily national citizens or firms. This means that any price increase of export goods is in fact a shift of the burden to the Rest of the World. The extent of tax shifting will depend on the price elasticity of exports. The third consideration is more indirect. Some local environmental policies of countries, participating in an agreement, may induce relocation of their plants to non cooperating countries. If the country participating in the environmental agreement is concerned about the net change in emissions in the world, it may want to give specific attention to relocation to non-signatory countries. This may then require specific policies as there are location subsidies and trade instruments (see e.g. Maestad, 2001). This starts from the premise that an individual country is concerned about the environmental outcome of their policy. This premise may not be rational. If the country is small, it may weigh the costs of its abatement policy much more heavily than its indirect environmental damage. If this is the case the so-called carbon leakage effect is not relevant for a small country that has to select its carbon policy.

12
2. INDUSTRIAL EFFECTS OF CARBON POLICIES IN THE US One of the major problems in the acceptance of a carbon tax is the negative influence on the profits of some industries. Bovenberg and Goulder (2001) compare, for the US, carbon tax policies that try to mitigate the negative effect on profits. We classify their experiment under the category ”closed” economies because the US foreign sector is relatively small and because all exports of fuels are exempted from a carbon tax and all imports of fuels are subject to a carbon tax. We analyse their results under the form of 2 tables. All simulations produce the same total greenhouse gas emission reduction via a carbon tax of approximately 25$ / ton of CO2. Table 3 reports the output changes and after profits impacts per industry as well as the total efficiency cost for the economy for 3 carbon tax policies that are not industry specific. Table 4 reports results for 3 carbon tax policies that are industry specific.
Table 3 Effects of a 25 dollar CO2 tax in the US after 2 years of implementation– industry neutral
Lump sum recycling
Reduction personal income tax
Reduction corporate income tax
% changes compared to reference
Output After tax profits
output After tax Profits
output After tax profits
Coal mining -19.2 -32.5 -19.1 -32.3 -19.2 -32.0 Oil and Gas -2.0 -2.3 -2.1 -2.3 -1.3 -0.3 Refineries -7.9 -9.2 -7.8 -9.1 -7.9 -8.1 Electric utilities -3.0 -7.7 -3.0 -7.4 -3.0 -7.1 Average for others
-0.2 -0.9 -0.1 -0.7 -0.1 0.2
Efficiency Cost (billions $ of 2000)
100 (reference) = 817 billions of 2000
51 46
From table 3 one can draw three lessons. First there are strong reductions in the output levels of some carbon intensive industries. This was expected, as fuel substitution away from coal and reduced fossil fuel use in general are important components of a cost effective carbon reduction policy. The second lesson is that the recycling of the tax revenue matters for overall efficiency mainly via labour and capital market effects but not via sectoral output effects. The efficiency cost of the carbon abatement policy can be increased by a factor 2 if tax revenue is used to decrease labour or capital taxes. The third lesson is that the recycling policies do almost not affect the after tax profits: there is a strong decrease in the profits of energy producing industries (coal and oil) but not for industry in general. The reason is that general recycling policies (like a general reduction of the corporate income tax) are too spread out to make a difference for the carbon intensive industries. In table 4, we report some of the scenarios that Bovenberg and Goulder (2001) devised to mitigate the effects on industry profits. The first policy is an industry specific reduction of the corporate income tax that achieves equity neutrality. By equity neutral they mean that the value of the firm (in the first year of the implementation of the policy) is not affected. This policy is effective in restoring the equity value of the firm

13
because the discounted sum of dividends is increased directly. It is again striking that this policy has almost the same effects on output changes as the uniform policies of table 3. This first policy is also very efficient because it reduces the distorting corporate income tax in carbon intensive sectors that also happen to be among the most capital intensive. A specific reduction of corporate income tax rates is efficient but politically probably difficult to achieve. The same equity neutrality can be achieved by using industry specific partial grandfathering. This means that some industries do not have to pay carbon taxes on their full carbon emissions or do receive some carbon emission credits for free. This is illustrated in the second column. Output effects are small but one achieves equity neutrality. Important is that this policy implies handing out much less than 100% of the permits: to achieve equity neutrality distributing 5 to 15% for free would be sufficient. The third scenario involves 100% grandfathering for all industries. This time there is for some industries actually a profit increase instead of a decrease. Although industries still emit less than previously (all scenarios achieve the same emission reduction target) and have output losses and make extra abatement efforts, profits increase because the output price increases up to the point were it equals the marginal cost (resource cost + cost of a permit). The tax revenues have now been converted into rents for industry. Many other policies can be studied. One policy that is popular is to require tax neutrality. This means that all the carbon tax payments a sector pays have to be returned to that sector. This looks reasonable but Bovenberg and Goulder actually show that this generates very high profits for the carbon intensive industries. The reason is that the carbon taxes are much larger than the decrease in producer surplus. The overall conclusion of these simulations is that there are many policies that can neutralise adverse effects on profits of a carbon tax. Almost all these policies will lead to the same changes in output levels but their efficiency effects will be very different. Policies that include 100% grand fathering or use the principle of tax neutrality (refunding all carbon tax payments lump sum) are very inefficient and generate higher profits for carbon intensive industries. The most efficient policies are those that recycle tax revenues via decreased corporate taxes and that achieve equity value neutrality via the grand fathering of a small part (2 to 15%) of the carbon permits. Two important caveats need to be mentioned. First these results hold only for a perfectly competitive economy. The second important assumption is that capital is the only immobile factor and that labour mobility is perfect. When labour mobility is not perfect, there will be much larger adaptation costs and carbon reduction policies become more costly.

14
Table 4 Effects of a 25 dollar carbon tax in the US after 2 years of implementation– profit neutralising policies for industry
Industry specific Corporate income tax reduction
Selective grandfathering for industry
100% grandfathering for all industry
% changes compared to reference
Output After tax Profits
output After tax Profits
Output After tax profits
Coal mining -18.9 -19.9 -19.1 -23.3 -19.0 +542.7 Oil and Gas 1.5 -6.6 -2.1 -4.3 -2.0 +21.4 Refineries -7.8 -5.5 -7.8 -5.3 -7.8 -9.1 Electric utilities -2.9 -5.2 -3.0 -5.4 -3.0 -7.5 Average for others
-0.1 -0.7 -0.1 -0.1 -0.1 -0.7
Efficiency Cost (reference = 100=817 billions of $ 2000)
42 62 92
3. INDUSTRIAL EFFECTS OF DIFFERENT CARBON POLICIES IN THE EU
3.1. The baseline emission scenario The total emission reduction effort that is necessary in 2010 will depend on two elements: the burden sharing among EU countries and the autonomous development of emissions. The burden sharing has been agreed in 1998 and specifies that emissions have to be reduced with a given percentage compared to the year 1990. This is the first column in Table 5. The burden sharing agreement of the EU that allocates the emission reduction efforts over different countries. This burden sharing agreement is not a uniform percentage reduction as it took into account estimates of expected economic growth and expected marginal abatement costs. We discuss the effects of a LOW baseline and a HIGH baseline scenario for emissions in 2010. As can be seen the HIGH scenario requires a total abatement effort that is twice as important as the LOW scenario. The efforts in the HIGH scenario are of a similar order of magnitude as the US efforts discussed in section 2 of this paper. The LOW scenario is interesting because it is considered more plausible given the low economic growth rates of the last years.

15
Table 5 Required Kyoto Reduction Country Reduction of GHG
needed compared to 1990 (burden sharing agreement)
LOW Reduction of carbon emissions compared to baseline 2010
H IGH Reduction of carbon emissions compared to baseline 2010
Austria -13% -18.2% -31.2% Belgium -7.5% -6.9% -27.7% Germany -21% -19.4% -15.5% Denmark -21% -28.4% -39.4% Finland 0.0% -4.4% -24.8% France 0.0% -9.8% -21.8% Greece 25.0% -5.5% -2.1% Ireland 13.0% -25.4% -28.8% Italy -6.5% -27.4% -29.1% Netherlands -6.0% -15.4% -26.7% Portugal 27.0% -11.4% -16.2% Spain 15.0% -23.4% -29.5% Sweden 4.0% -7.4% -14.1% United Kingdom -12.5% -0.9% -17.3% EU total -8.0% -12.7% -21.0%
3.2. EU- wide carbon policies without sector differentiation In this section we discuss carbon policies that are harmonised within the EU-15. All policies achieve the same total reduction in greenhouse gas emissions in 2010. In a second section we discuss non-uniform policies: when one member country takes other measures than the other member countries. We use the GEM-E3 model (Capros et al.; 1998). This is a general equilibrium model for the EU in which all member states are represented individually as well as the trade flows between member countries and the trade flows with the rest of the world. We discuss the effects of three harmonised policies: domestic tradable permit systems, EU wide permit systems and finally a carbon tax with revenues recycled via reduced labour taxes. We restrict the trade in emission rights to the EU. In fact the Kyoto-agreement allows trade within a much wider groups of countries. Our results are therefore to be considered as an upper bound estimate of costs and effects because they neglect interesting low cost abatement possibilities in other Annex B countries.
3.2.1. Tradable permits by member country
Tradable permits by member country differ from EU wide permits in that domestic permits are only tradable within a country and not within the EU. This may be important because firms that are located in the high effort member countries fear a loss of competitiveness. Table 6 reports the changes in industrial activity by sector and the economic welfare costs of a domestic permit system in the EU-15. In the domestic permit system only permit trading within the member state is allowed. Permits are grandfathered

16
proportionally to emissions in the past. By economic welfare costs we mean the equivalent variation disregarding any environmental benefits.
A domestic permit system will lead to different equilibrium permit prices in the member states: in the different scenarios CO2 permit prices vary between more than 100 Euro/ton to less than 1 Euro per ton. As the marginal production costs of all firms will consist of an abatement cost term and a permit cost term (equal to the cost of a permit times the number of permits needed per unit of product), the marginal costs of energy-intensive sectors are also increased unequally. For the effects on industrial activity it is useful to distinguish three groups. There are the energy supplying sectors ‘coal, oil, gas, electricity) there are the energy intensive sectors (ferrous and non-ferrous metals, chemical products) and there are the other sectors for which we show only the consumer goods industry. In Table 6 we report orders of magnitude for the output changes for the two scenarios. We do this for the EU total as well as for two countries separately: Germany and Belgium. We have chosen these two countries because they differ in two respects: Germany (80 million inhabitants) is a large country and has, compared to the other member states, somewhat lower than average emission reduction efforts. Belgium (10 million inhabitants) is a small country and has higher than average expected emission reduction efforts. In the LOW scenario, output effects are approx. half of those in the HIGH scenario. The effect on industrial activity for the energy supplying sectors (except electricity) will be driven by the overall decrease in demand for energy products (domestic as well as foreign and by industry as well as other sectors). For products as coal, the overall demand effect is strongly negative in all member countries because substitution of coal by gas and oil is one of the cheapest options to reduce CO2 emissions. This generates reductions in activity that are quite strong (up to almost 50%). The demand effect will also be dominant for the other energy sectors but will be less pronounced because some sectors may benefit from a substitution away from coal. Table 6 Industrial activity level effects of a domestic permit policy
LOW HIGH % diff with reference EU Germany Belgium EU Germany Belgium
Total CO2 emission -12.6 -11.1 -19.2 -21.5 -19.9 -21.0 Coal -16.2 -9.2 -31.8 -25.6 -18.2 -48.3 Oil -9.3 -2.8 -6.4 -17.3 -13.4 -21.1 Gas -4.6 -1.6 -1.2 -6.0 -5.5 -5.3 Electricity -2.4 -1.3 -2.1 -4.9 -3.7 -7.5 Ferr& n-f metals -1.7 -0.4 -2.3 -4.1 -1.5 -10.1 Chemical -0.9 -0.2 -0.9 -1.8 -1.3 -2.6 Consumer goods -0.7 0.0 -0.4 -1.5 -0.9 -3.1 Economic Welfare -0.26 -0.24 -0.11 0.0 -0.11 -0.3
For the energy intensive sectors, the overall changes in the level of economic activity are surprisingly small. For ferrous and non ferrous metals the maximum reduction in activity is 10% (in Belgium), but for most countries changes are limited to 5% or less. The same holds for the chemical products industry where the maximum changes in activity are of the order of 3%. For the EU as a whole, its climate policy (reduction of emissions of the order of maximum 21% in 2010 compared to baseline) generates changes in activity for the energy intensive sectors of the order of 2 to 4%. These

17
figures are surprisingly low. The main explana tion is the imperfect substitutability of products between member states and between the EU and the rest of the world. The price – elasticity is not infinite and this explains that demand functions are not horizontal and that part of the increased production costs can be passed on to demand. This rejoins the conclusions of Bovenberg and Goulder reported in the previous section. The main difference with Boverberg and Goulder is that we have, with domestic permit systems, also strong differences in production costs between member states and even this does not generate very large changes in industrial output for the non-energy sectors. Economic welfare costs exist but are low (of the order of 0.04% of GDP) and are spread more or less equally over the different member states. This is surprising given that the efforts by member country are very different. The main explanation are the terms of trade effects that allow to shift part of the burden to other member countries. Countries like Belgium that face a high abatement effort have a gain in terms of trade of 1% while a country as Greece, that has no abatement efforts, has a loss in the terms of trade. This shows that, within a federation, the distribution of gains and losses in welfare can be difficult to predict. The relative changes in activity levels are however more closely in line with the required reduction efforts per member country.
3.2.2. EU wide permit trading
The EU Commission has already proposed5 a restricted EU wide trading scheme for CO2 permits, it is a restricted scheme because it only allows trade between the energy sectors and some energy intensive sectors(not the chemical sector). It is clear that the difference in emission reduction costs between member countries calls for a EU wide trading scheme. We discuss here the effects of a EU wide permit scheme for all sectors6. An EU wide permit scheme is an important element for energy intensive firms that are located in member countries that face large CO2 reduction obligations. EU wide permit trading will equalize the permit prices and will smoothen the effects on the marginal production costs across the EU. This will in principle result in smaller variations of
5 See COM(2001) 581 final 6 The difference between the scheme we discuss and the restricted scheme can not be very large because a
combination of a domestic permit trade for all sectors and a EU-wide scheme restricted to some sectors would in the absence of tranasaction costs generate the end results that are close.

18
activity levels across the EU member states for every sector. Table 7 reports the results per member country and per sector.
Table 7 Effects of EU wide emission permit market system
LOW HIGH % diff with reference EU Germany Belgium EU Germany Belgium
Total CO2 emission -12.6 -11.1 -19.2 -21.5 -19.9 -21.0 Coal -22.6 -18.2 -32.1 -27.6 -23.1 -37.5 Oil -5.7 -5.4 -6.1 -15.2 -16.9 -15.2 Gas -2.8 -3.6 -1.2 -4.8 -7.6 -2.2 Electricity -2.5 -2.8 -2.1 -5.1 -5.0 -4.6 Ferr & n-f metals -1.5 -1.3 -2.4 -3.5 -2.3 -6.3 Chemical -0.6 -0.8 -0.9 -1.5 -1.9 -1.6 Consumer goods -0.4 -0.4 -0.5 -1.3 -1.5 -1.7 Economic Welfare -0.11 -0.1 -0.04 0.0 -0.1 -0.2
We see that the inter-country differences in industrial activity have indeed been reduced. If we take the case of Germany and Belgium the differences in activity effects for the ferrous and non ferrous sector have been reduced from 1.9% to 0.9% and in the case of the chemical sector from 0.7% to 0.1%. The total activity reduction at EU level is larger for coal but smaller for most other sectors. This means that switching from member country level trading to EU wide trading will in some member countries reduce the activity levels of energy-intensive sectors because they lost the competitive advantage that was associated to a low emission reduction target, all firms now face the same marginal abatement cost. The total economic cost is in general lower with EU wide trading than with member country level trading.
3.2.3. The domestic carbon tax with recycling of carbon taxes via lower labour taxes
It is well known from environmental economics that tradable permit policies are inferior instruments to carbon taxes that are recycled via lower labour taxes. Table 8 reports the results of a domestic carbon tax that is sufficient to achieve the reduction target set for the member country and where the tax revenues are recycled via reductions of social security contributions on labour. This comes down to a reduction in labour taxes. We compare the results of this scenario with the first scenario where domestic permits were handed out for free. Table 8 Effects of domestic carbon tax where tax proceeds are recycled via lower labour taxes
LOW HIGH % diff with reference EU Germany Belgium EU Germany Belgium
Total CO2 emission -12.6 -11.1 -19.2 -21.5 -19.9 -21.0 Coal -16.4 -9.4 -32.0 -25.6 -18.1 -48.5 Oil -9.3 -2.8 -6.4 -17.3 -13.3 -21.1

19
Gas -4.5 -1.3 -0.8 -5.4 -3.3 -4.9 Electricity -2.1 -1.2 -1.8 -3.6 -1.0 -6.6 Ferr& n-f metals -1.5 -2.3 -0.9 -3.5 -1.3 -8.9 Chemical -0.9 -0.6 -0.8 -1.1 -0.9 -1.3 Consumer goods -0.5 -0.3 -0.5 -0.9 -0.8 -2.1 Economic Welfare -0.0 +0.3 +0.4 -0.1 +0.2 -0.2
The energy industry will claim that free permits is more favourable to their activity levels than the use of carbon taxes. When we compare table 8 with table 6, we see first that the activity reductions are not very different between the two policy instruments. This rejoins the conclusions of Bovenberg and Goulder (2001). Second we see that the carbon tax instrument does lead to slightly higher activity levels in energy intensive sectors (Ferrous and non Ferrous metals and chemical) than the domestic permit instrument so contradicting the popular belief. This result is not general as it is ultimately the result of many changes in relative prices in the inputs.This was expected as the recycling of the tax revenues alters relative prices as well as output prices.
3.3. When one member country adopts different policies Several industries want an exemption from emission reduction obligations. In particular the energy–intensive industries try to obtain this. It is clear from the outset that a general exemption at the EU level is not very cost-effective as total efforts will than be concentrated in a much smaller group of polluters. Here we test what would be the effect if the industrial lobby within one country gets such an exemption for its sector. This lobby may hope to get a competitive advantage over its competitors in other member states7. We analyse the case for two countries: a small country, here Belgium (population is 10 million) and a large country (here Germany with population 80 Million). We focus on domestic permit systems as these offer most scope for unilateral policies than a carbon tax. Moreover, compared to EU permit trading, domestic permit
7 There is a whole literature on strategic trade and the environment that focus on imperfect competition – here we use a perfect competition framework.

20
policies will show more extreme results as there is no dampening of domestic permit prices in a wider market We discuss first exemptions in Germany only and next the case of exemptions in Belgium only. Each time we exempt the sectors Electricity, Ferrous and non-ferrous metals, Chemical products and Other energy intensive industries from greenhouse gas emission obligations. As we argued in section 1.2, the exemption can very well take the form of a policy instrument like a voluntary agreement that is less strictly enforced. Table 9: Effects of emission permit market system per member country when Germany exempts its energy intensive industry
LOW HIGH % diff with reference EU Germany Belgium EU Germany Belgium
Total CO2 emission -12.6 -11.1 -19.2 -21.5 -19.9 -21.0 Coal -12.2 -1.8 -31.3 -17.3 -3.0 -47.6 Oil -10.1 -7.1 -7.2 -18.4 -19.9 -21.8 Gas -4.7 -2.4 -1.2 -5.7 -3.7 -5.3 Electricity -2.2 -0.6 -2.1 -4.2 -1.7 -7.5 Ferr& n-f metals -1.6 -0.2 -2.3 -3.9 -0.9 -10.1 Chemical -0.9 -0.2 -0.8 -1.7 -0.9 -2.6 Consumer goods -0.8 -0.4 -0.4 -1.6 -1.4 -3.1 Economic Welfare -0.3 -0.3 -0.2 -0.2 -0.2 -0.3
In table 9 we see that, in terms economic welfare and compared to the case without exemptions (table 6) , there is no net gain for Germany but a net loss for the EU as a whole. In Germany, there is a small gain in activity of less than 1% in the energy intensive sectors that have been exempted. In Germany, and again compared to the case without exemptions, there is a small loss in activity for some other sectors. The marginal cost of CO2 reductions increases (in the HIGH scenario) from 23.7 to 31.6 EURO/ton CO2. The German energy intensive sectors do not really gain in terms of activity because exports is a relatively small part of their total market. Table 10 reports results for a smaller country (Belgium) where we see that some energy –intensive sectors (ferrous and non ferrous metals) gain significantly in activity level when they are exempted. The reason is that a small country is much more geared to export markets. The welfare effects of exemptions however is particularly negative in Belgium: in the HIGH scenario, economic welfare decreases by some 1.2% instead of by 0.3%. Also for the EU as a whole there is now a negative welfare effect associated to this Belgian exemption: welfare decreases by 0.2% instead of being more or less constant in the case without exemptions. As the role of energy intensive sectors is very important in Belgium, the exemption policy raises the domestic cost of CO2 emission from 29.8 to 70.6 EURO/ton CO2 in the HIGH scenario. In terms of industrial activity we see that the Belgian energy intensive industry experiences much lower activity reductions: ferrous and non ferrous metals industry has now activity reduction of 2.3 instead of 10.1 in the case without exemptions. The other sectors are however forced to make extra efforts, sometimes via strong activity reductions: the consumer goods industry decreases its activity by 8.1% instead of 3.1% in the case without exemptions.

21
Table 10 Effects of emission permit market system per member country when Belgium exempts its energy intensive industry
LOW HIGH % diff with reference EU Germany Belgium EU Germany Belgium
Total CO2 emission -12.6 -11.1 -19.2 -21.5 -19.9 -21.0 Coal -15.9 -9.1 -16.6 -24.8 -18.0 -16.5 Oil -10.6 -3.0 -21.0 -18.5 -13.4 -35.5 Gas -4.7 -1.6 -6.2 -6.1 -5.5 -8.1 Electricity -2.5 -1.4 -2.8 -4.9 -3.7 -7.2 Ferr& n-f metals -1.6 -0.4 -1.3 -3.4 -1.6 -2.3 Chemical -0.9 -0.2 -0.9 -1.7 -1.3 -1.6 Consumer goods -0.8 -0.0 -3.0 -1.7 -0.9 -8.1 Economic Welfare -0.3 -0.3 -0.4 -0.2 -0.2 -1.2
4. CONCLUSIONS The main question in this paper was the net effect of different greenhouse gas policies on the activity in industrial sectors. The industrial lobbies seem to prefer non tax instruments and instruments that are only weakly inforced. Economic theory tells us that the activity effect of instruments favoured by industry (permits) is not necessarily much better. The main advantages for industry of grandfathered permits and voluntary agreements will be the better profit levels. Profits can very well increase after the imposition of a tradable emission permit. The theory is somewhat ambiguous as there are many factors playing. Our numerical analysis of the effects of policy options focussed on the 15 member states of the EU. We compared the effects of two types of policies: general policies that are applied uniformly to all EU member states and policies where one member state exempts its energy intensive industry. Within the general policies we compared domestic permit policies, EU wide permit policies and domestic carbon tax policies. We found that as long as a policy instrument is used uniformly in all sectors and for all member countries, the choice of instruments does not affect strongly the activity level per sector. This confirms results obtained earlier for the US. The second type of policies we tested were unilateral exemption policies where one EU member country exempts its energy intensive industry from emission reduction efforts. When this is a large member country like Germany, the positive industrial activity effects are probably low because export is only a small share of the total demand. The welfare cost of the exemption consists in increased abatement costs for other sectors and this cost is passed on to other member countries so that the EU as a whole looses from these protectionist policy. When it is a small more open member country like Belgium that exempts part of its industry, there can be large positive effects on the industrial activity levels of these sectors. But this has a high cost in terms of welfare for the country as it is forced to make much more costly efforts in other sectors. The large positive effects for a few energy intensive sectors imply that the non-energy intensive sectors have to accept large abatement efforts and even activity reductions. The welfare cost of this is high and is again spread over different member states.

22
LIST OF REFERENCES Alberini and Segerson (2002), “Assessing voluntary programs to improve environmental quality”, Environmental and Resource Economics, 22, p157-184 Bovenberg & Goulder (2001), “Neutralizing the adverse industry impacts of CO2 abatement policies: What does it cost?”, in Behavioural and Distributional Effects of distributional Effects of Environmental policy, C.Carraro, G.Metcalf (eds.) University of Chicago Press, . J.Braden and S.Proost (eds.) (1997), “The economic theory of environmental policy in a federal system”, Edward Elgar, 166 p. P.Capros, P.Georgakopoulos, D.Van Regemorter, S.Proost, T.Schmit, H.Koschel, C.Conrad, E.Vouyoukas,(1999) “Climate Change Strategies 2: The macro-economic cost and benefit of reducing Greenhouse gas emissions in the EU”, Physica Verlag, Heidelberg, New York, 224 p COMMISSION OF THE EUROPEAN COMMUNITIES (2001), Directive of the Europen Parliament and of the Council establishing a scheme for the greenhouse gas emission allowance trading within the Community and amending Council Directive 96/61/EC, Com (2001) 581 final Fullerton, D.,(2001) “A framework to compare Environmental Policies”, Southern Economic Journal, 68(2), p 224-248 Goulder L., I.Parry, R.C.Williams, D.Burtraw,(1999), “The cost-effectiveness of alternative instruments for environmental protection in a second best setting”, Journal of Public Economics, 72 (3), p329-60 IPCC (Intergovernmental Panel on Climate Change), (2001), “Climate Change 2001: Mitigation”, Contribution of Working Group III to the Second Assessment Report of the IPCC, Cambridge University Press Jensen J., Rasmussen T., (2000), “Allocation of CO2 emission permits: a general equilibrium analysis of policy instruments”, Journal of Environmental Economics and Management, 40, 111- 136, Keohane,N. R.Revesz, R.Stavins (1998),”The choice of regulatory instruments in environmental policy”, Harvard Environmental Law Review, 22(2), 313-67 Khanna, (2001), “Non-mandatory approaches to environmental protection”, Journal of Economic Surveys, 15(3), p291-324 Maestad, O., (2001), “Efficient climate policy with internationally mobile firms”, Environmental and Resource economics, 19, p 267-284 S.Proost and J. Braden (eds.), (1998) Climate change, Transport and Environmental policy - empirical applications in a federal system, Edward Elgar, 252 p Parry I., R.C.Williams, L.Goulder,(1999), “When can carbon abatement policies increase welfare: the fundamental role of distorted factor markets”, Journal of Environmental Economics and Management, 37, (1), January, p 52-84 Proost and Van Regemorter,(1995), “The double dividend and the role of inequality aversion and macro-economic regimes”, International Tax and Public Finance, 2 (2), p.207-19 Weyant,J. (ed.)(1999), “The costs of the Kyoto protocol: a multi-model evaluation”, the Energy Journal, special issue
The Center for Economic Studies (CES) is the research division of the Department of Economics of the Katholieke Universiteit Leuven. The CES research department employs some 100 people. The division Energy, Transport & Environment (ETE) currently consists of about 15 full time researchers. The general aim of ETE is to apply state of the art economic theory to current policy issues at the Flemish, Belgian and European level. An important asset of ETE is its extensive portfolio of numerical partial and general equilibrium models for the assessment of transport, energy and environmental policies.
ETE WORKING PAPER SERIES 2003
n° 2003-05 Proost, S. and Van Regemorter, D. (2003), climate change policy in European countries and its effects on industry
n° 2003-04 Willems, B. (2003), Should an incumbent generator be allowed to buy import transmission capacity?
n° 2003-03 Rousseau, S. and Billiet, C.M. (2003), Using emission standards under incomplete compliance
n° 2003-02 Calthrop, E., De Borger, B. and Proost S. (2003), Tax reform for dirty intermediate goods: theory and an application to the taxation of freight transport
n° 2003-01 Pepermans, G. (2003), Simulating the restructuring of the Flemish electricity distribution sector
ETE WORKING PAPER SERIES 2002
n° 2002-13 Willems, B. (2002), Barring consumers from the electricity network might improve welfare
n° 2002-12 Mayeres, I. And Proost, S. (2002), Reforming transport pricing: an economist’s perspective on equity, efficiency and acceptability
n° 2002-11 Mayeres, I. (2002), Taxes and Transport Externalities
n° 2002-10 Franckx, L. and Kampas, A. (2002), A Note on “The Choice between Emission Taxes and Output Taxes under Imperfect Monitoring”
n° 2002-09 Eyckmans, J. (2002) International Environment Agreements And The Case Of Global Warming
n° 2002-08 Calthrop, E. Proost, S. (2002) Environmental Pricing in Transport Chapter for Handbook 4: Transport and the Environment
n° 2002-07 De Borger, B. and Van Dender, K. (2002), Transport tax reform, commuting and endogenous values of time
n° 2002-06 Franckx, L. and d’Amato, A. (2002), Multiple-task common agency with one fully-informed principal: implications for public policy
n° 2002-05 Moons, E. (2002), Cost- benefit analysis of the location of new forest land