
End-to-End Cyberinfrastructure for Decision-Making Support in Watershed Management
9
End-to-End Cyberinfrastructure for Decision-Making Support in Watershed Management Marian V. Muste, M.ASCE 1 ; David A. Bennett 2 ; Silvia Secchi 3 ; Jerald L. Schnoor, M.ASCE 4 ; Andrew Kusiak 5 ; Nicholas J. Arnold 6 ; Sudipta K. Mishra, S.M.ASCE 7 ; Deng Ding 8 ; and Umashanker Rapolu 9 Abstract: Over the past decade, water-centric research has increasingly taken into consideration the interactions between the water cycle and the social, economic, and biogeophysical processes that drive watershed dynamics. In parallel, water management has made great strides in data sharing and collaborative modeling that support decision making through integrated planning and stakeholder involvement. Both re- search and management communities require data and simulation models that cover large spatial scales and workflows that enable inves- tigations and decision making in real time with participation of multiple watershed actors. To efficiently accomplish their goals, these two communities are tapping into the capabilities of advanced cyberinfrastructure (CI) platforms that facilitate an understanding of watershed processes, knowledge management, visualization, interaction, and collaboration in multiple watershed science and engineering disciplines. This paper illustrates an implementation of an end-to-end CI system for understanding of the ecological threats, shifts in soil conservation practices, and public perception of environmental health with preservation of the economic benefits of agricultural production at the water- shed scale. The systems were implemented in a 270 km 2 Clear Creek catchment in eastern Iowa. DOI: 10.1061/(ASCE)WR.1943-5452 .0000289. © 2013 American Society of Civil Engineers. CE Database subject headings: Decision making; Water resources; Water management; Watersheds. Author keywords: Cyberinfrastructure; Decision making; Watershed resources; Watershed science; Integrated water resources management. Introduction Currently, the decision-making processes associated with the man- agement of watershed resources are undergoing major transforma- tions during their transition from the sectorial approaches of the past to contemporary ones that aim at more integrated and compre- hensive approaches. This transformation comes at a time when acute problems in water and land resources are triggered by direct (land-use change) or indirect (climate change) human interventions in the natural systems within which humans live. In the present context, the term watershed resources will be used rather than the conventional water resources to emphasize that solving water-related problems require a watershed perspective and their solution involves holistic approaches at multiple watershed scales (Heathcote 1998). In the last several decades, two integrative management ap- proaches have increasingly been adopted around the world: inte- grated water resources management (IWRM) and adaptive management (AM). They are similar in scope and goals, easy to understand at a conceptual level, and they have gained momentum and influence because of their holistic and comprehensive nature and the considerable amounts of funds that donors have provided to promote their underlying concepts (Biswas 2008). While in many situations neither IWRM nor AM can be fully implemented because of various obstacles, they have been implemented in many river basins and can be found in various stages of maturity (e.g., Murray-Darling, Australia; European Water Framework Directive). The integrative management frameworks promise a significant departure from previous approaches, but it is difficult to assess their performance because they are used in conditions of significant complexity in which the most difficult task is often to define the nature of the problem, rather than its solutions (Giordano et al. 2008). Problem definition, the generation of alternatives, and as- sessment of desirable watershed states are based on rational proc- esses applied to available information about a particular watershed system. Consequently, the quality and amount of available data, information, and knowledge (the latter being most often extracted from the data due to the complexity of the watershed system) play a fundamental role in good decision making. In the absence of sufficient information, an assessment of the efficiency of alternative management solutions is in practice made simply by observing a 1 Research Engineer and Adjunct Professor, IIHR-Hydroscience and Engineering, Dept. of Civil and Environmental Engineering, Univ. of Iowa, Iowa City, IA 52242. E-mail: [email protected] 2 Professor, Dept. of Geography, Univ. of Iowa, Iowa City, IA 52242. 3 Assistant Professor, Dept. of Agribusiness Economics, Southern Illinois Univ., Carbondale, IL 62901. 4 Professor, Dept. of Civil and Environmental Engineering, Univ. of Iowa, Iowa City, IA 52242. 5 Professor, Dept. of Mechanical and Industrial Engineering, Univ. of Iowa, Iowa City, IA 52242. 6 Graduate Student, Dept. of Computer Science, Univ. of Iowa, Iowa City, IA 52242. 7 Ph.D. Candidate, IIHR-Hydroscience and Engineering, Dept. of Civil and Environmental Engineering, Univ. of Iowa, Iowa City, IA 52242 (corresponding author). E-mail: [email protected] 8 Ph.D. Candidate, Dept. of Geography, Univ. of Iowa, Iowa City, IA 52242. 9 Graduate Student, Dept. of Computer Science, Univ. of Iowa, Iowa City, IA 52242. Note. This manuscript was submitted on December 2, 2011; approved on May 16, 2012; published online on May 21, 2012. Discussion period open until February 1, 2014; separate discussions must be submitted for individual papers. This paper is part of the Journal of Water Resources Planning and Management, Vol. 139, No. 5, September 1, 2013. © ASCE, ISSN 0733-9496/2013/5-565-573/$25.00. JOURNAL OF WATER RESOURCES PLANNING AND MANAGEMENT © ASCE / SEPTEMBER/OCTOBER 2013 / 565 J. Water Resour. Plann. Manage. 2013.139:565-573. Downloaded from ascelibrary.org by UNIV OF IOWA LIBRARIES on 09/11/13. Copyright ASCE. For personal use only; all rights reserved.
Transcript of End-to-End Cyberinfrastructure for Decision-Making Support in Watershed Management
End-to-End Cyberinfrastructure for Decision-MakingSupport in Watershed Management
Marian V. Muste, M.ASCE1; David A. Bennett2; Silvia Secchi3; Jerald L. Schnoor, M.ASCE4; Andrew Kusiak5;Nicholas J. Arnold6; Sudipta K. Mishra, S.M.ASCE7; Deng Ding8; and Umashanker Rapolu9
Abstract:Over the past decade, water-centric research has increasingly taken into consideration the interactions between the water cycle andthe social, economic, and biogeophysical processes that drive watershed dynamics. In parallel, water management has made great strides indata sharing and collaborative modeling that support decision making through integrated planning and stakeholder involvement. Both re-search and management communities require data and simulation models that cover large spatial scales and workflows that enable inves-tigations and decision making in real time with participation of multiple watershed actors. To efficiently accomplish their goals, these twocommunities are tapping into the capabilities of advanced cyberinfrastructure (CI) platforms that facilitate an understanding of watershedprocesses, knowledge management, visualization, interaction, and collaboration in multiple watershed science and engineering disciplines.This paper illustrates an implementation of an end-to-end CI system for understanding of the ecological threats, shifts in soil conservationpractices, and public perception of environmental health with preservation of the economic benefits of agricultural production at the water-shed scale. The systems were implemented in a 270 km2 Clear Creek catchment in eastern Iowa. DOI: 10.1061/(ASCE)WR.1943-5452.0000289. © 2013 American Society of Civil Engineers.
CE Database subject headings: Decision making; Water resources; Water management; Watersheds.
Author keywords: Cyberinfrastructure; Decision making; Watershed resources; Watershed science; Integrated water resourcesmanagement.
Introduction
Currently, the decision-making processes associated with the man-agement of watershed resources are undergoing major transforma-tions during their transition from the sectorial approaches of thepast to contemporary ones that aim at more integrated and compre-hensive approaches. This transformation comes at a time whenacute problems in water and land resources are triggered by direct(land-use change) or indirect (climate change) human interventions
in the natural systems within which humans live. In the presentcontext, the term watershed resources will be used rather thanthe conventional water resources to emphasize that solvingwater-related problems require a watershed perspective and theirsolution involves holistic approaches at multiple watershed scales(Heathcote 1998).
In the last several decades, two integrative management ap-proaches have increasingly been adopted around the world: inte-grated water resources management (IWRM) and adaptivemanagement (AM). They are similar in scope and goals, easy tounderstand at a conceptual level, and they have gained momentumand influence because of their holistic and comprehensive natureand the considerable amounts of funds that donors have providedto promote their underlying concepts (Biswas 2008). While inmany situations neither IWRM nor AM can be fully implementedbecause of various obstacles, they have been implemented inmany river basins and can be found in various stages of maturity(e.g., Murray-Darling, Australia; European Water FrameworkDirective).
The integrative management frameworks promise a significantdeparture from previous approaches, but it is difficult to assess theirperformance because they are used in conditions of significantcomplexity in which the most difficult task is often to define thenature of the problem, rather than its solutions (Giordano et al.2008). Problem definition, the generation of alternatives, and as-sessment of desirable watershed states are based on rational proc-esses applied to available information about a particular watershedsystem. Consequently, the quality and amount of available data,information, and knowledge (the latter being most often extractedfrom the data due to the complexity of the watershed system) play afundamental role in good decision making. In the absence ofsufficient information, an assessment of the efficiency of alternativemanagement solutions is in practice made simply by observing a
1Research Engineer and Adjunct Professor, IIHR-Hydroscience andEngineering, Dept. of Civil and Environmental Engineering, Univ. of Iowa,Iowa City, IA 52242. E-mail: [email protected]
2Professor, Dept. of Geography, Univ. of Iowa, Iowa City, IA 52242.3Assistant Professor, Dept. of Agribusiness Economics, Southern
Illinois Univ., Carbondale, IL 62901.4Professor, Dept. of Civil and Environmental Engineering, Univ. of
Iowa, Iowa City, IA 52242.5Professor, Dept. of Mechanical and Industrial Engineering, Univ. of
Iowa, Iowa City, IA 52242.6Graduate Student, Dept. of Computer Science, Univ. of Iowa,
Iowa City, IA 52242.7Ph.D. Candidate, IIHR-Hydroscience and Engineering, Dept. of Civil
and Environmental Engineering, Univ. of Iowa, Iowa City, IA 52242(corresponding author). E-mail: [email protected]
8Ph.D. Candidate, Dept. of Geography, Univ. of Iowa, Iowa City,IA 52242.
9Graduate Student, Dept. of Computer Science, Univ. of Iowa,Iowa City, IA 52242.
Note. This manuscript was submitted on December 2, 2011; approvedon May 16, 2012; published online on May 21, 2012. Discussion periodopen until February 1, 2014; separate discussions must be submitted forindividual papers. This paper is part of the Journal of Water ResourcesPlanning andManagement, Vol. 139, No. 5, September 1, 2013. © ASCE,ISSN 0733-9496/2013/5-565-573/$25.00.
JOURNAL OF WATER RESOURCES PLANNING AND MANAGEMENT © ASCE / SEPTEMBER/OCTOBER 2013 / 565
J. Water Resour. Plann. Manage. 2013.139:565-573.
Dow
nloa
ded
from
asc
elib
rary
.org
by
UN
IV O
F IO
WA
LIB
RA
RIE
S on
09/
11/1
3. C
opyr
ight
ASC
E. F
or p
erso
nal u
se o
nly;
all
righ
ts r
eser
ved.
reduction of tensions among watershed stakeholders. Given thiskey role played by data and information in the decision-makingprocess, there is a critical need to develop and implement powerfulmonitoring and information management systems taking advantageof the new information technologies and system architectures.
The data- and information-rich environments required for themeaningful implementation of the integrative managementapproaches are now feasible because of recent advances made inscience and engineering research and computing, information,and communication technologies. In response to these advances,the National Science Foundation (NSF) coined a new term—cyberinfrastructure (CI)—to define the coupled use of real-timesensing networks (temporally and spatially detailed), databases,high-performance computational platforms, computer modelsthat enable understanding of processes, knowledge management,visualization, interaction, and collaboration in all science andengineering disciplines (NSF 2003). A progenitor developmentof cyberinfrastructure for a water-centric area is hydroinformatics,which originated in the early 1990s (Abbott 1991). CI-based tech-nologies are increasingly available and sufficiently mature to facili-tate development of digital platforms that support both scientificinvestigations and management at the watershed scale. These plat-forms have the potential to transform the ability to understand andaddress ecosystem changes, protect the environment, and predictand prevent natural and human disasters through knowledge-basedadaptive management (Muste et al. 2010b).
This paper aims to illustrate the utility of an advanced CI im-plementation designed to help understanding of the impact of alter-native watershed-management scenarios on ecological processes,conservation efforts, economic return, and public perception aboutenvironmental health. The paper describes first-hand experienceswith the development and implementation of an end-to-end CI sys-tem conducted over several years at the University of Iowa by aninterdisciplinary team of researchers and students. An end-to-end
system is defined as a seamless, automated, CI structure that passesthe data and information from field observations to model to createnew practical information and knowledge. To place the work incontext, the components of IWRM-based decision making are pre-sented first to illustrate how the CI-based platforms can support themanagement process. Subsequently, the components of the end-to-end CI platform are described both in general terms as well as withillustrations of prototypes developed for an Iowa watershed.
Architecture of the CI Systems for Decision-MakingSupport
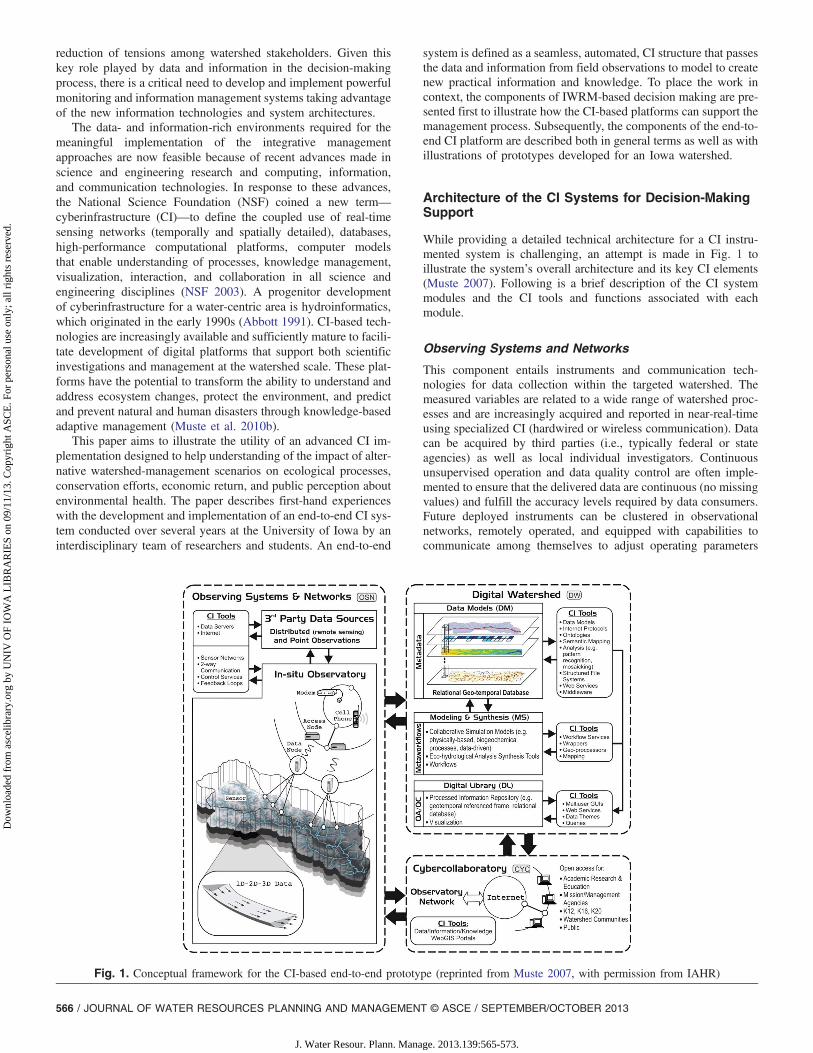
While providing a detailed technical architecture for a CI instru-mented system is challenging, an attempt is made in Fig. 1 toillustrate the system’s overall architecture and its key CI elements(Muste 2007). Following is a brief description of the CI systemmodules and the CI tools and functions associated with eachmodule.
Observing Systems and Networks
This component entails instruments and communication tech-nologies for data collection within the targeted watershed. Themeasured variables are related to a wide range of watershed proc-esses and are increasingly acquired and reported in near-real-timeusing specialized CI (hardwired or wireless communication). Datacan be acquired by third parties (i.e., typically federal or stateagencies) as well as local individual investigators. Continuousunsupervised operation and data quality control are often imple-mented to ensure that the delivered data are continuous (no missingvalues) and fulfill the accuracy levels required by data consumers.Future deployed instruments can be clustered in observationalnetworks, remotely operated, and equipped with capabilities tocommunicate among themselves to adjust operating parameters
Fig. 1. Conceptual framework for the CI-based end-to-end prototype (reprinted from Muste 2007, with permission from IAHR)
566 / JOURNAL OF WATER RESOURCES PLANNING AND MANAGEMENT © ASCE / SEPTEMBER/OCTOBER 2013
J. Water Resour. Plann. Manage. 2013.139:565-573.
Dow
nloa
ded
from
asc
elib
rary
.org
by
UN
IV O
F IO
WA
LIB
RA
RIE
S on
09/
11/1
3. C
opyr
ight
ASC
E. F
or p
erso
nal u
se o
nly;
all
righ
ts r
eser
ved.
(e.g., sampling rates) through feedback loops connected to the cen-tral monitoring server. The link between CI and sensor networks isstrong and necessary because many of the implemented sensor net-works will generate significant quantities of data that must be man-aged by the CI. The acquired data are used for monitoring, analysis,in conjunctions with modeling, and for extraction of informationand knowledge.
Digital Watershed
Central to the engineered system is the digital watershed (DW) thatseamlessly connects data models (DMs), modeling and synthesis(MS), and digital libraries (DLs). DW is a comprehensive charac-terization of ecohydrologic systems that use integrated data andsimulation models to facilitate the study of the multiscaled, multi-process dynamics of watersheds (Maidment 2006). DWs are popu-lated with data and information from the best available datasources, both hosted by the observatory and stored in external datarepositories and from the metadata associated with the sources. Inmost of the cases, data are also available as a result of runningnumerical simulations for water-related processes. Using datafrom these varied sources requires visiting multiple websites, eachwith its own access protocols, terminology, and data export for-mats. These inconsistencies in format (syntactic differences) andterminology (semantic differences) inhibit integrated analyses(Maidment 2009). Valuable data exist that are not being used totheir fullest, solely because it is too difficult to find, interpret,access, and/or transform into a format suitable for analysis.
DM applies to any type of water body, e.g., watershed, lake,estuary, coastal area. It digitally describes watershed features in-cluding geographic information system (GIS) data (terrain, streamnetwork, soils, land cover, geology), hydrologic observations(streamflow, groundwater levels), weather and remotely senseddata, data produced by weather and climate models, upland andin-stream water quality data collected using in situ sensors (pollu-tant types and levels, habitat characteristics), and socioeconomicdata within the boundaries of the water body. The type of datahosted in DMs can include time series, static geographic data,slowly varying geographical data (vegetation), and high-frequencygridded data (from observations or models). Collectively they arereferred to as data packets (D. Tarboton and R. Hooper, “Suggestedfunctionality for CUAHSI online,” internal planning document,Consortium for the Advancement of Hydrologic Science, 2010).Historical data and recent observational information are storedin a relational database (Codd 1970). In addition to the actual data,this database accommodates the associated metadata, i.e., attributesthat accompany the data such as their names, data type, and contextfor getting high granularity information about the data (Horsburghet al. 2008). Controlled vocabulary, rigorous and uniform metadataspecifications, ontologies, and semantic mapping are associatedwith the DM construct facilitate data selection and discoveryfunctionality.
Besides storing the data, DMs are equipped with specializedCI that facilitates the efficient communication (loading and re-trieval), organization, editing, querying, visualization, analysis, andpublication of the stored data (Horsburgh et al. 2011). Access tothird-party and locally acquired data relevant to a broad array ofdisciplines and water-related problems is made available throughweb services and dedicated web portals. Web services are appli-cations that provide the ability to pass information between com-puters over the Internet, typically based on a platform-independentmarkup language, such as eXtensible Markup Language (Goodall2005). Standardized markup languages exist that fulfill the needs ofvarious research communities and are built on common interfaces
and formats within a service-oriented architecture. Web services areused in conjunction with the access, transmission, and publicationof the data.
Finally, data visualization is vitally important as a way to com-municate to a user exactly what the data to be acquired representsand as a way for users to inspect and explore the data prior todownloading large data sets. Monitoring sites can, for example,be superposed onto watershed maps to provide geographic contextthrough the web portal. Visualization can be highly automated(and often running in real time) and represented as maps, plots,or numerical information within conventional web browsers thatdo not require the user to possess special technical skills. TheDM equipped with the features described previously enables geo-graphically remote users to discover, query, visualize, and retrievedata of interest from various sources using map-based, point-and-click web portals (Horsburgh et al. 2011). Beyond accessingthe data, the role of the portal is to provide a uniform view overmultiple concurrent project efforts, preliminary data analysis,and visualization, and to organize multiple resources into execut-able workflows.
MS entails process conceptualization and methodologies thatmap inputs to outputs. It creates a unifying framework for the syn-thesis of field information, improvement of sampling strategies,testing of hypotheses, and identification of optimal managementstrategies for complex systems that minimize cost (including envi-ronmental degradation) and maximize the performance of a waterbody though feedback loops. Data ingestion into the models aretedious processes involving a large number of small tasks of vari-ous kinds that often take a great deal of time increasing the time lagbetween questions and answers. Decreasing this lag can be attainedby developing workflows that automate the data-model fusion oftenin real time. Aworkflow sequence is a defined set of operations thatcan be executed in order with data passing automatically from oneoperation in the sequence to the next. Several workflow sequencingenvironments are available (e.g., the ModelBuilder for ArcGIS).Regardless of the type of workflow sequence, the principles arethe same—take a graph of operations and execute them in a definedway that can include standard programming control structures likebranching and looping. These operations may be preprogrammedsoftware modules built as standard tools for a workflow environ-ment, or they may be custom tools created by an investigator withinthe problem-specific environment to execute specific simulationmodels. Thus, a simulation model can be thought of simply as atool in an information system, which takes in information fromother tools and produces information that goes on to other tools.
DL is a data store that contains historical and new data andinformation in any format that is subsequently used in more sophis-ticated environments for analysis, fusion, visualization, added-value processing, and information and knowledge dissemination.The DM and DL are related and complementary with some CI partsoverlapping. The DM stores raw data while the DL stores thequality-controlled and processed data. There are two ways to pub-lish the data in the DM and DL (D. Tarboton and R. Hooper,“Suggested functionality for CUAHSI online,” internal planningdocument, Consortium for the Advancement of HydrologicScience, 2010): hosted data (data and/or DM are uploaded onthe server) and registered data (accessed through web service).The library indexes disparate sources of data, models, and informa-tion using standardized metadata description of each source analo-gous to the card catalog in the traditional library. Successfulimplementation of processed and synthesized data requiresrigorous validation and documentation of the quality and uncer-tainty of the stored data and information.
JOURNAL OF WATER RESOURCES PLANNING AND MANAGEMENT © ASCE / SEPTEMBER/OCTOBER 2013 / 567
J. Water Resour. Plann. Manage. 2013.139:565-573.
Dow
nloa
ded
from
asc
elib
rary
.org
by
UN
IV O
F IO
WA
LIB
RA
RIE
S on
09/
11/1
3. C
opyr
ight
ASC
E. F
or p
erso
nal u
se o
nly;
all
righ
ts r
eser
ved.
The DL plays a critical infrastructure role because it bridges be-tween the project’s data retrieval and management modules onone side, and analysis, modeling, and visualization componentson the other side. DL may refer to one or more connected digitalwater bodies generated by applying various information modelsand data integration and workflow techniques to a range of lower-level objects. The DL should support (1) querying a watershed atthe symbolic level and assessing digital watershed consistency andcompleteness, (2) publication of digital watershed data as web serv-ices (mapping services, in particular), and (3) instantiating a digitalwatershed configuration in a data warehouse for further offlineanalysis. DLs must be interoperable with a range of other obser-vatories and scalable (change in scale, component location, datatypes and community processes, scientific understanding, incom-ing technologies).
Cybercollaboratory
This cyberenvironment is essentially a web portal that allows shar-ing of resources, models, data, and ideas by scientists, managers,and any other interested stakeholders in virtual organizations. Theportal comprises a set of interfaces through which the user interactswith the information system. They contain maps, graphics, soundfeeds, web access, wave forms (such as frequency domain repre-sentations of time series information), the topology or layout andcurrent status of the network of observational sensors, and tools forinteractive collaboration (e.g., chat rooms, social networking). Suc-cessful implementation of processed and synthesized data requiresrigorous validation and testing of applications and services.
This virtual environment enables employment of dynamic visu-alization of the stored data in which interactive intervention is pos-sible and encouraged, with heavy dependence on geographicinformation systems and translation through multiple space andtime scales. Using cybercollaboratory (CYC), individuals whoare separated by geographic distance can synchronously or asyn-chronously collaborate in a common digital laboratory, sharingknowledge and information, analyzing data, and solving problems.Selected components of the environmental laboratories can beconnected through national networks to other scientific commun-ities, bringing together domain needs with computational science(e.g., algorithm development, systems operations, organizationalstudies, social computing, and interactive design). Multiple CYCsmay lead to virtual organizations that set flexible boundariesbetween developers and users from various related communities,providing them access to highly integrated research focused onparticular issues. The proliferation of the virtual organization will
transform the outcomes of practice, science, and engineeringresearch and education.
Prototype CI-Based System for Clear CreekWatershed in Iowa
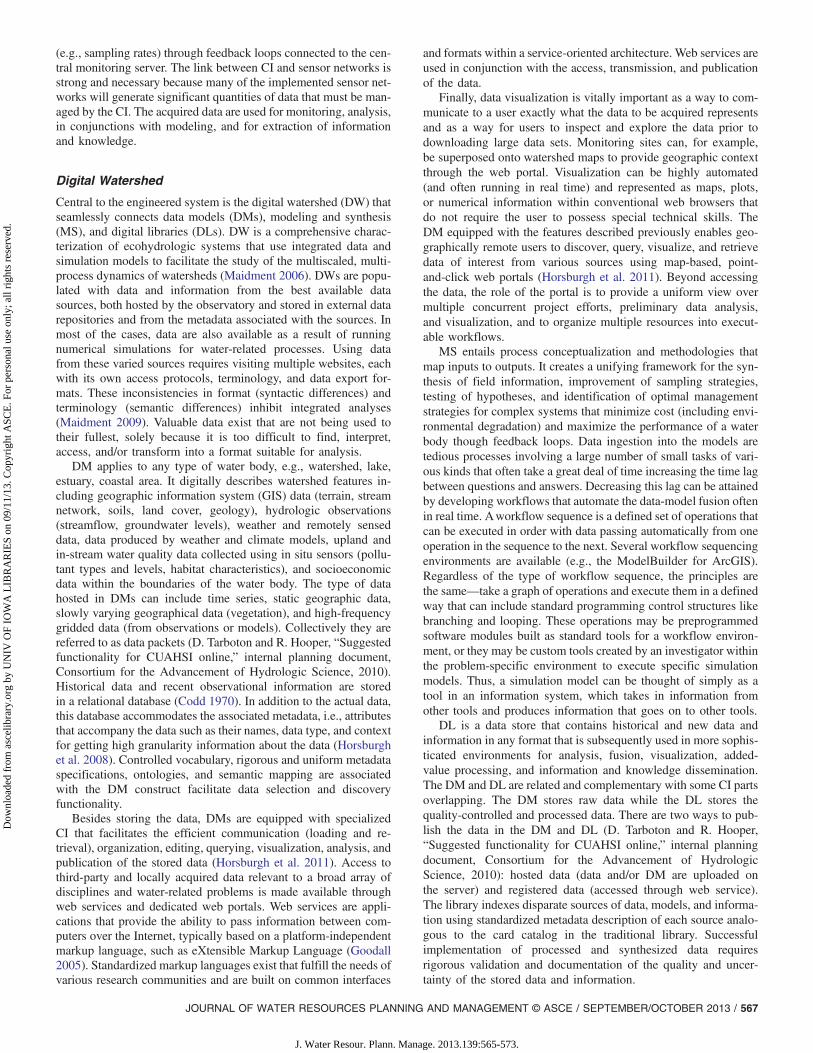
The CI implementation examples provided subsequently have beendeveloped with support from the National Science Foundation(http://nsf.gov) thought projects carried out by University of Iowainterdisciplinary research teams since 2003. These successiveprojects have enabled the assembly of a suite of CI-based systemsassociated with watersheds (or jurisdictions) of widely differentareas, as illustrated in Fig. 2. The common denominator of theseCI platforms is the assemblage of off-the-shelf componentsdeveloped by the Consortium of Universities for the Advancementof Hydrologic Science, Inc.- Hydrologic Information System(CUAHSI-HIS) project in customized workflows serving variouspurposes (Muste et al. 2010b). Specifically, the following CUAHSI-HIS project components were customized for this paper’s applica-tions: (1) observational data model (ODM), a relational databaseschema; (2) streaming data loader (SDL), updating continuouslydata streams from a file (or the web); (3) WaterOneFlow (WoF),active server pages dot net -simple object access protocol-basedweb services customized for hydrologic data using the WaterMLinformation exchange schema; (4) WoF Central Metadata Reposi-tory, a registry of publicly available data sets shared through WoFandWaterML, (5) ODM Tools, software for query, export, manage-ment, and data visualization, and (6) data access system for hydrol-ogy (DASH), ArcGIS dot net web application developer frameworkapplication.
The CUAHSI-HIS project components are freely availableand documented with comprehensive manuals and other of publi-cations provided on the project website (http://his.cuahsi.org). TheCUAHSI-HIS components have evolved continuously over time,hence as soon as new more robust and complete components werereleased they were integrated without considerable effort due to thesystem’s modular architecture. The web-based mapping applica-tions that provide a front end for the components of this paper’sCI platforms have continuously evolved, taking advantage of theadvances in specialized technology. Originally the prepackagedDASH web application running on ArcGIS Server 9.2 was used.An incremental improvement over that system was built for theIowa-Cedar Rivers basin using ArcGIS Server 9.3 and a newerversion of the Environmental Systems Research Institute’s(ESRI’s) .NET WebADF technology. Finally, the statewide
Fig. 2. CI-based systems built with off-the-shelf community-developed components for Iowa watersheds: (a) Clear Creek (270 km2) (reprintedfrom http://his08.iihr.uiowa.edu/uicc, with permission from Iowa-Cedar UNESCO-HELP Basin); (b) Iowa-Cedar River (59,378 km2) (reprintedfrom http://iowacedarbasin.org/DW, with permission from Iowa-Cedar UNESCO-HELP Basin); (c) State of Iowa (145,754 km2) (reprinted fromhttp://iowadis.org, with permission from Iowa-Cedar UNESCO-HELP Basin)
568 / JOURNAL OF WATER RESOURCES PLANNING AND MANAGEMENT © ASCE / SEPTEMBER/OCTOBER 2013
J. Water Resour. Plann. Manage. 2013.139:565-573.
Dow
nloa
ded
from
asc
elib
rary
.org
by
UN
IV O
F IO
WA
LIB
RA
RIE
S on
09/
11/1
3. C
opyr
ight
ASC
E. F
or p
erso
nal u
se o
nly;
all
righ
ts r
eser
ved.
data and information system (Fig. 2) were built on ArcGIS Server9.3.1, taking advantage of ESRI’s streamlined client-sideJavascript application programming interface (API).
Data Storage and Information Production
The applications presented in this paper were prototyped for the270 km2 Clear Creek watershed, an intensively instrumentedand investigated site located near the university campus. Since2003, this catchment has been subject of intensive interdisciplinaryresearch with strong emphasis on CI, hence becoming an ideal lo-cation for researchers to demonstrate how an information-centricapproach can be used to address complex and unresolved sciencequestions and support decision making. The watershed was one ofthe 11 national test beds serving as beta test locations for the de-ployment of CUAHSI-HIS project products (Just et al. 2007;Schnoor et al. 2008). The initial goal of these efforts was to accessand store data provided by diverse sensors and communicationmeans with simple numerical models in an end-to-end system thatcan describe electronically the watershed through data and infor-mation (Muste et al. 2010a). The CI-based system, labeled ClearCreek Digital Watershed (CCDW), operates via the Internet in realtime through a user-friendly browser that does not require technicalor computer skills (http://his08.iihr.uiowa.edu/uicc).
CCDW continuously ingests time series from heterogeneousdata sources collected by point and areal measurements irrespectiveof their provenance [e.g., Iowa Institute of Hydraulic Research,USGS, U.S. EPA, Hydro-next-generation radar (NEXRAD)]. Theobservations are stored in CUAHSI-HIS’s ODM, which can beimplemented in a variety of relational database management sys-tems (RDBMSs). For the CCDW, Microsoft’s SQL Server 2005was used as the RDBMS in order to take advantage of the blankODM template provided by the CUAHSI-HIS team. In additionto the data model and the RDBMS, a tool was needed to ingestthe raw observed data files into the ODM and visualize the storeddata. For this purpose, the SDL and ODM Tools available in theCUAHSI-HIS software stack were used. While the ingestion ofpoint measurements was quite straightforward to set up using theCUAHSI-HIS tools, the storage and handling of the spatiallygridded data sets involved additional customization because thistype of data is not natively accommodated by the ODM. Thefirst type of gridded data handled in the CCDW was NEXRADprecipitation estimated with a resolution of 1 km2 by the Hydro-NEXRAD project (http://hydro-nexrad.net).
The availability of real-time data sets accessed and stored in theoperational CCDW enabled the team to combine them with simplesimulation models to produce useful information. The first CCDWworkflow for producing information from data was obtained byfeeding real-time turbidity, rainfall, and streamflow measurementsin a water-quality model developed by a third party (Musteet al. 2010b).
Knowledge Extraction from Data and Information
The complexity of the models and workflows connecting data andmodel embedded in CCDW has gradually increased, leading tofully functional CI systems that are capable of extracting knowl-edge from the data stored and information produced by the system.The most recent development of the team is the assemblage ofa prototype intelligent CI platform that not only accesses, stores,and displays a variety of heterogeneous data, but also enablesunderstanding of the links between shifts in soil conservation prac-tices and the water quantity and quality in watershed streams aswell as the public perception of environmental health. To help
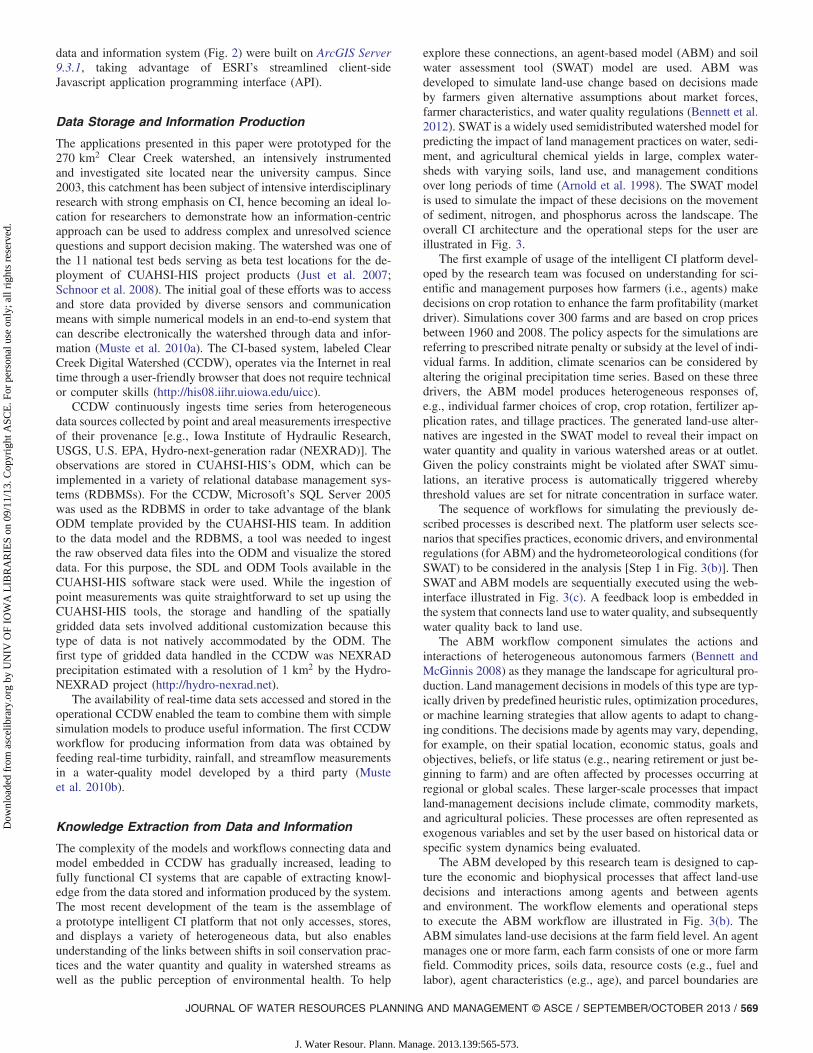
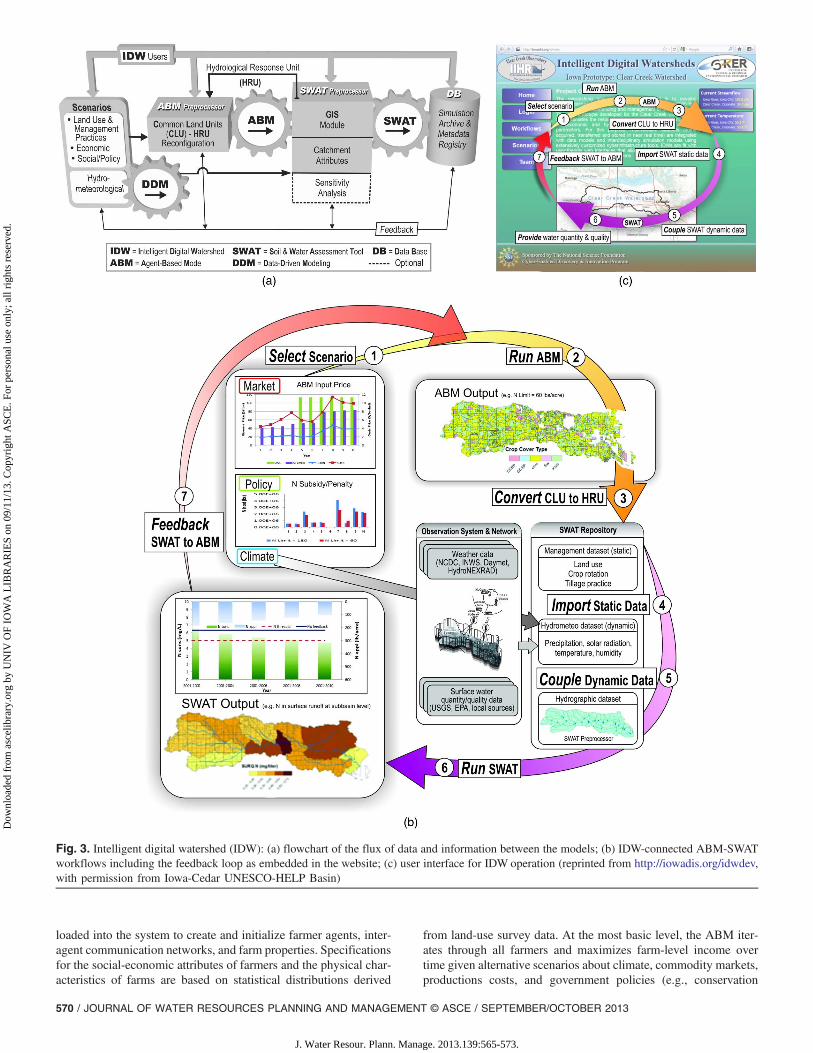
explore these connections, an agent-based model (ABM) and soilwater assessment tool (SWAT) model are used. ABM wasdeveloped to simulate land-use change based on decisions madeby farmers given alternative assumptions about market forces,farmer characteristics, and water quality regulations (Bennett et al.2012). SWAT is a widely used semidistributed watershed model forpredicting the impact of land management practices on water, sedi-ment, and agricultural chemical yields in large, complex water-sheds with varying soils, land use, and management conditionsover long periods of time (Arnold et al. 1998). The SWAT modelis used to simulate the impact of these decisions on the movementof sediment, nitrogen, and phosphorus across the landscape. Theoverall CI architecture and the operational steps for the user areillustrated in Fig. 3.
The first example of usage of the intelligent CI platform devel-oped by the research team was focused on understanding for sci-entific and management purposes how farmers (i.e., agents) makedecisions on crop rotation to enhance the farm profitability (marketdriver). Simulations cover 300 farms and are based on crop pricesbetween 1960 and 2008. The policy aspects for the simulations arereferring to prescribed nitrate penalty or subsidy at the level of indi-vidual farms. In addition, climate scenarios can be considered byaltering the original precipitation time series. Based on these threedrivers, the ABM model produces heterogeneous responses of,e.g., individual farmer choices of crop, crop rotation, fertilizer ap-plication rates, and tillage practices. The generated land-use alter-natives are ingested in the SWAT model to reveal their impact onwater quantity and quality in various watershed areas or at outlet.Given the policy constraints might be violated after SWAT simu-lations, an iterative process is automatically triggered wherebythreshold values are set for nitrate concentration in surface water.
The sequence of workflows for simulating the previously de-scribed processes is described next. The platform user selects sce-narios that specifies practices, economic drivers, and environmentalregulations (for ABM) and the hydrometeorological conditions (forSWAT) to be considered in the analysis [Step 1 in Fig. 3(b)]. ThenSWAT and ABM models are sequentially executed using the web-interface illustrated in Fig. 3(c). A feedback loop is embedded inthe system that connects land use to water quality, and subsequentlywater quality back to land use.
The ABM workflow component simulates the actions andinteractions of heterogeneous autonomous farmers (Bennett andMcGinnis 2008) as they manage the landscape for agricultural pro-duction. Land management decisions in models of this type are typ-ically driven by predefined heuristic rules, optimization procedures,or machine learning strategies that allow agents to adapt to chang-ing conditions. The decisions made by agents may vary, depending,for example, on their spatial location, economic status, goals andobjectives, beliefs, or life status (e.g., nearing retirement or just be-ginning to farm) and are often affected by processes occurring atregional or global scales. These larger-scale processes that impactland-management decisions include climate, commodity markets,and agricultural policies. These processes are often represented asexogenous variables and set by the user based on historical data orspecific system dynamics being evaluated.
The ABM developed by this research team is designed to cap-ture the economic and biophysical processes that affect land-usedecisions and interactions among agents and between agentsand environment. The workflow elements and operational stepsto execute the ABM workflow are illustrated in Fig. 3(b). TheABM simulates land-use decisions at the farm field level. An agentmanages one or more farm, each farm consists of one or more farmfield. Commodity prices, soils data, resource costs (e.g., fuel andlabor), agent characteristics (e.g., age), and parcel boundaries are
JOURNAL OF WATER RESOURCES PLANNING AND MANAGEMENT © ASCE / SEPTEMBER/OCTOBER 2013 / 569
J. Water Resour. Plann. Manage. 2013.139:565-573.
Dow
nloa
ded
from
asc
elib
rary
.org
by
UN
IV O
F IO
WA
LIB
RA
RIE
S on
09/
11/1
3. C
opyr
ight
ASC
E. F
or p
erso
nal u
se o
nly;
all
righ
ts r
eser
ved.
loaded into the system to create and initialize farmer agents, inter-agent communication networks, and farm properties. Specificationsfor the social-economic attributes of farmers and the physical char-acteristics of farms are based on statistical distributions derived
from land-use survey data. At the most basic level, the ABM iter-ates through all farmers and maximizes farm-level income overtime given alternative scenarios about climate, commodity markets,productions costs, and government policies (e.g., conservation
Fig. 3. Intelligent digital watershed (IDW): (a) flowchart of the flux of data and information between the models; (b) IDW-connected ABM-SWATworkflows including the feedback loop as embedded in the website; (c) user interface for IDW operation (reprinted from http://iowadis.org/idwdev,with permission from Iowa-Cedar UNESCO-HELP Basin)
570 / JOURNAL OF WATER RESOURCES PLANNING AND MANAGEMENT © ASCE / SEPTEMBER/OCTOBER 2013
J. Water Resour. Plann. Manage. 2013.139:565-573.
Dow
nloa
ded
from
asc
elib
rary
.org
by
UN
IV O
F IO
WA
LIB
RA
RIE
S on
09/
11/1
3. C
opyr
ight
ASC
E. F
or p
erso
nal u
se o
nly;
all
righ
ts r
eser
ved.
reserve program, pollution tax). Agent behavior varies as a functionof available resources (e.g., size of farm, productivity of soils) andplanning horizon. Information can flow through interagent connec-tions and the solution can be constrained to meet environmentalgoals (e.g., total nitrogen leaving a farm is less than a user-definedmaximum). Additional decision criteria can be added to the objec-tive function as needed (typically requires normalization andweighting of the performance indexes associated with eachcriterion) (Schnoor et al. 2011).
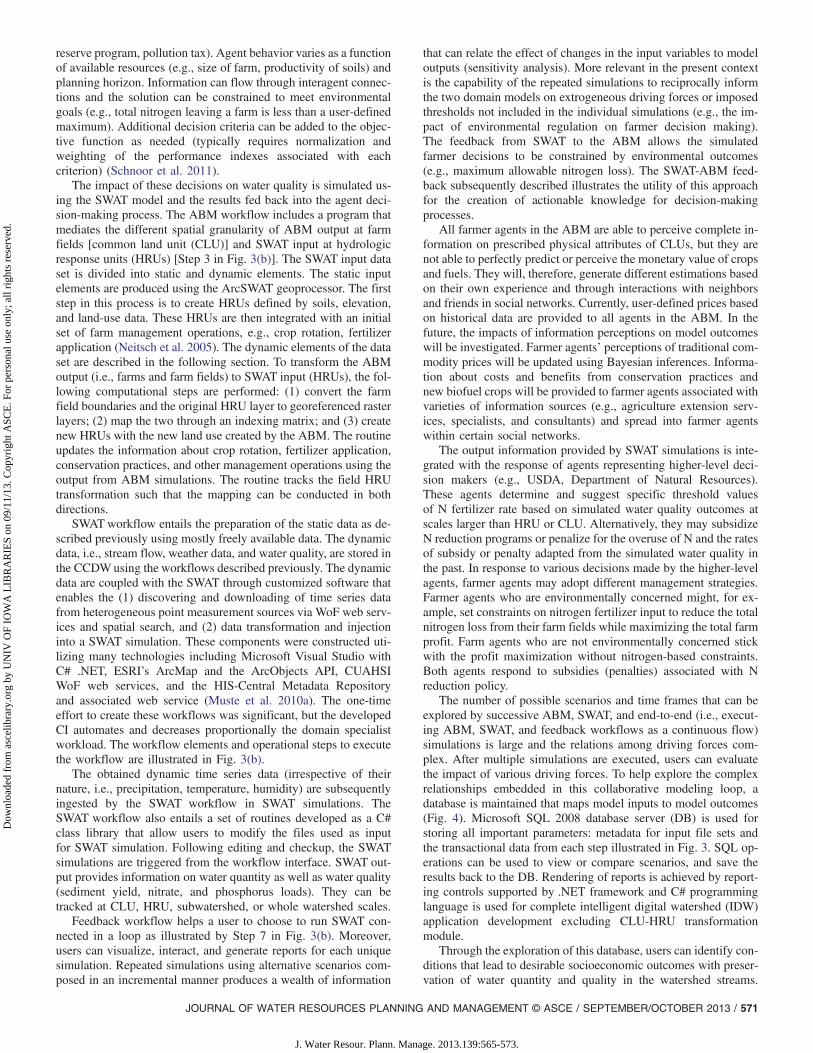
The impact of these decisions on water quality is simulated us-ing the SWAT model and the results fed back into the agent deci-sion-making process. The ABM workflow includes a program thatmediates the different spatial granularity of ABM output at farmfields [common land unit (CLU)] and SWAT input at hydrologicresponse units (HRUs) [Step 3 in Fig. 3(b)]. The SWAT input dataset is divided into static and dynamic elements. The static inputelements are produced using the ArcSWAT geoprocessor. The firststep in this process is to create HRUs defined by soils, elevation,and land-use data. These HRUs are then integrated with an initialset of farm management operations, e.g., crop rotation, fertilizerapplication (Neitsch et al. 2005). The dynamic elements of the dataset are described in the following section. To transform the ABMoutput (i.e., farms and farm fields) to SWAT input (HRUs), the fol-lowing computational steps are performed: (1) convert the farmfield boundaries and the original HRU layer to georeferenced rasterlayers; (2) map the two through an indexing matrix; and (3) createnew HRUs with the new land use created by the ABM. The routineupdates the information about crop rotation, fertilizer application,conservation practices, and other management operations using theoutput from ABM simulations. The routine tracks the field HRUtransformation such that the mapping can be conducted in bothdirections.
SWATworkflow entails the preparation of the static data as de-scribed previously using mostly freely available data. The dynamicdata, i.e., stream flow, weather data, and water quality, are stored inthe CCDWusing the workflows described previously. The dynamicdata are coupled with the SWAT through customized software thatenables the (1) discovering and downloading of time series datafrom heterogeneous point measurement sources via WoF web serv-ices and spatial search, and (2) data transformation and injectioninto a SWAT simulation. These components were constructed uti-lizing many technologies including Microsoft Visual Studio withC# .NET, ESRI’s ArcMap and the ArcObjects API, CUAHSIWoF web services, and the HIS-Central Metadata Repositoryand associated web service (Muste et al. 2010a). The one-timeeffort to create these workflows was significant, but the developedCI automates and decreases proportionally the domain specialistworkload. The workflow elements and operational steps to executethe workflow are illustrated in Fig. 3(b).
The obtained dynamic time series data (irrespective of theirnature, i.e., precipitation, temperature, humidity) are subsequentlyingested by the SWAT workflow in SWAT simulations. TheSWAT workflow also entails a set of routines developed as a C#class library that allow users to modify the files used as inputfor SWAT simulation. Following editing and checkup, the SWATsimulations are triggered from the workflow interface. SWAT out-put provides information on water quantity as well as water quality(sediment yield, nitrate, and phosphorus loads). They can betracked at CLU, HRU, subwatershed, or whole watershed scales.
Feedback workflow helps a user to choose to run SWAT con-nected in a loop as illustrated by Step 7 in Fig. 3(b). Moreover,users can visualize, interact, and generate reports for each uniquesimulation. Repeated simulations using alternative scenarios com-posed in an incremental manner produces a wealth of information
that can relate the effect of changes in the input variables to modeloutputs (sensitivity analysis). More relevant in the present contextis the capability of the repeated simulations to reciprocally informthe two domain models on extrogeneous driving forces or imposedthresholds not included in the individual simulations (e.g., the im-pact of environmental regulation on farmer decision making).The feedback from SWAT to the ABM allows the simulatedfarmer decisions to be constrained by environmental outcomes(e.g., maximum allowable nitrogen loss). The SWAT-ABM feed-back subsequently described illustrates the utility of this approachfor the creation of actionable knowledge for decision-makingprocesses.
All farmer agents in the ABM are able to perceive complete in-formation on prescribed physical attributes of CLUs, but they arenot able to perfectly predict or perceive the monetary value of cropsand fuels. They will, therefore, generate different estimations basedon their own experience and through interactions with neighborsand friends in social networks. Currently, user-defined prices basedon historical data are provided to all agents in the ABM. In thefuture, the impacts of information perceptions on model outcomeswill be investigated. Farmer agents’ perceptions of traditional com-modity prices will be updated using Bayesian inferences. Informa-tion about costs and benefits from conservation practices andnew biofuel crops will be provided to farmer agents associated withvarieties of information sources (e.g., agriculture extension serv-ices, specialists, and consultants) and spread into farmer agentswithin certain social networks.
The output information provided by SWAT simulations is inte-grated with the response of agents representing higher-level deci-sion makers (e.g., USDA, Department of Natural Resources).These agents determine and suggest specific threshold valuesof N fertilizer rate based on simulated water quality outcomes atscales larger than HRU or CLU. Alternatively, they may subsidizeN reduction programs or penalize for the overuse of N and the ratesof subsidy or penalty adapted from the simulated water quality inthe past. In response to various decisions made by the higher-levelagents, farmer agents may adopt different management strategies.Farmer agents who are environmentally concerned might, for ex-ample, set constraints on nitrogen fertilizer input to reduce the totalnitrogen loss from their farm fields while maximizing the total farmprofit. Farm agents who are not environmentally concerned stickwith the profit maximization without nitrogen-based constraints.Both agents respond to subsidies (penalties) associated with Nreduction policy.
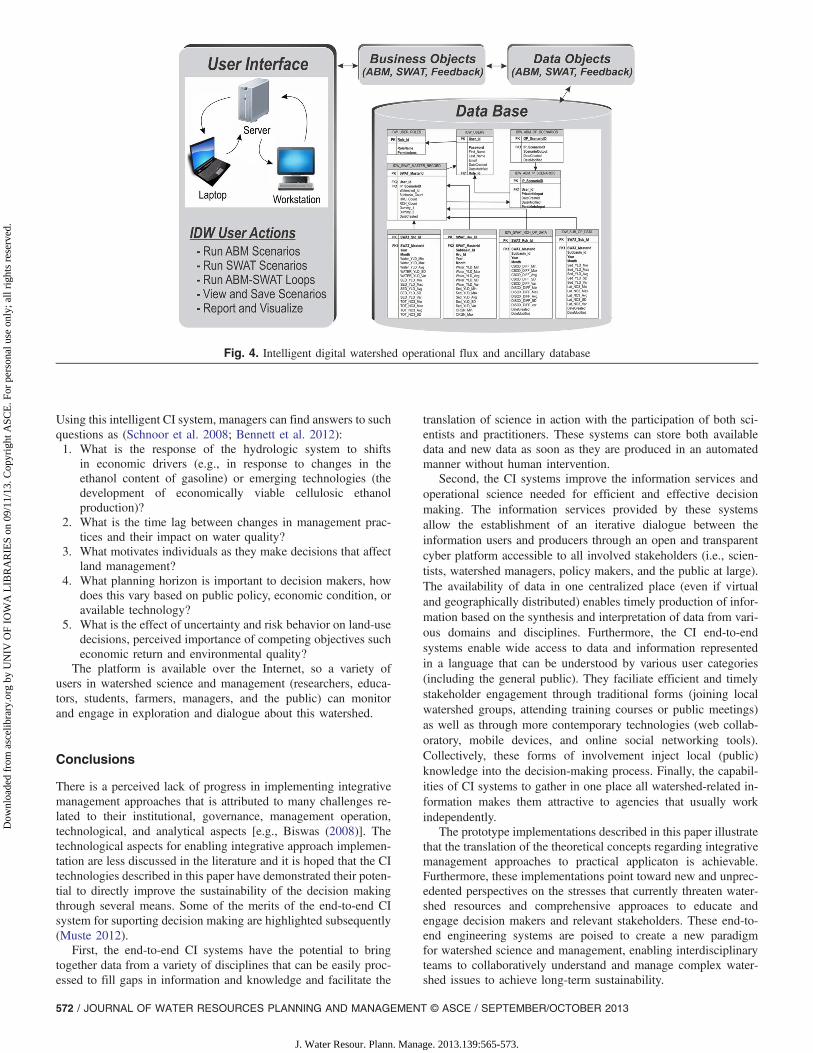
The number of possible scenarios and time frames that can beexplored by successive ABM, SWAT, and end-to-end (i.e., execut-ing ABM, SWAT, and feedback workflows as a continuous flow)simulations is large and the relations among driving forces com-plex. After multiple simulations are executed, users can evaluatethe impact of various driving forces. To help explore the complexrelationships embedded in this collaborative modeling loop, adatabase is maintained that maps model inputs to model outcomes(Fig. 4). Microsoft SQL 2008 database server (DB) is used forstoring all important parameters: metadata for input file sets andthe transactional data from each step illustrated in Fig. 3. SQL op-erations can be used to view or compare scenarios, and save theresults back to the DB. Rendering of reports is achieved by report-ing controls supported by .NET framework and C# programminglanguage is used for complete intelligent digital watershed (IDW)application development excluding CLU-HRU transformationmodule.
Through the exploration of this database, users can identify con-ditions that lead to desirable socioeconomic outcomes with preser-vation of water quantity and quality in the watershed streams.
JOURNAL OF WATER RESOURCES PLANNING AND MANAGEMENT © ASCE / SEPTEMBER/OCTOBER 2013 / 571
J. Water Resour. Plann. Manage. 2013.139:565-573.
Dow
nloa
ded
from
asc
elib
rary
.org
by
UN
IV O
F IO
WA
LIB
RA
RIE
S on
09/
11/1
3. C
opyr
ight
ASC
E. F
or p
erso
nal u
se o
nly;
all
righ
ts r
eser
ved.
Using this intelligent CI system, managers can find answers to suchquestions as (Schnoor et al. 2008; Bennett et al. 2012):1. What is the response of the hydrologic system to shifts
in economic drivers (e.g., in response to changes in theethanol content of gasoline) or emerging technologies (thedevelopment of economically viable cellulosic ethanolproduction)?
2. What is the time lag between changes in management prac-tices and their impact on water quality?
3. What motivates individuals as they make decisions that affectland management?
4. What planning horizon is important to decision makers, howdoes this vary based on public policy, economic condition, oravailable technology?
5. What is the effect of uncertainty and risk behavior on land-usedecisions, perceived importance of competing objectives sucheconomic return and environmental quality?
The platform is available over the Internet, so a variety ofusers in watershed science and management (researchers, educa-tors, students, farmers, managers, and the public) can monitorand engage in exploration and dialogue about this watershed.
Conclusions
There is a perceived lack of progress in implementing integrativemanagement approaches that is attributed to many challenges re-lated to their institutional, governance, management operation,technological, and analytical aspects [e.g., Biswas (2008)]. Thetechnological aspects for enabling integrative approach implemen-tation are less discussed in the literature and it is hoped that the CItechnologies described in this paper have demonstrated their poten-tial to directly improve the sustainability of the decision makingthrough several means. Some of the merits of the end-to-end CIsystem for suporting decision making are highlighted subsequently(Muste 2012).
First, the end-to-end CI systems have the potential to bringtogether data from a variety of disciplines that can be easily proc-essed to fill gaps in information and knowledge and facilitate the
translation of science in action with the participation of both sci-entists and practitioners. These systems can store both availabledata and new data as soon as they are produced in an automatedmanner without human intervention.
Second, the CI systems improve the information services andoperational science needed for efficient and effective decisionmaking. The information services provided by these systemsallow the establishment of an iterative dialogue between theinformation users and producers through an open and transparentcyber platform accessible to all involved stakeholders (i.e., scien-tists, watershed managers, policy makers, and the public at large).The availability of data in one centralized place (even if virtualand geographically distributed) enables timely production of infor-mation based on the synthesis and interpretation of data from vari-ous domains and disciplines. Furthermore, the CI end-to-endsystems enable wide access to data and information representedin a language that can be understood by various user categories(including the general public). They faciliate efficient and timelystakeholder engagement through traditional forms (joining localwatershed groups, attending training courses or public meetings)as well as through more contemporary technologies (web collab-oratory, mobile devices, and online social networking tools).Collectively, these forms of involvement inject local (public)knowledge into the decision-making process. Finally, the capabil-ities of CI systems to gather in one place all watershed-related in-formation makes them attractive to agencies that usually workindependently.
The prototype implementations described in this paper illustratethat the translation of the theoretical concepts regarding integrativemanagement approaches to practical applicaton is achievable.Furthermore, these implementations point toward new and unprec-edented perspectives on the stresses that currently threaten water-shed resources and comprehensive approaces to educate andengage decision makers and relevant stakeholders. These end-to-end engineering systems are poised to create a new paradigmfor watershed science and management, enabling interdisciplinaryteams to collaboratively understand and manage complex water-shed issues to achieve long-term sustainability.
Fig. 4. Intelligent digital watershed operational flux and ancillary database
572 / JOURNAL OF WATER RESOURCES PLANNING AND MANAGEMENT © ASCE / SEPTEMBER/OCTOBER 2013
J. Water Resour. Plann. Manage. 2013.139:565-573.
Dow
nloa
ded
from
asc
elib
rary
.org
by
UN
IV O
F IO
WA
LIB
RA
RIE
S on
09/
11/1
3. C
opyr
ight
ASC
E. F
or p
erso
nal u
se o
nly;
all
righ
ts r
eser
ved.
Acknowledgments
Most of the work presented in this paper was accomplished withfunds provided through the National Science Foundation throughthe CBET-0607262 and CBET-0835607 grants. This support isgreatly appreciated.
References
Abbott, M. B. (1991). Hydroinformatics: Information technology and theaquatic environment, Avebury Technical, Aldershot, UK.
ArcGIS Server 9.2. [Computer software]. .NET WebADF, EnvironmentalSystem Research Institute (ESRI), Redlands, CA.
ArcGIS Server 9.3. [Computer software]. .NET WebADF, EnvironmentalSystem Research Institute (ESRI), Redlands, CA.
ArcGIS Server 9.3.1. [Computer software]. .NETWebADF, EnvironmentalSystem Research Institute (ESRI), Redlands, CA.
Arnold, J. G., Srinivasan, R., Muttiah, S., Williams, J. R. (1998). “Largearea hydrologic modeling and assessment: Part I. Model development.”J. Am. Water Resour. Assoc., 34(1), 73–89.
Bennett, D., et al. (2012). “Modeling land use/land cover change inresponse to changing economic and environmental drivers.” AnnualMeeting, Association of American Geographers, Washington, DC.
Bennett, D. A., and McGinnis, D. (2008). “Coupled and complex: Human-environment interaction in the greater Yellowstone ecosystem, USA.”Geoforum, 39(2), 833–845.
Biswas, A. K. (2008). “Integrated water resources management: Is it work-ing?” Int. J. Water Resour. Dev., 24(1), 5–22.
Codd, E. F. (1970). “A relational model of data for large shared data banks.”Commun. ACM, 13(6), 377–387.
Giordano, R., Uricchio, V. F., and Vurro, M. (2008). “Monitoring informa-tion systems to support integrated decision-making.” The adaptivenessof IWRM: Analyzing European IWRM research, J. G. Timmerman,C. Pahl-Wostl, and J. Moltgen, eds., IWA Publishing, London.
Goodall, J. L. (2005). “A geotemporal framework for hydrologic analysis.”Doctoral dissertation, Univ. of Texas at Austin, Austin, TX.
Heathcote, I. W. (1998). Integrated watershed management, Wiley,New York.
Horsburgh, J. S., Tarboton, D. G., Maidment, D. R., and Zaslavsky, I.(2008). “A relational model for environmental and water resourcesdata.” Water Resour. Res., 44(5), W05406.
Horsburgh, J. S., Tarboton, D. G., Maidment, D. R., and Zaslavsky, I.(2011). “Components of an environmental observatory informationsystem.” Comput. Geosci., 37(2), 207–218.
Just, L. J., Kruger, A., and Muste, M. (2007). “Clear Creek environmentalhydrologic observatory: From vision to reality.” National ScienceFoundation Award 0607262, BES—Environmental Engineering, Univ.of Iowa, Iowa City, IA.
Maidment, D. (2006). “Hydrologic information system.” CUAHSIWorkshop, Consortium of Universities for the Advancement of Hydro-logic Science, Austin, TX.
Maidment, D. (2009). “CUAHSI hydrologic information system.”CUAHSI-HIS Status Rep., Consortium of Universities for the Advance-ment of Hydrologic Science, Washington, DC.
Muste, M. (2007). “Toward the integration of watershed science and man-agement.” Proc. of 32nd IAHR Congress, International Association forHydraulic Research, Venice, Italy.
Muste, M. (2012). “Information-centric systems for underpinning sustain-able watershed resource management,” Chapter 21, Water quality andsustainability, Elsevier, Burlington, MA, in press.
Muste, M., Kim, D., and Arnold, N. (2010a). “Interactive data coupler forSWAT using open source components.” The American GeophysicalUnion (AGU) fall meeting, AGU Meetings Department, Washington,DC.
Muste, M., Kim, D., Arnold, N., Whiteaker, T., Just, C., and Kruger, A.(2010b). “Digital watershed inception using community project compo-nents.” Proc. Inst. Civ. Eng., 163(1), 13–25.
National Science Foundation (NSF). (2003). “Revolutionizing scienceand engineering through cyberinfrastructure.” NSF Rep., Blue-RibbonAdvisory Panel on Cyberinfrastructure, ⟨http://www.nsf.gov/od/oci/reports/atkins.pdf⟩ (Oct. 24, 2011).
Neitsch, S. L., Arnold, J. G., Kiniry, J. R., and Williams, J. R. (2005). “Soiland water assessment tool theoretical documentation.” Texas A&MUniv., College Station, TX, ⟨http://swatmodel.tamu.edu/media/1292/SWAT2005theory.pdf⟩ (Oct. 24, 2011).
Schnoor, J. L., Muste, M., Bennett, D., Secchi, S., and Kusiak, A. (2008).“Understanding water-human dynamics using an intelligent digitalwatershed.” National Science Foundation Award 0835607 forCyber-enabled Discovery and Innovation Type II Program, Univ. ofIowa, Iowa City, IA.
Schnoor, J. L., Muste, M., Bennett, D., Secchi, S., Kusiak, A., and Ding, D.(2011). “Decision-support system for sustainable agroeconomy inthe US Midwest.” Proc. of 1st Int. Conf. on Sustainable WatershedManagement, Istanbul Technical Univ., Dept. of Environmental Engi-neering, Turkey.
JOURNAL OF WATER RESOURCES PLANNING AND MANAGEMENT © ASCE / SEPTEMBER/OCTOBER 2013 / 573
J. Water Resour. Plann. Manage. 2013.139:565-573.
Dow
nloa
ded
from
asc
elib
rary
.org
by
UN
IV O
F IO
WA
LIB
RA
RIE
S on
09/
11/1
3. C
opyr
ight
ASC
E. F
or p
erso
nal u
se o
nly;
all
righ
ts r
eser
ved.