Employee flows to improve measures of job creation and destruction and of firm dynamics. The case of...
37
Employee flows to improve measures of job creation and destruction and of firm dynamics. The case of Belgium Karen Geurts * , Monique Ramioul † , Peter Vets ‡ June 2009 Abstract This paper presents a method for improved estimation of measures of firm dynamics and job creation and destruction. We use employee flow informa- tion to re-establish broken links between records of the same firm, and to iden- tify relationships between firms in case of mergers, take-overs, split-offs, and other forms of restructuring. The method is developed on the basis of a linked employer-employee data set covering all private employment in Belgium. The employee flow approach results in substantial quality improvement of the measures discussed. First, it leads to significant reduction of the upward bias in statistics of firm dynamics and job reallocation. In the period of observation, we find that 35 to 50 per cent of total entries and exits of firms with at least 10 em- ployees does not coincide with the real opening or closing of a firm. Overall job creation and destruction levels are revised downwards by 14.5 and 16.6 per cent respectively. Second, correcting for employee flows reduces annual variation in estimated measures, revealing more regular patterns of firm and employment dynamics, especially at the sectoral level. Keywords: Firm dynamics, Job creation and destruction, Micro data JEL-Classification: J23, J21, C81 Paper prepared for the Comparative Analysis of Enterprise Data 2009 Conference, 2-4 Octo- ber 2009, Hitotsubashi Memorial Hall, Tokyo, Japan * HIVA, Katholieke Universiteit Leuven. Email: [email protected] † HIVA, Katholieke Universiteit Leuven. Email: [email protected] ‡ Statistics Department of the Belgian Social Security Office, Email: [email protected] 1
-
Upload
independent -
Category
Documents
-
view
0 -
download
0
Transcript of Employee flows to improve measures of job creation and destruction and of firm dynamics. The case of...

Employee flows to improve measures of job creation and
destruction and of firm dynamics. The case of Belgium
Karen Geurts∗, Monique Ramioul†, Peter Vets‡
June 2009
Abstract
This paper presents a method for improved estimation of measures of firm
dynamics and job creation and destruction. We use employee flow informa-
tion to re-establish broken links between records of the same firm, and to iden-
tify relationships between firms in case of mergers, take-overs, split-offs, and
other forms of restructuring. The method is developed on the basis of a linked
employer-employee data set covering all private employment in Belgium.
The employee flow approach results in substantial quality improvement of
the measures discussed. First, it leads to significant reduction of the upward bias
in statistics of firm dynamics and job reallocation. In the period of observation,
we find that 35 to 50 per cent of total entries and exits of firms with at least 10 em-
ployees does not coincide with the real opening or closing of a firm. Overall job
creation and destruction levels are revised downwards by 14.5 and 16.6 per cent
respectively. Second, correcting for employee flows reduces annual variation in
estimated measures, revealing more regular patterns of firm and employment
dynamics, especially at the sectoral level.
Keywords: Firm dynamics, Job creation and destruction, Micro data
JEL-Classification: J23, J21, C81
Paper prepared for the Comparative Analysis of Enterprise Data 2009 Conference, 2-4 Octo-
ber 2009, Hitotsubashi Memorial Hall, Tokyo, Japan∗HIVA, Katholieke Universiteit Leuven. Email: [email protected]†HIVA, Katholieke Universiteit Leuven. Email: [email protected]‡Statistics Department of the Belgian Social Security Office, Email: [email protected]
1

1 Introduction1
Measures of net employment growth, usually aggregated at the sectoral or nationallevel, are still used as predominant indicators to monitor labour market trends, andto compare growth rates in industries and countries. However, these time seriesmask the turbulent process of firm entry and exit, and of job creation and destructionwhich takes place continuously in all sectors of the economy. Aggregate employ-ment statistics cannot capture this turbulence, they do not reveal the firm character-istics of success and failure, neither do they allow an analysis of the consequencesfor employees of the continuous reallocation of jobs.
Hence, since the late 1970s data on firm dynamics and on job creation and destruc-tion have been studied to enhance understanding of economic turbulence and of jobgain and loss (Birch, 1987; Davis, Haltiwanger & Schuh, 1997; Bartelsman, Scarpetta& Schivardi, 2005; Cahuc & Zylberberg, 2006; Brown, Haltiwanger & Lane, 2006).These data decompose net employment measures into gross job flows and firm entryand exit, and therefore facilitate the analysis of the drivers and effects of labour mar-ket changes. Empirical studies on job flows have revealed a substantial amount ofchurning underlying net growth rates. Moreover, they have shown that considerablemovements of job creation and destruction often occur simultaneously in the busi-ness cycle and within narrowly defined sectors (Davis, Haltiwanger & Schuh, 1997;Blanchflower & Burgess, 1996; Albaek & Sorensen, 1998; Faggio & Konings, 2001;Stiglbauer, Stahl, Winter-Ebmer & Zweimüller, 2002; Clayton & Spletzer, 2008). Sincethe late 1990s, longitudinal firm level databases have extended research possibilitiesin the field and have stimulated academic research on micro-economic drivers andmacro-economic consequences of job creation and destruction, firm dynamics, andtheir impacts on employees (Persson, 1999; Abowd, Corbel & Kramarz, 1999; Foster,Haltiwanger & Krizan, 2001; Baldwin, Beckstead & Girard, 2002; Piekkola & Böck-erman, 2002; Davis, Faberman & Haltiwanger, 2005). In policy-relevant research, jobflow data are used as well, for example to study the effect of economic institutionsand policy on employment and productivity growth (Scarpetta, Hemmings, Tresselt
1This working paper reports results from the research undertaken in the framework of theKEROSINE-project (Knowledge Economy and Regional Strategies for Organisational and Sustain-able Innovation), a project in strategic basic research supported by the Institute for the Promotion ofInnovation by Science and Technology in Flanders. The project is conducted by HIVA and CESO atKUL and by Vlerick UGent. Promoters are Geert Van Hootegem and Monique Ramioul.
2
& Woo, 2002; Brandt, 2004; Gómez-Salvador, Messina & Vallanti, 2004; Haltiwanger,Scarpetta & Schweiger, 2006).
Pros and cons of administrative firm level data
Large administrative firm level data sets have become prevalent sources for the es-timation of measures of firm dynamics and of job creation and destruction. Cross-sectional microdata from business registration, social security, or taxation systemsare used to create longitudinal linked employer-employee data sets both at a na-tional, a European and an OECD level (Albaek & Sorensen, 1998; Baldwin, Dunne &Haltiwanger, 1998; Persson, 1999; Korkeamäki & Kyyrä, 2000; Baldwin et al., 2002;Eurostat, 2003; Abowd, Haltiwanger & Lane, 2004; Bartelsman et al., 2005). The mainadvantages of these data sources are the complete, or nearly complete coverage ofthe target population, access to exact estimates for detailed sub-populations, cost-effectiveness, and reduction of the response burden on businesses (Vale, 2003).
Although the advantages of using administrative data are indisputable, these sourcesalso have some drawbacks, which lead to inaccuracies in the estimations of firm dy-namics and hence of job creation and destruction. One of the major problems arisesfrom failures in the period-to-period linking of individual firms’ records. Individ-ual firms in administrative data sets are usually identified by a unique identificationcode, such as the business registration number, which allows the longitudinal inte-gration of firm level information. When, however, the continuity of a firm’s identi-fication code is broken, records are falsely identified as new or closing firms, whichresults in an upward bias in firm dynamics and in job flow measures. A second prob-lem is caused by the difficulty to identify changes in firm structure on the basis ofadministrative data, which likewise results in inaccuracies in the estimation of flowmeasures.
The first problem, failures in the period-to-period linking of individual firms’ records,occurs when the identification code of a firm changes. This can be the result of achange in the legal form of the firm, a change of ownership, or simply a changeof accountants (for discussion of the reasons see Vilhuber, 2009 and Baldwin et al.,2002). The disappearance of the previous identification code of a firm from the dataset is recorded as a firm closing involving the destruction of jobs, and the appearanceof a new ID is classified as a new firm creating jobs. Since, however, the new firm
3

is economically identical to the previous one, no ’real’ economic demographic eventhas taken place (Benedetto, Haltiwanger, Lane & McKinney, 2007; Ahmad, 2008),neither has the firm’s employment been destroyed or newly created. Such linkagefailures thus falsely define both firm openings and closings and hence yield an up-ward bias in firm dynamics and in job flow measures (Spletzer, 1998; Brandt, 2004;Abowd & Vilhuber, 2005).
While the first problem appears in case of broken ’one-to-one’ links of individualfirms, the second problem occurs when multiple firms are involved. Changes infirm structure, such as the fusion of the factors of production of several firms intoone, or the division of a firm into multiple ones, can cause an upward bias in dy-namics measures. Consider an example of the many-to-one case, which occurs inthe event of a merger, an acquisition, or more generally a ’consolidation’ (Pinxton &Spletzer, 2002). In this case, one of the previously existing firm IDs disappears fromthe data set, which is then classified as a firm closing involving job destruction. Thesuccessor firm, absorbing the jobs of the previous one(s), is classified as an expand-ing or a new employer creating jobs. Although the transfer of jobs in case of mergersand acquisitions is an economically significant event, it is generally accepted that itshould not be included in measures of job creation and destruction (Persson, 1999;Baldwin et al., 2002; Eurostat, 2003; Benedetto et al., 2007; Ahmad, 2008). Failingto link the records of consolidating firms thus results in an upward bias in job flowmeasures. Similarly, it can easily be understood that the opposite ’one-to-many’event, which occurs in the case of a spin-off, a breakout, or a break-up, also causesan overestimation of job flow measures.
To address these longitudinal linkage problems in firm level data sets, differentmethods have been developed. Commonly applied methods use probabilistic match-ing based on similarities in partial firm identifiers. More recently, linkage methodsbased on employee flows have been developed as a complement or an alternative toprobabilistic matching. This paper contributes to the latter approach by presentinga method for the establishment of linkages between firm identifiers using employeeflow information. The data that are used stem from a Belgian social security registerwith linked employer-employee data covering 90 per cent of national employment.The motivation to develop this method has come from the lack of reliable firm leveldata on employment and business dynamics in Belgium, which severely hampersnational research on labour market changes. In a recent working paper by the Na-
4

tional Bank of Belgium on job creation and destruction, for example, the authorspoint out that "the calculations are affected by the issue of mergers and acquisitions"(Heuse & Saks, 2009, p. 10). The aim of this paper is to show that a substantialquality improvement of firm dynamics and job flow measures can be reached by us-ing simple criteria. The presented method is the result of a collaboration betweenthe statistics department of the Belgian National Social Security Office and the Workand Organization research group of HIVA - Katholieke Universiteit Leuven.
The paper is structured as follows. Section 2 presents a brief overview of existingmethods of linking firm identifiers. Section 3 contains the data and the definitionsthat are used. Section 4 describes the procedure that was followed to constructpredecessor-successor links, and the decision rules that were implemented to dis-tinguish between spurious and genuine openings and closings of firms. Section 5provides an overview of the results for ten types of changes in firm structure or firmidentifier. Section 6 explains the correction formula that is applied to adjust job cre-ation and destruction measures. Section 7 presents the impact of the method on eco-nomic estimates: both indicators of firm dynamics and job creation and destructionmeasures are discussed. The findings are compared with the results of internationalresearch. Section 8 discusses the weakness of the method presented and proposesfurther elaborations. Section 9 concludes the paper.
2 Methods of linking firm identifiers
2.1 Matching based on partial firm identifiers
The one-to-one linkage problem of firm records in administrative data is well un-derstood and has been tackled by a variety of methods. By connecting previous andsubsequent administrative identifiers of firms, these methods reduce the occurrenceof falsely defined births and deaths of firms, thus allowing more accurate job cre-ation and destruction measures. The most commonly adopted methods are basedon probabilistic matching: probable links between firm records are established onthe basis of a comparison of partial identifiers of firms, such as name, location, andindustry. For example, in a harmonized methodology for business demography, Eu-rostat and OECD recommend a matching process based on three ’continuity factors’:
5

name, location and economic activity (Eurostat/OECD, 2007). The US Bureau ofLabor Statistics adopts a probability-based weighted match process using name, ad-dress and phone number to link the records of individual establishments (Robertson,Huff, Mikkelson, Pivetz & Winkler, 1997; Abowd & Vilhuber, 2005). In some coun-tries, probabilistic matching techniques are preceded by administrative editing andreview based on information from surveys and other administrative data, such as in-formation about the firm’s predecessors and successors (Spletzer, 1998; Bycroft, 2003;Vartiainen, 2005; Clayton & Spletzer, 2008). Matching processes, implemented bysoftware, are commonly complemented by analyst intervention to validate matchesor, if necessary, to manually link the records of large firms (Eurostat/OECD, 2007, p.36; Clayton & Spletzer, 2008, p. 6). Vilhuber (2009) provides an overview of currentmethods.
The second linkage problem, occurring when multiple firms are involved, is moredifficult to address. Some record linkage methods are similarly adopted to iden-tify relationships between firms that are involved in ’consolidations’ or ’breakouts’(Pinxton & Spletzer, 2002; Mikkelson & Unger, 2006). Most of the above-mentionedmethods, however, are not able to fully capture events such as mergers, split-offs,takeovers, and other forms of restructuring. Furthermore, compiling accurate jobcreation and destruction statistics in the case of these events causes additional diffi-culties (Pinxton & Spletzer, 2004; Eurostat/OECD, 2007, p. 26; Ahmad, 2008, p. 132).This is where the need for an alternative approach comes in.
2.2 Methods based on employee flows
The above-mentioned linkage processes make use of information on the continuityof controlling legal unit (name), activity (industry), and/or location (address) to es-tablish links between unmatched records of the same firm. These methods do nottake continuity of employment into account. Data on employee flows between firmidentifiers can be used to fill this gap. If one of the main factors of production, theworkforce, is identical in two administrative records, there is a high probability thatthese records relate to the same firm (Eurostat/OECD, 2007, p. 26; Benedetto et al.,2007, p. 6; Ahmad, 2008, p. 132). Hence, continuity of employment, measuredby flows of clusters of employees between two administrative firm identifiers, is astrong criterion to establish links between unmatched records of the same firm. This
6

means that a firm is considered continuous when it uses largely the same factors ofproduction at two points in time. Furthermore, employee flows can be used to iden-tify restructurings events: in case of a ’consolidation’, employees previously regis-tered in different firms are grouped into one firm record, and in case of a ’breakout’,the employees of one firm are distributed among two or more records. It is clear thatfor the implementation of employee flow approach, linked employer-employee dataare necessary.
Several countries have started to use employee flows to provide more reliable statis-tics on business and employment dynamics (Persson, 1999; Korkeamäki & Kyyrä,2000; Baldwin et al., 2002; Stiglbauer et al., 2002; Bycroft, 2003; Benedetto et al.,2007; Vilhuber, 2009). These methods generally follow the same logic: if a signif-icant number, and/or a significant fraction of employees moves from one firm toanother, then a relationship between a ’predecessor’ and a ’successor’ firm can beestablished. Most studies use the employee flow approach in order to remove spuri-ous firm openings and closings from business dynamics statistics. Some also use thisinformation to adjust job creation and destruction measures, or to identify changesin firm structure (Korkeamäki & Kyyrä, 2000, Mikkelson & Unger, 2006; Benedettoet al., 2007). In this paper we do both. First, we use data on employee flows to distin-guish between genuine firm openings and closings and other demographic eventssuch as changes in administrative identifier or in organisational structure. Second,we propose an algorithm to correct year-to-year employment evolutions of firms in-volved in such events.
3 Data and definitions
The data in this study were obtained from a linked employer-employee data setwhich is maintained by the Belgian National Social Security Office (NSSO). NSSOcollects and manages employer and employee social contributions. All employershiring one or more employees have to register with the NSSO. They are requiredto submit quarterly declarations with information on wages and working times ofevery employee. Upon registration, the employer is assigned a unique identificationnumber (NSSO number). Equally, every employee is uniquely identified by a socialsecurity number (INSS number). The quarterly declarations are filled out electroni-cally, which ensures continuity of the employer identification, and which renders the
7

data ready to be processed. Local and provincial public employers are not includedin the NSSO database. For reasons of confidentiality, NSSO data on unincorporatedenterprises have not been included in the analysis presented in this paper.
The statistical units and indicators used in this paper have been developed accord-ing to international definitions and recommendations. This enables future incorpo-ration of Belgian results in comparative research. For the main units of analysis -active employers, and employer openings and closings - we followed the joint Euro-stat and OECD recommendations on business demography data collection (Eurostat/ OECD, 2007; Ahmad, 2008). For indicators on job creation and destruction, weadopted the standard definitions proposed by Davis, Haltiwanger & Schuh (1997).The definitions will only be given briefly below. For detail and motivation, we referto the cited references.
The central unit of analysis is the employer. Employers are firms hiring at leastone employee. The definition of a firm in the NSSO database corresponds with thestatistical unit of the enterprise recommended by Eurostat and OECD for businessdemography data collection:
“The enterprise is the smallest combination of legal units that is an or-ganisational unit producing goods or services, which benefits from a cer-tain degree of autonomy in decision-making, especially for the allocationof its current resources. An enterprise carries out one or more activities atone or more locations. An enterprise may be a sole legal unit.” [CouncilRegulation (EEC) No 696/93 of 15 March 1993]
Active employers and employer openings and closings in this paper are hence de-fined at the firm level. Because the quality of job flow measures depends on the cor-rect identification of opening and closing units, job creation and destruction will alsobe estimated at the firm level. In large countries such as the U.S., job flow statisticsare computed using establishment level data. The reason for this is that firm leveldata mask the job flows between different establishments of the same firm. For thestudy of business demography statistics in smaller countries such as the Europeanones, the firm is considered to be the most useful level of analysis (Ahmad, 2008;Eurostat, 2007). Several European studies, therefore, use firm level data for job flowmeasures. In smaller countries, the vast majority of firms (90 per cent in Belgium)
8

only have one establishment and thus firms and establishments align (Ahmad, 2008,p. 128). In smaller regions there is also considerable mobility of employees betweenestablishments of the same firm, which would falsely be considered as job creationand destruction in an establishment approach. Furthermore, the use of firm leveldata enhances European comparative research since there is important variation inthe definition of establishments across countries (Messina & Vallanti, 2007).
In this paper, the terms ’employer’, ’firm’, and ’employer firm’ are treated as syn-onyms. The industry code of an employer is the code of its primary activity, whichis assigned according to the NACE Rev.1 classification.
The opening of an employer firm - an ’employer enterprise birth’ (Eurostat/OECD,2007, p. 34) - coincides with the birth of a firm that has at least one employee inthe year of birth and of firms that move from zero to one employee. Reactivations of’dormant’ employers having no employees for less than two years are not consideredas openings. However, reactivations after two years or more, are. Thus far, an open-ing can be identified by using a simple quantitative criterion: each employer with atleast one employee in year t and no employees in the two previous years, coincideswith an opening. An important restriction to this definition is that no other firmsare involved in the event: openings “do not include entries into the population dueto: mergers, break-ups, split-offs or restructuring of a set of enterprises”, neither dothey include entries which are merely the result of a change of name, ownership, le-gal form, or activity (Eurostat/OECD, 2007, p. 34). In summary, employer openingsinvolve “the creation of new production factors, in particular new jobs”. To ensurethat all recorded openings meet this definition, spurious openings will be tracked bymeans of clustered employee flows, and removed from the initial population of firmentries.
The definition of an employer firm closing - ’employer enterprise death’ (Euro-stat/OECD, 2007, p. 51) - mirrors that of an opening: the closing of an employerfirm coincides with the “dissolution of a combination of production factors with therestriction that no other enterprises are involved in the event”. They can be iden-tified initially by a mere quantitative criterion, selecting all employers which movebelow the threshold of one employee for at least two years. Exits from the popu-lation due to changes of identification number, mergers, takeovers, break-ups, orrestructuring of a set of firms are then removed from the initial population by meansof the employee flow method.
9
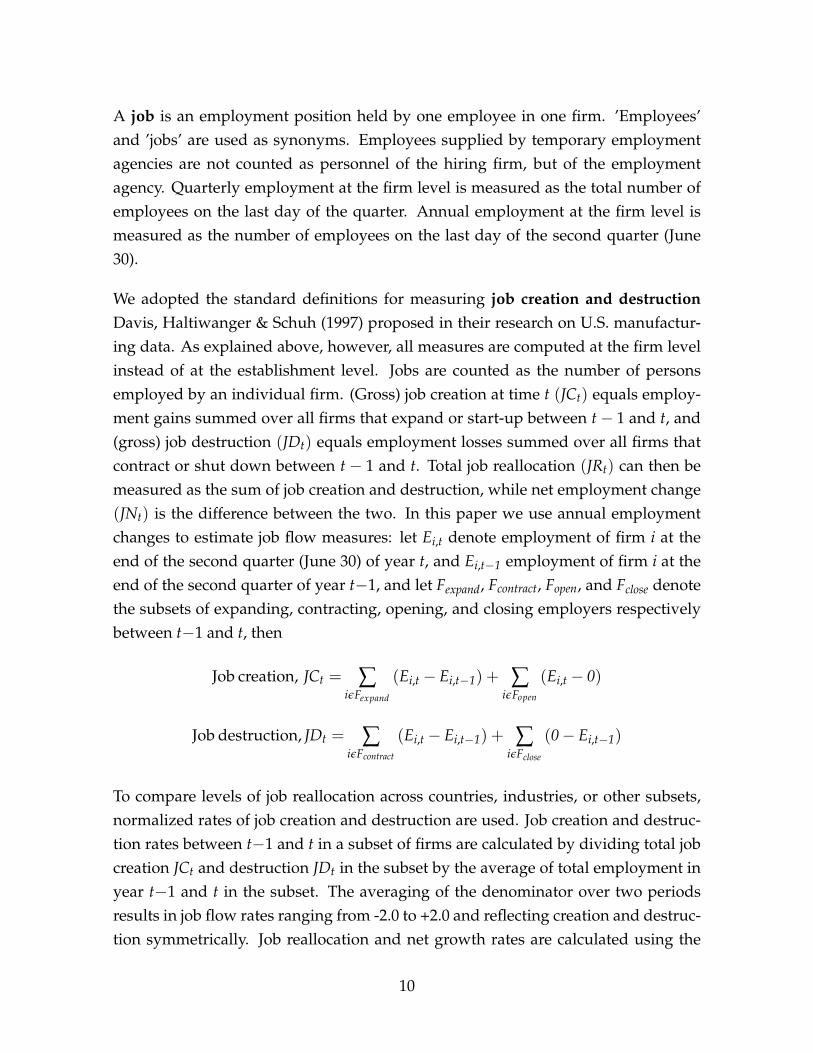
A job is an employment position held by one employee in one firm. ’Employees’and ’jobs’ are used as synonyms. Employees supplied by temporary employmentagencies are not counted as personnel of the hiring firm, but of the employmentagency. Quarterly employment at the firm level is measured as the total number ofemployees on the last day of the quarter. Annual employment at the firm level ismeasured as the number of employees on the last day of the second quarter (June30).
We adopted the standard definitions for measuring job creation and destructionDavis, Haltiwanger & Schuh (1997) proposed in their research on U.S. manufactur-ing data. As explained above, however, all measures are computed at the firm levelinstead of at the establishment level. Jobs are counted as the number of personsemployed by an individual firm. (Gross) job creation at time t (JCt) equals employ-ment gains summed over all firms that expand or start-up between t− 1 and t, and(gross) job destruction (JDt) equals employment losses summed over all firms thatcontract or shut down between t− 1 and t. Total job reallocation (JRt) can then bemeasured as the sum of job creation and destruction, while net employment change(JNt) is the difference between the two. In this paper we use annual employmentchanges to estimate job flow measures: let Ei,t denote employment of firm i at theend of the second quarter (June 30) of year t, and Ei,t−1 employment of firm i at theend of the second quarter of year t−1, and let Fexpand, Fcontract, Fopen, and Fclose denotethe subsets of expanding, contracting, opening, and closing employers respectivelybetween t−1 and t, then
Job creation, JCt = ∑iεFexpand
(Ei,t − Ei,t−1) + ∑iεFopen
(Ei,t − 0)
Job destruction, JDt = ∑iεFcontract
(Ei,t − Ei,t−1) + ∑iεFclose
(0− Ei,t−1)
To compare levels of job reallocation across countries, industries, or other subsets,normalized rates of job creation and destruction are used. Job creation and destruc-tion rates between t−1 and t in a subset of firms are calculated by dividing total jobcreation JCt and destruction JDt in the subset by the average of total employment inyear t−1 and t in the subset. The averaging of the denominator over two periodsresults in job flow rates ranging from -2.0 to +2.0 and reflecting creation and destruc-tion symmetrically. Job reallocation and net growth rates are calculated using the
10

same denominator. For rates up to about±20 per cent, results are approximately thesame as when using the more conventional denominator, i.c. employment in yeart−1. However, potential outliers in the data are smoothed.
It is important to note that it is commonly accepted to measure gross job creationand destruction as aggregate net employment changes at the firm level. This impliesthat these measures do not reflect the creation and destruction of jobs within firms,and are hence an underestimation of real job creation and destruction.
4 Using employee flows to link firms and to identify spurious firm
openings and closings
This section describes the linkage process developed by the NSSO to link acrosstime firms with a different administrative identifier in two consecutive periods butemploying a workforce which is largely or partially the same. The process resultsin data sets linking predecessor and successor firms in two consecutive quarters.Imposing additional criteria on the predecessor-successor links, two subsets are se-lected: one including spurious firm openings, the other spurious firm closings. Insection 6, this firm-demographic information is used for the estimation of job cre-ation and destruction measures.
4.1 Linking firms by using employee flows
The point of departure of the NSSO linkage process are quarterly microdata sets ofall labour relations. Containing over 3 million observations every quarter, they eachrepresent an employer-employee link. Both employers and employees are recordedby means of a unique identification number. It is important to note that since thequarterly employer declarations to the NSSO have been collected electronically, theNSSO microdata are unlikely to be contaminated by measurement error: neitheremployers nor employees can be assigned a wrong identification number, and anemployee cannot be linked to an employer which is not his/her.
The linkage process consists of two steps. The first step is to compare all employer-employee links of two successive quarters q−1 and q. Depending on whether they
11

exist in both quarters, the links are classified into several groups. Table 6 in An-nex summarizes the results for the quarters 2003/2 until 2008/1. Of all employer-employee relationships in a certain quarter, on average 92 per cent is continued inthe next quarter, 3.5 per cent consists of employees moving to another employer inthe next quarter, and 4.5 per cent of employees flowing out of the population. Whencompared to the previous quarter, 3.3 per cent represents a transition of employeesfrom another employer, and 4.9 per cent consists of inflow.
In a second step, the paired quarterly employer-employee links are aggregated atthe employer level. For each employer i and for every pair of quarters q−1 and q, adistinction can thus be made between (1) employees staying with employer i in bothquarters, (2) new employees of i in q coming in from outside NSSO employment,(3) new employees of i in q coming in from other employers in q−1, (4) employeesworking at i in q−1 moving out of NSSO employment, and (5) employees of i in q−1moving to other employers in q. For employees changing employer, the IDs of theprevious or the next employer(s) are retained. The subsets (3) and (5), including em-ployees changing employer, are of specific interest to us. When a ’significant’ clusterof employees moves from employer i to employer j, then a relationship between aso-called predecessor and successor firm can be established. When, however, only asmall cluster of employees is moving from employer i to employer j, this is consid-ered as individual mobility of employees simply changing jobs.
The data sets containing quarterly predecessor-successor relationships are subse-quently used to identify openings and closings of employer firms. Before proceed-ing, however, we briefly discuss the various decisions rules that can be implementedto identify ’significant’ clusters of employee flows.
4.2 Significant clusters of employee flows
The basic assumption of the employee flow method is that if two firms have a dif-ferent administrative identifier in two consecutive periods in time, but employ aworkforce which is largely or partially the same, the IDs relate to the same, or toparts of the same firm. Clusters of employees ’moving’ in the business register fromone firm identifier to another thus give a strong indication about changes in firmstructures and firm identifiers. What the minimum ’significant’ size of the cluster
12

of employees should be in order to establish a link between such a predecessor andsuccessor firm is, however, the subject of academic discussion. Depending on theaim of the study, different relative or absolute thresholds are proposed. The draw-back of a low cut-off level is that it risks including a considerable amount of mobilityof individual employees, which are simply job changes. A high threshold, on theother hand, risks failing to capture events involving small firms. Relative minimumlevels between 20 per cent and 80 per cent of the firm’s workforce are used, as wellas absolute cut-off levels or a combination of both (see e.g. Albaek & Sorensen, 1998;Persson, 1999; Korkeamäki & Kyyrä, 2000; Benedetto et al., 2007; Vilhuber, 2009).When comparing the relative magnitudes of clustered transitions of at least five em-ployees, Benedetto et al. (2007) found that the majority of transitions is either verysmall, accounting for less than 10 or 20 per cent of the predecessor / successor firm’sworkforce, or very large, including at least 80 per cent or more of the predecessor/ successor firm’s employment. It is reasonable to assume that small transitions aremainly the result of individual mobility of employees between firms, whereas largetransitions principally refer to changes in firm structure or identifier.
In the method described in this paper, we take all movements of clusters of at least10 employees as a point of departure. These are considered ’significant’ employeeflows on the basis of which a link between a predecessor and successor firm can beestablished. Subsequently, additional criteria are imposed in order to identify spuri-ous firm openings and closings. As to movements of less than 10 employees, we be-lieve there is a high probability that the results of a mere quantitative employee flowmethod are affected by individual employee mobility. In order to identify changesin firm structures and identifiers involving small firms, we therefore propose thatother methods are used to complement the employee flow approach (see discussionin section 8).
4.3 Identifying spurious firm openings and closings
As explained above, we define spurious firm openings and closings as entries or ex-its to the population which are not the result of the creation or destruction of new orexisting factors of production, but of changes in firm identifiers or of firm restructur-ings. Our focus on openings and closings implies that only predecessor-successorrelationships involving at least one entry or exit are taken into account. ’Significant’
13

employee flows between two continuous firms have not been included in our anal-ysis.
To identify spurious firm openings and closings, two subsets of the predecessor-successor links are selected. The first subset singles out ’spurious openings’ andtheir predecessors. Spurious openings are employers who (1) move from zero em-ployment in quarter q−1 to employing at least 10 employees in quarter q (’entries’),and which are (2) involved in at least one ’significant’ employee flow (of at least 10employees) from a predecessor in q−1. The second subset selects the ’spurious clos-ings’ and their successors. These are employers who move (1) from employing atleast 10 employees in quarter q−1 to zero employment in quarter q (’exits’), (2) in-volved in at least one ’significant’ transition of employees (at least 10 employees) toat least one successor in q, and (3) of which at least 75 per cent of the workforce hasmoved to another employer in q. The latter additional condition for spurious clos-ings is imposed to distinguish bankruptcies, which are true closings entailing realjob destruction, from changes in firm structures (such as mergers and acquisitions)and in firm identifiers. In case of a bankruptcy, an important part of the workforcemay be recruited by local competitors, certainly in industries facing labour marketshortages. Experience of NSSO experts shows that 75 per cent is a natural uppercut-off value for this kind of employee flows.2 In other words, the exit of a firm,of which less than 75 per cent of the work force has moved to another employer inthe next quarter, is considered as a real closing. This threshold is close to the 80 percent cut-off value which is proposed by Benedetto et al. (2007) to identify significantemployee flows from predecessor firms.
The quarterly subsets of spurious firm openings and closings and their respectivepredecessors or successors are compiled into annual data sets containing predecessor-successor links. They allow the estimation of the intended economic indicators: mea-sures of firm dynamics and of job creation and destruction on an annual basis. In thefour periods of observation, 2003/04 to 2006/07, a stable share of about 0.75 percent of the employer records in the NSSO register coincides with a spurious open-ing or closing, or with a predecessor or successor linked to one of these. This doesnot seem much, but as will be discussed in section 7, these records represent an im-portant share of apparent openings and closings of employers with more than 10
2One of the reasons that in case of a bankruptcy not more than 75 per cent of the workforce isrecruited by competitors, is that often in Belgium, part of the personnel makes us of the possibility ofearly retirement.
14
employees. Moreover, they are responsible for a disproportionately large share ofapparent job creation and destruction.
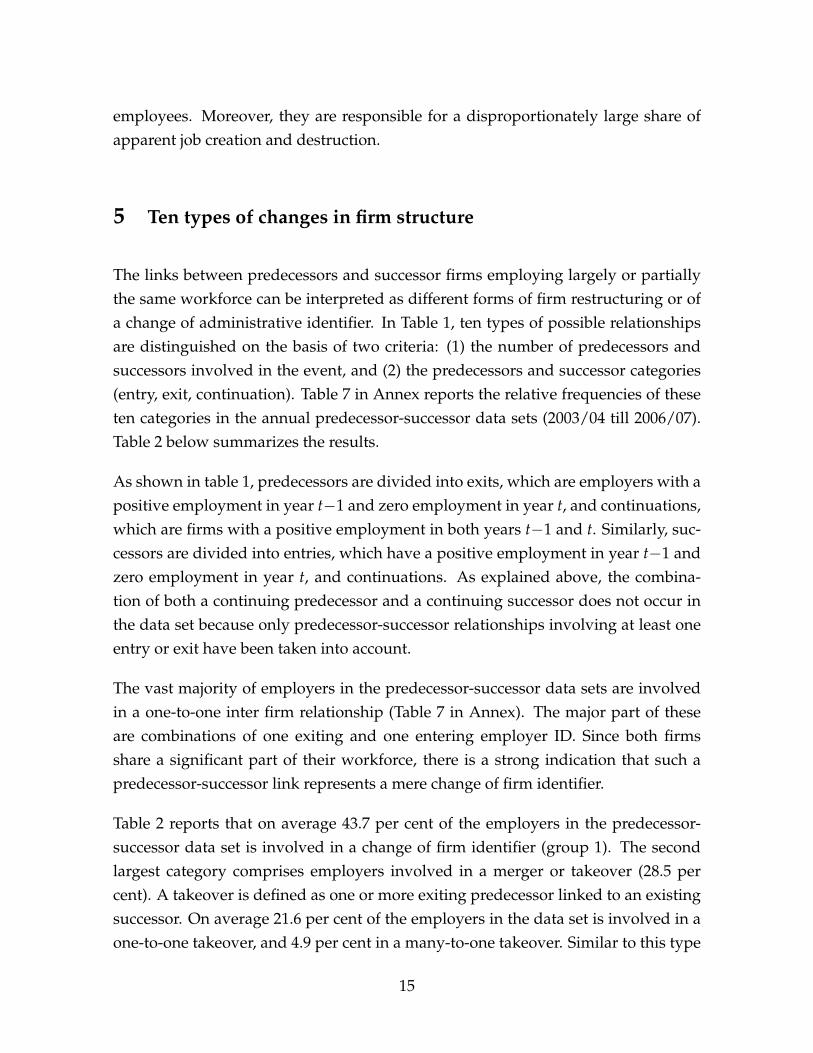
5 Ten types of changes in firm structure
The links between predecessors and successor firms employing largely or partiallythe same workforce can be interpreted as different forms of firm restructuring or ofa change of administrative identifier. In Table 1, ten types of possible relationshipsare distinguished on the basis of two criteria: (1) the number of predecessors andsuccessors involved in the event, and (2) the predecessors and successor categories(entry, exit, continuation). Table 7 in Annex reports the relative frequencies of theseten categories in the annual predecessor-successor data sets (2003/04 till 2006/07).Table 2 below summarizes the results.
As shown in table 1, predecessors are divided into exits, which are employers with apositive employment in year t−1 and zero employment in year t, and continuations,which are firms with a positive employment in both years t−1 and t. Similarly, suc-cessors are divided into entries, which have a positive employment in year t−1 andzero employment in year t, and continuations. As explained above, the combina-tion of both a continuing predecessor and a continuing successor does not occur inthe data set because only predecessor-successor relationships involving at least oneentry or exit have been taken into account.
The vast majority of employers in the predecessor-successor data sets are involvedin a one-to-one inter firm relationship (Table 7 in Annex). The major part of theseare combinations of one exiting and one entering employer ID. Since both firmsshare a significant part of their workforce, there is a strong indication that such apredecessor-successor link represents a mere change of firm identifier.
Table 2 reports that on average 43.7 per cent of the employers in the predecessor-successor data set is involved in a change of firm identifier (group 1). The secondlargest category comprises employers involved in a merger or takeover (28.5 percent). A takeover is defined as one or more exiting predecessor linked to an existingsuccessor. On average 21.6 per cent of the employers in the data set is involved in aone-to-one takeover, and 4.9 per cent in a many-to-one takeover. Similar to this type
15
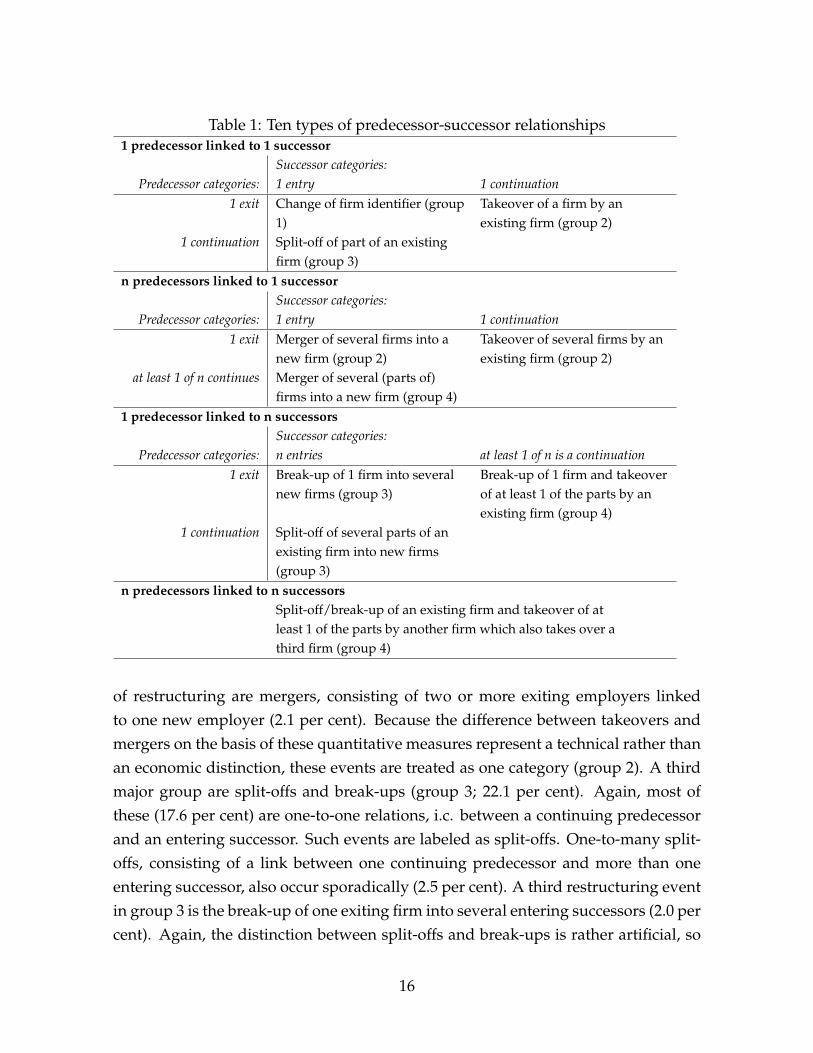
Table 1: Ten types of predecessor-successor relationships1 predecessor linked to 1 successor
Successor categories:Predecessor categories: 1 entry 1 continuation
1 exit Change of firm identifier (group1)
Takeover of a firm by anexisting firm (group 2)
1 continuation Split-off of part of an existingfirm (group 3)
n predecessors linked to 1 successorSuccessor categories:
Predecessor categories: 1 entry 1 continuation1 exit Merger of several firms into a
new firm (group 2)Takeover of several firms by anexisting firm (group 2)
at least 1 of n continues Merger of several (parts of)firms into a new firm (group 4)
1 predecessor linked to n successorsSuccessor categories:
Predecessor categories: n entries at least 1 of n is a continuation1 exit Break-up of 1 firm into several
new firms (group 3)Break-up of 1 firm and takeoverof at least 1 of the parts by anexisting firm (group 4)
1 continuation Split-off of several parts of anexisting firm into new firms(group 3)
n predecessors linked to n successorsSplit-off/break-up of an existing firm and takeover of atleast 1 of the parts by another firm which also takes over athird firm (group 4)
of restructuring are mergers, consisting of two or more exiting employers linkedto one new employer (2.1 per cent). Because the difference between takeovers andmergers on the basis of these quantitative measures represent a technical rather thanan economic distinction, these events are treated as one category (group 2). A thirdmajor group are split-offs and break-ups (group 3; 22.1 per cent). Again, most ofthese (17.6 per cent) are one-to-one relations, i.c. between a continuing predecessorand an entering successor. Such events are labeled as split-offs. One-to-many split-offs, consisting of a link between one continuing predecessor and more than oneentering successor, also occur sporadically (2.5 per cent). A third restructuring eventin group 3 is the break-up of one exiting firm into several entering successors (2.0 percent). Again, the distinction between split-offs and break-ups is rather artificial, so
16

Table 2: Number and share of employers involved in a predecessor-successor rela-tionship; Belgium, 2003/04 - 2006/07
2003-04 2004-05 2005-06 2006-07 4-yearaverage
Group n n n n n1. Change in firm identifier 524 510 649 649 5832. Merger, take-over 440 324 385 372 3803. Break-up, split-off 339 233 281 331 2964. Combination of 2. and 3. 47 88 37 30 51
Rest 21 19 22 26 22Total 1371 1174 1374 1408 1332
2003-04 2004-05 2005-06 2006-07 4-yearaverage
Group % % % % %1. Change in firm identifier 38.2 43.4 47.2 46.1 43.72. Merger, take-over 32.1 27.6 28.0 26.4 28.53. Break-up, split-off 24.7 19.8 20.5 23.5 22.14. Combination of 2. and 3. 3.4 7.5 2.7 2.1 3.9
Rest 1.5 1.6 1.6 1.8 1.6Total 100 100 100 100 100
Source: NSSO - HIVA K.U.Leuven
these events have been grouped together. A last and minor group consists of morecomplex relations between firms, such as a mergers of parts of several firms into anew firm, or many-to-many linkages (group 4; 3.9 per cent). A residual categorycomprises cases which are difficult to interpret, such as linkages which are the resultof changes in social security legislation, or employers who are successively successorand predecessor in two quarters of the same year.
Once spurious openings and closings have been identified, they can easily be re-moved from the population of entries and exits. This allows the more accurate iden-tification of real openings and closings of employer firms. The impact of these ad-justments on measures of firm dynamics is presented in section 7.
17

6 Adjusting measures of job creation and destruction
Since significant employee flows between firms represent the movement rather thanthe creation and destruction of factors of production, job creation and destructionmeasures not taking into account this information are biased. The upward bias ofboth measures is clear: in the case of a predecessor, the bare comparison of employ-ment in year t−1 and t results in an overstatement of job destruction. For successors,it results in an overstatement of job creation. For example, when firm A, with 50employees in year t−1, is taken over by firm B, with 100 employees in year t−1 and150 in year t, unadjusted job flow measures will report the destruction of 50 jobs (atthe level of predecessor A) and the creation of 50 jobs (by successor B).
The identification of spurious openings and closings of firms and their respectivepredecessors and successors allows the adjustment of annual job flow measures. Be-low, we propose the formula’s for the adjustment of job creation and destruction atfirm level for the employers involved in a clustered worker flow. The adjustmentis achieved for every pair of years t−1 and t, by correcting the employment levelsin t−1 of the employers involved in a predecessor-successor relationship. The em-ployment levels in t are left unaffected; they are considered as the correct point ofdeparture for the computation of job flow measures in t. The correction formulawhich is applied imposes a continuation of the workforce at the level of the succes-sor between t−1 and t. In other words, we proceed as if the employees who havemade a transition from the predecessor to the successor between t−1 and t, werealready part the workforce of the successor in t−1. In our example, the employmentlevels in t−1 of firm A and B after adjustment will be 0 and 150 respectively, yieldingjob creation and destruction measures of zero.
Let Si,t and Si,t−1 denote the registered number of jobs of a successor i in year t andyear t−1, and Pj,t and Pj,t−1 the registered number of jobs of a predecessor i in year tand year t−1, and let ∑n
i=1 Si denote the sum of the jobs of the n successors linked tothe same predecessor, and ∑m
j=1 Pj the sum of the jobs of the m predecessors linkedto the same successor, then the adjusted number of jobs of a successor i in year t−1 ,Sadj
i,t−1, is given by
Sadji,t−1 = Si,t−1 +
[|Si,t − Si,t−1|
∑mj=1 Pj,t + ∑n
i=1 (|Si,t−Si,t−1|)×
m
∑j=1
Pj,t−1
]
18

and the adjusted number of jobs of a predecessor j in year t−1 , Padjj,t−1, by
Padjj,t−1 = Pj,t−1 −
[Pj,t−1
∑mj=1 Pj,t−1
× Z
]
with
Z =n
∑i=1
Sadji,t−1
Table 8 in Annex reports the specific versions of the correction formula for the dif-ferent categories of predecessor-successor links. In most cases, the formula is easyto interpret. For example, in case of a predecessor exit, the total number of jobs ofthe predecessor is assigned to the successor. If an exiting predecessor is linked tomultiple successors, the jobs of the predecessor are distributed over the successorsaccording to the relative size of the successors in year t. In case of a predecessor con-tinuation, expression of the correction formula is more complicated: only a certainproportion of the jobs of the predecessor(s) is assigned to the successor: this propor-tion corresponds to the relative share of the jobs of the successor in the sum of thejobs of the predecessor and the successor in year t. As a last example, in case of mul-tiple successors, the relative shares of the jobs of the predecessor are assigned to thesuccessors according to the successor’s relative sizes in year t. For the specificationof the correction formula in other situations we refer to Table 8.
When applied to the four years of observation, adjusted annual figures of job cre-ation appear to be on average 14 per cent lower than registered job creation, andjob destruction figures are reduced by 17 per cent after adjustment. The next sectionpresents the main impacts of these corrections on job flow measures.
7 Impacts on measures of firm dynamics and of job creation and
destruction
In this section we compare unadjusted statistics on employer openings and closingsand on job creation and destruction with adjusted measurements based on the em-ployee flow method. The impacts on economic indicators are documented and theresults are compared with international measures.
19

The period the data in this paper relate to is 2003/04 until 2006/07. These were fouryears of stable and moderate employment growth without any important aggregatefluctuations. Unadjusted data, however, show strong annual variation, both in thenumber of firm openings and closings, and in job creation and destruction levels. Af-ter adjustment, annual variation is considerably reduced, hence resulting in a morerealistic picture of firm and employment dynamics in the years under consideration.
In order to present the impact of the method on economic estimates, we limited thescope of the data to NACE sections C to K. Thus activities relating to production,construction, trade, and private services are covered, but agriculture, public admin-istration, and public services such as education and health services are not. The rea-son for this limited coverage is that it allows us to compare the results for Belgiumwith those published by Eurostat for other European countries.
We start by documenting the impact of the employee flow method on firm dynamicsstatistics. We then turn to measures of job creation and destruction.
7.1 Employer openings and closings
Table 3 reports unadjusted figures of firm entry and exit and adjusted estimates aftersuppression of spurious openings and closings. Because our data set does not con-tain information on firm employment in 2002, openings can only be defined from2004/05 on and closings only until 2005/06 (see section 3 for definitions). On aver-age, 2.9 per cent of apparent firm openings are spurious ones and 3.5 per cent of allfirms apparently closing down can be identified as spurious closings.
The shares of spurious openings and closings in total firm entry and exit are brokendown by size in Table 9 in Annex. Because our method only identifies spuriousopenings and closings of firms with at least 10 employees, the size classes in table9 are above this threshold. In the period of observation, we find that 35 to 50 percent of total entries and exits of employer firms with at least 10 employees does notcorrespond to the real opening or closing of a firm. Not surprisingly, as the size ofthe entering/exiting employer increases, it becomes more probable that it is not areal opening or closing. Of all entering firms with 10 to 19 employees in the yearof entry, almost one in three is the result of clustered employee flow. Once abovethe threshold of 100 employees, it becomes very unlikely that a new firm entering
20
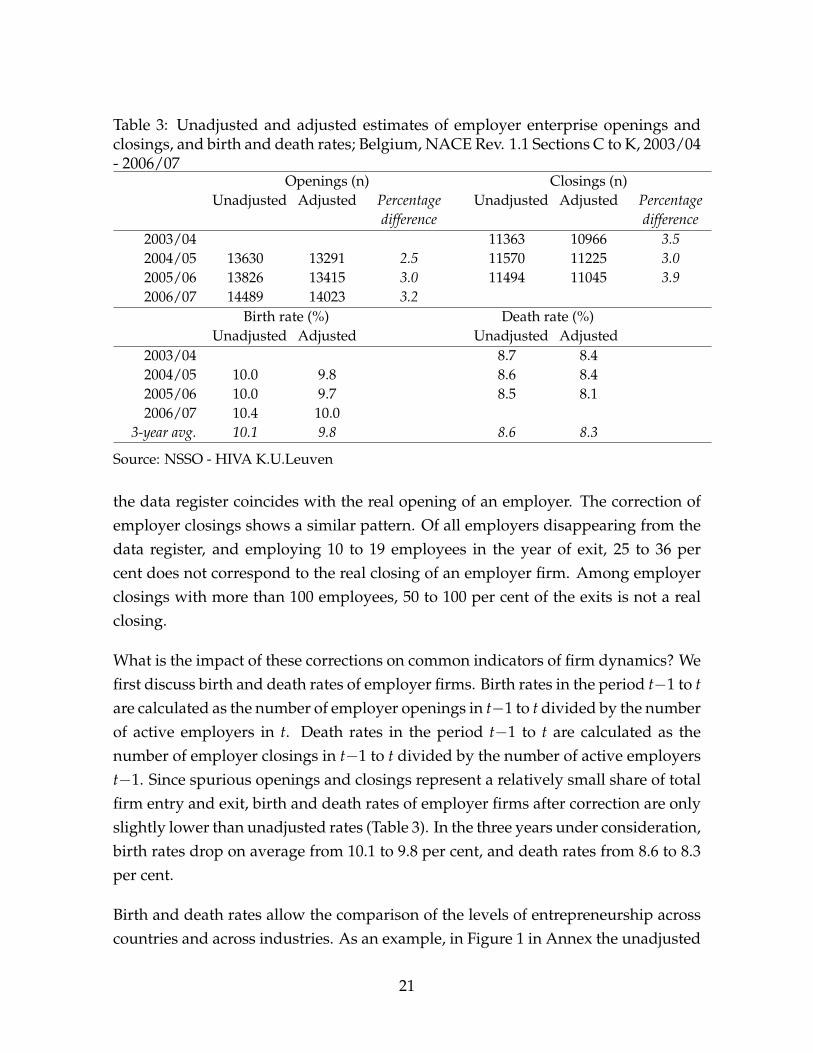
Table 3: Unadjusted and adjusted estimates of employer enterprise openings andclosings, and birth and death rates; Belgium, NACE Rev. 1.1 Sections C to K, 2003/04- 2006/07
Openings (n) Closings (n)Unadjusted Adjusted Percentage
differenceUnadjusted Adjusted Percentage
difference2003/04 11363 10966 3.52004/05 13630 13291 2.5 11570 11225 3.02005/06 13826 13415 3.0 11494 11045 3.92006/07 14489 14023 3.2
Birth rate (%) Death rate (%)Unadjusted Adjusted Unadjusted Adjusted
2003/04 8.7 8.42004/05 10.0 9.8 8.6 8.42005/06 10.0 9.7 8.5 8.12006/07 10.4 10.0
3-year avg. 10.1 9.8 8.6 8.3
Source: NSSO - HIVA K.U.Leuven
the data register coincides with the real opening of an employer. The correction ofemployer closings shows a similar pattern. Of all employers disappearing from thedata register, and employing 10 to 19 employees in the year of exit, 25 to 36 percent does not correspond to the real closing of an employer firm. Among employerclosings with more than 100 employees, 50 to 100 per cent of the exits is not a realclosing.
What is the impact of these corrections on common indicators of firm dynamics? Wefirst discuss birth and death rates of employer firms. Birth rates in the period t−1 to tare calculated as the number of employer openings in t−1 to t divided by the numberof active employers in t. Death rates in the period t−1 to t are calculated as thenumber of employer closings in t−1 to t divided by the number of active employerst−1. Since spurious openings and closings represent a relatively small share of totalfirm entry and exit, birth and death rates of employer firms after correction are onlyslightly lower than unadjusted rates (Table 3). In the three years under consideration,birth rates drop on average from 10.1 to 9.8 per cent, and death rates from 8.6 to 8.3per cent.
Birth and death rates allow the comparison of the levels of entrepreneurship acrosscountries and across industries. As an example, in Figure 1 in Annex the unadjusted
21

and adjusted birth rates for Belgium are compared with the available estimates forthe European member states published by Eurostat (Schrör, 2008; http://epp.Eurostat.ec.europa.eu).The estimates for the member states are produced according to the definitions dis-cussed in section 3. They cover the same sectors as the Belgian results (NACE C to K).Having relatively low employer firm birth rates, Belgium’s position in the rankingof available estimates for the other member states does not change after correctionfor spurious openings.
Although spurious openings make up only a small share of total firm entries, theyrepresent a disproportionally large share of total employment created by apparentlynew employers. This is where the importance of the correction method becomesclear. Table 4 shows that annual job creation by new employers on the basis of unad-justed measures ranges from 54 000 to 68 000 jobs in the years under consideration.Between 35.6 per cent and 48.5 per cent of this apparent job creation is the result ofclustered employee flows moving from other employers. After correction, annualjob creation by new employers is reduced to a range of 35 000 to 36 500 jobs. Notonly is this a considerable decrease, the impact of the correction is also that the hugeannual differences in job creation by new employers are flattened to smooth fluctua-tions, which certainly is a more realistic picture of the contribution of firm openingsto employment in the period considered. The effect of correcting for spurious clos-ings on job destruction by exiting employers is similar. Total job destruction due toemployer closings is reduced by more than one third, and annual leaps are flattenedconsiderably. Persson (1998) and Korkeamäki & Kyyrä (2000), studying the impactof employee flow corrections on the basis of Swedish and Finnish data respectively,report equally high impacts of spurious openings and closings on estimates of jobcreation and destruction associated with firm births and deaths.
To allow a cross-country or cross-industry comparison of the (direct) contributionof births and deaths to employment, normalized rates of job creation and destruc-tion are used. These rates are calculated by dividing total employment in openingor closing employers by the average of total employment in all active employers inthe period concerned. The impact of correcting for spurious openings and closingson these indicators is shown in Table 4. After correction, job creation rates by em-ployer openings are reduced from 2.8 to 1.7 per cent on average, and job destructionrates associated with employer closings are reduced from 2.9 to 1.8 per cent. As isevident from Figure 2 in Annex, this adjustment considerably changes the position
22

Table 4: Unadjusted and adjusted estimates of job creation and destruction by open-ing and closing employer enterprises; Belgium, NACE Rev. 1.1 Sections C to K ,2003/04 - 2006/07
Job creation Job destructionby employer openings (n) by employer closings (n)
Unadjusted Adjusted Percentagedifference
Unadjusted Adjusted Percentagedifference
2003/04 62722 37383 40.42004/05 58241 36522 37.3 60288 39823 33.92005/06 54451 35054 35.6 56336 35339 37.32006/07 68044 35076 48.5
3-year avg. 40.5 37.2Job creation rate Job destruction rateby openings (%) by closings (%)
Unadjusted Adjusted Unadjusted Adjusted2003/04 3.0 1.82004/05 2.8 1.7 2.9 1.92005/06 2.6 1.7 2.7 1.72006/07 3.2 1.6
3-year avg. 2.8 1.7 2.9 1.8
Source: NSSO - HIVA K.U.Leuven
of Belgium in an international comparison of employment creation by newly bornfirms.
7.2 Job creation and destruction
Finally, we turn to measures of job creation and destruction. Table 5 compares un-adjusted and adjusted estimates. In the four years under consideration, on average14.5 per cent of apparent total job creation and 16.6 per cent of apparent total job de-struction is the result of clustered employee flows. A large part of this is accountedfor by spurious openings and closings of firms, as illustrated in the previous para-graphs. The other part is explained by existing firms taking over (parts of) otherfirms, in case of job creation; and by split-offs or mergers of parts of existing firms,in case of job destruction. Real job creation and destruction is not only lower than itappears from unadjusted data, annual fluctuations are also leveled off. It should bementioned that the slight differences between net employment evolutions before andafter adjustment are caused by employee flows between predecessors and successors
23
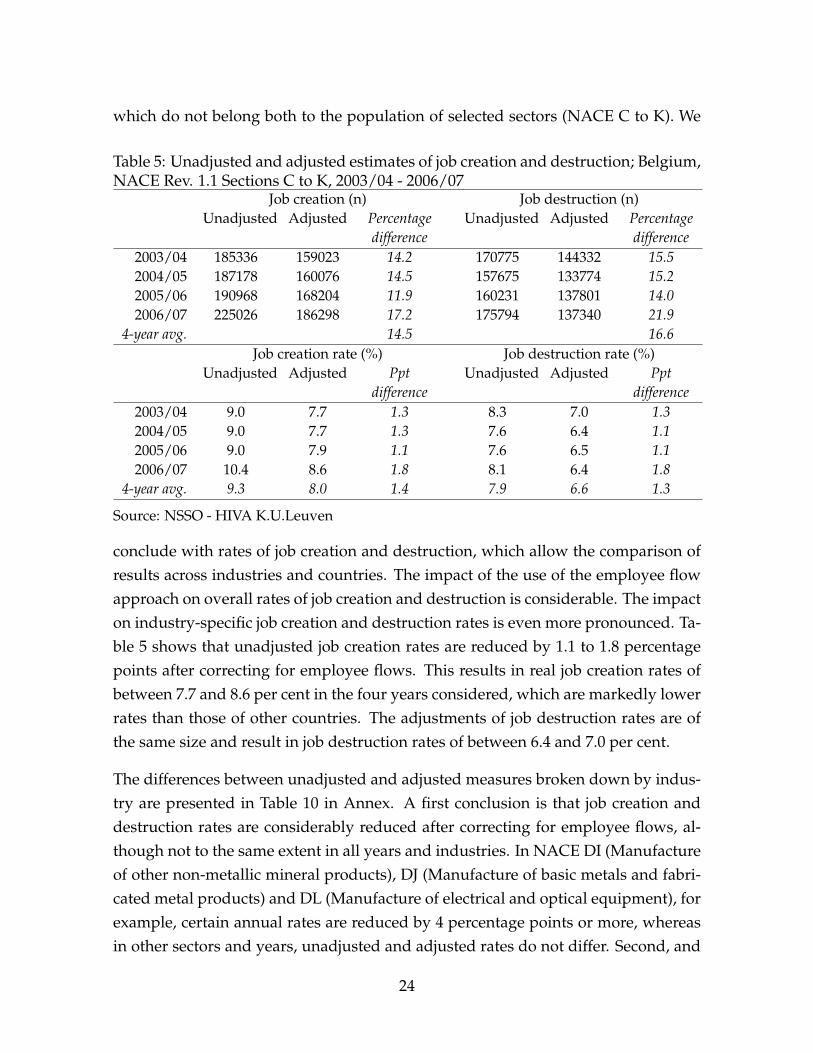
which do not belong both to the population of selected sectors (NACE C to K). We
Table 5: Unadjusted and adjusted estimates of job creation and destruction; Belgium,NACE Rev. 1.1 Sections C to K, 2003/04 - 2006/07
Job creation (n) Job destruction (n)Unadjusted Adjusted Percentage
differenceUnadjusted Adjusted Percentage
difference2003/04 185336 159023 14.2 170775 144332 15.52004/05 187178 160076 14.5 157675 133774 15.22005/06 190968 168204 11.9 160231 137801 14.02006/07 225026 186298 17.2 175794 137340 21.9
4-year avg. 14.5 16.6Job creation rate (%) Job destruction rate (%)
Unadjusted Adjusted Pptdifference
Unadjusted Adjusted Pptdifference
2003/04 9.0 7.7 1.3 8.3 7.0 1.32004/05 9.0 7.7 1.3 7.6 6.4 1.12005/06 9.0 7.9 1.1 7.6 6.5 1.12006/07 10.4 8.6 1.8 8.1 6.4 1.8
4-year avg. 9.3 8.0 1.4 7.9 6.6 1.3
Source: NSSO - HIVA K.U.Leuven
conclude with rates of job creation and destruction, which allow the comparison ofresults across industries and countries. The impact of the use of the employee flowapproach on overall rates of job creation and destruction is considerable. The impacton industry-specific job creation and destruction rates is even more pronounced. Ta-ble 5 shows that unadjusted job creation rates are reduced by 1.1 to 1.8 percentagepoints after correcting for employee flows. This results in real job creation rates ofbetween 7.7 and 8.6 per cent in the four years considered, which are markedly lowerrates than those of other countries. The adjustments of job destruction rates are ofthe same size and result in job destruction rates of between 6.4 and 7.0 per cent.
The differences between unadjusted and adjusted measures broken down by indus-try are presented in Table 10 in Annex. A first conclusion is that job creation anddestruction rates are considerably reduced after correcting for employee flows, al-though not to the same extent in all years and industries. In NACE DI (Manufactureof other non-metallic mineral products), DJ (Manufacture of basic metals and fabri-cated metal products) and DL (Manufacture of electrical and optical equipment), forexample, certain annual rates are reduced by 4 percentage points or more, whereasin other sectors and years, unadjusted and adjusted rates do not differ. Second, and
24

in line with the general trends discussed above, in most sectors, adjusted measuresshow less annual fluctuation in job creation and destruction. Where unadjusted mea-sures report puzzling annual leaps in industry-specific job creation or destructionrates, these are mostly substantially reduced after correcting for employee flows.A third and last conclusion is that ’traditional’ differences in job reallocation levelsacross industries remain unaffected by the correction method: industries with highjob reallocation rates, such as construction (NACE F), hotel and restaurant sector(NACE H) and business services (NACE K), remain the ones with the highest levelsafter adjustment, and the gap between relatively low job creation and destructionrates in manufacturing and relatively high rates in services exists both before andafter correction. In summary, we can conclude that the employee flow approach re-sults in overall lower levels of job creation and destruction mainly by eliminatingunreal annual leaps in specific sectors.
It is interesting to note how these adjustments affect the position of Belgium in an in-ternational comparison of job reallocation measures. Unlike statistics related to em-ployer openings and closings, an internationally harmonized framework for job cre-ation and destruction statistics does not exist. Although the calculation of the ratesproposed by Davis & Haltiwanger is generally adopted, definitions of the buildingcomponents (firm/establishment, employer, job) vary across countries. Moreover,the coverage of the population varies strongly as well, with regard to sectoral activityas well as to other aspects of the data. Nevertheless, when compared to other recentstudies which adopt similar definitions and coverage, the job flow rates we foundusing the proposed method, are markedly lower. Studies covering both manufactur-ing and services, usually report annual job creation and destruction rates above 10per cent, or in the U.S even above 15 per cent (see e.g. Persson, 1998; Piekkola andBöckerman, 2002; Pinkston and Spletzer, 2004). Even for a continental, ’rigid’ econ-omy as the one in Belgium, and in an economically favorable period, job creationand destruction rates of 8.0 and 6.6 per cent respectively are extremely low.
In a recent working paper on job flows in Belgium, based on another data source, theNational Bank of Belgium (NBB) reports job creation and destruction rates in the fouryears considered which are, on average, equally low (Heuse & Saks, 2009). Since nocorrection for changes in firm structure was made, one would expect these rates to behigher than the adjusted measures found in this paper. The NBB results, however,exclude temporary work agencies (NACE 74.5) and do not reach full coverage in
25
small firms. Exactly these two firm categories are characterized by typically high jobreallocation, hence excluding them lowers average rates. Despite similar averages,however, the variation in annual job creation and destruction rates reported in thispaper is much smaller than the annual variation reported by the NBB. This is in linewith our conclusion that correcting for employee flows reduces annual fluctuations.
Four explanations can account for the low job creation and destruction rates for Bel-gium reported in this paper. First, the Belgian economy has a rather rigid labourmarket where employment protection legislation prevents employers from causingstrong cyclical adjustments in the workforce (Heuse & Saks, 2009). Second, the pe-riod the data in this paper relate to was a short and economically stable one. Third,the firm level was used for analysis, and not the establishment level, as is the casein most other studies on job flows. This implies that our data do not account forjob reallocation taking place across establishments of the same firm. And finally, byadopting the employee flow approach, 15 per cent of apparent job flows could betraced as not corresponding to the real creation or destruction of jobs. Hence, annualjob creation and destrcution rates had to be revised downwards by 1.4 percentagepoints on average.
8 Discussion
The presented method for the adjustment of measures of firm dynamics and of jobcreation and destruction does not take into account changes in firm structure and infirm identifiers involving employee flows of less than 10 employees. This means thatit does not provide a criterion to distinguish between genuine and spurious open-ings and closings, and real and false job creation and destruction in small firms. Thereason why a lower cut-off level for the tracking of clustered employee flows is notused, is because we believe that flows of less than 10 employees possibly includenumerous cases of individual mobility of employees simply changing jobs. There-fore, in the case of small firms, the merely quantitative criteria of the employee flowapproach should be complemented by a more qualitative approach based on addi-tional information from other data sets. A possible way of proceeding could be toreplicate the proposed method for clustered employee flows of less than 10 employ-ees, and then randomly check the predecessor-successor relationships on the basis
26

of other administrative registers. The results of this sample can then be extrapolatedto the total population.
9 Conclusion
Overestimation in measures of firm dynamics and hence job creation and destructionbased on large administrative firm level data sets is well understood. The failure toproperly link the identifiers of one and the same employer, and of predecessor andsuccessor firms involved in a restructuring, results in an upward bias in statistics offirm dynamics and job reallocation. Commonly applied methods to address theseproblems use probabilistic matching based on similarities in partial firm identifiers.More recently, alternative linkage methods based on employee flows have been de-veloped in the Scandinavian countries and the U.S. In keeping with this novel ap-proach, this paper presents a method for the establishment of linkages between firmidentifiers by using employee flow information. The lack of reliable firm level dataon employment and business dynamics in Belgium has urged the development ofa new approach. Taking advantage of the possibilities of a rich employer-employeedata set covering all private employment in Belgium, the method was developed onthe basis of a limited number of years (2003-2007). After evaluation, it is the inten-tion to extend the analysis to a longer period, starting at the end of the 1990s, and toimplement it as a standardized method, allowing annual updates of the results. Thisshould lead to the establishment of a longitudinal linked employer-employee dataset in Belgium, containing accurate information on firm and employment dynamics,and opening a range of possibilities in national and comparative research into labourmarket changes.
The method presented in this paper takes into account all movements of clusters ofat least 10 employees between two firm identifiers to establish links between pre-decessor and successor firms. These links are interpreted as different forms of firmrestructuring, of which ten types are distinguished. Additional criteria are then im-posed in order to identify spurious firm openings and closings, such as thresholdsfor the employment level in the opening or closing year. This information is furtherused to adjust measures of firm dynamics and job creation and destruction.
The first conclusion is that restoring missing links between firms by making use of
27

clustered employee flows leads to a significant reduction of the upward bias in statis-tics of firm dynamics and of job reallocation. In the period of observation, we findthat 35 to 50 per cent of total entries and exits of employer firms with at least 10employees does not coincide with the real opening or closing of a firm. Not surpris-ingly, as the size of the entering of exiting firm increases, it becomes more likely thatan entering or exiting does not correspond to a real opening or closing. After cor-recting for these ’spurious’ events, the real contribution of firm births and deaths toannual job creation and destruction turns out to be considerably lower than is gener-ally concluded on the basis of unadjusted data. Overall job creation and destructionlevels are revised downwards as well after adjustment (by 14.5 and 16.6 per cent).This results in markedly lower annual job creation rates of around 8.0 per cent in thefour years considered, and job destruction rates of around 6.6 per cent.
Secondly, the applied method reveals that annual variation in firm and employmentdynamics measures is substantially lower than it appears from unadjusted data. Un-adjusted data often report strong annual fluctuations, both in the number of firmopenings and closings and in job creation and destruction levels. After adjustment,these fluctuations are considerably flattened, revealing more regular annual patternsin firm and employment dynamics. This is particularly true at the sectoral level. Puz-zling annual leaps in industry-specific job creation or destruction rates are mostlysubstantially reduced after correcting for employee flows. This certainly yields amore realistic picture of employment changes in the considered period.
A third and last conclusion is that ’traditional’ average differences in job reallocationlevels across industries remain unaffected by the correction method. For example,the gap between typically high job creation and destruction rates in services com-pared to low rates in manufacturing, is not narrowed.
In summary, we can conclude that the employee flow approach results in overalllower levels of firm births and deaths and job creation and destruction, mainly byeliminating unreal annual leaps in specific sectors. The difference in results illus-trates the importance of correcting for spurious openings and closings when us-ing firm level data for macro- and micro-economic research. It shows that unad-justed data may have a considerable distorting impact on findings, especially whenindustry-specific patterns are considered.
28

References
[1] Abowd J.M., Corbel P. & Kramarz F. (1999), The entry and exit of workers and the
growth of employment: an analysis of French establishments, in The Review of Eco-
nomics and Statistics, 81:2, p. 170-187.
[2] Abowd J.M., Corbel P. & Kramarz F. (1999), The entry and exit of workers and the
growth of employment: an analysis of French establishments, in The Review of Eco-
nomics and Statistics, 81:2, p. 170-187.
[3] Abowd J.M. & Vilhuber L. (2005), The sensitivity of economic statistics to coding errors
in personal identifiers, in Journal of Business and Economic Statistics, 23:2, p. 133-152.
[4] Abowd J. M., Haltiwanger J. C. & Lane J. I. (2004), Integrated longitudinal employee-
employer data for the United States, The American Economic Review, 94:2, p. 224-229.
[5] Ahmad N. (2008), "A Proposed Framework for Business Demography Statistics", in
Measuring Entrepreneurship. Building a Statistical System (ed. Congregado E.), New
York: Springer.
[6] Albaek K. & Sorensen B.E. (1998), Worker flows and job flows in Danish manufacturing,
1980-91, in The Economic Journal, 108, p. 1750-1771.
[7] Baldwin J.R., Beckstead D. & Girard A. (2002), The importance of entry to Canadian
manufacturing with an appendix on measurement issues, Research Paper Statistics
Canada, Ottawa.
[8] Baldwin J., Dunne T. & Haltiwanger J. (1998), A comparison of job creation and job
destruction in Canada and and the United States, in The Review of Economics and
Statistics, 80:3, p. 347-356.
[9] Bartelsman E., Scarpetta S. & Schivardi F. (2005), Comparative analysis of firm demo-
graphics and survival: evidence from micro-level sources in OECD countries, in Indus-
trial and Corporate Change, 14:3, p. 365-391.
[10] Benedetto G., Haltiwanger J., Lane J. & McKinney K. (2007), Using Worker Flows to
Measure Firm Dynamics, in Journal of Business & Economic Statistics, Vol. 25, No. 3, p.
299-313.
[11] Birch, D.L. (1987), Job Creation in America: How Our Smallest Companies Put the Most
People to Work, New York.
29

[12] Blanchflower D. & Burgess S. (1996), Job creation and destruction in Great Britain in the
1980s, in Industrial and Labor Relations Review, 50:1, p. 17-38.
[13] Boeri T. (1996), Is Job Turnover Countercyclical?, in Journal of Labor Economics, 14:4.
[14] Brandt N. (2004), Business dynamics in Europe, OECD STI Working Paper 2004/1,
Paris.
[15] Brown C., Haltiwanger J., Lane J. (2006), Economic Turbulence: Is a Volatile Economy
Good for America?, Chicago: University of Chicago Press.
[16] Bycroft C. (2003), Record Linkage in LEED. An Overview, Statistics New Zealand,
Christchurch.
[17] Cahuc P. & Zylberberg A. (2006), The natural survival of work: job creation and job
destruction in a growing economy, Cambridge/London.
[18] Clayton R.L. & Spletzer J.R. (2008), Business employment dynamics, U.S. Bureau of
Labor Statistics.
[19] Davis S.J., Haltiwanger J.C. & Schuh S. (1997) , Job creation and destruction, Cam-
bridge/London.
[20] Davis S.J., Faberman R.J. & Haltiwanger J. (2005), The Flow Approach to Labor Mar-
kets: New Data Sources, Micro-Macro Links and the Recent Downturn, IZA Discussion
Paper No. 1639, Bonn.
[21] Eurostat / OECD (2007), Eurostat - OECD Manual on Business Demography Statistics,
Luxembourg.
[22] Eurostat (2003), Business register. Recommendations manual, Luxembourg.
[23] Faggio G. & Konings J. (2001), Job creation, job destruction and employment growth in
transition countries in the 90’s, IZA Discussion Paper No. 242, Bonn.
[24] Foster L., Haltiwanger J. & Krizan C.J. (2001), "Aggregate Productivity Growth: Lessons
from Microeconomic Evidence", in New Directions in Productivity Analysis (eds. Dean
E., Michael Harper M. & Hulten C.), Chicago: University of Chicago Press.
[25] Gómez-Salvador R., Messina J. & Vallanti G. (2004), Gross job flows and institutions in
Europe, Working Paper Series No. 318/March 2004, European Central Bank.
30
[26] Haltiwanger J.C., Scarpetta S. & Schweiger H. (2006), Assessing job flows across coun-
tries: the role of industry, firm size, and regulations, World Bank Policy Research Work-
ing Paper 4070.
[27] Heuse P. & Saks Y. (2009), Labour flows in Belgium, National Bank of Belgium, Working
Paper No. 162, Brussels.
[28] Korkeamäki O. & Kyyrä T. (2000), Integrated panel of Finnish companies and workers,
VATT Discussion Papers No. 226, Helsinki.
[29] Messina J. & Vallanti G. (2007), Job flow dynamics and firing restrictions: evidence from
Europe, in Economic Journal, 117-521
[30] Mikkelson G. & Unger L.I. (2006), Identifying and accounting for mergers and acquisi-
tions in measuring employment, Bureau of Labor Statistics, Washington.
[31] Persson H. (1999), "Job flows and worker flows in Sweden 1986-1995", in Essays on
Labour Demand and Career Mobility, Swedish Institute for Social Research, Stockholm.
[32] Piekkola H. & Böckerman P. (2002), On whom falls the burden of restructuring? Evi-
dence from Finland, The Research Institute of the Finnish Economy, Discussion Paper
No. 714, Helsinki.
[33] Pinkston J.C. & Spletzer J.R (2004), Annual measures of gross job gains and gross job
losses, in Monthly Labor Review, November 2004.
[34] Pinkston J.C. & Spletzer J.R. (2002), Annual measures of job creation and job destruction
created from quarterly ES-202 microdata, Bureau of Labor Statistics, Washington.
[35] Robertson K., Huff L., Mikkelson G., Pivetz T. & Winkler A. (1997), "Improvements in
Record Linkage Processes for the Bureau of Labor Statistics’ Business Establishment
List", in Record Linkage Techniques -1997. Proceedings of an International Workshop
and Exposition, March 20-21, 1997, Arlington, VA, National Research Council, p. 212-
221.
[36] Scarpetta S., Hemmings P., Tresselt T. & Woo J. (2002), The Role of Policy and Institu-
tions for Productivity and Firm Dynamics: Evidence from Micro and Industry Data,
OECD Economics Department Working Paper No. 329, Paris.
[37] Schrör H. (2008), Business demography in Europe: employers and job creation, Euro-
stat Statistics in focus 100/2008, Luxembourg.
31

[38] Spletzer J.R. (1998), The contribution of establishment births and deaths to employment
growth, BLS Working Paper 310, Washington.
[39] Stiglbauer A.M., Stahl F., Winter-Ebmer R & Zweimüller J (2002), Job creation and job
destruction in a regulated labor market: the case of Austria, IZA Discussion Paper No.
546, Bonn.
[40] Vartiainen (2005), Measuring interfirm mobility with an administrative dataset, Stock-
holm.
[41] Vale S. (2003), "The use of administrative sources", in Eurostat, Business register. Rec-
ommendations Manual, Luxembourg.
[42] Vilhuber L. (2009), "Adjusting imperfect data: overview and case studies", in The struc-
ture of wages: An international comparison (eds. Lazear E.P. & Shaw K.L.), Chicago:
University of Chicago Press.
A Appendix
Figure 1: Comparison of employer enterprise birth rates, business economy (NACERev. 1.1 Sections C to K excluding 74.15); 2004/05
0
2
4
6
8
10
12
14
16
18
Roman
ia
Slova
kia
Eston
ia
Lith
uani
a
Spain
Denm
ark
Czech
Rep
ublic
Luxe
mbo
urg
Hunga
ry
Bulga
ria
Latv
ia
Finlan
d
Nethe
rland
s
> Belg
ium u
nadjus
ted
> Belg
ium a
djuste
dIta
ly
Austri
a
%
Source: Eurostat (SBS, Business demography); for Belgium NSSO - HIVA K.U.Leuven
32

Figure 2: Share of employment in newly born enterprises, business economy (NACERev. 1.1 Sections C to K excluding 74.15); 2005
0
1
2
3
4
5
6
7
Slova
kiaSpa
in
Denm
ark
Roman
ia
Czech
Rep
ublic
Hunga
ry
Finlan
d
Latv
ia
Lith
uani
a
Bulga
ria
Eston
iaIta
ly
> Belg
ium u
nadjus
ted
Austri
a
Luxe
mbo
urg
Nethe
rland
s
> Belg
ium a
djuste
d
%
Source: Eurostat (SBS, Business demography); for Belgium NSSO - HIVA K.U.Leuven
33

Table 6: Categories of employer-employee links in two consecutive quarters. Bel-gium, quarters 2003/2 - 2008/1
Li
nks
not c
ontin
ued
in q
N
ew li
nk in
q
Link
s no
t con
tinue
d in
q
New
link
in q
Qua
rter
q-1
Tot
al
empl
oyer
-em
ploy
ee
links
in q
-1
Link
s co
ntin
ued
in q
Em
ploy
ee
tran
sitio
n to
oth
er
empl
oyer
Em
ploy
ee
outfl
ow
from
the
popu
latio
n
Em
ploy
ee
tran
sitio
n fr
om o
ther
em
ploy
er
Em
ploy
ee
inflo
w in
to
the
popu
latio
n
Tot
al
empl
oyer
-em
ploy
ee
links
in q
-1
Link
s co
ntin
ued
in q
Em
ploy
ee
tran
sitio
n to
oth
er
empl
oyer
Em
ploy
ee
outf
low
fr
om th
e po
pula
tion
Em
ploy
ee
tran
sitio
n fr
om o
ther
em
ploy
er
Em
ploy
ee
inflo
w in
to
the
popu
latio
n
2003
/q2
3197
948
2928
493
9772
0 17
1735
10
0%
91.6
%
3.1%
5.
4%
2003
/q3
3184
043
2934
811
9312
9 15
6103
93
048
1544
06
100%
92
.2%
2.
9%
4.9%
2.
9%
4.8%
20
03/q
4 31
8068
7 29
2893
2 11
3077
13
8678
88
023
1547
85
100%
92
.1%
3.
6%
4.4%
2.
8%
4.9%
20
04/q
1 32
0713
2 29
9078
8 93
082
1232
62
1096
14
1626
35
100%
93
.3%
2.
9%
3.8%
3.
4%
5.1%
20
04/q
2 32
2982
8 29
6020
0 10
6696
16
2932
90
122
1447
42
100%
91
.7%
3.
3%
5.0%
2.
8%
4.5%
20
04/q
3 32
2585
3 29
7998
2 92
273
1535
98
1018
78
1634
82
100%
92
.4%
2.
9%
4.8%
3.
2%
5.1%
20
04/q
4 32
2966
6 28
9944
3 19
7557
13
2666
86
886
1622
70
100%
89
.8%
6.
1%
4.1%
2.
7%
5.0%
20
05/q
1 32
5534
5 30
3055
5 95
848
1289
42
1910
08
1619
37
100%
93
.1%
2.
9%
4.0%
5.
9%
5.0%
20
05/q
2 32
7482
0 30
0249
6 10
6543
16
5781
93
088
1505
37
100%
91
.7%
3.
3%
5.1%
2.
8%
4.6%
20
05/q
3 32
6977
7 30
1844
1 94
458
1568
78
1017
03
1652
91
100%
92
.3%
2.
9%
4.8%
3.
1%
5.1%
20
05/q
4 32
5286
2 30
0514
0 12
0485
12
7237
88
997
1452
15
100%
92
.4%
3.
7%
3.9%
2.
7%
4.5%
20
06/q
1 32
9300
2 30
5936
2 10
8741
12
4899
11
7081
17
0024
10
0%
92.9
%
3.3%
3.
8%
3.6%
5.
2%
2006
/q2
3311
646
3031
915
1208
65
1588
66
1042
07
1468
35
100%
91
.6%
3.
6%
4.8%
3.
1%
4.4%
20
06/q
3 33
2706
6 30
5577
3 11
2613
15
8680
11
6083
17
8798
10
0%
91.8
%
3.4%
4.
8%
3.5%
5.
4%
2006
/q4
3314
527
3041
492
1316
91
1413
44
1069
08
1506
19
100%
91
.8%
4.
0%
4.3%
3.
2%
4.5%
20
07/q
1 33
5742
7 30
9795
7 12
0164
13
9306
12
8154
17
7609
10
0%
92.3
%
3.6%
4.
1%
3.8%
5.
3%
2007
/q2
3365
871
3086
854
1208
13
1582
04
1170
21
1502
93
100%
91
.7%
3.
6%
4.7%
3.
5%
4.5%
20
07/q
3 33
9290
8 31
2738
5 10
8212
15
7311
11
6433
18
8925
10
0%
92.2
%
3.2%
4.
6%
3.4%
5.
6%
2007
/q4
3394
801
3124
728
1353
03
1347
70
1034
57
1633
19
100%
92
.0%
4.
0%
4.0%
3.
0%
4.8%
20
08/q
1 34
2777
0 31
7987
9 11
4205
13
3686
13
1785
17
0610
10
0%
92.8
%
3.3%
3.
9%
3.8%
5.
0%
Ave
rage
10
0%
92.1
%
3.5%
4.
5%
3.3%
4.
9%
Source: NSSO
34

Table 7: Ten types of predecessor-successor relationships: relative frequencies in theannual predecessor-successor data sets; Belgium, 2003/04 - 2006/07
Successor categories
1 to 1 1 entry 1 contin.
1 exit 2003/04 38.2 23.9
2004/05 43.4 22.3
2005/06 47.2 20.7
2006/07 46.1 19.5
Average 43.7 21.6
1 continuation 2003/04 15.9
2004/05 17.0
2005/06 17.8
2006/07 19.7
Average 17.6
n to 1 1 entry 1 contin.
n exits 2003/04 2.4 5.8
2004/05 1.8 3.5
2005/06 1.4 5.9
2006/07 2.7 4.3
Average 2.1 4.9
min 1 continues 2003/04 1.6
2004/05 1.3
2005/06 1.1
2006/07 1.7
Average 1.4
1 to n n entries min 1 cont.
1 exit 2003/04 4.2 1.1
2004/05 1.5 5.2
2005/06 1.6 0.9
2006/07 0.9 0.4
Average 2.0 1.9
1 continuation 2003/04 4.7
2004/05 1.3
2005/06 1.0
2006/07 2.9
Average 2.5
n to n 2003/04 0.7
2004/05 1.0
2005/06 0.7
2006/07 0.0
Average 0.6
Pre
dece
ssor
cat
egor
ies
Unclear 2003/04 1.5
2004/05 1.6
2005/06 1.6
2006/07 1.8
Average 1.6
Total 2003/04 100.0
2004/05 100.0
2005/06 100.0
2006/07 100.0
Average 100.0
Source: NSSO - HIVA K.U.Leuven35
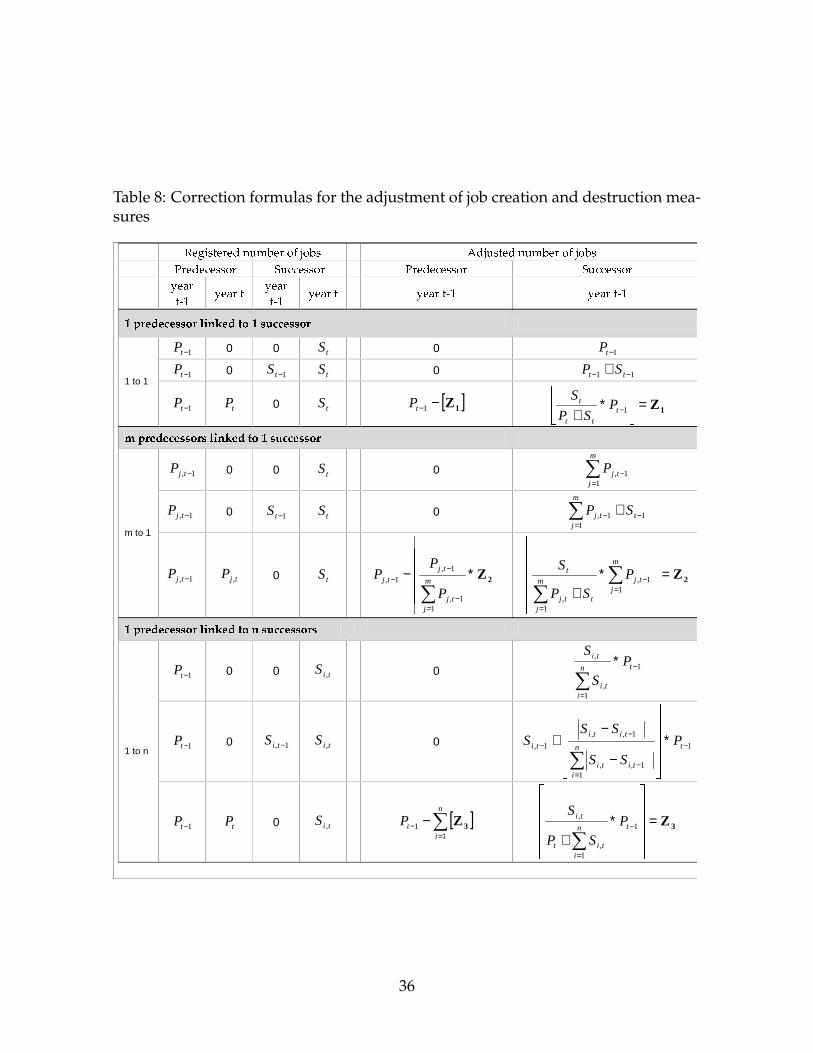
Table 8: Correction formulas for the adjustment of job creation and destruction mea-sures � ������������ �������� �� � ��������� �������� ��� ����������� ���������� � ����������� ����������� ���������� ������� ���������� ������� � ��������� ������������������������ ���������������
1−tP 0 0 tS 0 1−tP
1−tP 0 1−tS tS 0 11 −− + tt SP 1 to 1
1−tP tP 0 tS [ ]1Z−−1tP 1Z= ∗
+ −1ttt
t PSP
S ���������������� ����������������
1, −tjP 0 0 tS 0 ∑=
−
m
jtjP
11,
1, −tjP 0 1−tS tS 0 ∑=
−− +m
jttj SP
111,
m to 1
1, −tjP tjP , 0 tS ∗−∑
=−
−− 2Z
m
jtj
tjtj
P
PP
11,
1,1, 2Z= ∗
+∑
∑ =−
=
m
jtj
t
m
jtj
t PSP
S
11,
1,
��������������� �����������������
1−tP 0 0 tiS , 0 1
1,
,−
=
∗∑
tn
iti
ti PS
S
1−tP 0 1, −tiS tiS , 0 1
11,,
1,,
1, −
=−
−− ∗ −
−+∑
tn
ititi
titi
ti PSS
SSS
1 to n
1−tP tP 0 tiS , [ ]∑=
− −n
itP
11 3Z 3Z= ∗
+−
=∑
1
1,
,tn
itit
ti PSP
S
36

Table 9: Unadjusted and adjusted job creation and destruction rate by sector; Bel-gium, NACE Rev. 1.1 Sections C to K, 2003/04 - 2006/07
Job creation rate Job destruction rate
2003/04 2004/05 2005/06 2006/07 2003/04 2004/05 2005/06 2006/07 NACE Section % % % % % % % %
C Unadjusted 6.5 3.7 5.0 3.3 -7.9 -4.7 -5.0 -4.1 C Adjusted 3.4 3.7 2.9 3.3 -4.8 -4.7 -3.5 -3.4
DA Unadjusted 6.8 7.2 6.3 5.8 -6.8 -7.3 -6.2 -5.6 DA Adjusted 5.8 6.3 5.1 5.5 -5.8 -6.4 -5.2 -5.0
DB-DC Unadjusted 2.9 3.5 4.6 5.5 -8.7 -10.2 -10.8 -10.1 DB-DC Adjusted 2.2 2.9 2.7 3.6 -8.0 -9.5 -9.0 -8.3
DD Unadjusted 7.9 10.2 6.1 6.1 -8.1 -9.5 -5.9 -6.4 DD Adjusted 6.9 6.3 5.8 5.8 -6.5 -5.5 -5.8 -5.6
DE Unadjusted 4.8 4.5 6.1 5.6 -6.8 -6.2 -7.6 -7.7 DE Adjusted 4.2 4.1 4.7 4.3 -5.9 -6.0 -6.2 -6.4
DF-DG Unadjusted 5.9 5.2 4.4 7.2 -7.8 -5.6 -3.5 -6.6 DF-DG Adjusted 2.2 2.9 3.2 6.0 -4.1 -3.5 -2.9 -5.3
DH Unadjusted 7.2 4.7 6.2 5.5 -10.5 -5.3 -8.4 -3.9 DH Adjusted 3.7 3.2 3.4 4.8 -5.7 -4.5 -4.7 -3.5
DI Unadjusted 4.4 8.3 5.0 7.1 -6.8 -9.6 -5.9 -5.1 DI Adjusted 3.8 4.3 4.7 3.8 -6.4 -5.5 -5.6 -3.9
DJ Unadjusted 5.1 9.7 8.2 10.5 -8.6 -6.7 -9.2 -9.8 DJ Adjusted 4.4 7.9 6.8 5.8 -7.4 -5.1 -7.8 -5.0
DK Unadjusted 5.7 5.8 5.4 7.7 -6.6 -6.0 -3.9 -3.0 DK Adjusted 4.9 4.6 4.9 6.9 -5.8 -4.1 -3.3 -2.4
DL Unadjusted 11.2 4.6 3.2 8.5 -14.8 -9.2 -5.8 -11.9 DL Adjusted 1.9 3.5 2.6 5.5 -8.8 -8.2 -5.6 -6.7
DM Unadjusted 6.0 3.7 3.8 4.0 -9.4 -3.9 -4.3 -9.8 DM Adjusted 5.8 3.6 3.4 3.2 -9.0 -3.9 -3.9 -10.0
DN Unadjusted 6.9 5.8 7.4 8.7 -9.9 -10.0 -10.6 -12.9 DN Adjusted 5.8 5.1 5.3 6.2 -9.2 -9.3 -7.7 -7.6
E Unadjusted 1.7 1.8 5.5 10.4 -7.2 -2.8 -0.4 -5.7 E Adjusted 1.7 1.8 5.4 7.4 -7.2 -2.8 -0.3 -2.7
F Unadjusted 10.8 11.8 13.7 12.8 -10.8 -10.4 -9.2 -9.4 F Adjusted 10.0 10.9 12.8 12.1 -9.5 -9.4 -8.3 -8.7
G Unadjusted 10.0 8.8 8.9 10.6 -8.3 -7.2 -7.7 -7.6 G Adjusted 8.7 8.1 8.1 8.9 -7.0 -6.4 -6.9 -6.2
H Unadjusted 21.0 21.4 15.6 16.4 -17.6 -16.2 -16.4 -15.1 H Adjusted 18.4 18.5 14.7 15.4 -14.9 -13.2 -15.5 -14.1
I Unadjusted 6.0 5.7 5.6 7.5 -5.5 -6.4 -5.2 -7.0 I Adjusted 5.6 5.0 4.9 6.0 -5.0 -5.8 -4.6 -5.4
J Unadjusted 3.7 3.4 3.9 5.6 -5.8 -4.6 -4.1 -4.9 J Adjusted 3.3 2.8 2.9 4.2 -5.4 -3.4 -3.1 -3.2
K* Unadjusted 12.5 14.4 16.2 16.9 -9.2 -9.1 -9.4 -10.1 K* Adjusted 10.9 12.5 13.9 13.3 -7.8 -7.9 -7.3 -6.7
74.502 Unadjusted 12.2 10.9 8.8 12.7 -1.6 -3.6 -6.7 -4.7 74.502 Adjusted 12.2 7.4 8.5 11.7 -1.6 -2.1 -6.4 -3.6
74.15 Unadjusted 18.2 11.4 17.0 10.6 -14.6 -8.5 -13.2 -17.7 74.15 Adjusted 15.8 11.0 15.4 9.5 -13.2 -6.4 -6.9 -13.6
Total Unadjusted 9.0 9.0 9.0 10.4 -8.3 -7.6 -7.6 -8.1 Total Adjusted 7.7 7.7 7.9 8.6 -7.0 -6.4 -6.5 -6.4
Source: NSSO - HIVA K.U.Leuven
37