
Employee cost-sharing and the welfare effects of flexible spending accounts
37
EMPLOYEE COST-SHARING AND THE WELFARE EFFECTS OF FLEXIBLE SPENDING ACCOUNTS William Jack Arik Levinson Sjamsu Rahardja Working Paper 11315
-
Upload
independent -
Category
Documents
-
view
6 -
download
0
Transcript of Employee cost-sharing and the welfare effects of flexible spending accounts

EMPLOYEE COST-SHARING AND THEWELFARE EFFECTS OF FLEXIBLE SPENDING ACCOUNTS
William JackArik Levinson
Sjamsu Rahardja
Working Paper 11315
NBER WORKING PAPER SERIES
EMPLOYEE COST-SHARING AND THEWELFARE EFFECTS OF FLEXIBLE SPENDING ACCOUNTS
William JackArik Levinson
Sjamsu Rahardja
Working Paper 11315http://www.nber.org/papers/w11315
NATIONAL BUREAU OF ECONOMIC RESEARCH1050 Massachusetts Avenue
Cambridge, MA 02138May 2005
We thank Luca Anderlini, Phil Cross, Nada Eissa, Randy Ellis, Luca Flabbi and Sherry Glied for discussionsand comments. The views expressed herein are those of the author(s) and do not necessarily reflect the viewsof the National Bureau of Economic Research.
©2005 by William Jack, Arik Levinson, Sjamsu Rahardja. All rights reserved. Short sections of text, notto exceed two paragraphs, may be quoted without explicit permission provided that full credit, including ©notice, is given to the source.
Employee Cost-Charing and the Welfare Effects of Flexible Spending AccountsWilliam Jack, Arik Levinson, Sjamsu RahardjaNBER Working Paper No. 11315May 2005JEL No. D60, H21, I18
ABSTRACT
Flexible Spending Accounts (FSAs) subsidize out-of-pocket health expenses not covered by
employer-provided health insurance, making health care cheaper ex post, but also reducing the
incentive to insure. We use a cross section of .rm-level data to show that FSAs are indeed associated
with reduced insurance coverage, and to evaluate the welfare consequences of this shift. Correcting
for selection effects we find that FSAs are associated with insurance contracts that have coinsurance
rates about 7 percentage points higher, relative to a sample average coinsurance rate of 17 percent.
Meanwhile, coinsurance rates net of the subsidy are approximately unchanged, providing evidence
that FSAs are welfare-neutral. These results show that FSAs may explain a significant fraction of
the shift in health care costs to employees that has occurred in recent years.
William JackDepartment of EconomicsGeorgetown UniversityWashington, DC [email protected]
Arik LevinsonDepartment of EconomicsGeorgetown UniversityWashington, DC 20057and [email protected]
Sjamsu RahardjaThe World Bank1818 H St., NWWashington, DC [email protected]
December 15, 2005
Employee cost-sharing and the welfare e¤ects of Flexible
Spending Accounts�
Abstract
Flexible Spending Accounts (FSAs) subsidize out-of-pocket health expenses not covered by employer-provided health insurance, making health care cheaper ex post, but also reducing the incentive toinsure. We use a cross section of �rm-level data to show that FSAs are indeed associated withreduced insurance coverage, and to evaluate the welfare consequences of this shift. Correcting forselection e¤ects we �nd that FSAs are associated with insurance contracts that have coinsurancerates about 7 percentage points higher, relative to a sample average coinsurance rate of 17 percent.Meanwhile, coinsurance rates net of the subsidy are approximately unchanged, providing evidencethat FSAs are welfare-neutral. These results show that FSAs may explain a signi�cant fraction ofthe shift in health care costs to employees that has occurred in recent years.
Keywords: Health expenditure subsidies, moral hazard, Flexible Spending AccountsJEL Codes: D60, H21, I18
William JackGeorgetown University
Arik LevinsonGeorgetown University
Sjamsu RahardjaWorld Bank
�Jack: [email protected], Levinson: [email protected], Rahardja: [email protected]. Wethank Luca Anderlini, Phil Cross, Nada Eissa, Randy Ellis, Luca Flabbi and Sherry Glied for discussionsand comments.
1 Introduction
For half a century, health insurance premiums paid by employers on behalf of their employees
have been exempt from income taxation in the US. Analysts have long argued that this
tax exemption amounts to an unbalanced subsidy for health care: insurance premiums are
paid with pre-tax dollars, while out-of-pocket expenses must be paid with after-tax income.
The imbalance tilts insurance towards larger premiums and smaller out-of-pocket expenses,
resulting excessive coverage and ine¢ cient overuse of medical care (Pauly 1986, Feldstein
1973).
Recently, two proposals have arisen that would balance the tax treatment of premiums
and out-of-pocket health expenses. In November 2005, the President�s Advisory Panel on
Federal Tax Reform proposed capping the amount of health insurance that can be purchased
with pre-tax dollars at the average premium (currently $5,000 for an individual and $11,500
for a family). This would mean that the marginal health insurance purchase for most individ-
uals would trade o¤ after-tax insurance premiums against after-tax out-of-pocket expenses.
At the same time, others have proposed "full deductibility" of all medical expenses (Hubbard
et al. 2004; Cogan et al. 2005). This would mean that marginal health purchases would
trade pre-tax premiums against pre-tax out-of-pocket costs.
In this paper we examine Flexible Spending Accounts (FSAs), a 1978 policy under which
some employers have allowed employees to set aside pre-tax income to pay out-of-pocket
expenses. These accounts are, we believe, a good source of variation in the tax treatment
of health expenses, and can be used to study two broader implications of full deductibility.
1
First, we ask whether deductibility reduces the incentive to insure, increasing the premiums
for health insurance o¤ered by employers with FSAs. Second, we examine whether FSAs, by
subsidizing out-of-pocket costs, reduce the ine¢ ciency associated with subsidizing premiums
in the �rst place.
In addition, while we do not have time-series data on FSA use and out-of-pocket costs,
our study may shed light on recent increases in the employee share of health costs. Fifteen
percent of large �rms surveyed in 2003 intended to increase employees�coinsurance rates,
and 20 percent expected to increase out-of-pocket payments for prescription drugs. Between
2001 and 2004 coinsurance rates for prescription drugs rose from 18 to 20 percent for generics,
21 to 26 percent for preferred drugs (i.e., those included on a formulary list), and from 24 to
31 percent for non-preferred drugs (Kaiser Family Foundation and HRET, 2004, page 116).
These trends may be partly explained by the growing number of �rms o¤ering FSAs, and
by the growing use of the accounts by employees. If out-of-pocket costs are tax subsidized
via FSAs, employees may be better o¤ trading less-generous insurance for some other form
of compensation.
Employees bear insurance costs either by sharing (nominally) in the payment of premi-
ums,1 or by being exposed to out-of-pocket costs when they use medical services, and the
examples above indicate that changes are occurring on both margins. Some attention has
been given in the literature to the increase in the �rst component (the share of premiums),
1 In principle, under certain circumstances the whole premium may be borne by the employee in theform of lower wages (Gruber, 1994), but employee heterogeneity could complicate the economic incidencesomewhat.
2
focusing on changes in tax rates, demographic trends, and eligibility for public insurance
such as Medicaid (Gruber and McKnight, 2003). In this paper, we focus on the second
component - out-of-pocket costs borne by employees.
Employer-provided health insurance was �rst subsidized through the tax system under
Section 106 of the 1954 Internal Revenue Service Act. The act exempts health insurance
premiums paid by the employer from the employee�s taxable income. As purchases of health
insurance are e¤ectively subsidized at the employee�s marginal income tax rate, it is widely
believed (e.g., Pauly, 1986) that the subsidy induces individuals to buy insurance through
their employers, and to buy more generous insurance than they otherwise would.2
In 1978, Section 125 of the Internal Revenue Code extended the tax exemption for health
insurance. Premium payments nominally made by an employee are now excludable from
taxable income, so that the full premium receives a subsidy at the employee�s marginal tax
rate, independent of whether it is paid by the employer or employee.
Section 125 was not, however, limited to premium payments: other out-of-pocket health
expenditures were made excludable from taxable income. Individuals who are o¤ered access
to so-called Flexible Spending Accounts (FSAs) can make annual contributions from pre-tax
income. These tax-free funds can be used to o¤set quali�ed medical expenses, including
deductibles, copayments, and coinsurance obligations that are part of an insurance policy,
or simply to pay for other uninsured medical expenses.3
2 It is useful to distinguish between changes in generosity on the extensive and intensive margins - plangenerosity falls if certain services (mental health, maternity, etc.) are removed from coverage, or if the shareof costs of services covered by the plan falls.
3 Any unused funds in the FSA are forfeited at the end of the year, inducing individuals �rst to be
3
Since their introduction in 1978, the use of FSAs has been growing. According to the
1993 Robert Wood Johnson Employer-Provided Health Insurance survey, about 22 percent
of employers administered FSAs in 1993. The Kaiser Family Foundation reports the share of
employers o¤ering FSAs in 2003 by �rm size, and �nds rates of 83 percent for very large �rms
(up from 69 percent in 1999), 76 percent for large �rms, 57 percent for midsize �rms, and 14
percent for small �rms. Government spending due to FSAs is signi�cant. Tax expenditures
for cafeteria plans, to which contributions for both medical care and dependent care expenses
can be made, amounted to an estimated $17 billion in 2004 (Joint Committee on Taxation,
2003).
Few studies have investigated the e¤ects of FSAs on employer-provided health insurance.
Levy (1998) shows that a �rm is more likely to o¤er an FSA if it employs more workers with a
high demand for insurance. She also �nds that for �rms that o¤er FSAs, employee premium
contributions increase with the marginal tax rate. Cardon and Showalter (2001) examine
the determinants of employee participation in an FSA program. Their �ndings suggest that
participation increases with income and to a certain extent the foreknowledge of medical
expenditures. Dowd, et al. (2001) study the e¤ects of Section 125, but focus on the subsidy
to employee-paid premiums, instead of the subsidy to out-of-pocket expenses. They �nd
that the employee-paid premium subsidy, like the exclusion of employer-paid premiums,
distorts employees�insurance decisions.
realistic when making initial FSA allocations, and second to accelerate expenditures near the end of theyear if by then health expenses have turned out to be smaller than expected. (Recent changes allow unusedFSA contributions to be rolled over for a 2 12 month grace period in the subsequent year.) Despite thesenon-linearities in the subsidy regime, in most of this paper we treat the deduction of out-of-pocket expensesas open-ended.
4
Two studies have suggested explanations for the rise in employee contributions to employer-
provided health insurance, though neither focuses on FSAs. Gruber and McKnight (2003)
�nd that falling marginal income tax rates, rising HMO penetration, increasing Medicaid
eligibility, and rising health care costs explain more than half of the run-up in employee
contributions. Dranove et al. (2000) show that the rise in two-income households explains
part of the shift, as employers try to induce their employees to rely on their spouses�em-
ployers�bene�ts. Our study is the �rst to look at FSAs as a potential cause of the rise in
out-of-pocket health care costs.
Identifying the e¤ect of FSAs on health insurance choices is important for two reasons.
First, it improves our understanding of trends in coverage rates over time and the likely
e¤ects of proposed tax policy changes (i.e., full deductibility) on insurance coverage. The
second reason is more normative. If, by subsidizing out-of-pocket expenditures, FSAs
induce further over-consumption of medical care, then FSAs will exacerbate the distortion
associated with the existing subsidy to premiums. But FSAs could lead individuals to
purchase plans with higher nominal coinsurance rates. If the plan characteristics respond
enough to the subsidy, then e¤ective (i.e., net-of-subsidy) coinsurance rates could increase.
If this FSA e¤ect increases net coinsurance rates, it can partially correct the distortion
introduced by the premium subsidy. Even though individuals would face higher out-of-
pocket expenses, they would be better o¤. This theoretical possibility was �rst identi�ed
by Jack and Sheiner (1997), and is investigated empirically here.
We estimate the e¤ect of an employer o¤ering an FSA on the coinsurance rate associated
5
with the employer�s health plans. In the process we use IV techniques to account for selection
e¤ects. (More generous employers are likely to both provide "better" insurance, including
lower coinsurance rates, and to o¤er FSAs.) Our estimates suggest that FSAs increase the
coinsurance rate for the average health care plan by 7.3 percentage points. This is large,
since the average coinsurance rate for the sample of all �rms is about 17 percent. Not only is
the nominal coinsurance rate higher in the presence of FSAs, but it is su¢ ciently higher that
the e¤ective (net-of-subsidy) coinsurance rate is approximately unchanged. This suggests
that FSAs are welfare-neutral, due to the presence of the pre-existing premium subsidy.
2 Insurance choice in the presence of FSAs
In this section we use the model of Jack and Sheiner (1997) to motivate and guide our
empirical research. We start by recalling that a fully e¢ cient insurance policy equalizes an
individual�s expected marginal utility of income across uncertain states of nature. Ideally,
the implied redistribution across states would be e¤ected via lump-sum state-contingent
transfers. In practice income is transferred to states of high health needs (bad states) by
paying for incurred costs. Because this can lead to over-consumption of care (i.e., moral
hazard), insured individuals are often required to share some of the costs of care, even in
bad states (Pauly, 1968). Such cost sharing exposes individuals to some risk, but reduces
the costs associated with moral hazard.
Jack and Sheiner analyze this trade-o¤ in a simple model in which insurance contracts
are characterized by a premium and a coinsurance rate - the latter being the proportion of
6
incurred medical costs that must be paid out-of-pocket by an individual. A simple way to
model uncertain health is to assume that the cost or price of improving health is uncertain,
and is represented by a parameter � 2 [�0; �1]. Thus, if H is an individual�s level of health
and C is his consumption of other goods, then his expenditure is C + �H. To attain the
same level of health, an individual with worse health status i.e., higher �, must spend more,
�H, on medical care.4
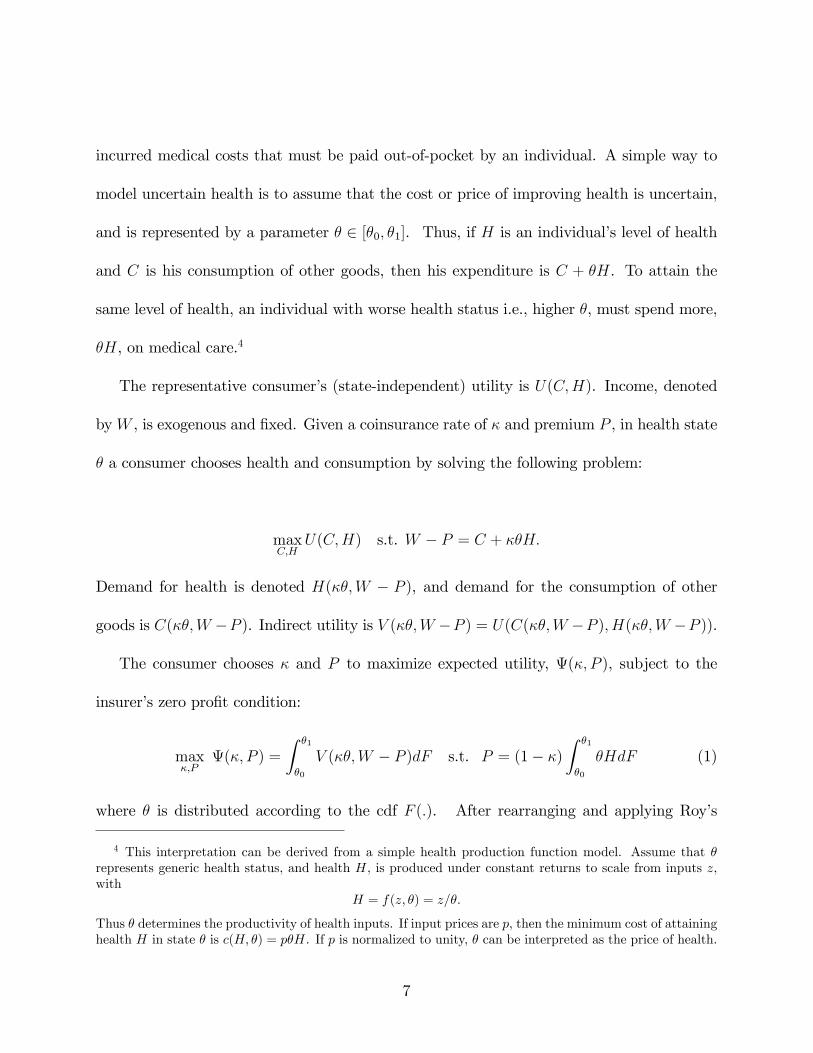
The representative consumer�s (state-independent) utility is U(C;H). Income, denoted
byW , is exogenous and �xed. Given a coinsurance rate of � and premium P , in health state
� a consumer chooses health and consumption by solving the following problem:
maxC;H
U(C;H) s.t. W � P = C + ��H:
Demand for health is denoted H(��;W � P ), and demand for the consumption of other
goods is C(��;W �P ). Indirect utility is V (��;W �P ) = U(C(��;W �P ); H(��;W �P )).
The consumer chooses � and P to maximize expected utility, (�; P ), subject to the
insurer�s zero pro�t condition:
max�;P
(�; P ) =
Z �1
�0
V (��;W � P )dF s.t. P = (1� �)Z �1
�0
�HdF (1)
where � is distributed according to the cdf F (:). After rearranging and applying Roy�s
4 This interpretation can be derived from a simple health production function model. Assume that �represents generic health status, and health H, is produced under constant returns to scale from inputs z,with
H = f(z; �) = z=�:
Thus � determines the productivity of health inputs. If input prices are p, then the minimum cost of attaininghealth H in state � is c(H; �) = p�H. If p is normalized to unity, � can be interpreted as the price of health.
7
identity (see Jack and Sheiner, page 209), the optimal coinsurance rate satis�es
cov(q; �) = ��(1� �)dqd�; (2)
where q � �H is health spending, and � � V2 is the marginal utility of income, both of which
are state-dependent. Bars denote means. The left hand side is a measure of the expected
utility cost of a marginal increase in the coinsurance rate, holding health expenditures in
each state, q, constant. The right hand side is the corresponding marginal bene�t of such
an increase, deriving from the premium savings associated with reduced consumption of
medical care when the coinsurance rate rises.
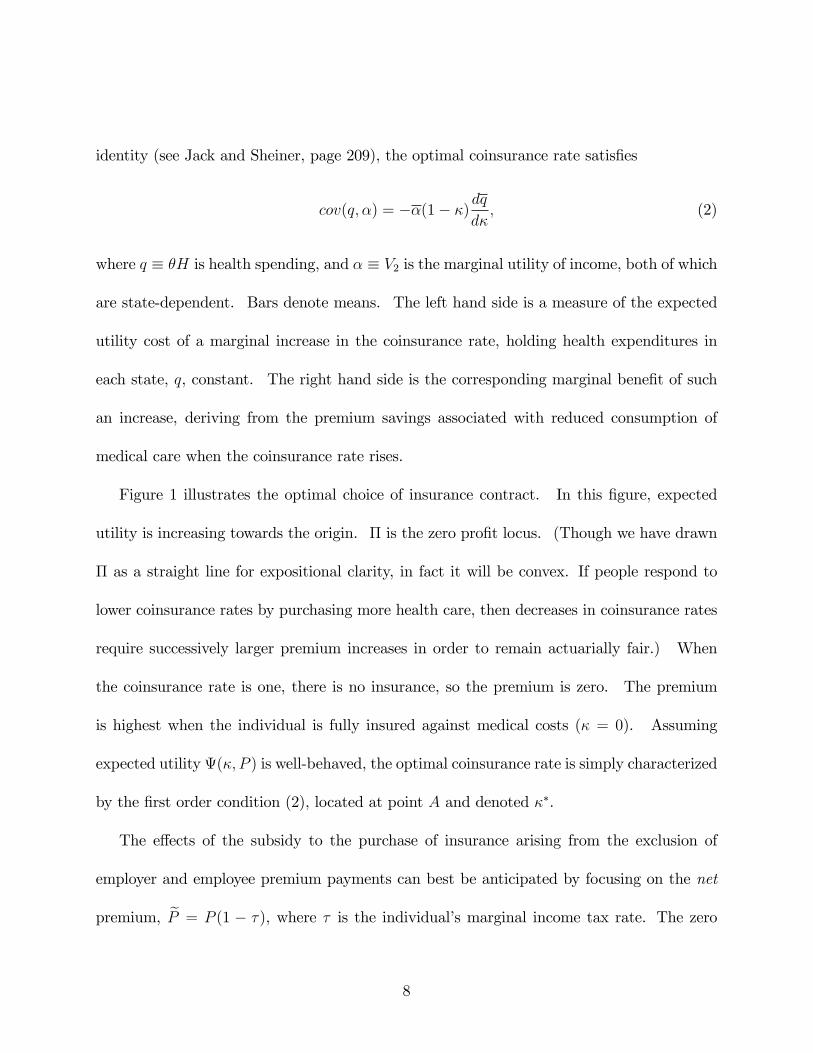
Figure 1 illustrates the optimal choice of insurance contract. In this �gure, expected
utility is increasing towards the origin. � is the zero pro�t locus. (Though we have drawn
� as a straight line for expositional clarity, in fact it will be convex. If people respond to
lower coinsurance rates by purchasing more health care, then decreases in coinsurance rates
require successively larger premium increases in order to remain actuarially fair.) When
the coinsurance rate is one, there is no insurance, so the premium is zero. The premium
is highest when the individual is fully insured against medical costs (� = 0). Assuming
expected utility (�; P ) is well-behaved, the optimal coinsurance rate is simply characterized
by the �rst order condition (2), located at point A and denoted ��.
The e¤ects of the subsidy to the purchase of insurance arising from the exclusion of
employer and employee premium payments can best be anticipated by focusing on the net
premium, eP = P (1 � �), where � is the individual�s marginal income tax rate. The zero
8
Coinsurance rate, κ
P
1κ*
Ψ(κ,P) = constant
Π
A
Figure 1: The optimal insurance policy
pro�t constraint faced by insurers can be written, in terms of the net premium, as
eP(1� �) = (1� �)q (3)
where q is expected health expenditures, and is a function of the coinsurance rate and the
individual�s income net of insurance premiums and taxes paid. This net income, in turn,
is W �� eP + T�, where T is a lump-sum tax used to �nance the subsidy. In �gure 2 the
vertical axis measures the total ex ante payment associated with the purchase of health
insurance, eP + T . The e¤ect of the subsidy is thus to �atten and shift the zero pro�t linein �gure 1.5 ;6 The zero pro�t line in the presence of the premium subsidy is denoted �� .
5 This can most easily be seen by supposing that q is �xed, and comparing equation (3) with the constraintin (1).
6 Without taking account of the tax revenue required to �nance this subsidy, the new budget line wouldpivot around the point � = 1. However, this would be of limited use for welfare analysis.
9
Coinsurance rate, κ1κ*κτ*
Π
Πτ
Ψ(κ,P+T) = constant~
Net premium plusfinancing tax
P+T~
A
B
Premium subsidy
- reduces coinsurance rate
- reduces welfare
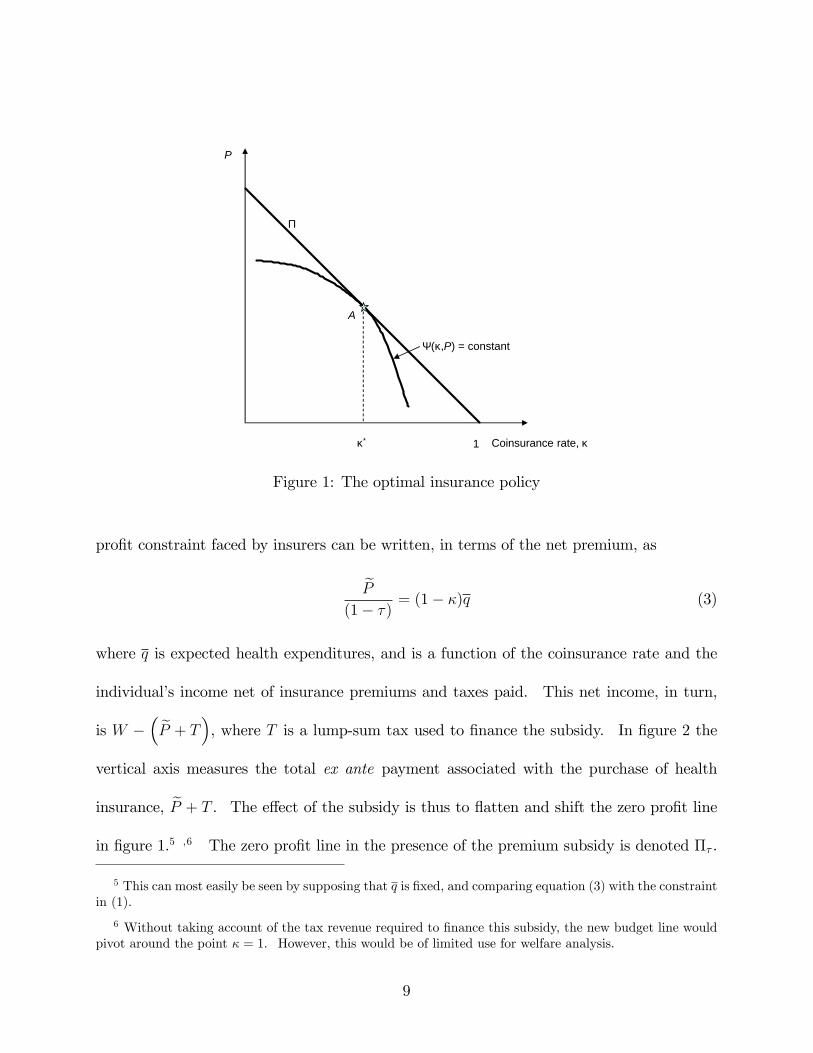
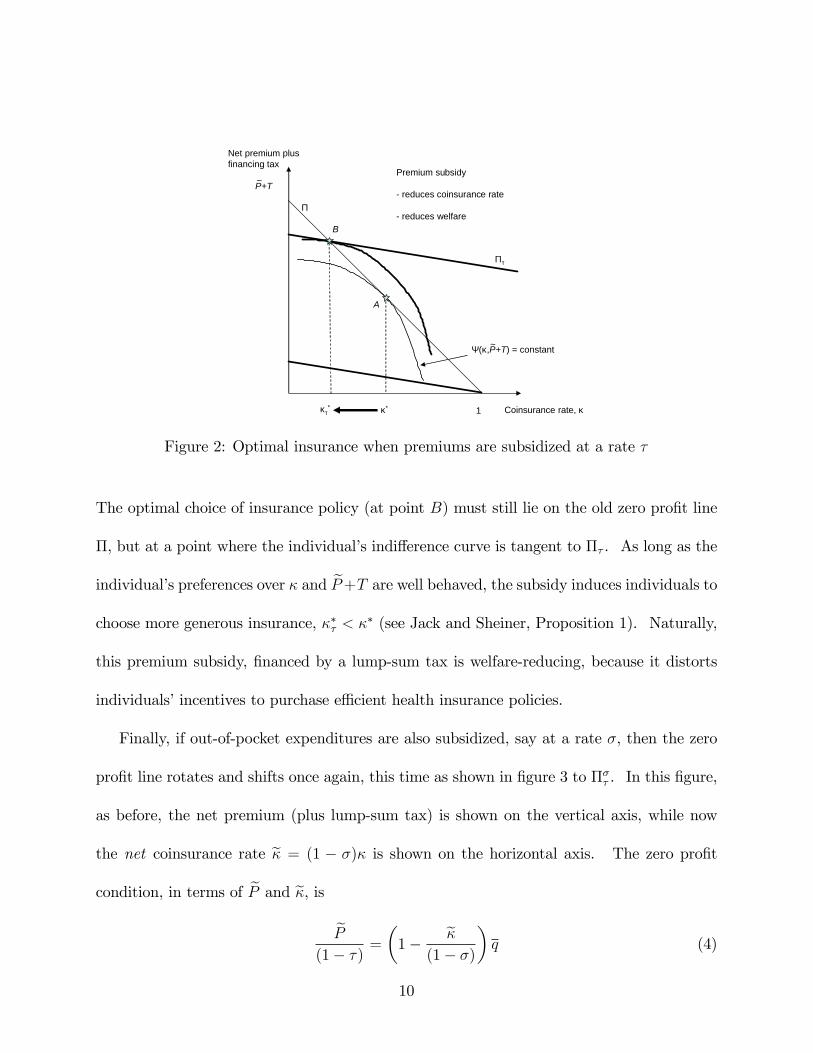
Figure 2: Optimal insurance when premiums are subsidized at a rate �
The optimal choice of insurance policy (at point B) must still lie on the old zero pro�t line
�, but at a point where the individual�s indi¤erence curve is tangent to �� . As long as the
individual�s preferences over � and eP+T are well behaved, the subsidy induces individuals tochoose more generous insurance, ��� < �
� (see Jack and Sheiner, Proposition 1). Naturally,
this premium subsidy, �nanced by a lump-sum tax is welfare-reducing, because it distorts
individuals�incentives to purchase e¢ cient health insurance policies.
Finally, if out-of-pocket expenditures are also subsidized, say at a rate �, then the zero
pro�t line rotates and shifts once again, this time as shown in �gure 3 to ��� . In this �gure,
as before, the net premium (plus lump-sum tax) is shown on the vertical axis, while now
the net coinsurance rate e� = (1 � �)� is shown on the horizontal axis. The zero pro�t
condition, in terms of eP and e�, iseP
(1� �) =�1� e�
(1� �)
�q (4)
10
P+T
1κ*
Ψ(κ,P+T) = constant
κτ
Π
Πτ
Πτ
Net coinsurance rateκ = (1-σ)κ
κτ
~~
~~ ~
~
~
B
A
σ∗*
C
σ
Coinsurance subsidy
- increases net coinsurance rate
- improves welfare
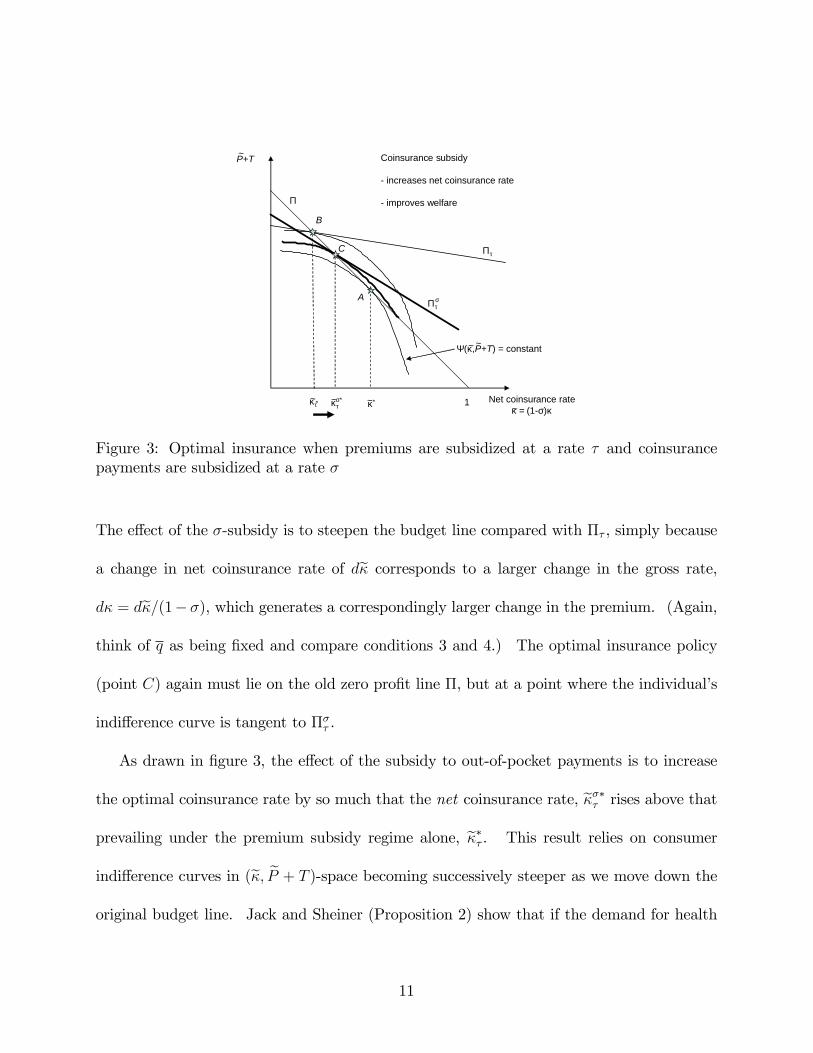
Figure 3: Optimal insurance when premiums are subsidized at a rate � and coinsurancepayments are subsidized at a rate �
The e¤ect of the �-subsidy is to steepen the budget line compared with �� , simply because
a change in net coinsurance rate of de� corresponds to a larger change in the gross rate,d� = de�=(1��), which generates a correspondingly larger change in the premium. (Again,think of q as being �xed and compare conditions 3 and 4.) The optimal insurance policy
(point C) again must lie on the old zero pro�t line �, but at a point where the individual�s
indi¤erence curve is tangent to ��� .
As drawn in �gure 3, the e¤ect of the subsidy to out-of-pocket payments is to increase
the optimal coinsurance rate by so much that the net coinsurance rate, e���� rises above that
prevailing under the premium subsidy regime alone, e��� . This result relies on consumer
indi¤erence curves in (e�; eP + T )-space becoming successively steeper as we move down theoriginal budget line. Jack and Sheiner (Proposition 2) show that if the demand for health
11
care is inelastic with respect to the out-of-pocket price, then a small coinsurance subsidy,
� > 0, does in fact induce such a change in the net coinsurance rate. In sum, FSAs can
partially undo the negative e¢ ciency e¤ects of premium subsidies. However, it is also
possible that indi¤erence curves in (e�; eP + T )-space could become steeper near the top ofthe original zero pro�t line. In this case, the �-subsidy would induce a lower choice of
net coinsurance rate, and would be welfare-reducing. The measured e¤ect of FSAs on net
coinsurance rates can thus be used to assess the welfare e¤ects of the tax policy.
3 Data and Empirical Strategy
The previous section demonstrates two important potential consequences of the growth of
�exible spending accounts. First, subsidizing out-of-pocket expenses could cause a nominal
shift in health care costs from employers to employees. It would be ironic if public policy
were in part accountable for this phenomenon that has, rightly or wrongly, generated so
much concern. Second, it is possible that the incremental subsidy to out-of-pocket expenses,
in the form of FSAs, mitigates the welfare loss from the underlying subsidy to premiums. As
illustrated by �gure 3, the resulting shift towards insurance policies with higher coinsurance
rates and lower premiums would be e¢ ciency enhancing so long as the net coinsurance rate
with the subsidy in place is higher than the gross coinsurance rate would have been without
the subsidy.
12
3.1 Data
To investigate these issues empirically we use the 1993 Employer Health Insurance Survey
(EHIS) from the Robert Wood Johnson Foundation. The EHIS is a cross-section of �rm-
level data on health insurance plans o¤ered by employers in 10 U.S. states. The survey
has two parts. The �rst has information about health insurance plans, including their
coverage, premiums, and coinsurance rates. The second part contains information about the
�rms, including their industrial classi�cations, employees, payrolls, unionization rates, and
organizational forms.
We focus on a subsample of the EHIS comprising 6525 �rms that o¤er health insurance
to their employees, have payrolls per worker greater than the full-time minimum wage, and
o¤er at least one insurance plan that is not an HMO or a PPO. In this sample, 25.8 percent
of the plans are associated with �rms that o¤er employees access to FSAs, and the �rms
o¤er a total of 7391 di¤erent insurance plans.
The EHIS is the best publicly available source to examine the potential e¤ects of de-
ductibility for out-of-pocket health expenses. However, it has a number of limitations. First,
although one motive for our study is to explain the recent growth in out-of-pocket costs borne
by employees, we recognize that the 12-year-old data in the EHIS cannot directly address
this issue. Nonetheless, we expect that the mechanisms by which FSAs a¤ect the structure
of insurance policies are likely to have remained operative over time.
Second, while we have information about the various insurance policies o¤ered by �rms,
we do not know the take-up rates for di¤erent policies within each �rm. For most of the
13
paper, our unit of observation is the insurance plan. We recognize that some unobserved
plan characteristics may be correlated across plans within �rms, and we test the robustness
of our results by running some speci�cations where the unit of observation is the �rm, and
plan characteristics (e.g. coinsurance rates) are simple averages across all the plans o¤ered
by each �rm.
Third, out-of-pocket payments come in a variety of forms: deductibles, copayments,
and coinsurance rates, often with some sort of annual cap. For this project we want some
indicator of the out-of-pocket expenses associated with a health insurance plan. As a com-
promise, we focus on the coinsurance rate: the share of costs borne by the employee, after
the deductible has been met, but before any maximum out-of-pocket cost, expressed as a
percentage. Since HMO and PPO plans typically do not include proportional cost-sharing
(instead relying on other mechanisms to control demand), we exclude them from our sample.
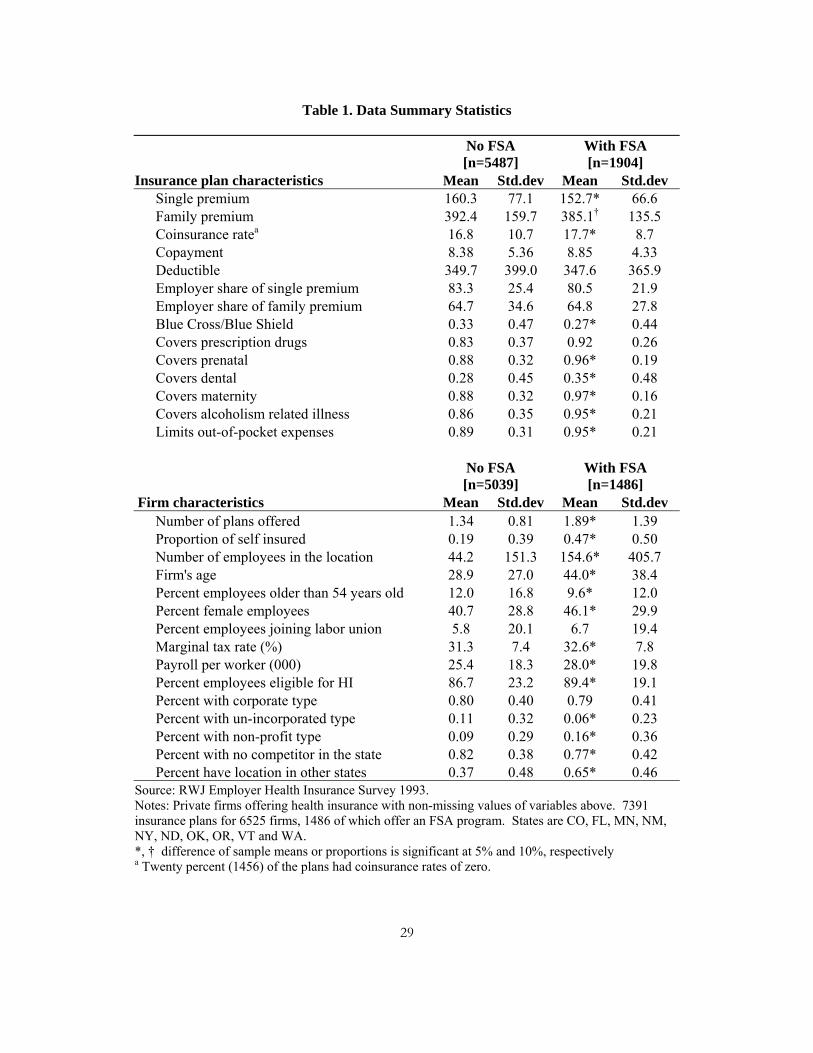
Table 1 provides descriptive statistics for these data. Consistent with our expectations
based on section 2, health insurance plans o¤ered by �rms with FSAs have lower premiums
and higher coinsurance rates. Of course, plans associated with FSAs also di¤er in many
other respects. They are more likely to cover certain services, and the �rms that o¤er them
have more and better-paid employees, have been in existence longer, and are less likely to
be unincorporated and for-pro�t.7
The key determinant of the value of the FSA subsidy, and of the welfare consequences
7 For Blue Cross/Blue Shield policies only, the coinsurance rates are 15.1 for the 1791 plans with FSAs,and 17.0 for the 506 plans without. The di¤erence (of means) is easily statistically signi�cant. Of course,we do not want to interpret this literally any more than the di¤erence in coinsurance rates for all plans intable 1.
14
of FSAs, is the marginal income tax rate faced by the plan�s members, � . Since we do not
know the true marginal tax rates faced by each plan�s members, we use the NBER TAXSIM
model to construct a proxy. First we compute the average earned income per worker for each
�rm, and we assume this constitutes these employees�entire incomes. We then let TAXSIM
compute the federal and state marginal tax rates by assuming that all workers are single
taxpayers with no dependents and standard deductions. Finally, we add 7.65 percent to
account for payroll taxes (6.2 percent for Social Security and 1.45 percent for Medicare).8
These calculated average marginal tax rates vary across observations due to di¤erences
in �rms�payrolls and in states�marginal tax rates. Firm di¤erences account for about 85
percent of the variation in � , and state di¤erences account for the remainder. As table 1
shows, individuals with health plans associated with FSAs have higher estimated marginal
tax rates.
Table 1 shows that health plans associated with FSAs have higher coinsurance rates, lower
premiums, and members that are likely to face higher marginal tax rates. To ask whether
FSAs may have caused the increase in employee out-of-pocket payments, and whether the net
after-tax coinsurance rate is higher than the gross rate would be without the FSA subsidy,
we need to control for di¤erences between �rms with and without these accounts.
8 While we do not attempt to approximate the economic incidence of these taxes, it does not matterwhat fraction we add to state and federal taxes so long as we use the same fraction for all of the plans. Werevisit this issue below when we discuss the e¤ect of FSAs on net-of-tax coinsurance rates.
15
3.2 Empirical strategy
Ideally, we would like to assess the e¤ect of subsidizing out-of-pocket expenses (o¤ering an
FSA) on the average health care plan�s coinsurance rate. Estimating this average treatment
e¤ect faces two distinct problems, one relating to endogenous regressors, and the other to
selection e¤ects.
First, since coinsurance rates and premiums are structurally related through the zero
pro�t constraint (illustrated in �gure 1), an econometric model that hopes to identify the
e¤ect of FSAs on coinsurance rates must control also for premium di¤erences across plans,
among other characteristics. However, the observed variation in premiums is unlikely to
be exogenous, and a simple OLS estimate of the premium e¤ect may be biased, thereby
contaminating the estimate of the FSA e¤ect. Instead, we estimate a reduced form where
the coinsurance rate is estimated as a linear function of exogenous variables that a¤ect
premiums, and which should not in theory a¤ect the coinsurance rate. These include state
indicator variables (to account for regional health care cost di¤erences), plan coverage, �rm
size and unionization rates.
The second obstacle to estimating whether coinsurance rates are higher for �rms with
FSAs is that �rms�decisions to o¤er FSAs are not exogenous. Some �rms may simply have
better employee bene�ts than others. These �rms may have more generous health insurance
plans, lower coinsurance rates, FSA programs, and a host of other unmeasured attributes.
An unmeasured characteristic such as this, which is correlated with both the propensity to
o¤er FSAs and to have low coinsurance rates, will likely bias any estimate of the impact of
16
FSAs on coinsurance rates against �nding a positive e¤ect. In other words, for the average
�rm, adopting an FSA could in theory cause it to have higher coinsurance rates. But �rms
that have adopted FSAs are the generous ones, which also have lower coinsurance rates. A
simple regression of coinsurance rates that fails to account for the endogenous decision to
adopt an FSA will likely understate the positive e¤ect of FSAs on coinsurance rates.
To control for the endogeneity of FSAs, we use the procedure outlined in Heckman and
Robb (1985) for dealing with discrete endogenous variables. We �rst estimate a probit of
whether or not the �rm has an FSA, and we include in that regression a set of instruments
that are not included in the determinants of coinsurance rates. These instruments include
the �rm�s age, whether the �rm has plants located in other states, whether the �rm has local
competitors, and the percentage of the �rm�s employees eligible for health insurance. These
�rm characteristics predict the likelihood of a �rm o¤ering an FSA, but are unlikely to be
related to the coinsurance rates of employees.
We make two alternative parametric assumptions in estimating the treatment e¤ect. Our
�rst is that the treatment e¤ect is independent of the observable characteristics X,
� = X� + F + � (5)
where X is a matrix of covariates, F is a vector of dummy variables equal to one if the plan�s
�rm has an FSA, and is the parameter we are interested in. We still cannot estimate (5)
using OLS, because corr(F; �) 6= 0. Unobserved characteristics of �rms that make them likely
to provide generous bene�ts including FSAs and low coinsurance rates will bias estimates of
. Instead, we predict the binomial indicator F using a probit regression, including variables
17

Z not included in X. We then use the predicted probabilities as instruments in (5).
Our second speci�cation weakens the ignorability of treatment assumption inherent in
(5). We continue to assume that in the absence of an FSA the conditional expectation of a
plan�s coinsurance rate is a linear function of observable covariates. However, we now allow
the treatment e¤ect itself to be related to the covariates.
� = X� + F + F (X �X)� + e (6)
where is the average treatment e¤ect (or more precisely, the treatment e¤ect at the average
value of the covariates). We estimate (6) instrumenting for F .
In sum, the methodology is as follows. First we estimate P (FSA = 1jX;Z) by a probit,
where Z is a vector of instruments. Second, we estimate equations (5) and (6) using in-
strumental variables, where the di¤erence is that (6) includes interactions between the FSA
dummy and the di¤erence between the covariates and their means.
As instruments we use the age of the �rm, dummy variables for whether the �rm has out-
of-state locations or in-state competitors, and the percentage of employees eligible for health
insurance. Firm age works well as an instrument because older �rms are more likely to o¤er
FSAs, but it is di¢ cult to imagine reasons why older �rms should have di¤erent coinsurance
rates from newer �rms, all else equal. We include a dummy variable for multi-state �rms,
because they might have economies of scale in administering payroll programs such as FSAs,
and on the theory that having a¢ liates in multiple states is more likely exogenous than the
level of employment. A dummy variable for the presence of in-state competitors captures the
degree of local labor market competition, putting pressure on companies to provide bene�ts
18
such as health insurance and FSAs. Finally, the percentage of the �rm�s employees eligible
for health insurance should increase the �rm�s tendency to administer an FSA. All of the
results that follow are robust to the exclusion of any one of these instruments, and none of
them are statistically signi�cant themselves when included in (5) and (6).
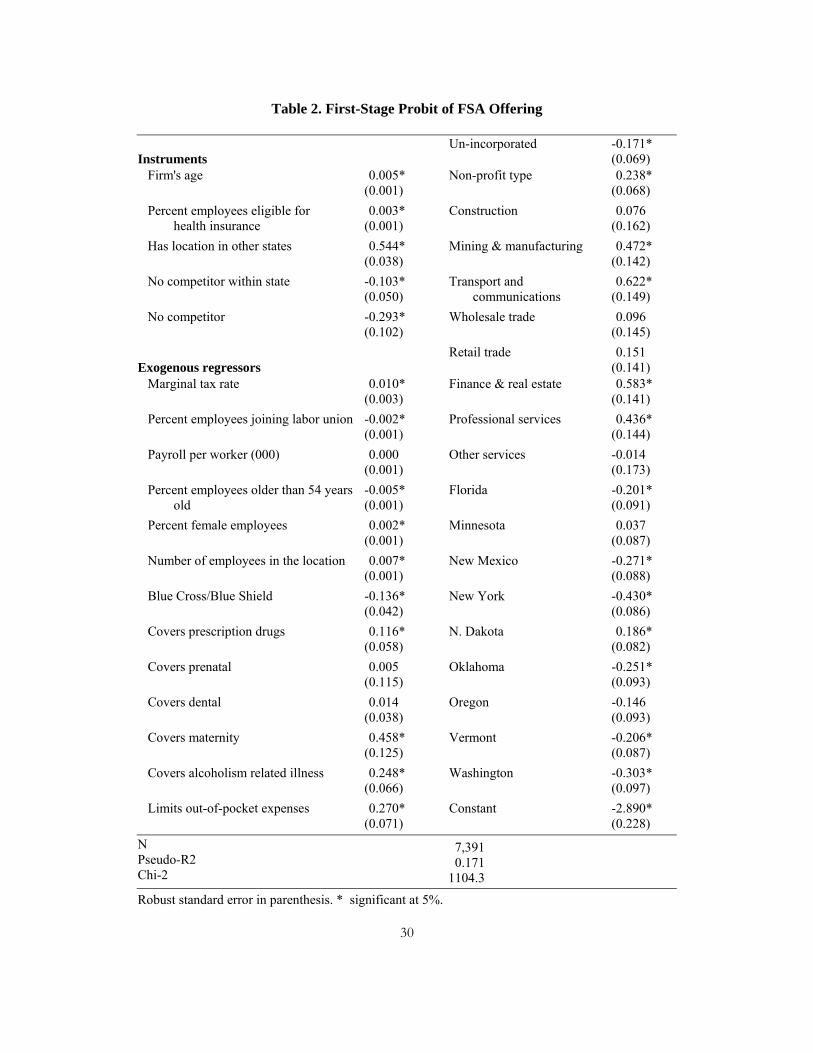
Table 2 presents the results of this �rst-stage probit, which estimates the probability
that a �rm o¤ers an FSA. The unit of observation is a �rm-speci�c health insurance plan.
The �rst �ve covariates listed in table 2 are the instruments, Z, and are excluded from the
second stage regressions of coinsurance rates. Health insurance plans are more likely to be
associated with �rms that o¤er FSAs if those �rms are older, have more employees eligible
to participate in health insurance bene�ts, have locations in multiple states, and have local
competition. Each 10 years of �rm age adds about 1.5 percentage points to the probability
that a �rm o¤ers an FSA. Each 10 percent increase in the share of employees eligible for
health insurance adds about 1 percentage point to the probability of o¤ering an FSA. And
having no identi�ed competitors subtracts about 11 percentage points from the probability
of o¤ering an FSA. These �rm characteristics are clearly correlated with the probability
that the �rm o¤ers an FSA. Our assumption, tested below, is that they are uncorrelated
with the error term in equations (5) and (6).
Turning to the exogenous covariates in table 2, each 10 percent increase in our estimate
of employees�marginal tax rates increases the probability of a �rm o¤ering an FSA by 3
percentage points. Each 10 percent increase in the fraction of female employees increases
the FSA probability by 0.6 percentage points. Plans associated with non-pro�t �rms are 8
19
percentage points more likely to have FSAs. The more bene�ts a plan o¤ers, the more likely
it is to be associated with an FSA: prescription drug coverage increases FSA probabilities by
3 percentage points; alcoholism coverage increases it by 7 percentage points; and maternity
bene�ts by 11 percentage points.
Some characteristics decrease the probability that a �rm o¤ers an FSA. A 10 percent
increase in union membership decreases the FSA probability by 0.5 percentage points. A 10
percent increase in the fraction of workers 55 or older decreases the FSA probability by 1.5
percentage points. Unincorporated �rms are 5 percentage points less likely to o¤er FSAs.
Firms in mining and manufacturing, and transport and communications, are more likely
to have FSAs than the omitted industry, agriculture. Firms in North Dakota are more likely
to have FSAs, while in other states are less likely to have FSAs than the omitted state,
Colorado.
Our next step is to use the predicted probabilities of a plan being provided in conjunction
with an FSA, using the coe¢ cients in table 2, in an IV estimation of equations (5) and (6).
3.3 Results
Table 3 presents our central estimates of equations (5) and (6). As a benchmark, column
(1) presents a simple OLS version of (5), not accounting for the selection by �rms as to
whether or not to o¤er an FSA. The dependent variable is the coinsurance rate, expressed
as a number between 0 and 100. The coe¢ cient on the FSA dummy indicates that health
insurance plans associated with �rms that o¤er FSAs have coinsurance rates that are 0.74
percentage points greater than otherwise similar plans without FSAs. Though the coe¢ cient
20
is statistically signi�cant and in the direction we expect, the magnitude is quite small.
Column (2) of table 3 runs the same OLS speci�cation, but includes interactions between
the FSA dummy and the di¤erence between each of the �rm and insurance-plan character-
istics and its mean, as in equation (6). Because the interaction included is di¤erences-from-
means, we can interpret the FSA coe¢ cient (1.365) in the same way as when the interaction
was not included, as an average treatment e¤ect. Here the e¤ect has risen as a result of
including the interactions, from .74 to 1.36, but it remains small.
Of course, the decision to o¤er an FSA is not exogenous, and may be based on unobserved
�rm characteristics that also a¤ect the coinsurance rates. In fact, we suspect that the OLS
results in columns (1) and (2) understate the true e¤ect of FSAs on coinsurance rates,
because �rms that have adopted FSAs have generally more generous bene�ts, including low
coinsurance rates. Hence, we do not emphasize these �rst two benchmark columns.
Column (3) of table 3 shows the results of an instrumental variables estimation of equation
(5), using the predicted probabilities from table 2 as instruments. The average health care
plan has a coinsurance rate that is 4.07 percentage points higher when o¤ered in conjunction
with an FSA than in the absence of an FSA, controlling for observable characteristics of �rms,
and for the selection by �rms as to whether to o¤er an FSA. The average coinsurance rate in
the sample is 17 percent, so a 4 percent increase amounts to a substantial average treatment
e¤ect (more on magnitudes below).
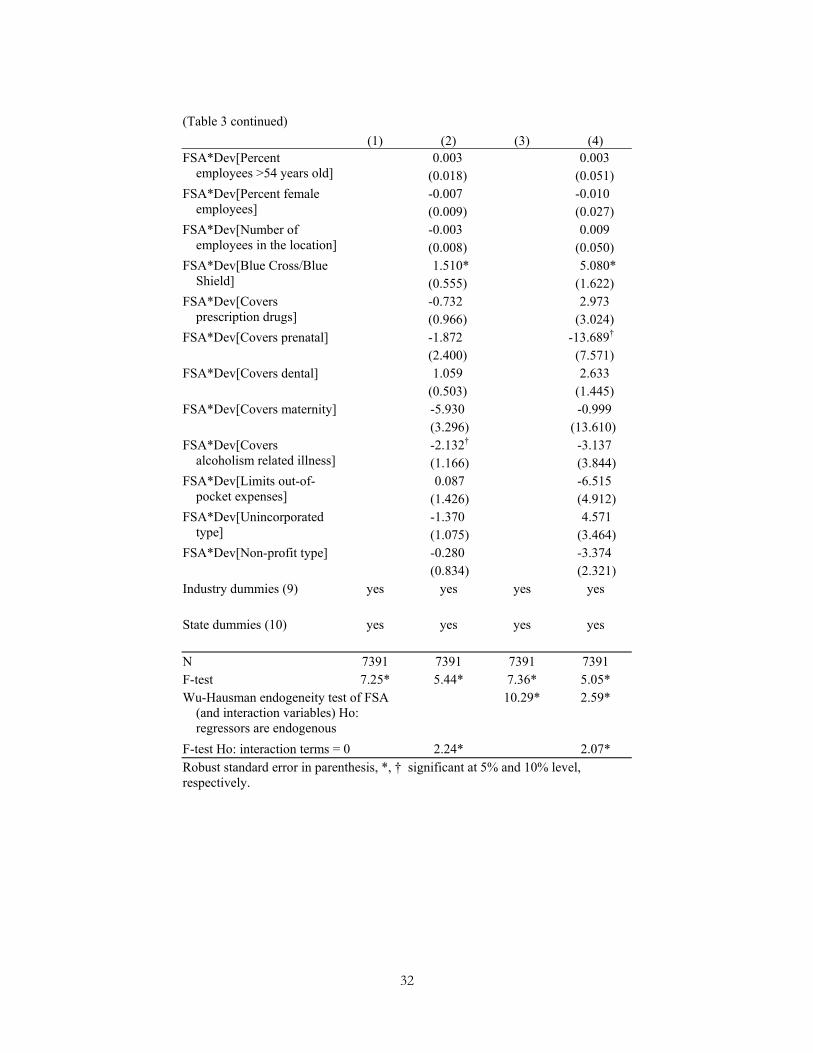
In column (4) of table 3 we estimate equation (6) using IV, including interaction terms
between the predicted FSA probability and the di¤erence between the exogenous variables
21
and their means. While few of the interactions are individually statistically signi�cant, an F -
test rejects the joint hypothesis that all of these interactions have zero e¤ect on coinsurance
rates. In other words, the covariates X have di¤erent overall e¤ects on coinsurance rates
depending on whether the health insurance plan is associated with an FSA. Omitting the
interactive terms biases the results in column (3). The average treatment e¤ect reported in
column (4) of table 3 suggests that when provided in conjunction with FSAs, plans have
coinsurance rates that are 7.3 percentage points higher than in the absence of FSAs.
At the bottom of column (3) we report the F -statistic from a Wu-Hausman test of the
exogeneity of the FSA regressor in column 1, easily rejecting unbiasedness and consistency
for the OLS approach. Note also that the coe¢ cients in columns (3) and (4) are larger than
their OLS versions in columns (1) and (2), suggesting that the endogeneity of FSAs biases
the OLS approach against �nding a large average treatment e¤ect. To interpret the size of
this e¤ect more concretely, we turn to an explicit discussion of magnitudes.
3.4 Magnitudes and welfare implications
In the theory illustrated in �gure 3, the subsidy to out-of-pocket costs increases the optimal
coinsurance rate by so much that the net coinsurance rate rises above what it would have
been absent the subsidy. Under the assumptions of inelastic demand for health care made by
Jack and Sheiner (1997), subsidizing out-of-pocket costs increases the net coinsurance rate
in this way, and is e¢ ciency enhancing in the presence of a pre-existing premium subsidy.
To assess whether in fact net coinsurance rates rise as a consequence of FSAs, consider
the relationship between the predicted gross and net rates, evaluated at the means of the
22

covariates. The predicted gross coinsurance rate with FSAs is simply the predicted gross
rate without FSAs plus the average treatment e¤ect, , measured in column (4) of table 3
as 7.3 percentage points,
b�1 = b�0 + :The net coinsurance rate is just the gross rate times (1� �) for plans with FSAs (where
� is the average marginal tax rate faced by individuals in those plans), and the gross rate
itself for plans without FSAs,
e�0 = b�0e�1 = b�1(1� �)
where net rates are denoted by a ~.
The di¤erence between the predicted net coinsurance rates of a plan with the average
covariates with and without an FSA is de�ned as
�e� = e�1 � e�0:In the top row of table 4 we present estimates of �e�. Using our speci�cation from table 3,
column (4), the expected net coinsurance rate without an FSA is 15.6 percent (column (2)),
while with an FSA it is 15.71 percent (column (3)). The di¤erence, �e�, is 0.15 percentagepoints. Though positive, this increase is small and statistically insigni�cant, indicating that
the FSA subsidy neither increases nor decreases net coinsurance rates. This calculation
of �e� depends on the tax rate. If we include all of the payroll taxes (15.3 percent), thenthe net coinsurance rate rises to 17.5 percent (instead of the 15.7 percent in table 4), and
23

our estimate of �e� suggest that net coinsurance rates rise by 1.9 percentage points, thoughthis e¤ect remains statistically insigni�cant. If we include none of the payroll taxes, the
net coinsurance rates fall to 14.0 percent, and �e� suggests net coinsurance rates fall 1.6percentage points, also statistically insigni�cant. In sum, FSAs appear to have increased
health insurance plans�coinsurance rates by a su¢ cient amount to erase the tax advantages
of participating in the plans. As suggested by �gure 3, the FSA subsidy to out-of-pocket
costs is therefore welfare-neutral.
3.5 Robustness
The rest of table 4 presents alternative speci�cations. First, in row 2 we report the predicted
e¤ect of FSAs on coinsurance rates if we use a linear probability model to predict FSA choice
at the �rst stage, instead of a probit. The estimated e¤ects are little a¤ected by this change
in speci�cation.
Next, some readers may be concerned that our sample of 7391 insurance plans really only
involves 6525 di¤erent �rms. As one check, we include the number of plans o¤ered by the
�rm as an additional control variable. (These include HMOs and PPOs not counted among
our 7391 original observations.) This change has little e¤ect on our central estimate, raising
it from 7.31 to 7.78.
We also tried a speci�cation where the unit of observation is the �rm rather than the
insurance plan. For each �rm we simply averaged the characteristics (coinsurance rate, etc.)
across all the o¤ered plans. Here the central estimate (5.96) is still large and statistically
signi�cant, though perhaps muted slightly by the averaging of plan characteristics.
24
A �nal set of robustness checks uses alternative sets of instruments for predicting FSAs.
Recall that the instruments used in table 2 include (i) the �rm�s age, (ii) the percent of
employees eligible for health insurance, (iii) whether the �rm has locations in other states,
and (iv) whether the �rm has a competitor in the same state. We did not include the
number of employees at a particular location as an instrument, thinking that would be
correlated with the size of the risk pool, and therefore the coinsurance rate. It turned out
not to be signi�cant in the second stage regressions, and so in row 5 of table 4 we report
the results of including the number of employees as an additional instrument. The main
e¤ect (6.25), remains large and statistically signi�cant. In the bottom panel of table 4
we report the average and net treatment e¤ects for alternative sets of instruments, where
each alternative involves dropping one of the original set. In each case, we include the
dropped instrument in the second-stage coinsurance regression, and for each speci�cation its
coe¢ cient is small and statistically insigni�cant. The estimates are all similar, and result
in large, statistically signi�cant average treatment e¤ects. Moreover, each estimate results
in a small and statistically insigni�cant net treatment e¤ect, suggesting that FSAs have had
no net e¤ect on welfare.
4 Conclusions
Individuals with private health insurance in the United States have been paying an increasing
share of their health care expenses out of pocket over the last decade. While this is likely
due to a number of factors (demographics, falling tax rates, changes in the organization
25
of health care delivery, etc.), one factor that may be important is the growth of Flexible
Spending Accounts, which subsidize out-of-pocket payments. The potential role of this
subsidy suggests that the observed shift to uninsured expenses may be partly illusory �net
of the subsidy, out-of-pocket expenses have remained approximately constant.
In this paper, we have used cross-sectional data from an employer survey to address
the link between the availability of FSAs and coinsurance rates. Of course, without panel
data we cannot be de�nitive about the recent evolution of insurance arrangements in the
US. Nevertheless, the cross-sectional analysis is instructive. We �nd, for example, that
when health insurance is o¤ered in conjunction with an FSA, the coinsurance rate is higher.
Correcting for selection bias, the FSA e¤ect is statistically signi�cant and economically large:
coinsurance rates are on average about 7.3 percentage points higher with FSAs than without
(compared to a sample average of 17 percent). In addition, our results suggest that the shift
to out-of-pocket spending is approximately welfare neutral, as the net-of-subsidy coinsurance
rate is approximately equal for plans o¤ered in the presence of FSAs.
Why might FSAs not increase net-of-tax coinsurance rates and welfare? For one, not all
employees participate in the plans. Our measured e¤ect, 7.3 percentage points, would surely
be higher if all employees participated. Second, average marginal tax rates probably overstate
the bene�ts of FSAs, because the plans involve complicated reimbursement accounts and
a use-it-or-lose-it feature. If FSAs bene�ted all employees or were a straightforward tax
deduction, their gross e¤ect might be larger, and net-of-tax coinsurance rates and welfare
might well increase.
26
Finally, we believe there is a curious irony in the gap between our �ndings here and the
public concern about shifting health care costs from employers to employees. First, it is
ironic that public policy in the form of FSAs may be accountable for part of the transfer
of costs to employees. Second, the fact that the shift is large enough to o¤set the subsidy
(FSAs do not cause net coinsurance rates to fall) means that the shift in costs may not be
a cause for concern. FSAs do not seem to lower welfare, and could even increase it, since
they partially o¤set the distortionary e¤ect of the tax subsidy given to employer-paid health
insurance premiums.
References
Cardon, James and Mark Showalter (2001): �An examination of �exible spendingaccounts,�Journal of Health Economics 20: 935-954
Cogan, John F., R. Glenn Hubbard, Daniel P. Kessler (2005): Healthy, Wealthy, andWise, Washington DC: AEI Press.
Cooper, Phillip and Barbara Schone (1997): "More o¤ers, fewer takers for employment-based health insurance: 1987 and 1996," Health A¤airs, 16, 142-149
Dowd, Brian, Roger Feldman, Matthew Maciejewski, and Mark Pauly, (2001): �Thee¤ect of tax-exempt out-of-pocket premiums on health plan choice,� National TaxJournal 54(4): 741-756.
Dranove, David, Kathryn Spier and Laurence Baker (2000): "�Competition�amongemployers o¤ering health insurance,�Journal of Health Economics, 19: 121-140.
Farber, Henry and Helen Levy (2000): "Recent Trends in Employer-Sponsored HealthInsurance: Are Bad Jobs Getting Worse?" Journal of Health Economics, 19: 93-119.
Feenberg, Daniel and Elisabeth Coutts "An Introduction to the TAXSIM Model",Journal of Policy Analysis and Management, 12(1).
Feldstein, Martin S. (1973): "The Welfare Loss of Excess Health Insurance," Journalof Political Economy, 81(2), 251-80.
27
Gruber, Jonathon (1994): "The incidence of mandated maternity bene�ts," AmericanEconomic Review, 84(3), 622-41
Gruber, Jonathon and Robin McKnight (2003): "Why Did Employee Health InsuranceContributions Rise?" Journal of Health Economics, 22(6), 1085-1104
Heckman, James J. and Richard Robb (1985). �Alternative methods for estimating theimpact of interventions,�in James J. Heckman and Burton Singer (eds.), LongitudinalAnalysis of Labor Market Data. Cambridge University Press 1985, Cambridge.
Hubbard, R. Glenn, John F. Cogan, Daniel P. Kessler (2004): "Brilliant Deduction,"Wall Street Journal December 8.
Jack, William and Louise Sheiner (1997): "Welfare-improving health expenditure sub-sidies," American Economic Review, 87(1), 206-21
Joint Committee on Taxation (2003): "Estimates of Federal Tax Expenditures forFiscal Years 2004-2008," JCS-8-03, US Government Printing O¢ ce, Washington DC.
Kaiser Family Foundation and Health Research and Educational Trust (2004): Em-ployer Health Bene�ts: 2004 Annual Survey, Menlo Park, California, and Chicago,Illinois
Levy, Helen (1998): �Who pays for health insurance? Employee contributions to healthinsurance premiums,�Working Paper #398, Industrial Relations Section, PrincetonUniversity
Pauly, Mark (1968): "The economics of moral hazard: comment," American EconomicReview, 58, 531-37
Pauly, Mark (1986): "Taxation, health insurance and market failure in the medicaleconomy," Journal of Economic Literature, 24, 629-675
Wooldridge. Je¤rey M. (2002). Econometric Analysis of Cross Section and Panel Data.MIT Press, Cambridge, Massachusetts.
28
29
Table 1. Data Summary Statistics
No FSA [n=5487]
With FSA [n=1904]
Insurance plan characteristics Mean Std.dev Mean Std.dev Single premium 160.3 77.1 152.7* 66.6 Family premium 392.4 159.7 385.1† 135.5 Coinsurance ratea 16.8 10.7 17.7* 8.7 Copayment 8.38 5.36 8.85 4.33 Deductible 349.7 399.0 347.6 365.9 Employer share of single premium 83.3 25.4 80.5 21.9 Employer share of family premium 64.7 34.6 64.8 27.8 Blue Cross/Blue Shield 0.33 0.47 0.27* 0.44 Covers prescription drugs 0.83 0.37 0.92 0.26 Covers prenatal 0.88 0.32 0.96* 0.19 Covers dental 0.28 0.45 0.35* 0.48 Covers maternity 0.88 0.32 0.97* 0.16 Covers alcoholism related illness 0.86 0.35 0.95* 0.21 Limits out-of-pocket expenses 0.89 0.31 0.95* 0.21
No FSA [n=5039]
With FSA [n=1486]
Firm characteristics Mean Std.dev Mean Std.dev Number of plans offered 1.34 0.81 1.89* 1.39 Proportion of self insured 0.19 0.39 0.47* 0.50 Number of employees in the location 44.2 151.3 154.6* 405.7 Firm's age 28.9 27.0 44.0* 38.4 Percent employees older than 54 years old 12.0 16.8 9.6* 12.0 Percent female employees 40.7 28.8 46.1* 29.9 Percent employees joining labor union 5.8 20.1 6.7 19.4 Marginal tax rate (%) 31.3 7.4 32.6* 7.8 Payroll per worker (000) 25.4 18.3 28.0* 19.8 Percent employees eligible for HI 86.7 23.2 89.4* 19.1 Percent with corporate type 0.80 0.40 0.79 0.41 Percent with un-incorporated type 0.11 0.32 0.06* 0.23 Percent with non-profit type 0.09 0.29 0.16* 0.36 Percent with no competitor in the state 0.82 0.38 0.77* 0.42 Percent have location in other states 0.37 0.48 0.65* 0.46
Source: RWJ Employer Health Insurance Survey 1993. Notes: Private firms offering health insurance with non-missing values of variables above. 7391 insurance plans for 6525 firms, 1486 of which offer an FSA program. States are CO, FL, MN, NM, NY, ND, OK, OR, VT and WA. *, † difference of sample means or proportions is significant at 5% and 10%, respectively a Twenty percent (1456) of the plans had coinsurance rates of zero.
30
Table 2. First-Stage Probit of FSA Offering
Instruments Un-incorporated -0.171*
(0.069) Firm's age 0.005*
(0.001) Non-profit type 0.238*
(0.068) Percent employees eligible for
health insurance 0.003*
(0.001) Construction 0.076
(0.162) Has location in other states 0.544*
(0.038) Mining & manufacturing 0.472*
(0.142) No competitor within state
-0.103* (0.050)
Transport and communications
0.622* (0.149)
No competitor -0.293* (0.102)
Wholesale trade 0.096 (0.145)
Exogenous regressors Retail trade 0.151
(0.141) Marginal tax rate 0.010*
(0.003) Finance & real estate 0.583*
(0.141) Percent employees joining labor union -0.002*
(0.001) Professional services 0.436*
(0.144) Payroll per worker (000) 0.000
(0.001) Other services -0.014
(0.173) Percent employees older than 54 years
old -0.005* (0.001)
Florida -0.201* (0.091)
Percent female employees 0.002* (0.001)
Minnesota 0.037 (0.087)
Number of employees in the location 0.007* (0.001)
New Mexico -0.271* (0.088)
Blue Cross/Blue Shield -0.136* (0.042)
New York -0.430* (0.086)
Covers prescription drugs 0.116* (0.058)
N. Dakota 0.186* (0.082)
Covers prenatal 0.005 (0.115)
Oklahoma -0.251* (0.093)
Covers dental 0.014 (0.038)
Oregon -0.146 (0.093)
Covers maternity 0.458* (0.125)
Vermont -0.206* (0.087)
Covers alcoholism related illness 0.248* (0.066)
Washington -0.303* (0.097)
Limits out-of-pocket expenses 0.270* (0.071)
Constant
-2.890* (0.228)
N Pseudo-R2 Chi-2
7,391 0.171
1104.3 Robust standard error in parenthesis. * significant at 5%.
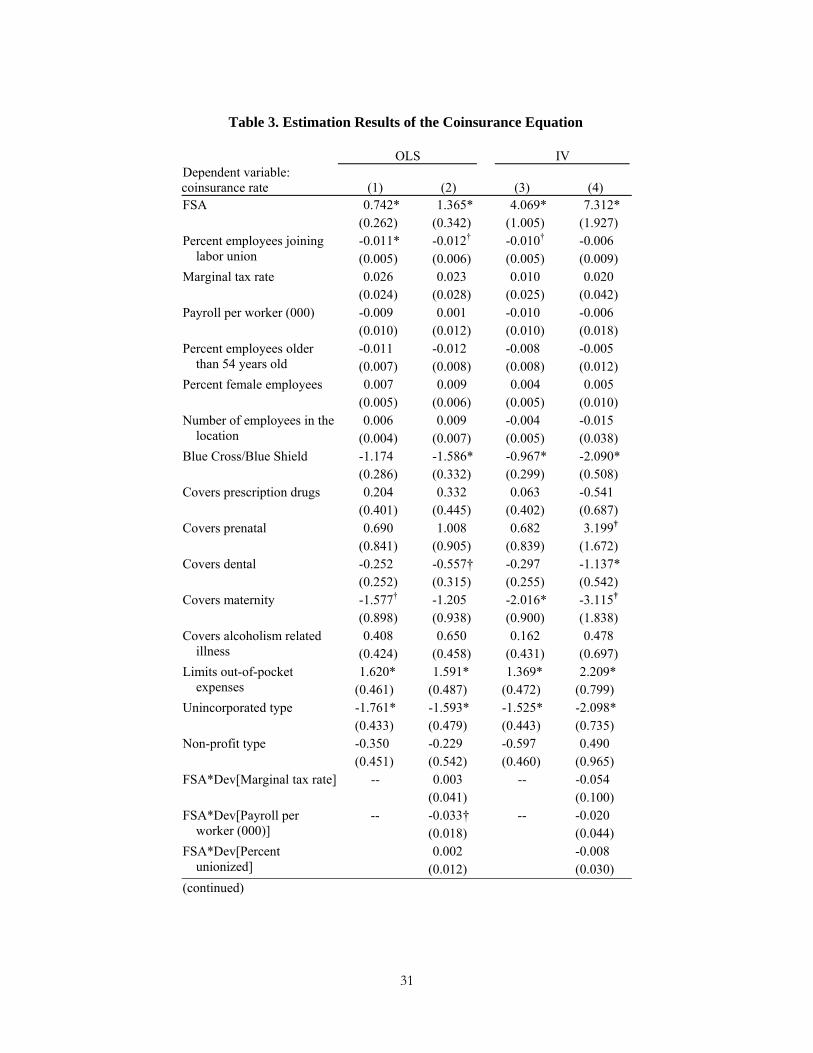
Table 3. Estimation Results of the Coinsurance Equation
OLS IV Dependent variable: coinsurance rate (1) (2) (3) (4) FSA 0.742* 1.365* 4.069* 7.312* (0.262) (0.342) (1.005) (1.927)
-0.011* -0.012† -0.010† -0.006 Percent employees joining labor union (0.005) (0.006) (0.005) (0.009)
Marginal tax rate 0.026 0.023 0.010 0.020 (0.024) (0.028) (0.025) (0.042) Payroll per worker (000) -0.009 0.001 -0.010 -0.006 (0.010) (0.012) (0.010) (0.018)
-0.011 -0.012 -0.008 -0.005 Percent employees older than 54 years old (0.007) (0.008) (0.008) (0.012)
Percent female employees 0.007 0.009 0.004 0.005 (0.005) (0.006) (0.005) (0.010)
0.006 0.009 -0.004 -0.015 Number of employees in the location (0.004) (0.007) (0.005) (0.038)
Blue Cross/Blue Shield -1.174 -1.586* -0.967* -2.090* (0.286) (0.332) (0.299) (0.508) Covers prescription drugs 0.204 0.332 0.063 -0.541 (0.401) (0.445) (0.402) (0.687) Covers prenatal 0.690 1.008 0.682 3.199†
(0.841) (0.905) (0.839) (1.672) Covers dental -0.252 -0.557† -0.297 -1.137* (0.252) (0.315) (0.255) (0.542) Covers maternity -1.577† -1.205 -2.016* -3.115†
(0.898) (0.938) (0.900) (1.838) 0.408 0.650 0.162 0.478 Covers alcoholism related
illness (0.424) (0.458) (0.431) (0.697) 1.620* 1.591* 1.369* 2.209* Limits out-of-pocket
expenses (0.461) (0.487) (0.472) (0.799) Unincorporated type -1.761* -1.593* -1.525* -2.098* (0.433) (0.479) (0.443) (0.735) Non-profit type -0.350 -0.229 -0.597 0.490 (0.451) (0.542) (0.460) (0.965) FSA*Dev[Marginal tax rate] -- 0.003 -- -0.054 (0.041) (0.100)
-- -0.033† -- -0.020 FSA*Dev[Payroll per worker (000)] (0.018) (0.044)
0.002 -0.008 FSA*Dev[Percent unionized] (0.012) (0.030)
(continued)
31
32
(Table 3 continued) (1) (2) (3) (4)
0.003 0.003 FSA*Dev[Percent employees >54 years old] (0.018) (0.051)
-0.007 -0.010 FSA*Dev[Percent female employees] (0.009) (0.027)
-0.003 0.009 FSA*Dev[Number of employees in the location] (0.008) (0.050)
1.510* 5.080* FSA*Dev[Blue Cross/Blue Shield] (0.555) (1.622)
-0.732 2.973 FSA*Dev[Covers prescription drugs] (0.966) (3.024)
FSA*Dev[Covers prenatal] -1.872 -13.689†
(2.400) (7.571) FSA*Dev[Covers dental] 1.059 2.633 (0.503) (1.445) FSA*Dev[Covers maternity] -5.930 -0.999 (3.296) (13.610)
-2.132† -3.137 FSA*Dev[Covers alcoholism related illness] (1.166) (3.844)
0.087 -6.515 FSA*Dev[Limits out-of-pocket expenses] (1.426) (4.912)
-1.370 4.571 FSA*Dev[Unincorporated type] (1.075) (3.464)
-0.280 -3.374 FSA*Dev[Non-profit type] (0.834) (2.321)
Industry dummies (9) yes yes yes yes State dummies (10) yes yes yes yes N 7391 7391 7391 7391 F-test 7.25* 5.44* 7.36* 5.05* Wu-Hausman endogeneity test of FSA
(and interaction variables) Ho: regressors are endogenous
10.29* 2.59*
F-test Ho: interaction terms = 0 2.24* 2.07* Robust standard error in parenthesis, *, † significant at 5% and 10% level, respectively.
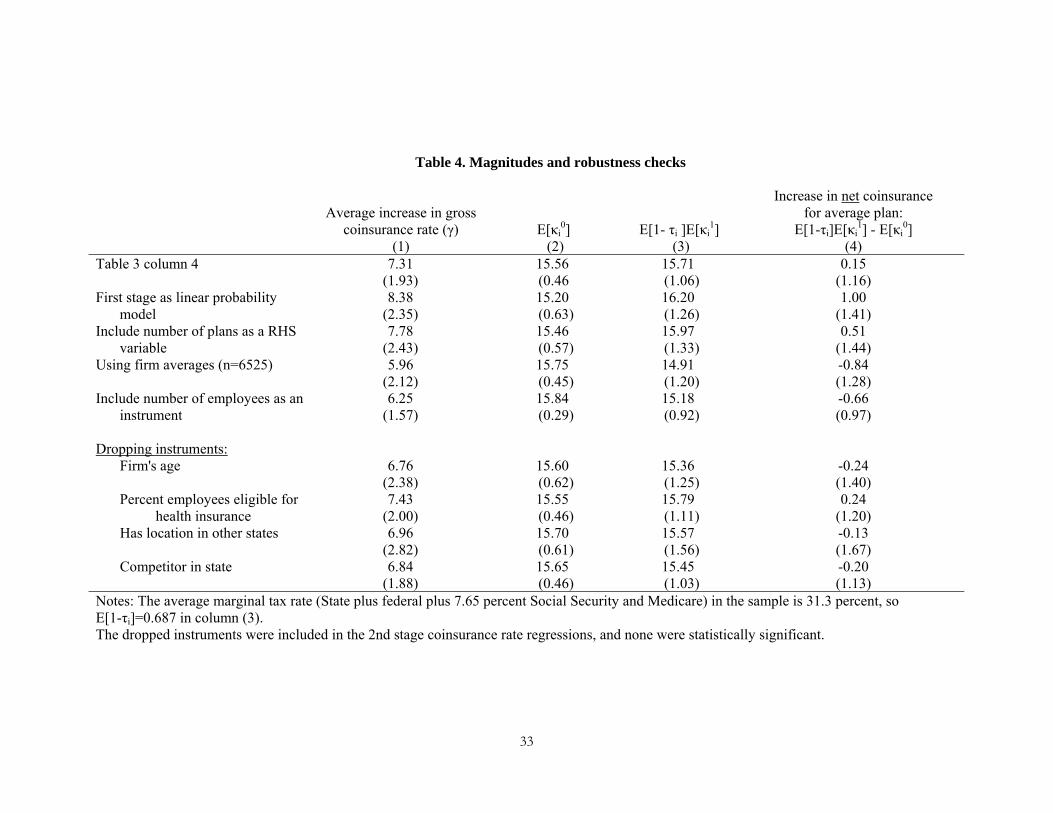
Table 4. Magnitudes and robustness checks
Average increase in gross
coinsurance rate (γ) (1)
E[κi0]
(2) E[1- τi ]E[κi
1] (3)
Increase in net coinsurance for average plan:
E[1-τi]E[κi1] - E[κi
0] (4)
Table 3 column 4 7.31 (1.93)
15.56 (0.46
15.71 (1.06)
0.15 (1.16)
First stage as linear probability model
8.38 (2.35)
15.20 (0.63)
16.20 (1.26)
1.00 (1.41)
Include number of plans as a RHS variable
7.78 (2.43)
15.46 (0.57)
15.97 (1.33)
0.51 (1.44)
Using firm averages (n=6525) 5.96 (2.12)
15.75 (0.45)
14.91 (1.20)
-0.84 (1.28)
Include number of employees as an instrument
6.25 (1.57)
15.84 (0.29)
15.18 (0.92)
-0.66 (0.97)
Dropping instruments:
Firm's age 6.76 (2.38)
15.60 (0.62)
15.36 (1.25)
-0.24 (1.40)
Percent employees eligible for health insurance
7.43 (2.00)
15.55 (0.46)
15.79 (1.11)
0.24 (1.20)
Has location in other states 6.96 (2.82)
15.70 (0.61)
15.57 (1.56)
-0.13 (1.67)
Competitor in state
6.84 (1.88)
15.65 (0.46)
15.45 (1.03)
-0.20 (1.13)
Notes: The average marginal tax rate (State plus federal plus 7.65 percent Social Security and Medicare) in the sample is 31.3 percent, so E[1-τi]=0.687 in column (3). The dropped instruments were included in the 2nd stage coinsurance rate regressions, and none were statistically significant.
33