
Empirical specification of field-aligned plasma density profiles for plasmasphere refilling
10
Empirical specification of field-aligned plasma density profiles for plasmasphere refilling Jiannan Tu, 1 Paul Song, 1 Bodo W. Reinisch, 1 James L. Green, 2 and Xueqin Huang 1 Received 20 December 2005; revised 15 February 2006; accepted 22 March 2006; published 29 June 2006. [1] Sounding measurements from the radio plasma imager (RPI) on the IMAGE satellite are used to derive electron density distributions along magnetic field lines in the nightside plasmasphere and plasmatrough for three midlatitude passes. These passes occurred during (1) a magnetic storm, (2) a prolonged quiet time, and (3) a sudden commencement of a storm, respectively. It is found that the density profiles of filled (in the inner plasmasphere) and depleted (in the plasmatrough or outer plasmasphere) flux tubes have different field line dependence. A multivariant least squares fit with a simple analytical function is used to model the density profiles. The fitting parameters in the function define the field line dependence of a density profile, i.e., the steepness of the density profile at high latitudes and the flatness at low latitudes. In each pass the density profiles along the filled and depleted flux tubes can be well modeled with the selected functional form, with two different sets of fitting parameter values for filled and depleted flux tubes. For the three passes examined, the fitting parameter values are not sensitive to the geomagnetic activity for the inner plasmasphere density profiles but vary slightly for the plasmatrough or outer plasmasphere density profiles from case to case. The equatorial densities extrapolated from the measured density profiles approximately have a power law relation with L values. The results suggest that the selected function has potential of being able to construct realistic global empirical plasmasphere/plasmatrough models. Furthermore, it is now feasible to empirically determine the density profiles along the depleted flux tubes for plasmasphere refilling studies. Citation: Tu, J., P. Song, B. W. Reinisch, J. L. Green, and X. Huang (2006), Empirical specification of field-aligned plasma density profiles for plasmasphere refilling, J. Geophys. Res., 111, A06216, doi:10.1029/2005JA011582. 1. Introduction [2] Realistic modeling of plasmasphere refilling is im- portant for the understanding of plasmasphere dynamics and for space weather predictions. However, our ability to model the plasmasphere refilling processes is restricted by difficulty in specifying initial distributions of the plasma density, plasma flow velocity, and plasma temperatures along depleted magnetic flux tubes. In spite of several decades of efforts, we still have little knowledge about such initial plasma conditions. As a result of this limitation, the investigation of plasmasphere refilling is based on the initial conditions chosen by individual modelers. For example, a complete empty flux tube without any plasma content or a flux tube with an artificially specified initial density distri- bution has been used in simulating the plasmasphere refill- ing [e.g., Banks et al., 1971; Singh et al., 1986; Rasmussen and Schunk, 1988; Wilson et al., 1992; Liemohn et al., 1999; Tu et al., 2003]. Nevertheless, aside from other factors, different initial flux tube density distribution may lead to different ion trapping mechanisms, i.e., distinct refilling scenarios at early stages of plasmasphere refilling [Singh and Horwitz, 1992]. Observations that measure the plasma distributions along depleted flux tubes are very valuable since they may specify initial conditions for plasmasphere refilling studies. [3] The characteristics of depleted flux tubes can be obtained by examining the flux tubes in the nightside plasmatrough, particularly those close to the nightside plasmapause. This is because when the magnetospheric convection strength reduces, the corotation electric field may supersede the convection electric field at the locations of those flux tubes. Those flux tubes will then start corotating with the Earth, and refilling of plasma from the underlying ionosphere will occur. This concept has been used in calculations of the early and late time plasmasphere refilling rates at geosynchronous orbits [Lawrence et al., 1999; Su et al., 2001]. The flux tubes in the outer plasma- sphere near the nightside plasmapause may be regarded as depleted flux tubes as well, if the plasma densities within them are substantially below the filled plasmasphere density level. Such flux tubes are equivalent to flux tubes at the early stages of the plasmasphere refilling. [4] Studies on the electron density in the plasmatrough have been conducted previously. Carpenter and Anderson [1992] developed an empirical model for the equatorial JOURNAL OF GEOPHYSICAL RESEARCH, VOL. 111, A06216, doi:10.1029/2005JA011582, 2006 Click Here for Full Articl e 1 Center for Atmospheric Research, University of Massachusetts- Lowell, Lowell, Massachusetts, USA. 2 NASA Goddard Space Flight Center, Greenbelt, Maryland, USA. Copyright 2006 by the American Geophysical Union. 0148-0227/06/2005JA011582$09.00 A06216 1 of 10
Transcript of Empirical specification of field-aligned plasma density profiles for plasmasphere refilling
Empirical specification of field-aligned plasma
density profiles for plasmasphere refilling
Jiannan Tu,1 Paul Song,1 Bodo W. Reinisch,1 James L. Green,2 and Xueqin Huang1
Received 20 December 2005; revised 15 February 2006; accepted 22 March 2006; published 29 June 2006.
[1] Sounding measurements from the radio plasma imager (RPI) on the IMAGE satelliteare used to derive electron density distributions along magnetic field lines in the nightsideplasmasphere and plasmatrough for three midlatitude passes. These passes occurredduring (1) a magnetic storm, (2) a prolonged quiet time, and (3) a sudden commencementof a storm, respectively. It is found that the density profiles of filled (in the innerplasmasphere) and depleted (in the plasmatrough or outer plasmasphere) flux tubes havedifferent field line dependence. A multivariant least squares fit with a simple analyticalfunction is used to model the density profiles. The fitting parameters in the function definethe field line dependence of a density profile, i.e., the steepness of the density profileat high latitudes and the flatness at low latitudes. In each pass the density profiles along thefilled and depleted flux tubes can be well modeled with the selected functional form, withtwo different sets of fitting parameter values for filled and depleted flux tubes. For thethree passes examined, the fitting parameter values are not sensitive to the geomagneticactivity for the inner plasmasphere density profiles but vary slightly for the plasmatroughor outer plasmasphere density profiles from case to case. The equatorial densitiesextrapolated from the measured density profiles approximately have a power law relationwith L values. The results suggest that the selected function has potential of being ableto construct realistic global empirical plasmasphere/plasmatrough models. Furthermore, itis now feasible to empirically determine the density profiles along the depleted flux tubesfor plasmasphere refilling studies.
Citation: Tu, J., P. Song, B. W. Reinisch, J. L. Green, and X. Huang (2006), Empirical specification of field-aligned plasma density
profiles for plasmasphere refilling, J. Geophys. Res., 111, A06216, doi:10.1029/2005JA011582.
1. Introduction
[2] Realistic modeling of plasmasphere refilling is im-portant for the understanding of plasmasphere dynamics andfor space weather predictions. However, our ability tomodel the plasmasphere refilling processes is restricted bydifficulty in specifying initial distributions of the plasmadensity, plasma flow velocity, and plasma temperaturesalong depleted magnetic flux tubes. In spite of severaldecades of efforts, we still have little knowledge about suchinitial plasma conditions. As a result of this limitation, theinvestigation of plasmasphere refilling is based on the initialconditions chosen by individual modelers. For example, acomplete empty flux tube without any plasma content or aflux tube with an artificially specified initial density distri-bution has been used in simulating the plasmasphere refill-ing [e.g., Banks et al., 1971; Singh et al., 1986; Rasmussenand Schunk, 1988; Wilson et al., 1992; Liemohn et al.,1999; Tu et al., 2003]. Nevertheless, aside from otherfactors, different initial flux tube density distribution may
lead to different ion trapping mechanisms, i.e., distinctrefilling scenarios at early stages of plasmasphere refilling[Singh and Horwitz, 1992]. Observations that measure theplasma distributions along depleted flux tubes are veryvaluable since they may specify initial conditions forplasmasphere refilling studies.[3] The characteristics of depleted flux tubes can be
obtained by examining the flux tubes in the nightsideplasmatrough, particularly those close to the nightsideplasmapause. This is because when the magnetosphericconvection strength reduces, the corotation electric fieldmay supersede the convection electric field at the locationsof those flux tubes. Those flux tubes will then startcorotating with the Earth, and refilling of plasma from theunderlying ionosphere will occur. This concept has beenused in calculations of the early and late time plasmasphererefilling rates at geosynchronous orbits [Lawrence et al.,1999; Su et al., 2001]. The flux tubes in the outer plasma-sphere near the nightside plasmapause may be regarded asdepleted flux tubes as well, if the plasma densities withinthem are substantially below the filled plasmasphere densitylevel. Such flux tubes are equivalent to flux tubes at theearly stages of the plasmasphere refilling.[4] Studies on the electron density in the plasmatrough
have been conducted previously. Carpenter and Anderson[1992] developed an empirical model for the equatorial
JOURNAL OF GEOPHYSICAL RESEARCH, VOL. 111, A06216, doi:10.1029/2005JA011582, 2006ClickHere
for
FullArticle
1Center for Atmospheric Research, University of Massachusetts-Lowell, Lowell, Massachusetts, USA.
2NASA Goddard Space Flight Center, Greenbelt, Maryland, USA.
Copyright 2006 by the American Geophysical Union.0148-0227/06/2005JA011582$09.00
A06216 1 of 10
electron density in the plasmasphere and plasmatrough.They showed that the equatorial density in the plasma-trough, on the average, varies as L�4.5, where L is the apexof a geomagnetic field line in Earth’s radius RE. Severalsimilar empirical relations have been developed in recentyears based on plasmaspheric and plasmatrough densityobservations [Gallagher et al., 2000; Goldstein et al., 2001;Sheeley et al., 2001; Denton et al., 2002, 2004]. In principleone may obtain the field line dependence of the plasmadensities (i.e., the density distribution along the field line)through statistically averaging of a large set of measure-ments but as such this procedure does not represent theactual field line density distribution at a given time. So farthe field line dependence is derived from the averageelectron densities measured in coarse coverage of L shellsand latitudes [e.g., Gallagher et al., 2000; Goldstein et al.,2001; Denton et al., 2002, 2004]. In addition, the plasmadistribution may vary substantially both in space and timeduring magnetic storms, compromising the values of statis-tical models. Therefore instantaneously measuring the elec-tron density distribution along a magnetic field line isnecessary in order to accurately determine the plasmadensity and its field line dependence along a depleted fluxtube.[5] Recently, the radio plasma imager (RPI) [Reinisch et
al., 2000] on the IMAGE satellite [Burch et al., 2001] hasprovided nearly instantaneous measurements of the electrondensity distribution along a magnetic field line [Reinisch etal., 2001]. A nearly instantaneously measured field-aligneddensity profile specifies the field line dependence of theelectron densities in an extended latitude range along thefield line at the time of measurement. This allows precisemodeling of the field line dependence along an entiremagnetospheric field line based on the density variationsof the measured density profile. Such measurements havebeen used to successfully construct empirical models ofelectron densities for the noon and morning sectors of theplasmasphere [Reinisch et al., 2004; Huang et al., 2004;Song et al., 2004].[6] The purpose of this paper is to apply a similar
functional form used in the above RPI studies to empiricallymodel the field-aligned density distributions in the nightsideplasmasphere and plasmatrough. We will show that thisfunctional form can represent well not only the densityprofiles in the dayside plasmasphere but also the densityprofiles along the filled and depleted flux tubes on thenightside. Therefore this functional form has potential ofbeing used to develop global empirical models of theplasmasphere/plasmatrough. In particular, it can be usedto provide initial flux tube density profiles for studying theplasmasphere refilling because the flux tubes in theplasmatrough may begin to corotate with the Earth whenthe magnetospheric convection decreases.
2. Measurements and Density InversionTechnique
[7] The design and measurement characteristics of theradio plasma imager (RPI) on the IMAGE satellite havebeen described in detail by Reinisch et al. [2000] and theinversion technique for obtaining field-aligned density pro-files has been discussed in previous studies [Reinisch et al.,
2001, 2004; Huang et al., 2004]. In brief, the RPI, in activesounding modes, transmits coded signals at varying fre-quencies from 3 kHz to 3 MHz and listens to the echoes.The received echoes are plotted in a ‘‘plasmagram’’, a color-coded display of signal amplitude as a function of frequencyand echo delay time (represented as virtual range: the echodelay time multiplied by one half of the vacuum speed oflight). Multifrequency echoes can form a distinct trace in aplasmagram. It has been shown that under certain condi-tions, the traces represent the reflected signals that propa-gate along a magnetic field line threading the satellite [seeReinisch et al., 2001; Fung and Green, 2005]. Applying astandard density inversion algorithm [Huang et al., 2004],we can derive a density distribution along a field line almostinstantaneously (in < 1 min). In passive observation modes,the RPI receives natural plasma waves. These natural plasmawave signals are displayed in conventional frequency-timespectrograms [Green and Reinisch, 2003]. The passive andactive modes are operated alternately.
3. Modeling Density Profiles of NightsideFlux Tubes
[8] In this section we examine and model field-aligneddensity profiles derived from the RPI active soundingmeasurements during three IMAGE passes of the plasma-sphere and plasmatrough around the local magnetic mid-night. We apply a functional form to model those densityprofiles separately for each pass. The functional form usedin the present study is similar to that developed by Huang etal. [2004] and Song et al. [2004]
Ne ¼ N0 Lð Þ cos�b Lð Þ p2
a Lð Þllin
� �
a Lð Þ ¼ Aþ B � L; b Lð Þ ¼ C þ D � L;ð1Þ
where l and lin are the magnetic latitude along a field lineand the invariant latitude of the field line, respectively,N0(L) is the minimum electron density of the RPI measureddensity profiles, which is the in situ electron density at thesatellite location in the cases examined in followingsubsections. Parameter a(L) describes the steepness of thedensity profiles at high latitudes, while b(L) specifies theflatness of the profiles at low latitudes. The fittingparameters A, B, C, and D are to be determined bymultivariant least squares fit to the density profiles derivedfrom the RPI sounding measurements along each of thethree IMAGE passes. The multivariant least squares fitrequires that the square sum of the difference between themeasured and modeled densities is minimized with respectto four common fitting parameters
D ¼Xi
Xj
N*eij� Neij
h i2¼ min; ð2Þ
where i and j represent the ith field line and the jth point onthe ith field line, respectively, N*eij and Neij are the measuredand modeled electron density, respectively.[9] Huang et al. [2004] have shown that this function,
with appropriate values of fitting parameters, does wellrepresent the measured density profiles along field lines
A06216 TU ET AL.: SPECIFICATION OF DEPLETED FLUX TUBE DENSITIES
2 of 10
A06216

from the southern to northern hemisphere in the filled noonand morning plasmasphere [Reinisch et al., 2004; Song etal., 2004]. We will show that this function can as well beused to model the density profiles of depleted plasmasphericflux tubes. We take the density profile (solid line) inFigure 1, derived from the RPI sounding measurementsduring a magnetic storm, on 1 April 2001, as an example.By comparing with the quiet time density profile (dashed-dotted line) given by the empirical plasmasphere model ofReinisch et al. [2004] (with A = 1.25, B = 0, C = 0.2, D =0.03, and N0 = 1195.3 cm�3) for the same field line, we canconclude that the RPI measured density profile is for adepleted flux tube. The dotted line in Figure 1 is the leastsquares fit to the measured density profile using equation(1) with N0 = 410.5 cm�3 and the fitting constants A = 0.99,B = 0.09, C = 0.6, D = 0.1. It is seen that the fitting functionmodels the depleted density profile quite well. We concludethat this functional form is sufficiently flexible to describeboth the filled and depleted density profiles on the dayside.Next, we will show that it can also represent the field-aligned density profiles along the filled and depleted fluxtubes on the nightside.[10] In Figure 1, and in previous studies that used the
functional form given in equation (1) to model the plasma-sphere density distributions [Reinisch et al., 2004; Huang etal., 2004; Song et al., 2004], the equatorial density Neq andthe densities near the equator are constrained by themeasured density profiles. In those previously examined
cases, the RPI density profiles along the field lines werederived from one hemisphere to another because eachplasmagram contains at least two traces. One trace wasformed by echoes reflected from altitudes lower than that ofthe satellite in the local hemisphere along the field line.Another trace represented signals along the same field linebut reflected from the conjugate hemisphere. The waves inthe latter trace must have traveled across the equatorialregion along the field line [Reinisch et al., 2001]. No signalsare reflected from the equatorial region where the electrondensities are lower than that at the satellite location. Thefirst echo (with the lowest frequency) on the conjugate tracecomes from the conjugate point where the density is thesame as that at the satellite. The total electron content inthe equatorial region is known from the time delay of theconjugate lowest frequency echo. On the basis ofthe assumption that the density gradients are continuous,the densities in the equatorial region (including the equato-rial density) are interpolated with the constraint of theknown total electron content in that region [Huang et al.,2004]. When IMAGE crosses the magnetic equator, the RPIcan measure the equatorial density directly, at least at one Lshell. In the present study, the plasmagrams taken by theRPI at L > 2.7 on the nightside contain only the trace fromthe local hemisphere. Each density profile in this study isthen derived for only the local hemisphere segment of thefield line. The electron densities in the equatorial regionbeyond the latitude range of the RPI density profile,including equatorial density, are not directly derived fromthe RPI measurements but extrapolated through the multi-variant least squares fit.[11] The RPI measured density profiles examined in the
present study were obtained from 0119:03 to 0143:03 UTon 22 March 2001, from 0533:06 to 0557:06 UT on5 November 2004, and from 1417:06 to 1435:06 UT on7 November 2004. The first period was during the recoveryphase of a magnetic storm when the hourly Dst = �48 nT,while the second one was in the last day of a 5-day quietperiod. Kp index was 1 when the RPI measurements weremade on 5 November 2004 and primarily less than 3 in thepreceding 5 days. The third period was during a suddencommencement (Dst = 37 nT) of a great magnetic storm.The sudden commencement started about 3 hours before theRPI measurements. These three cases demonstrate threerepresentative plasmasphere-plasmatrough (or outer plasma-sphere) transitions observed by the IMAGE RPI. Table 1shows the times and locations at which the plasmagramswere obtained by the RPI. In this study the L shell of a fieldline is defined as the apex of the field line (in unit of theEarth’s radius RE), calculated using the Tsyganenko 2001(T01) [Tsyganenko, 2002] magnetospheric magnetic fieldmodel. The invariant latitude, lin, is defined as the averageof the magnetic latitudes of the footprints (on the ground) ofthe calculated field line in the two hemispheres. Theinvariant latitude is a parameter used in the fitting functionin order to properly limit the modeled field-aligned densityprofile to below the maximum magnetic latitudes of thefield line. Other definitions, such as the dipole invariantlatitude defined by cos2(lin) = 1/L can also be used. Usingthe other definitions of the invariant latitude will, however,result in different values of the fitting parameters A and Bfor a given measured density profile because the condition
Figure 1. Field-aligned electron density profile (solid line)derived from the RPI sounding measurements during amagnetic storm on 1 April 2001. The circle shows thelatitude of the satellite on the field line. The dashed-dottedline is the quiet time density profile from the empiricalmodel of Reinisch et al. [2004]. The dotted line is theleast squares fit to the measured density profile usingequation (1).
A06216 TU ET AL.: SPECIFICATION OF DEPLETED FLUX TUBE DENSITIES
3 of 10
A06216
a(L)l/lin < 1 must be satisfied in equation (1). Note thatequation (1) is applicable to model plasmasphere electrondensity distributions but not to underlying ionospheredensity distributions because the functional form was de-rived from the measurements of field-aligned density pro-files in the plasmasphere.
3.1. Case of 22 March 2001 (Storm Recovery Phase)
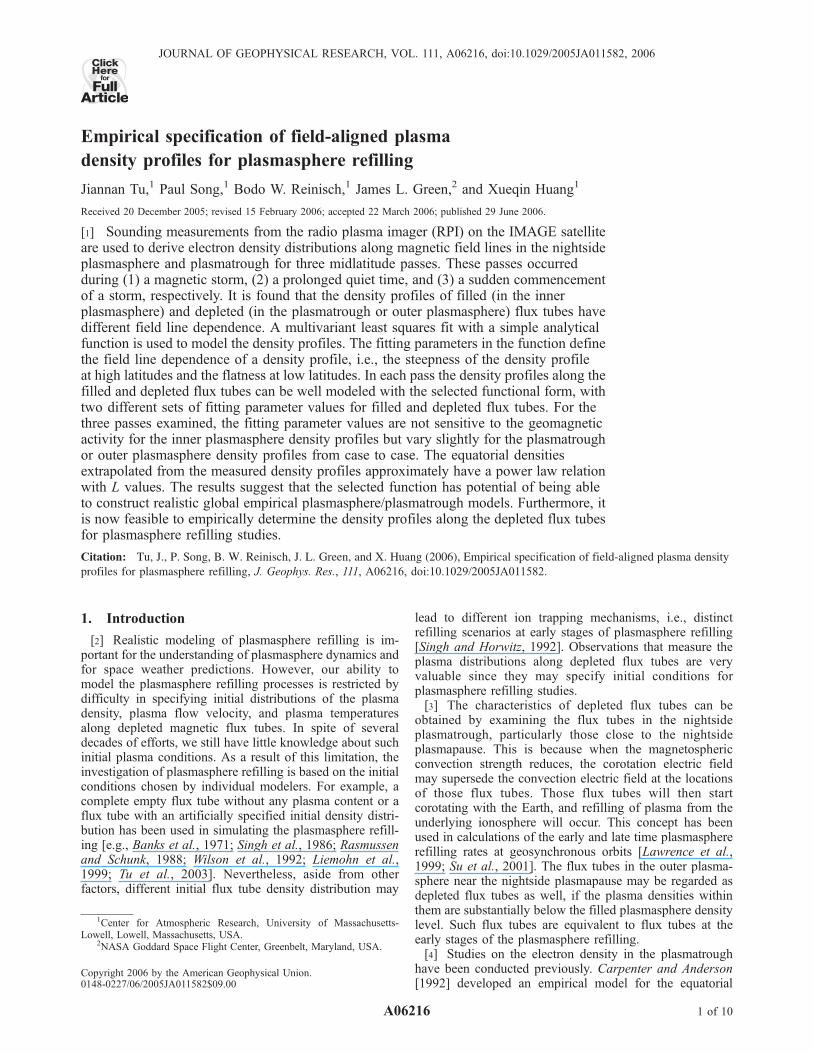
[12] We first consider the RPI measurements made from0119:03 to 0143:03 UT on 22 March 2001. Figure 2displays the density profiles derived from the RPI measure-ments for this case (solid lines). The circle at the bottom ofeach density profile indicates the satellite latitude at the timeof the measurement. In Figure 2 as well as later in Figures 6and 9, the profile number is in sequence of increasing Lshell (see Table 1). It is noted that the measured densityprofiles 1–3 in Figure 2 have a slope that is significantlydifferent from the slope of profiles 4–6: the densities of theouter three profiles increase faster with latitude along thefield lines. This suggests that in order to obtain the bestagreement between the measured and modeled densityprofiles, we need to perform multivariant least squares fitsseparately for these two groups of density profiles. Theresults of the two separate multivariant least squares fits tothe two profile groups are plotted as dotted lines in Figure 2,which show good agreement with the measured profiles forboth groups. The values of the constants A, B, C, and D, forprofiles 1–3 and profiles 4–6, are listed in Table 2. Alsolisted are the extrapolated equatorial densities Neq for all themeasured density profiles. The standard deviation of theextrapolated equatorial density is estimated to be less than20% for the dayside density profiles [Reinisch et al., 2004].This standard deviation, 20%, may be also applicable to thenightside density profiles. However, it is needed to beconfirmed by using equatorial densities actually measuredon the nightside, which are not found in the RPI measure-ments so far. The resultant parameter a(L) is independent ofL for profiles 1–3 (the constant B = 0) but weakly (B 6¼ 0but small) dependent on L for profiles 4–6. The majordifference occurs in the values of constants C and D for thetwo groups. If we used the same values of C and D for bothgroups, one group of density profiles would be poorly fit,depending on which set of values of C and D are used.[13] The difference in the field line dependence of the two
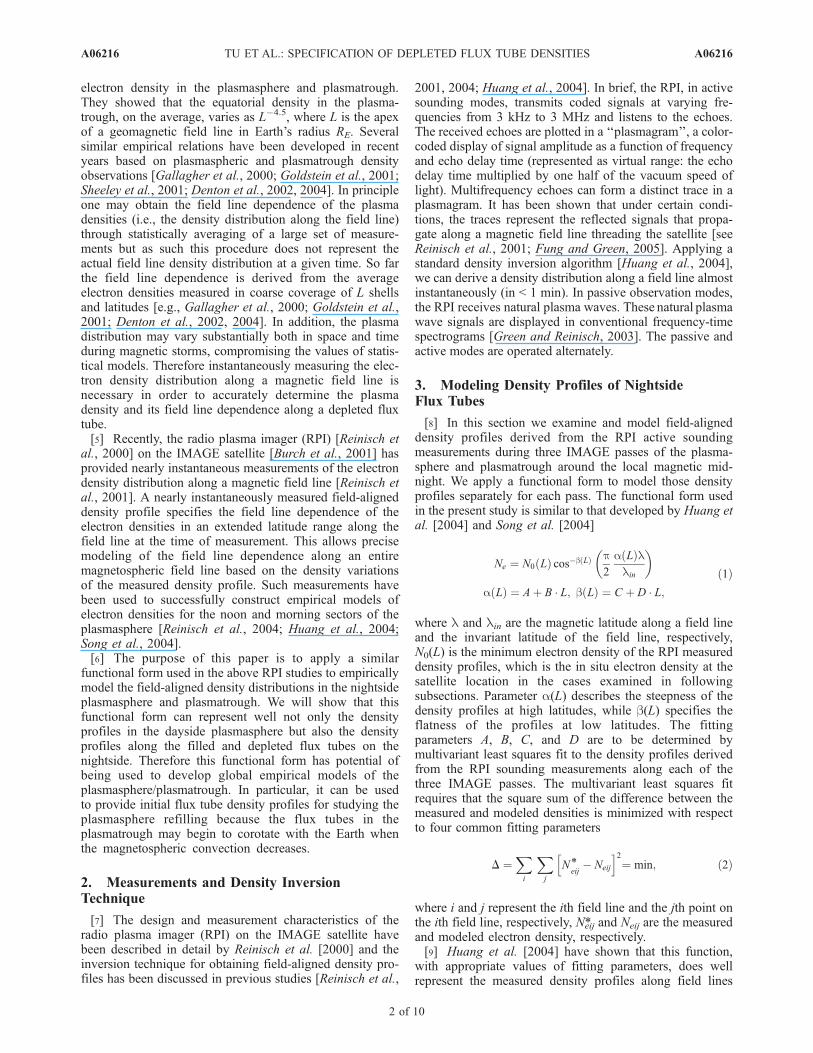
density profile groups suggests that they were measured indistinctly different plasma regions, namely, plasmasphereand plasmatrough. Figure 3 is the plot of the electrondensities along the IMAGE orbit. The in situ measureddensity reveals a decrease when the satellite moved outwardfrom the plasmasphere. Particularly, there is a steep densitydrop from 0127 to 0131 UT (from L = �2.8 to �3.2). This
Table 1. UT, Invariant Latitude, Magnetic Latitude, L Shell, and
MLT of the RPI Measurements on 22 March 2001, 5 and 7
November 2004
UT ILAT MLAT L MLT
22 March 20011 0119 48.3� 13.3� 2.23 0059:182 0123 51.6� 18.3� 2.48 0103:003 0127 54.8� 22.7� 2.78 0106:304 0131 57.8� 26.7� 3.15 0109:495 0135 60.5� 30.2� 3.59 0113:086 0143 65.2� 36.4� 4.89 0119:10
5 November 20041 0533 47.7� �19.3� 2.22 2255:082 0536 50.5� �23.8� 2.50 2258:593 0539 53.2� �27.8� 2.82 2302:574 0542 55.7� �31.4� 3.20 2306:235 0545 58.0� �34.7� 3.65 2309:156 0548 60.0� �37.7� 4.19 2312:197 0551 61.9� �40.5� 4.83 2315:178 0554 63.7� �43.0� 5.65 2318:279 0557 65.3� �45.5� 6.79 2321:25
7 November 20041 1417 35.7� �14.3� 1.65 2235:452 1420 40.2� �21.4� 1.92 2235:223 1423 44.6� �27.7� 2.28 2234:384 1426 48.6� �33.3� 2.76 2233:495 1429 52.3� �38.2� 3.36 2232:546 1432 55.6� �42.5� 4.11 2232:087 1435 58.5� �46.5� 5.03 2231:25
Figure 2. Field-aligned electron density profiles derivedfrom the RPI sounding measurements made from 0119:03to 0143:03 UT on 22 March 2001. The circle on each profileindicates the satellite location. Profile number is labeledbeside each profile. The dotted lines are the multivariantleast squares fits to the measured density profiles usingequation (1).
Table 2. Values of Fitting Parameters A, B, C, and D, and the
Extrapolated Equatorial Densities Neq (cm�3) for the Density
Profiles on 22 March 2001
UT L Neq A B C D
1 0119:03 2.23 2015.22 0123:03 2.48 1245.4 0.999 0 0.45 0.0553 0127:03 2.78 795.15 0131:03 3.15 170.46 0135:03 3.59 120.5 0.99 0.009 0.6 0.17 0143:03 4.89 34.5
A06216 TU ET AL.: SPECIFICATION OF DEPLETED FLUX TUBE DENSITIES
4 of 10
A06216
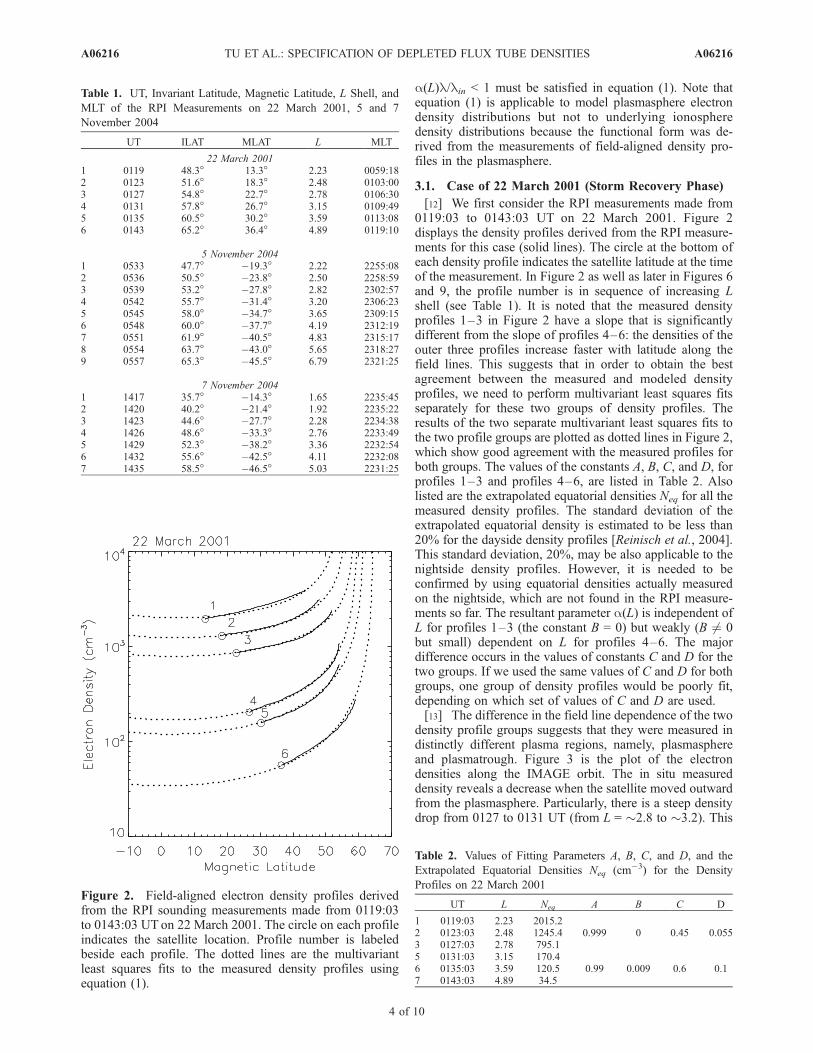
density variation along the satellite trajectory is verified byexamining the upper hybrid resonance (UHR) noise bandobserved in RPI passive mode measurements. The UHRnoise is a narrow band of electrostatic waves bounded bythe local hybrid resonance frequency (fuh) and electronplasma frequency (fpe) [e.g., Mosier et al., 1973; Bensonet al., 2004]. The RPI dynamic spectrum for the interval of0030–0230 UT on 22 March 2001 in Figure 4, clearlyshows the expected UHR band enhancement. The UHRfrequency experiences a sharp decrease from �0125 UT to�0132 UT, roughly coincident with the steep densitygradient in Figure 3 derived from RPI active measurements.Since IMAGE moved radially outward as well as towardhigher latitudes, the density variation along the IMAGEorbit is due to the combined effects of the radial distanceand latitude increases. While the density decreases whenmoving radially outward, the density should increase whenmoving to higher latitudes along a given field line, which tosome degree compensates for the density decrease due tothe radially outward motion in this case. Thus we concludethat the steep density gradient along the satellite trajectoryreally indicates crossing of a boundary, i.e., the plasma-pause. Therefore the density profiles 1–3 and 4–6 areindeed measured in different plasma regions, i.e., in theplasmasphere and plasmatrough, respectively.[14] The multivariant least squares fit results in a model
function that reproduces the measured density profiles verywell, as demonstrated by Figure 2. However, as indicated
Figure 3. Electron density along the IMAGE trajectoryfrom the RPI active sounding measurements from 0119:03to 0143:03 UT on 22 March 2001. L values are also markedunder abscissa.
Figure 4. Dynamic spectrum obtained by the RPI during the interval of 0030–0230 UT on 22 March2001. A UHR noise band is clearly displayed. The frequency of the band decreases sharply from about0126 UT to 0132 UT, as indicated by two arrows. The red line is electron cyclotron frequency calculatedfrom T01 [Tsyganenko, 2002] magnetospheric magnetic field model.
A06216 TU ET AL.: SPECIFICATION OF DEPLETED FLUX TUBE DENSITIES
5 of 10
A06216
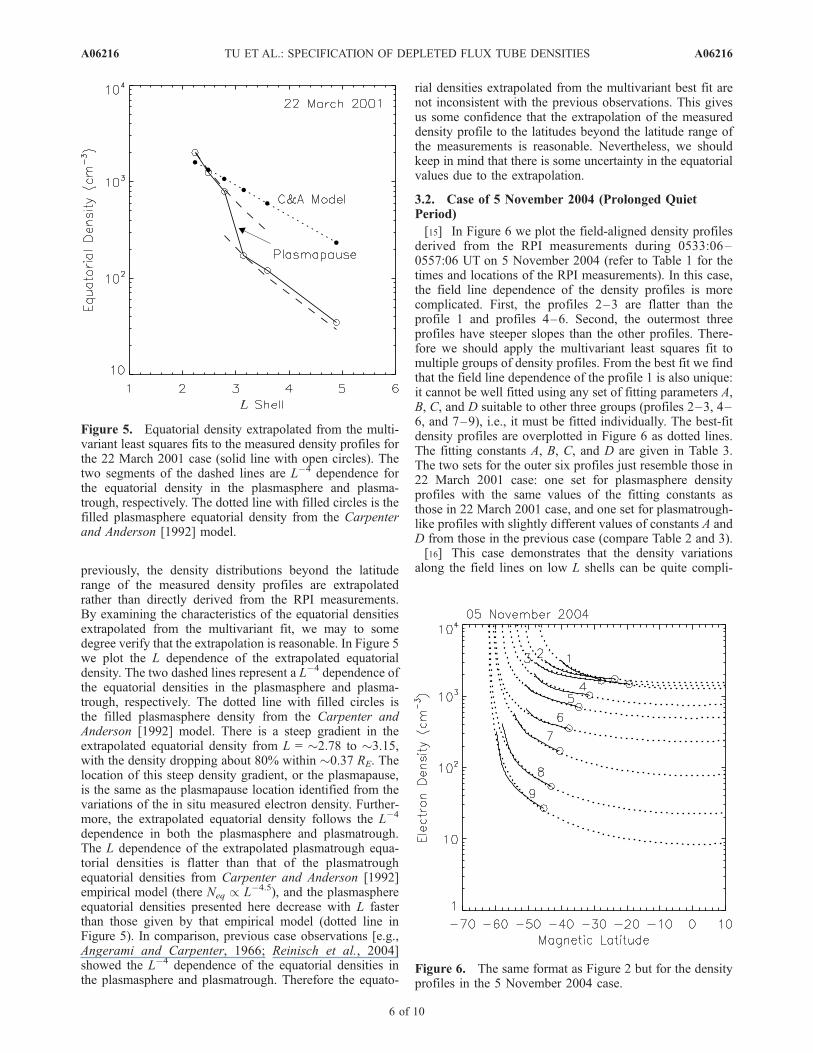
previously, the density distributions beyond the latituderange of the measured density profiles are extrapolatedrather than directly derived from the RPI measurements.By examining the characteristics of the equatorial densitiesextrapolated from the multivariant fit, we may to somedegree verify that the extrapolation is reasonable. In Figure 5we plot the L dependence of the extrapolated equatorialdensity. The two dashed lines represent a L�4 dependence ofthe equatorial densities in the plasmasphere and plasma-trough, respectively. The dotted line with filled circles isthe filled plasmasphere density from the Carpenter andAnderson [1992] model. There is a steep gradient in theextrapolated equatorial density from L = �2.78 to �3.15,with the density dropping about 80% within �0.37 RE. Thelocation of this steep density gradient, or the plasmapause,is the same as the plasmapause location identified from thevariations of the in situ measured electron density. Further-more, the extrapolated equatorial density follows the L�4
dependence in both the plasmasphere and plasmatrough.The L dependence of the extrapolated plasmatrough equa-torial densities is flatter than that of the plasmatroughequatorial densities from Carpenter and Anderson [1992]empirical model (there Neq / L�4.5), and the plasmasphereequatorial densities presented here decrease with L fasterthan those given by that empirical model (dotted line inFigure 5). In comparison, previous case observations [e.g.,Angerami and Carpenter, 1966; Reinisch et al., 2004]showed the L�4 dependence of the equatorial densities inthe plasmasphere and plasmatrough. Therefore the equato-
rial densities extrapolated from the multivariant best fit arenot inconsistent with the previous observations. This givesus some confidence that the extrapolation of the measureddensity profile to the latitudes beyond the latitude range ofthe measurements is reasonable. Nevertheless, we shouldkeep in mind that there is some uncertainty in the equatorialvalues due to the extrapolation.
3.2. Case of 5 November 2004 (Prolonged QuietPeriod)
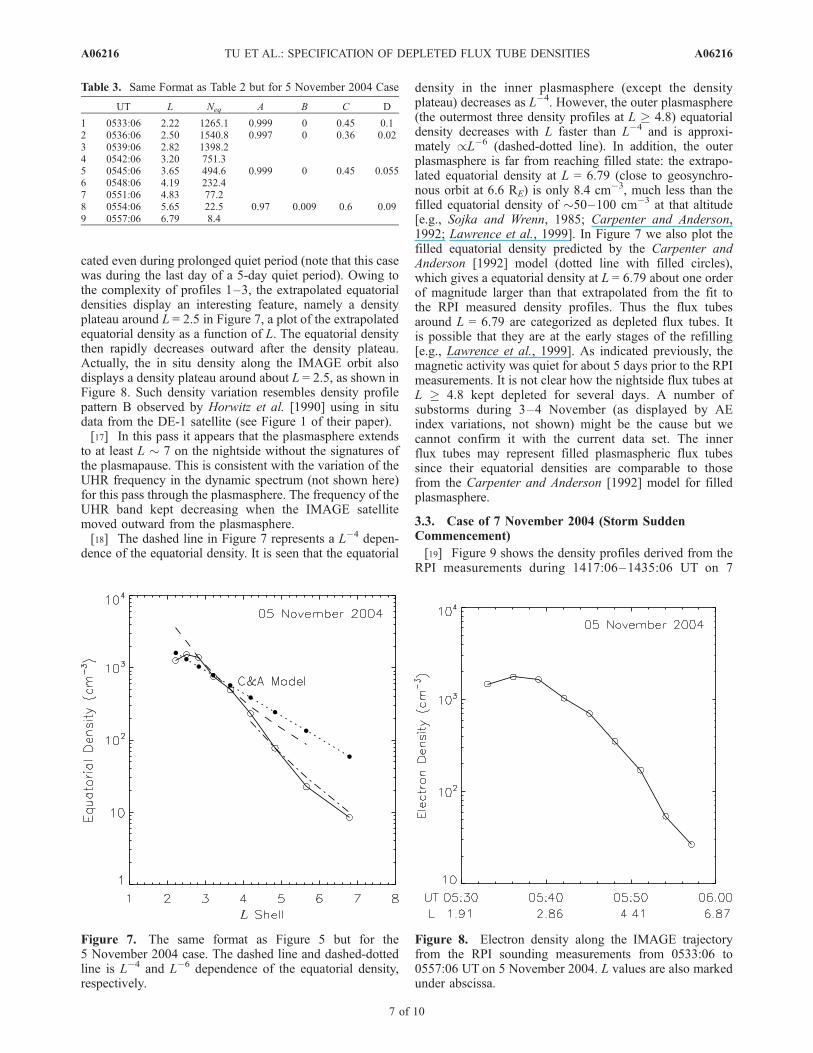
[15] In Figure 6 we plot the field-aligned density profilesderived from the RPI measurements during 0533:06–0557:06 UT on 5 November 2004 (refer to Table 1 for thetimes and locations of the RPI measurements). In this case,the field line dependence of the density profiles is morecomplicated. First, the profiles 2–3 are flatter than theprofile 1 and profiles 4–6. Second, the outermost threeprofiles have steeper slopes than the other profiles. There-fore we should apply the multivariant least squares fit tomultiple groups of density profiles. From the best fit we findthat the field line dependence of the profile 1 is also unique:it cannot be well fitted using any set of fitting parameters A,B, C, and D suitable to other three groups (profiles 2–3, 4–6, and 7–9), i.e., it must be fitted individually. The best-fitdensity profiles are overplotted in Figure 6 as dotted lines.The fitting constants A, B, C, and D are given in Table 3.The two sets for the outer six profiles just resemble those in22 March 2001 case: one set for plasmasphere densityprofiles with the same values of the fitting constants asthose in 22 March 2001 case, and one set for plasmatrough-like profiles with slightly different values of constants A andD from those in the previous case (compare Table 2 and 3).[16] This case demonstrates that the density variations
along the field lines on low L shells can be quite compli-
Figure 5. Equatorial density extrapolated from the multi-variant least squares fits to the measured density profiles forthe 22 March 2001 case (solid line with open circles). Thetwo segments of the dashed lines are L�4 dependence forthe equatorial density in the plasmasphere and plasma-trough, respectively. The dotted line with filled circles is thefilled plasmasphere equatorial density from the Carpenterand Anderson [1992] model.
Figure 6. The same format as Figure 2 but for the densityprofiles in the 5 November 2004 case.
A06216 TU ET AL.: SPECIFICATION OF DEPLETED FLUX TUBE DENSITIES
6 of 10
A06216
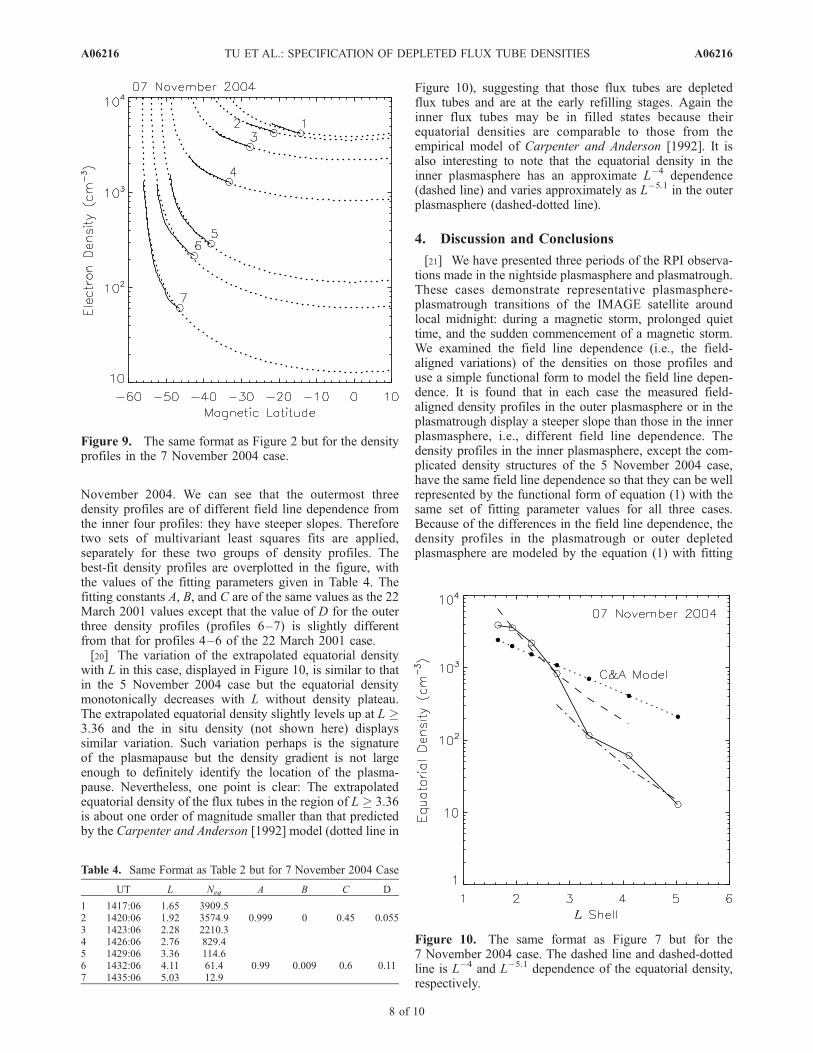
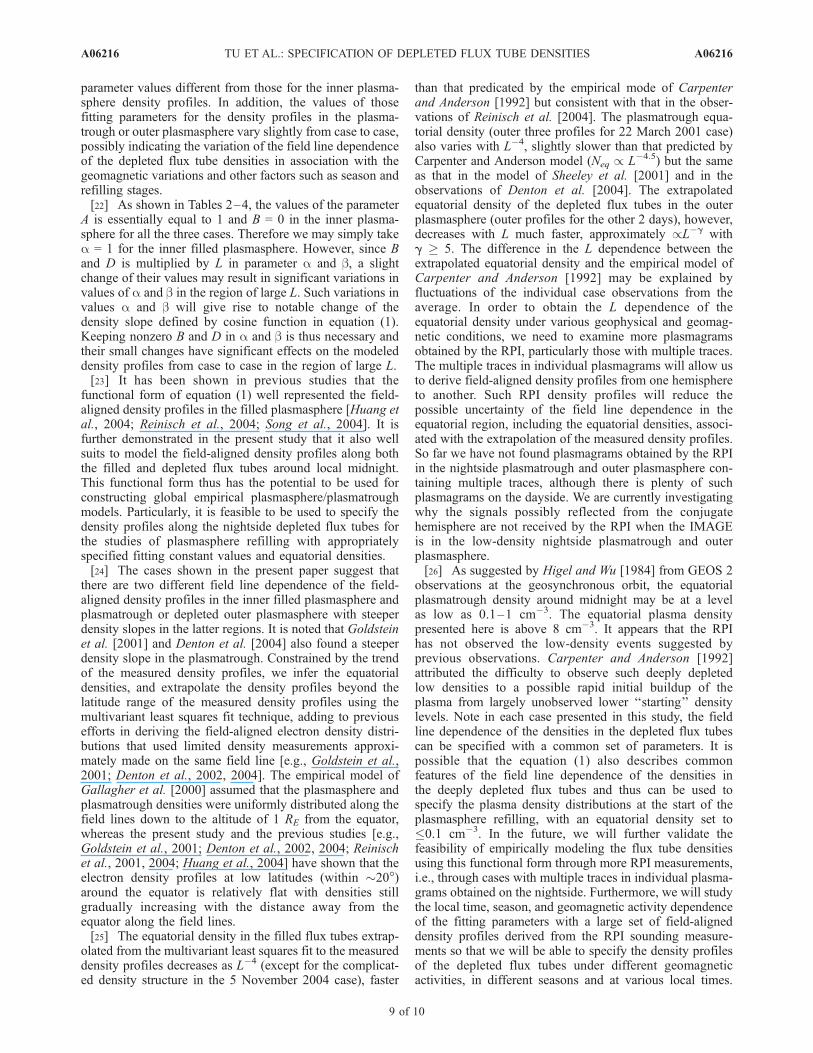
cated even during prolonged quiet period (note that this casewas during the last day of a 5-day quiet period). Owing tothe complexity of profiles 1–3, the extrapolated equatorialdensities display an interesting feature, namely a densityplateau around L = 2.5 in Figure 7, a plot of the extrapolatedequatorial density as a function of L. The equatorial densitythen rapidly decreases outward after the density plateau.Actually, the in situ density along the IMAGE orbit alsodisplays a density plateau around about L = 2.5, as shown inFigure 8. Such density variation resembles density profilepattern B observed by Horwitz et al. [1990] using in situdata from the DE-1 satellite (see Figure 1 of their paper).[17] In this pass it appears that the plasmasphere extends
to at least L � 7 on the nightside without the signatures ofthe plasmapause. This is consistent with the variation of theUHR frequency in the dynamic spectrum (not shown here)for this pass through the plasmasphere. The frequency of theUHR band kept decreasing when the IMAGE satellitemoved outward from the plasmasphere.[18] The dashed line in Figure 7 represents a L�4 depen-
dence of the equatorial density. It is seen that the equatorial
density in the inner plasmasphere (except the densityplateau) decreases as L�4. However, the outer plasmasphere(the outermost three density profiles at L 4.8) equatorialdensity decreases with L faster than L�4 and is approxi-mately /L�6 (dashed-dotted line). In addition, the outerplasmasphere is far from reaching filled state: the extrapo-lated equatorial density at L = 6.79 (close to geosynchro-nous orbit at 6.6 RE) is only 8.4 cm�3, much less than thefilled equatorial density of �50–100 cm�3 at that altitude[e.g., Sojka and Wrenn, 1985; Carpenter and Anderson,1992; Lawrence et al., 1999]. In Figure 7 we also plot thefilled equatorial density predicted by the Carpenter andAnderson [1992] model (dotted line with filled circles),which gives a equatorial density at L = 6.79 about one orderof magnitude larger than that extrapolated from the fit tothe RPI measured density profiles. Thus the flux tubesaround L = 6.79 are categorized as depleted flux tubes. Itis possible that they are at the early stages of the refilling[e.g., Lawrence et al., 1999]. As indicated previously, themagnetic activity was quiet for about 5 days prior to the RPImeasurements. It is not clear how the nightside flux tubes atL 4.8 kept depleted for several days. A number ofsubstorms during 3–4 November (as displayed by AEindex variations, not shown) might be the cause but wecannot confirm it with the current data set. The innerflux tubes may represent filled plasmaspheric flux tubessince their equatorial densities are comparable to thosefrom the Carpenter and Anderson [1992] model for filledplasmasphere.
3.3. Case of 7 November 2004 (Storm SuddenCommencement)
[19] Figure 9 shows the density profiles derived from theRPI measurements during 1417:06–1435:06 UT on 7
Table 3. Same Format as Table 2 but for 5 November 2004 Case
UT L Neq A B C D
1 0533:06 2.22 1265.1 0.999 0 0.45 0.12 0536:06 2.50 1540.8 0.997 0 0.36 0.023 0539:06 2.82 1398.24 0542:06 3.20 751.35 0545:06 3.65 494.6 0.999 0 0.45 0.0556 0548:06 4.19 232.47 0551:06 4.83 77.28 0554:06 5.65 22.5 0.97 0.009 0.6 0.099 0557:06 6.79 8.4
Figure 7. The same format as Figure 5 but for the5 November 2004 case. The dashed line and dashed-dottedline is L�4 and L�6 dependence of the equatorial density,respectively.
Figure 8. Electron density along the IMAGE trajectoryfrom the RPI sounding measurements from 0533:06 to0557:06 UT on 5 November 2004. L values are also markedunder abscissa.
A06216 TU ET AL.: SPECIFICATION OF DEPLETED FLUX TUBE DENSITIES
7 of 10
A06216
November 2004. We can see that the outermost threedensity profiles are of different field line dependence fromthe inner four profiles: they have steeper slopes. Thereforetwo sets of multivariant least squares fits are applied,separately for these two groups of density profiles. Thebest-fit density profiles are overplotted in the figure, withthe values of the fitting parameters given in Table 4. Thefitting constants A, B, and C are of the same values as the 22March 2001 values except that the value of D for the outerthree density profiles (profiles 6–7) is slightly differentfrom that for profiles 4–6 of the 22 March 2001 case.[20] The variation of the extrapolated equatorial density
with L in this case, displayed in Figure 10, is similar to thatin the 5 November 2004 case but the equatorial densitymonotonically decreases with L without density plateau.The extrapolated equatorial density slightly levels up at L 3.36 and the in situ density (not shown here) displayssimilar variation. Such variation perhaps is the signatureof the plasmapause but the density gradient is not largeenough to definitely identify the location of the plasma-pause. Nevertheless, one point is clear: The extrapolatedequatorial density of the flux tubes in the region of L 3.36is about one order of magnitude smaller than that predictedby the Carpenter and Anderson [1992] model (dotted line in
Figure 10), suggesting that those flux tubes are depletedflux tubes and are at the early refilling stages. Again theinner flux tubes may be in filled states because theirequatorial densities are comparable to those from theempirical model of Carpenter and Anderson [1992]. It isalso interesting to note that the equatorial density in theinner plasmasphere has an approximate L�4 dependence(dashed line) and varies approximately as L�5.1 in the outerplasmasphere (dashed-dotted line).
4. Discussion and Conclusions
[21] We have presented three periods of the RPI observa-tions made in the nightside plasmasphere and plasmatrough.These cases demonstrate representative plasmasphere-plasmatrough transitions of the IMAGE satellite aroundlocal midnight: during a magnetic storm, prolonged quiettime, and the sudden commencement of a magnetic storm.We examined the field line dependence (i.e., the field-aligned variations) of the densities on those profiles anduse a simple functional form to model the field line depen-dence. It is found that in each case the measured field-aligned density profiles in the outer plasmasphere or in theplasmatrough display a steeper slope than those in the innerplasmasphere, i.e., different field line dependence. Thedensity profiles in the inner plasmasphere, except the com-plicated density structures of the 5 November 2004 case,have the same field line dependence so that they can be wellrepresented by the functional form of equation (1) with thesame set of fitting parameter values for all three cases.Because of the differences in the field line dependence, thedensity profiles in the plasmatrough or outer depletedplasmasphere are modeled by the equation (1) with fitting
Figure 9. The same format as Figure 2 but for the densityprofiles in the 7 November 2004 case.
Table 4. Same Format as Table 2 but for 7 November 2004 Case
UT L Neq A B C D
1 1417:06 1.65 3909.52 1420:06 1.92 3574.9 0.999 0 0.45 0.0553 1423:06 2.28 2210.34 1426:06 2.76 829.45 1429:06 3.36 114.66 1432:06 4.11 61.4 0.99 0.009 0.6 0.117 1435:06 5.03 12.9
Figure 10. The same format as Figure 7 but for the7 November 2004 case. The dashed line and dashed-dottedline is L�4 and L�5.1 dependence of the equatorial density,respectively.
A06216 TU ET AL.: SPECIFICATION OF DEPLETED FLUX TUBE DENSITIES
8 of 10
A06216
parameter values different from those for the inner plasma-sphere density profiles. In addition, the values of thosefitting parameters for the density profiles in the plasma-trough or outer plasmasphere vary slightly from case to case,possibly indicating the variation of the field line dependenceof the depleted flux tube densities in association with thegeomagnetic variations and other factors such as season andrefilling stages.[22] As shown in Tables 2–4, the values of the parameter
A is essentially equal to 1 and B = 0 in the inner plasma-sphere for all the three cases. Therefore we may simply takea = 1 for the inner filled plasmasphere. However, since Band D is multiplied by L in parameter a and b, a slightchange of their values may result in significant variations invalues of a and b in the region of large L. Such variations invalues a and b will give rise to notable change of thedensity slope defined by cosine function in equation (1).Keeping nonzero B and D in a and b is thus necessary andtheir small changes have significant effects on the modeleddensity profiles from case to case in the region of large L.[23] It has been shown in previous studies that the
functional form of equation (1) well represented the field-aligned density profiles in the filled plasmasphere [Huang etal., 2004; Reinisch et al., 2004; Song et al., 2004]. It isfurther demonstrated in the present study that it also wellsuits to model the field-aligned density profiles along boththe filled and depleted flux tubes around local midnight.This functional form thus has the potential to be used forconstructing global empirical plasmasphere/plasmatroughmodels. Particularly, it is feasible to be used to specify thedensity profiles along the nightside depleted flux tubes forthe studies of plasmasphere refilling with appropriatelyspecified fitting constant values and equatorial densities.[24] The cases shown in the present paper suggest that
there are two different field line dependence of the field-aligned density profiles in the inner filled plasmasphere andplasmatrough or depleted outer plasmasphere with steeperdensity slopes in the latter regions. It is noted that Goldsteinet al. [2001] and Denton et al. [2004] also found a steeperdensity slope in the plasmatrough. Constrained by the trendof the measured density profiles, we infer the equatorialdensities, and extrapolate the density profiles beyond thelatitude range of the measured density profiles using themultivariant least squares fit technique, adding to previousefforts in deriving the field-aligned electron density distri-butions that used limited density measurements approxi-mately made on the same field line [e.g., Goldstein et al.,2001; Denton et al., 2002, 2004]. The empirical model ofGallagher et al. [2000] assumed that the plasmasphere andplasmatrough densities were uniformly distributed along thefield lines down to the altitude of 1 RE from the equator,whereas the present study and the previous studies [e.g.,Goldstein et al., 2001; Denton et al., 2002, 2004; Reinischet al., 2001, 2004; Huang et al., 2004] have shown that theelectron density profiles at low latitudes (within �20�)around the equator is relatively flat with densities stillgradually increasing with the distance away from theequator along the field lines.[25] The equatorial density in the filled flux tubes extrap-
olated from the multivariant least squares fit to the measureddensity profiles decreases as L�4 (except for the complicat-ed density structure in the 5 November 2004 case), faster
than that predicated by the empirical mode of Carpenterand Anderson [1992] but consistent with that in the obser-vations of Reinisch et al. [2004]. The plasmatrough equa-torial density (outer three profiles for 22 March 2001 case)also varies with L�4, slightly slower than that predicted byCarpenter and Anderson model (Neq / L�4.5) but the sameas that in the model of Sheeley et al. [2001] and in theobservations of Denton et al. [2004]. The extrapolatedequatorial density of the depleted flux tubes in the outerplasmasphere (outer profiles for the other 2 days), however,decreases with L much faster, approximately /L�g withg 5. The difference in the L dependence between theextrapolated equatorial density and the empirical model ofCarpenter and Anderson [1992] may be explained byfluctuations of the individual case observations from theaverage. In order to obtain the L dependence of theequatorial density under various geophysical and geomag-netic conditions, we need to examine more plasmagramsobtained by the RPI, particularly those with multiple traces.The multiple traces in individual plasmagrams will allow usto derive field-aligned density profiles from one hemisphereto another. Such RPI density profiles will reduce thepossible uncertainty of the field line dependence in theequatorial region, including the equatorial densities, associ-ated with the extrapolation of the measured density profiles.So far we have not found plasmagrams obtained by the RPIin the nightside plasmatrough and outer plasmasphere con-taining multiple traces, although there is plenty of suchplasmagrams on the dayside. We are currently investigatingwhy the signals possibly reflected from the conjugatehemisphere are not received by the RPI when the IMAGEis in the low-density nightside plasmatrough and outerplasmasphere.[26] As suggested by Higel and Wu [1984] from GEOS 2
observations at the geosynchronous orbit, the equatorialplasmatrough density around midnight may be at a levelas low as 0.1–1 cm�3. The equatorial plasma densitypresented here is above 8 cm�3. It appears that the RPIhas not observed the low-density events suggested byprevious observations. Carpenter and Anderson [1992]attributed the difficulty to observe such deeply depletedlow densities to a possible rapid initial buildup of theplasma from largely unobserved lower ‘‘starting’’ densitylevels. Note in each case presented in this study, the fieldline dependence of the densities in the depleted flux tubescan be specified with a common set of parameters. It ispossible that the equation (1) also describes commonfeatures of the field line dependence of the densities inthe deeply depleted flux tubes and thus can be used tospecify the plasma density distributions at the start of theplasmasphere refilling, with an equatorial density set to�0.1 cm�3. In the future, we will further validate thefeasibility of empirically modeling the flux tube densitiesusing this functional form through more RPI measurements,i.e., through cases with multiple traces in individual plasma-grams obtained on the nightside. Furthermore, we will studythe local time, season, and geomagnetic activity dependenceof the fitting parameters with a large set of field-aligneddensity profiles derived from the RPI sounding measure-ments so that we will be able to specify the density profilesof the depleted flux tubes under different geomagneticactivities, in different seasons and at various local times.
A06216 TU ET AL.: SPECIFICATION OF DEPLETED FLUX TUBE DENSITIES
9 of 10
A06216
Finally, we point out that the density distribution given byequation (1) has a density minimum at the equator andhence excludes the possibility of a density peak at theequator, which we have not found any evidence in all theRPI observations we have examined so far.
[27] Acknowledgments. This work was supported by NASA undersubcontract 83822 from the Southwest Research Institute and by NSF grantNSF-ATM 0518227 to the University of Massachusetts-Lowell. The WorldData Center for Geomagnetism (WDC-C2) at Kyoto University, Japanprovided the Dst data. The ACE solar wind/IMF data were obtained fromthe CDAWeb system. We acknowledge the plasmagrams analysis supportprovided by I. A. Galkin and G. Khmyrov.[28] Zuyin Pu thanks Richard Denton and another referee for their
assistance in evaluating this paper.
ReferencesAngerami, J. J., and D. L. Carpenter (1966), Whistler studies of the plas-mapause in the magnetosphere: 2. Electron density and total tube electroncontent near the knee in magnetospheric ionization, J. Geophys. Res., 71,711–725.
Banks, P. M., A. F. Nagy, and W. I. Axford (1971), Dynamical behavior ofthermal protons in the mid-latitude ionosphere and magnetosphere, Pla-net. Space Sci., 19, 1053–1067.
Benson, R. F., P. A. Webb, J. L. Green, L. Garcia, and B. W. Reinisch(2004), Magnetospheric electron densities inferred from upper-hybridband emissions, Geophys. Res. Lett., 31, L20803, doi:10.1029/2004GL020847.
Burch, J. L., et al. (2001), Views of Earth’s magnetosphere with the IM-AGE satellite, Science, 291, 619.
Carpenter, D. L., and R. R. Anderson (1992), An ISEE/whister model ofequatorial electron density in the magnetosphere, J. Geophys. Res., 97,1097–1108.
Denton, R. E., J. Goldstein, and J. D. Menietti (2002), Field line depen-dence of magnetospheric electron density, Geophys. Res. Lett., 29(24),2205, doi:10.1029/2002GL015963.
Denton, R. E., J. D. Menietti, J. Goldstein, S. L. Young, and R. R. Anderson(2004), Electron density in the magnetosphere, J. Geophys. Res., 109,A09215, doi:10.1029/2003JA010245.
Fung, S. F., and J. L. Green (2005), Modeling of field-aligned radio echoesin the plasmasphere, J. Geophys. Res., 110, A01210, doi:10.1029/2004JA010658.
Gallagher, D. L., P. D. Craven, and R. H. Comfort (2000), Global coreplasma model, J. Geophys. Res., 105, 18,819–18,833.
Goldstein, J., R. E. Denton, M. K. Hudson, E. G. Miftakhova, S. L. Young,J. D. Menietti, and D. L. Gallagher (2001), Latitudinal density depen-dence of magnetic field lines inferred from Polar plasma wave data, J.Geophys. Res., 106, 6195–6201.
Green, J. L., and B. W. Reinisch (2003), An overview of results from RPI,Space Sci. Rev., 109, 183–210.
Higel, B., and L. Wu (1984), Electron density and plasmapause character-istics at 6.6 Earth radii: A statistical study of the GEOS 2 relaxationsounder data, J. Geophys. Res., 89, 1583–1601.
Horwitz, J. L., R. H. Comfort, and C. R. Chappell (1990), A statisticalcharacterization of plasmasphere density structure and boundary loca-tions, J. Geophys. Res., 95, 7937–7947.
Huang, X., B. W. Reinisch, P. Song, J. L. Green, and D. L. Gallagher(2004), Developing an empirical density model of the plasmasphere usingIMAGE/RPI observations, Adv. Space Res., 33, 829–833.
Lawrence, D. J., M. F. Thomsen, J. E. Borovsky, and D. J. McComas(1999), Measurements of early and late time plasmasphere refilling asobserved from geosynchronous orbit, J. Geophys. Res., 104, 14,691–14,704.
Liemohn, M. W., G. V. Khazanov, P. D. Craven, and J. U. Kozyra (1999),Nonlinear kinetic modeling of early stage plasmaspheric refilling,J. Geophys. Res., 104, 10,295–10,306.
Mosier, S. R., M. L. Kaiser, and L. W. Brown (1973), Observations of noisebands associated with the upper hybrid resonance by the IMP 6 radioastronomy experiment, J. Geophys. Res., 78, 1673–1679.
Rasmussen, C. E., and R. W. Schunk (1988), Multistream hydrodynamicmodeling of interhemispheric plasma flow, J. Geophys. Res., 93, 14,557–14,565.
Reinisch, B. W., et al. (2000), The Radio Plasma Imager investigation onthe IMAGE spacecraft, Space Sci. Rev., 91, 319–359.
Reinisch, B. W., X. Huang, P. Song, G. S. Sales, S. F. Fung, J. L. Green,D. L. Gallagher, and V. M. Vasyliunas (2001), Plasma density distributionalong the magnetospheric field: RPI observations from IMAGE, Geo-phys. Res. Lett., 28, 4521–4524.
Reinisch, B. W., X. Huang, P. Song, J. L. Green, S. F. Fung, V. M.Vasyliunas, D. L. Gallagher, and B. R. Sandel (2004), Plasmasphericmass loss and refilling as a result of a magnetic storm, J. Geophys.Res., 109, A01202, doi:10.1029/2003JA009948.
Sheeley, B. W., M. B. Moldwin, H. K. Rassoul, and R. R. Anderson (2001),An empirical plasmasphere and trough density model: CRRES observa-tions, J. Geophys. Res., 106, 25,631–25,641.
Singh, N., and J. L. Horwitz (1992), Plasmasphere refilling: Recent obser-vations and modeling, J. Geophys. Res., 97, 1049–1079.
Singh, N., R. W. Schunk, and H. Thiemann (1986), Temporal features ofthe refilling of a plasmaspheric flux tube, J. Geophys. Res., 91, 13,433–13,454.
Sojka, J. J., and G. L. Wrenn (1985), Refilling of geosynchronous fluxtubes as observed at the equator by GEOS 2, J. Geophys. Res., 90,6379–6385.
Song, P., B. W. Reinisch, and X. Huang (2004), Magnetospheric activewave measurements, COSPAR Colloq. Ser., 16, 235–246.
Su, Y.-J., M. F. Thomsen, J. E. Borovsky, R. C. Elphic, D. J. Lawrence, andD. J. McComas (2001), Plasmaspheric observations at geosynchronousorbit, J. Atmos. Sol. Terr. Phys., 63, 1185–1197.
Tsyganenko, N. A. (2002), A model of magnetosphere with a dawn-duskasymmetry, 2. Parameterization and fitting to observations, J. Geophys.Res., 107(A7), 1176, doi:10.1029/2001JA000220.
Tu, J.-N., J. L. Horwitz, P. Song, X.-Q. Huang, B. W. Reinisch, and P. G.Richards (2003), Simulating plasmaspheric field-aligned density profilesmeasured with IMAGE/RPI: Effects of plasmasphere refilling and ionheating, J. Geophys. Res., 108(A1), 1017, doi:10.1029/2002JA009468.
Wilson, G. R., J. L. Horwitz, and J. Lin (1992), A semikinetic modelfor early stage plasmasphere refilling: 1. Effects of Coulomb collisions,J. Geophys. Res., 97, 1109–1119.
�����������������������J. L. Green, NASA Goddard Space Flight Center, MC 630, Bldg 26,
Greenbelt, MD 20771, USA.X. Huang, B. W. Reinisch, P. Song, and J. Tu, Center for Atmospheric
Research, University of Massachusetts-Lowell, 600 Suffolk Street, Lowell,MA 01854, USA. ([email protected])
A06216 TU ET AL.: SPECIFICATION OF DEPLETED FLUX TUBE DENSITIES
10 of 10
A06216