Emissions from navigation and fishing including international ...
36
Agreement: 309 1112 Commissioned by the Swedish Environmental Protection Agency SMED Report No 129 2011 Emissions from navigation and fishing including international bunkers Quality assurance of emissions 1990-2010 for reporting to UNFCCC, NEC and CLRTAP Veronica Eklund and Maria Lidén, Statistics Sweden Christian Asker and David Segersson, Swedish Meteorological and Hydrological Institute
-
Upload
khangminh22 -
Category
Documents
-
view
1 -
download
0
Transcript of Emissions from navigation and fishing including international ...
Agreement: 309 1112
Commissioned by the Swedish Environmental Protection Agency
SMED Report No 129 2011
Emissions from navigation and fishing including international
bunkers
Quality assurance of emissions 1990-2010 for reporting to
UNFCCC, NEC and CLRTAP
Veronica Eklund and Maria Lidén, Statistics Sweden
Christian Asker and David Segersson,
Swedish Meteorological and Hydrological Institute
Published at: www.smed.se
Publisher: Swedish Meteorological and Hydrological Institute
Address: SE-601 76 Norrköping, Sweden
Start year: 2006
ISSN: 1653-8102
SMED is short for Swedish Environmental Emissions Data, which is a collaboration between IVL
Swedish Environmental Research Institute, SCB Statistics Sweden, SLU Swedish University of
Agricultural Sciences, and SMHI Swedish Meteorological and Hydrological Institute. The work
co-operation within SMED commenced during 2001 with the long-term aim of acquiring and
developing expertise within emission statistics. Through a long-term contract for the Swedish
Environmental Protection Agency extending until 2014, SMED is heavily involved in all work
related to Sweden's international reporting obligations on emissions to air and water, waste and
hazardous substances. A central objective of the SMED collaboration is to develop and operate
national emission databases and offer related services to clients such as national, regional and
local governmental authorities, air and water quality management districts, as well as industry.
For more information visit SMED's website www.smed.se.
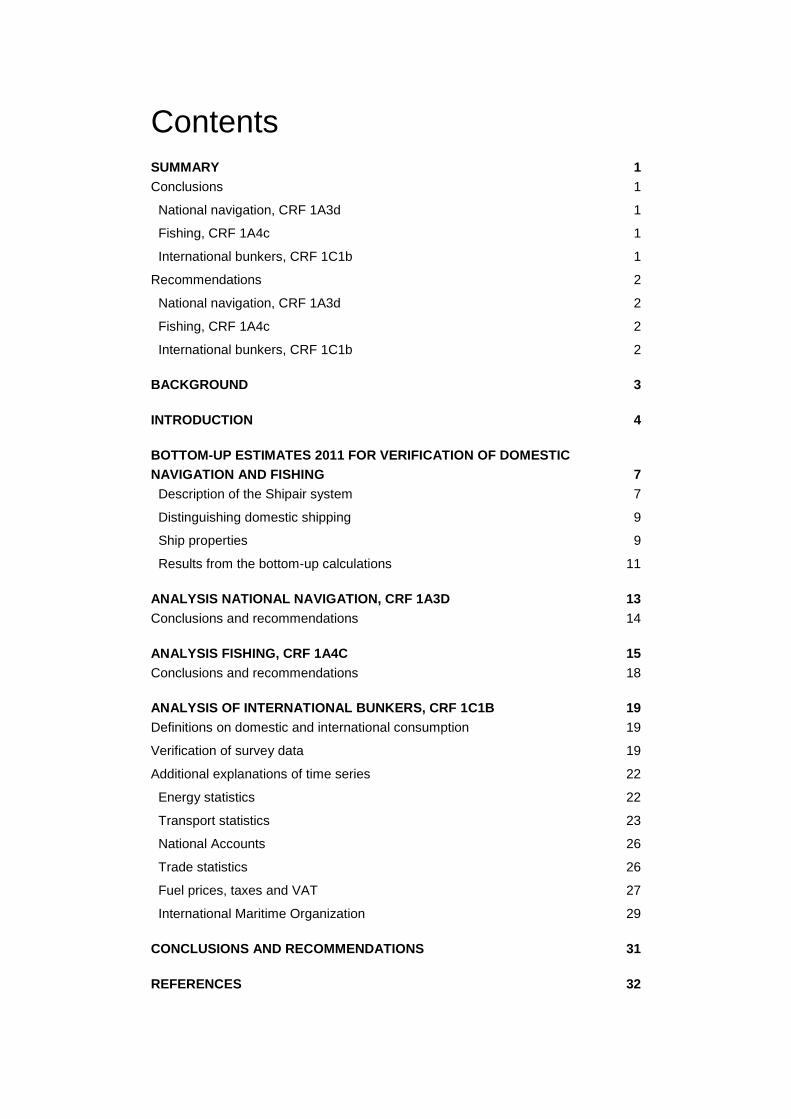
Contents
SUMMARY 1
Conclusions 1
National navigation, CRF 1A3d 1
Fishing, CRF 1A4c 1
International bunkers, CRF 1C1b 1
Recommendations 2
National navigation, CRF 1A3d 2
Fishing, CRF 1A4c 2
International bunkers, CRF 1C1b 2
BACKGROUND 3
INTRODUCTION 4
BOTTOM-UP ESTIMATES 2011 FOR VERIFICATION OF DOMESTIC
NAVIGATION AND FISHING 7
Description of the Shipair system 7
Distinguishing domestic shipping 9
Ship properties 9
Results from the bottom-up calculations 11
ANALYSIS NATIONAL NAVIGATION, CRF 1A3D 13
Conclusions and recommendations 14
ANALYSIS FISHING, CRF 1A4C 15
Conclusions and recommendations 18
ANALYSIS OF INTERNATIONAL BUNKERS, CRF 1C1B 19
Definitions on domestic and international consumption 19
Verification of survey data 19
Additional explanations of time series 22
Energy statistics 22
Transport statistics 23
National Accounts 26
Trade statistics 26
Fuel prices, taxes and VAT 27
International Maritime Organization 29
CONCLUSIONS AND RECOMMENDATIONS 31
REFERENCES 32
1
Summary
In this study, bottom-up estimates of emissions from domestic navigation and fish-
ing have been produced. Also, fuel data in the Monthly fuel, gas and inventory
statistics, used as activity data for estimating emissions from national navigation
and international maritime bunkers has been analyzed. Data from other sources
relating to these emissions from international bunkers has been explored and ana-
lyzed.
Conclusions National navigation, CRF 1A3d
Given the completely different approaches and uncertainties that are included in
models and emission factors, bottom-up estimates using Shipair seem to corre-
spond quite well with estimates produced using fuel data from energy statistics.
Results do not imply that there is an obvious need for revision of emissions report-
ed to the UNFCCC.
Fishing, CRF 1A4c
The current model used produces slightly higher estimates than if using fuel data
for 2007 from Swedish Board of Fisheries. Compared to bottom-up estimates using
Shipair, the current model gives much higher estimates, estimates from Shipair
being approximately one third. Since smaller fishing vessels are not obliged by law
to have AIS transponders, one should expect the coverage of Shipair to be some-
what limited. To give an estimate of how much the emissions are underestimated
due to this fact, one would need to study the ship population more closely. It is also
possible that the estimates for fishing based on fuel statistics are overestimated by
the current model. However, since the only time series available is data on installed
power for the Swedish fishing fleet used in the current model, we do not have
enough information to judge whether the current time series is wrong. A revision of
the time series is not possible with the current data situation. It is however clear
that data should be updated and evaluated again coming years. Also, the estimates
by the bottom-up approach will improve as the AIS-usage becomes more and more
wide-spread, in time making it possible to perform a more complete independent
validation.
International bunkers, CRF 1C1b
Data on international bunker fuel in the Monthly fuel, gas and inventory statistics
has been found to be of excellent quality. As a consequence of that VAT is applied
on national fuel consumption but not on international bunkers, all respondents to
the survey are able to separate these fuel amounts with high accuracy. Fuels used
for domestic and international navigation have been separated correctly and in line
with IPCC Guidelines. Fluctuations in time series are to a large extent due to “spot
sales”. Occasional fluctuations in time series for international maritime bunkers
2
should be expected. The increasing trend is, in addition to driving forces such as
amount of goods or tonnage of the fleet, due to acquired international customers
and an expansion in the fleet of lighters.
Various data from energy statistics, transport statistics, trade statistics and fuel
price statistics have been found and could be used further if additional analysis is
wanted.
Recommendations National navigation, CRF 1A3d
The current methodology should be used for reporting to the UNFCCC also in the
future. Estimates using Shipair should preferably be updated for 2008-2010 and
also for coming years, thus producing a time series that in due time will provide
more information and verification of emissions reported to the UNFCCC.
Fishing, CRF 1A4c
The current methodology should be used for reporting to the UNFCCC also in
submission 2012. Estimates using Shipair should preferably be updated for 2008-
2010 and also for coming years, thus producing a time series that in due time will
provide more information and verification of emissions reported to the UNFCCC.
The current methodology should be evaluated again when the next update of the
national statistics on fishing is available.
International bunkers, CRF 1C1b
Current data is found to be of excellent quality and should be used also in the fu-
ture for reporting to the UNFCCC.
3
Background
Time series from 1990 onwards reported in submission 2011 to UNFCCC, NEC
and CLRTAP for domestic navigation, fishing and international marine bunkers,
based on energy statistics from Statistics Sweden's, shows large fluctuations for
which it has been difficult to find natural explanations. There is a need to verify the
quality of the time series and the extent to which the division between national and
international navigation has been made in accordance with IPCC guidelines and the
guidelines for reporting under CLRTAP and NEC. Also, alternative data sources
need to be explored.
SMHI and the National Maritime Administration have developed a system, Shipair,
to make bottom-up emission estimates. Shipair is based on the vessels tracked
continuously using location data from the AIS (Automatic Identification System),
combined with ship-specific data from the National Maritime Administration data-
bases. With the help of Shipair it is possible to calculate emissions from 2008 on-
wards. Such calculations can be used to verify emissions from fishing and domestic
navigation reported to e.g. the UNFCCC. It is however more difficult to verify data
on international marine bunkers, because there is no information on where the
ships are refueled.
The purpose of this study is to:
Propose a method that ensures that the allocation of fuel for estimation of
emissions from shipping and fishing including international bunkers are in
accordance with IPCC guidelines and the guidelines for reporting under
CLRTAP and NEC for the years 1990 onwards.
Provide a better understanding of the causes of variations over the years
and also to the trend of emissions from international bunkers.
Through comparison of bottom-up estimates clarify any issues with the
current methodology for calculating emissions from domestic shipping and
fishing.
4
Introduction
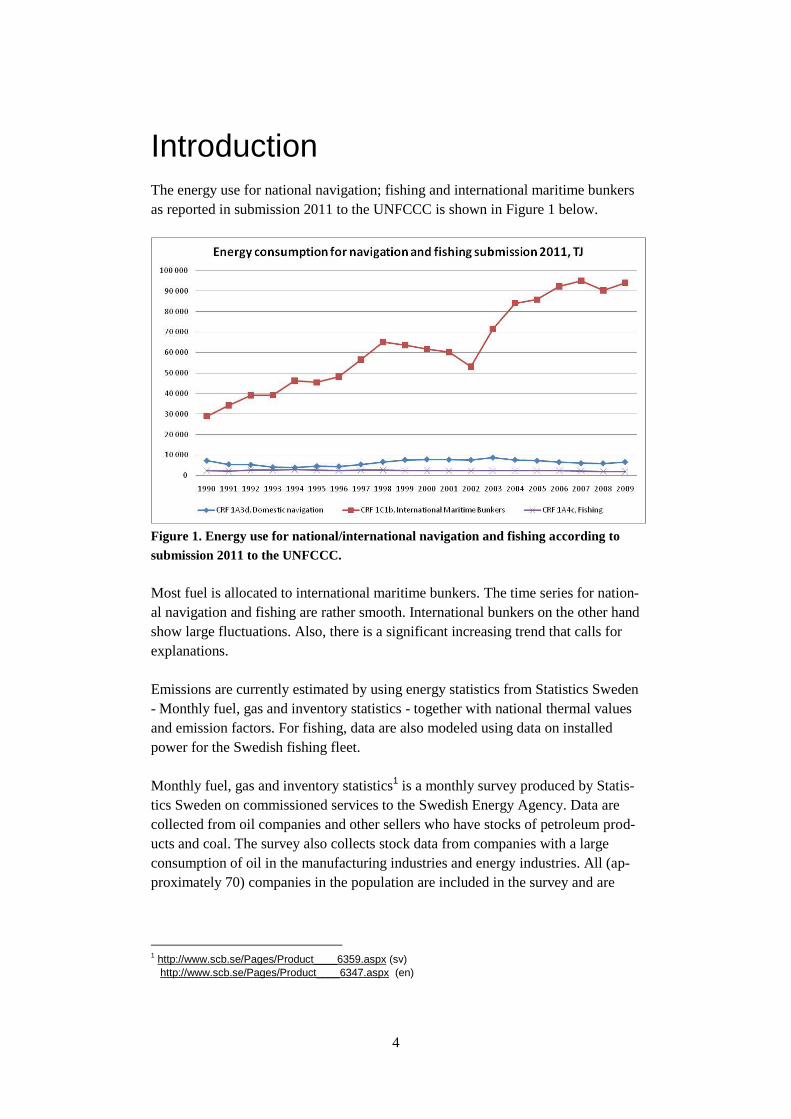
The energy use for national navigation; fishing and international maritime bunkers
as reported in submission 2011 to the UNFCCC is shown in Figure 1 below.
Figure 1. Energy use for national/international navigation and fishing according to
submission 2011 to the UNFCCC.
Most fuel is allocated to international maritime bunkers. The time series for nation-
al navigation and fishing are rather smooth. International bunkers on the other hand
show large fluctuations. Also, there is a significant increasing trend that calls for
explanations.
Emissions are currently estimated by using energy statistics from Statistics Sweden
- Monthly fuel, gas and inventory statistics - together with national thermal values
and emission factors. For fishing, data are also modeled using data on installed
power for the Swedish fishing fleet.
Monthly fuel, gas and inventory statistics1 is a monthly survey produced by Statis-
tics Sweden on commissioned services to the Swedish Energy Agency. Data are
collected from oil companies and other sellers who have stocks of petroleum prod-
ucts and coal. The survey also collects stock data from companies with a large
consumption of oil in the manufacturing industries and energy industries. All (ap-
proximately 70) companies in the population are included in the survey and are
1 http://www.scb.se/Pages/Product____6359.aspx (sv)
http://www.scb.se/Pages/Product____6347.aspx (en)
5
obliged by law2 to respond. All figures are double-checked by both Statistics Swe-
den and all respondents. Data are available for each year at national level.
Solid fuels (coal, coke etc) and liquid fuels (various types of oil), FAME and etha-
nol are reported by fuel type and in physical units. Data on internal use of natural
gas and biofuels are included. Deliveries of motor gasoline and diesel fuel are re-
ported by environmental classes.
Fuel data is reported separately for following categories:
Stocks and stock changes, imports, exports, production, internal use, bunkering for
foreign shipping, deliveries to consumers and retailers. Deliveries to consumers
and retailers are separated on
Agriculture, forestry, fishing
Mines and quarries, manufacturing
Power works, gas works
District heating plants
Other public use
Railway
Shipping excl bunkering for foreign shipping
One- and two dwelling buildings
Multi dwelling buildings
Other buildings
Other
As can be seen, fuels used for domestic and international navigation are separated
in the survey, which facilitates the use of this data for estimating emissions from
national navigation and international bunkers.
The overall reliability for this survey is according to published documentation very
good. The largest source of uncertainty is measurement errors, which could have a
significant impact since there are so few respondents. There is no over coverage.
There is a minor delay until new companies entering the market are covered in the
statistics. There are errors in classification of deliveries at different consumer cate-
gories; the group "others" is likely to be overestimated. The material is reviewed
and if any problems are noted, respondents are contacted to obtain further infor-
mation. For companies that fail to respond, imputations are made by using older
data and other data collected elsewhere. For the 2010 survey, non-response (objects
and partial) was limited to a few single objects.3
2 SFS 2001:99, SFS 2001:100, STEMFS 2006:1
3 Statistics Sweden, Description of statistics,
http://www.scb.se/Pages/ProductDocumentations____18813.aspx
6
In other words, total amounts of fuel (by fuel type) are very accurate, but we can-
not assure that the amounts for each consumer category are accurate. If only distri-
bution of national fuel consumption on consumer categories is affected, this affects
emission estimates for different CRF categories, however national totals are accu-
rate. These errors could be an explanation to the residual for diesel oil that needs to
be distributed on different kinds of transports (see methodology description in
section Analysis Fishing, CRF 1A4c). If also the distribution between national
consumption and international bunkers is affected, national emission totals are
inaccurate.
Data on national navigation and fishing are verified through bottom-up calculations
of emissions; see section Bottom-up estimates 2010 for verification of domestic
navigation and fishing. The analysis is provided in section Analysis National
navigation, CRF 1A3d and section Analysis Fishing, CRF 1A4c.
Data on fuel consumption for international bunkers including distribution between
national consumption and international bunkers is verified using other methods
(since bottom-up estimates are not possible) as described and analyzed in section
Analysis International bunkers, CRF 1C1b.
7
Bottom-up estimates 2011 for veri-fication of domestic navigation and fishing
From the year 2008 and onwards it is possible to calculate emissions using the
Shipair system. Before 2008 the AIS-system did not yet have sufficiently wide-
spread use in order to provide a realistic picture of the traffic in the seas bordering
Sweden. Calculations with Shipair can be used to verify emissions from fishing as
well as domestic navigation. The discrimination of fishing vessels is done using the
classification of the Swedish Maritime Administration (SMA). In those cases when
this is not possible, the ship categories from the AIS system are used. The division
of traffic into domestic and international is described in the next section.
Model calculations cannot be used to verify international bunkering, since there is
no information on where the ships load their fuel. This means that international
traffic where the ships bunker in countries other than Sweden cannot be separated
from ships bunkering in Sweden. A reasonable estimate would be to assume that
half of the ships refuel in the destination country and half in the origin country.
However, the uncertainties in such an estimate are considered too large to make the
results appropriate for verification of fuel statistics.
Calculations using the Shipair systems for this study have been performed using
emissions from February – May 2011. These emissions have been extrapolated to
represent the whole year. The variation between winter and summer month is at
most 5 %. The period February to May is expected to give an acceptable represen-
tation of the traffic during the whole year. It should be noted that the results from
the beginning of 2011 are compared to emissions based on fuel statistics for 2010.
The systematic differences, and sources of uncertainty, between estimations based
on fuel statistics and bottom-up calculations are expected to be much larger than
the differences in the real emissions between two consecutive years. Therefore,
also this inconsistency in the comparisons is considered acceptable.
Description of the Shipair system
SMHI and the SMA have developed a system that can calculate shipping emissions
using a bottom-up methodology. This system is based on automatic tracking of
ships using position data from the AIS (Automatic Identification System). The AIS
is a complement for RADAR and is today a global standard for positioning of
ships. In the Baltic Sea the Helsinki Commission (HELCOM) has created a com-
mon positioning database for its member states. This database covers the whole
Baltic Sea, Kattegat, Skagerrak and the North Sea just to the west of Denmark.
Ships are tracked with a time resolution as high as a few seconds. These tracks are
processed to decrease the large amounts of data and for the calculations of emis-
sions the time resolution for positioning is 5 minutes. The movement between these
8
points is then interpolated. The velocities of the ships can be calculated from the
positioning data, and in combination with known ship data the power output can be
obtained. The ship-specific properties are downloaded from the SMA ship data-
base. The logic for emission factors and the transfer of data from SMA to Shipair is
done using the SMA service called SEI (Ship-Emission-Information). The SEI
service also contains additional ship data.
The uncertainties in emission factors for ships are large. This is due to few meas-
urements of emissions from ships, as well as lacking information about some of the
ships moving in the Baltic Sea region. In the SMA databases there is fairly com-
plete information mainly for ships calling at Swedish ports, which in the context of
this project should be sufficient. In the case when data is missing, default values for
the actual ship category will be used.
At the moment the ship database contains about 27000 unique MMSI (AIS tran-
sponder id’s), but the number is growing constantly as new ships enter the
HELCOM area. The actual number of ships should be expected to be lower since
ships are changing transponders, and some of the MMSI represent very little actual
ship movements. Out of these 27000 ships, about 2700 MMSI representing fishing
vessels have been extracted. The calculations were then made using two different
sets of ships, all ships and fishing vessels. In both cases the calculations were lim-
ited to domestic traffic, i.e. ship routes having both origin and destination in Swe-
den.
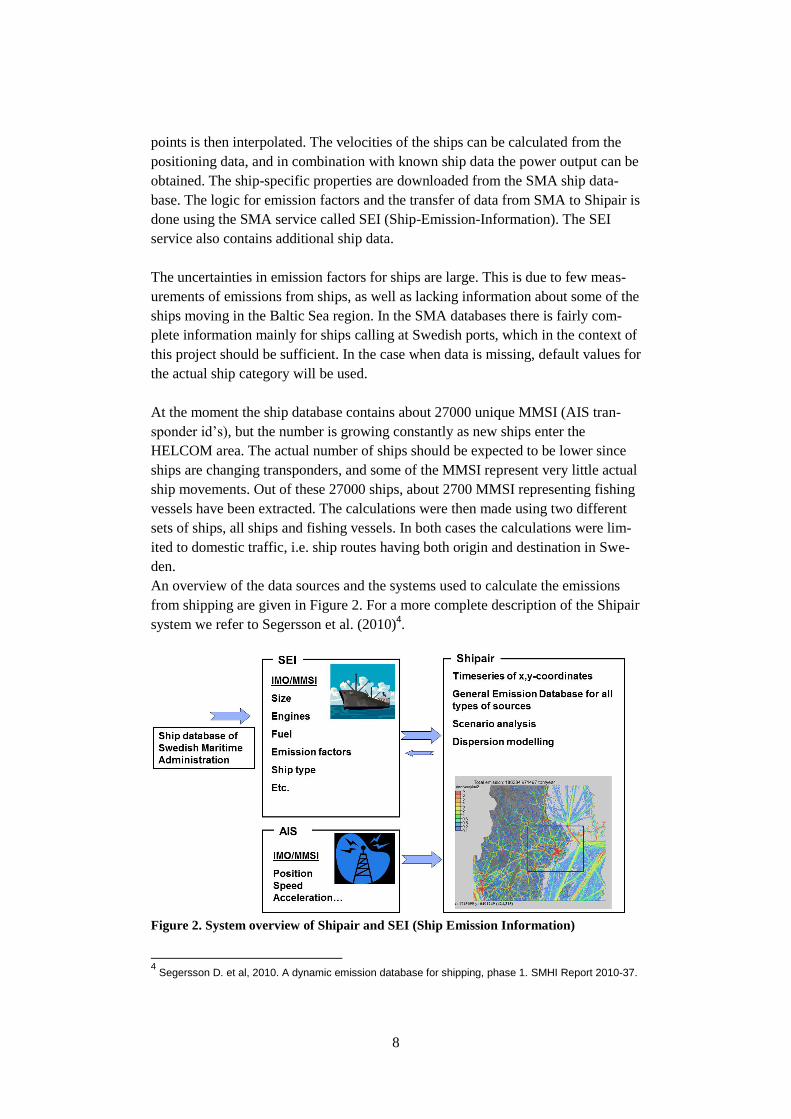
An overview of the data sources and the systems used to calculate the emissions
from shipping are given in Figure 2. For a more complete description of the Shipair
system we refer to Segersson et al. (2010)4.
Figure 2. System overview of Shipair and SEI (Ship Emission Information)
4 Segersson D. et al, 2010. A dynamic emission database for shipping, phase 1. SMHI Report 2010-37.
9
Distinguishing domestic shipping
In Shipair the ship movements are divided into routes. A route is defined as the
movement between departure and arrival. The time in port is evenly divided be-
tween the routes before and after. Each route is classified by the country of origin
and the destination country. A route where both the origin and destination is Swe-
den is classified as domestic. This is a quite precise definition, since one could
expect a ship travelling between Swedish destinations to also refuel in Sweden.
There is probably a slight over-estimation of the domestic traffic due to the possi-
bility that ships that are arriving from other countries continue to travel between
Swedish ports without refueling first.
All calculations made in this study are limited to only include domestic traffic. This
means that also the fishing vessels are required to depart and arrive at a Swedish
port to be included in the calculations. An alternative method would be to limit the
calculations using the flag of the ships. This is considered a more uncertain method
since ships might still be operating in other countries, and was therefore not used in
this study.
Ship properties
Two ship databases were created in the study. One database including all ships
found in the AIS signal and one only including fishing vessels. Below some statis-
tics are presented over the most important properties for the population of fishing
vessels. No statistics are presented for ship properties representing the domestic
traffic. The reason is that the ship database used for these calculations contains all
ships and the domestic traffic is filtered out at run-time. Statistics produced from
the ship database would therefore represent the entire fleet of the Baltic Sea.
Smaller changes to Shipair would be necessary to allow a more representative de-
scription of the ships contributing to the results.
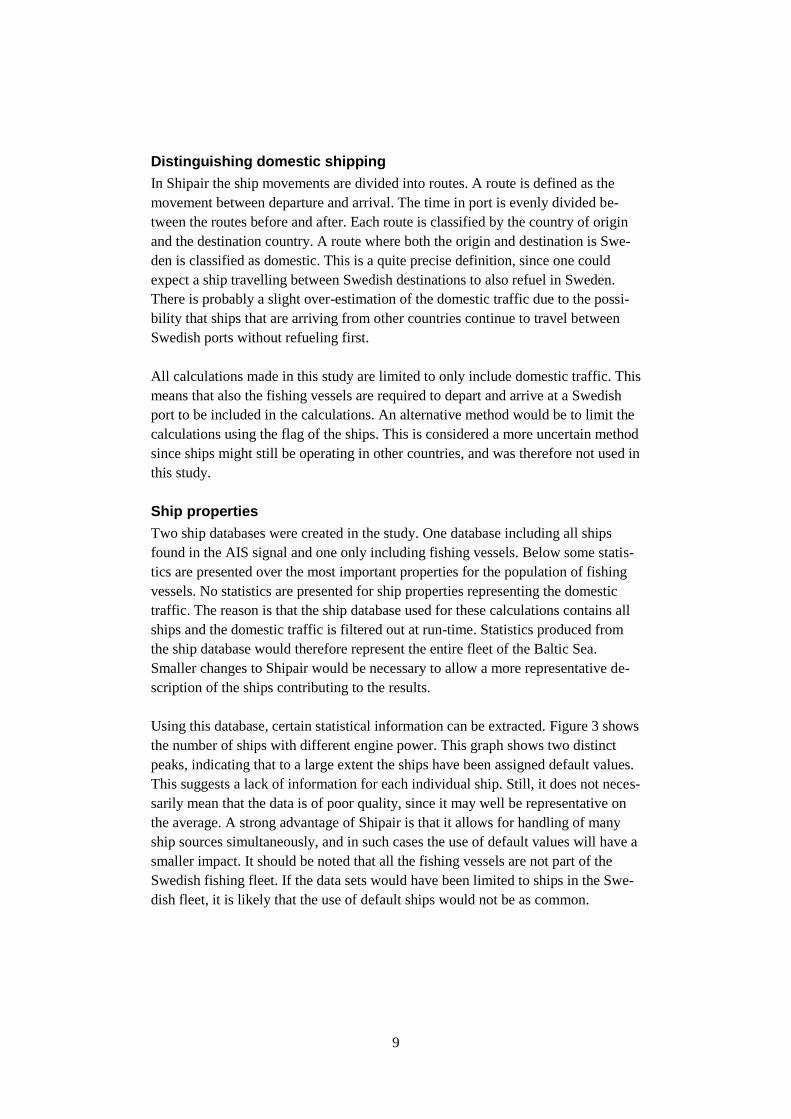
Using this database, certain statistical information can be extracted. Figure 3 shows
the number of ships with different engine power. This graph shows two distinct
peaks, indicating that to a large extent the ships have been assigned default values.
This suggests a lack of information for each individual ship. Still, it does not neces-
sarily mean that the data is of poor quality, since it may well be representative on
the average. A strong advantage of Shipair is that it allows for handling of many
ship sources simultaneously, and in such cases the use of default values will have a
smaller impact. It should be noted that all the fishing vessels are not part of the
Swedish fishing fleet. If the data sets would have been limited to ships in the Swe-
dish fleet, it is likely that the use of default ships would not be as common.
10
Figure 3. Number of ships as function of the total installed engine power. The average
power is shown by the red line
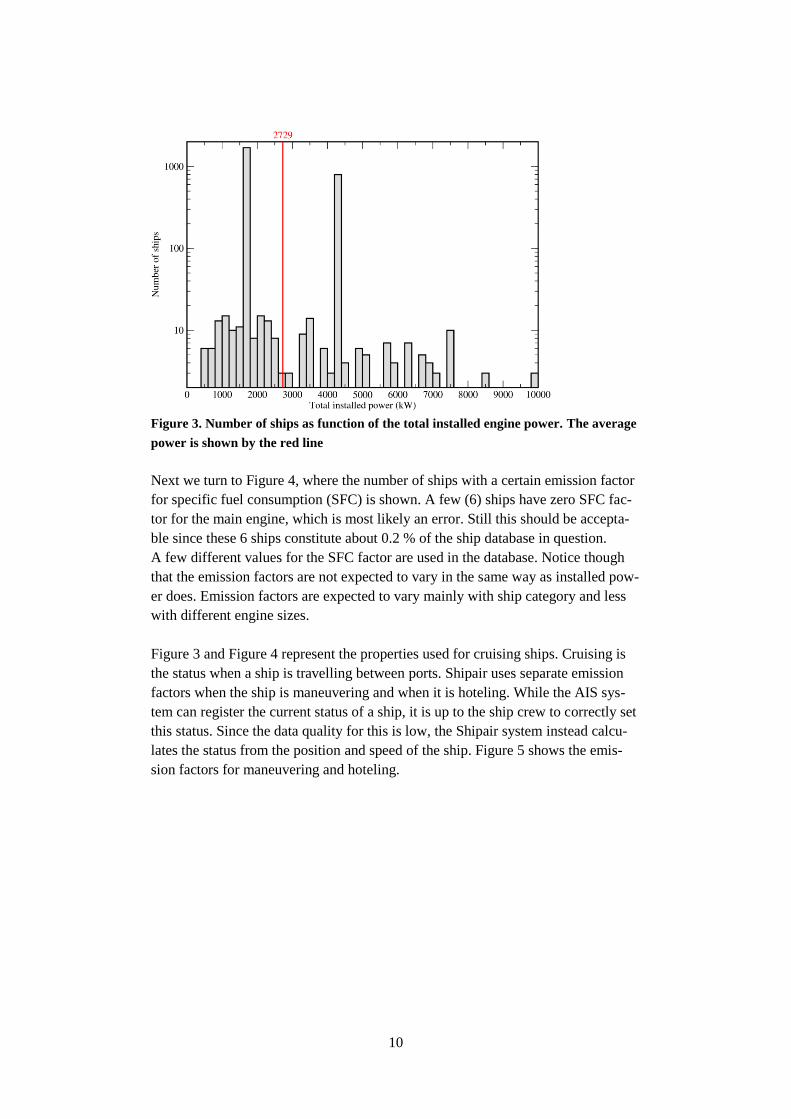
Next we turn to Figure 4, where the number of ships with a certain emission factor
for specific fuel consumption (SFC) is shown. A few (6) ships have zero SFC fac-
tor for the main engine, which is most likely an error. Still this should be accepta-
ble since these 6 ships constitute about 0.2 % of the ship database in question.
A few different values for the SFC factor are used in the database. Notice though
that the emission factors are not expected to vary in the same way as installed pow-
er does. Emission factors are expected to vary mainly with ship category and less
with different engine sizes.
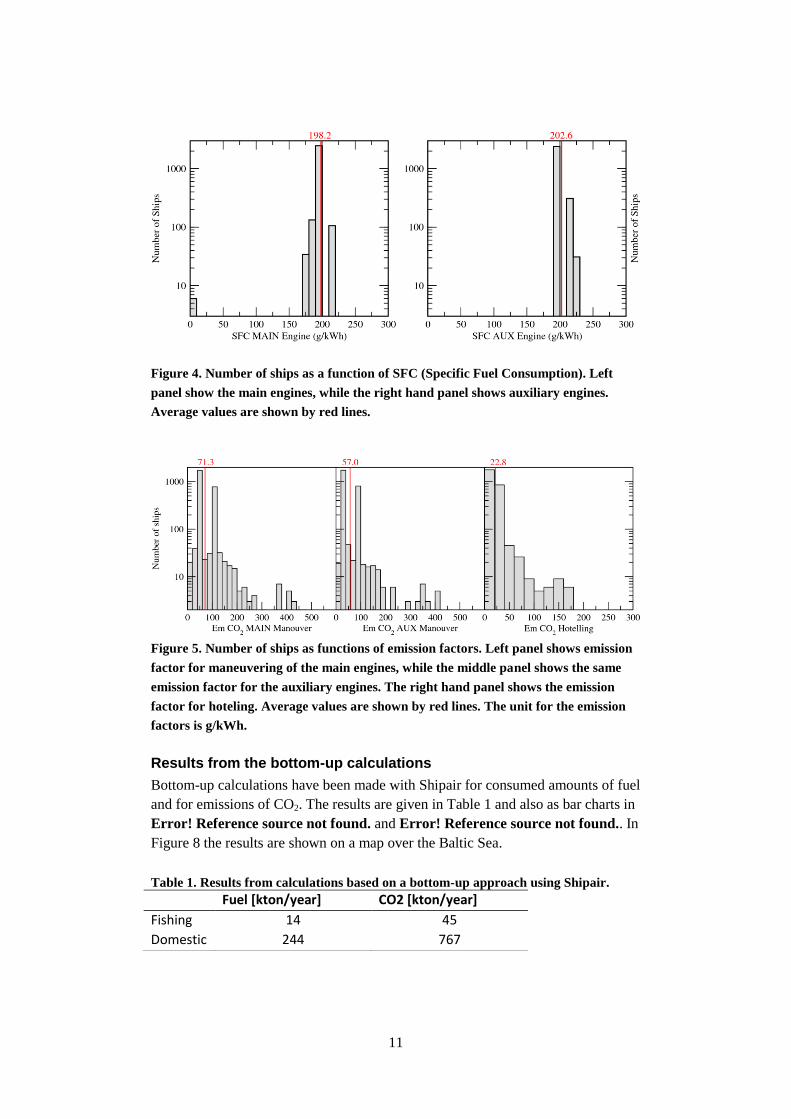
Figure 3 and Figure 4 represent the properties used for cruising ships. Cruising is
the status when a ship is travelling between ports. Shipair uses separate emission
factors when the ship is maneuvering and when it is hoteling. While the AIS sys-
tem can register the current status of a ship, it is up to the ship crew to correctly set
this status. Since the data quality for this is low, the Shipair system instead calcu-
lates the status from the position and speed of the ship. Figure 5 shows the emis-
sion factors for maneuvering and hoteling.
11
Figure 4. Number of ships as a function of SFC (Specific Fuel Consumption). Left
panel show the main engines, while the right hand panel shows auxiliary engines.
Average values are shown by red lines.
Figure 5. Number of ships as functions of emission factors. Left panel shows emission
factor for maneuvering of the main engines, while the middle panel shows the same
emission factor for the auxiliary engines. The right hand panel shows the emission
factor for hoteling. Average values are shown by red lines. The unit for the emission
factors is g/kWh.
Results from the bottom-up calculations
Bottom-up calculations have been made with Shipair for consumed amounts of fuel
and for emissions of CO2. The results are given in Table 1 and also as bar charts in
Error! Reference source not found. and Error! Reference source not found.. In
Figure 8 the results are shown on a map over the Baltic Sea.
Table 1. Results from calculations based on a bottom-up approach using Shipair.
Fuel [kton/year] CO2 [kton/year]
Fishing 14 45
Domestic 244 767
12
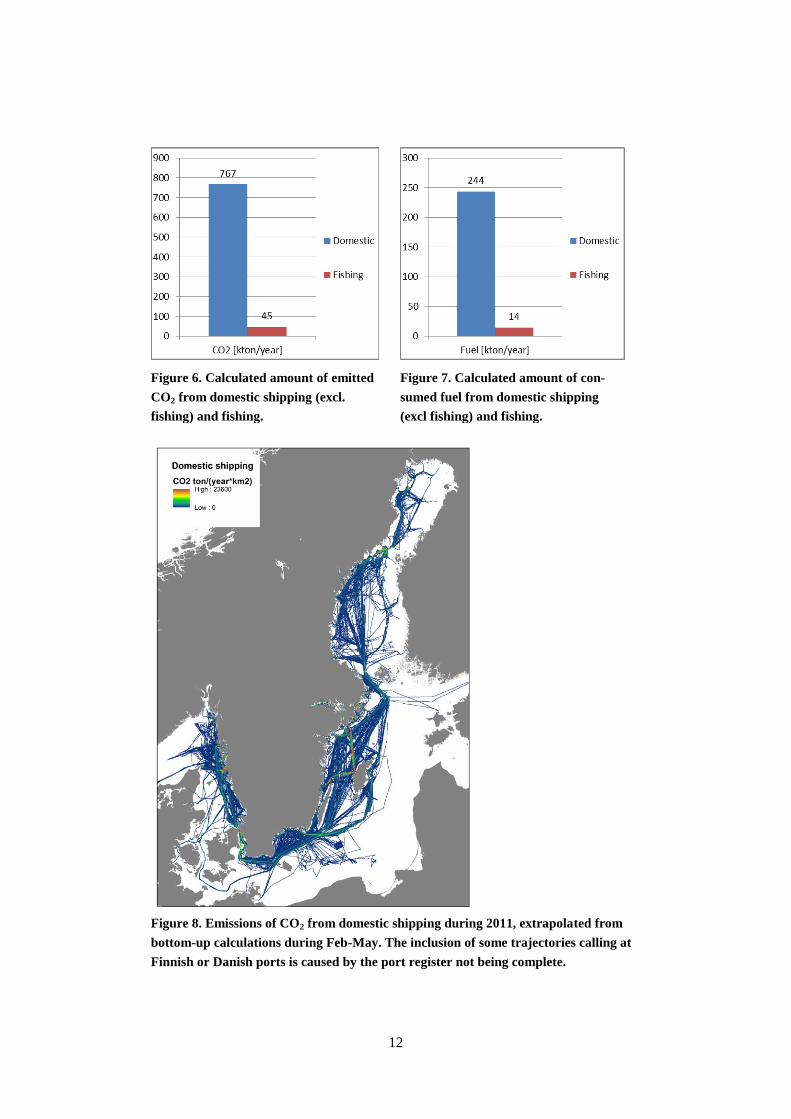
Figure 8. Emissions of CO2 from domestic shipping during 2011, extrapolated from
bottom-up calculations during Feb-May. The inclusion of some trajectories calling at
Finnish or Danish ports is caused by the port register not being complete.
Figure 7. Calculated amount of con-
sumed fuel from domestic shipping
(excl fishing) and fishing.
Figure 6. Calculated amount of emitted
CO2 from domestic shipping (excl.
fishing) and fishing.
13
Analysis National navigation, CRF 1A3d
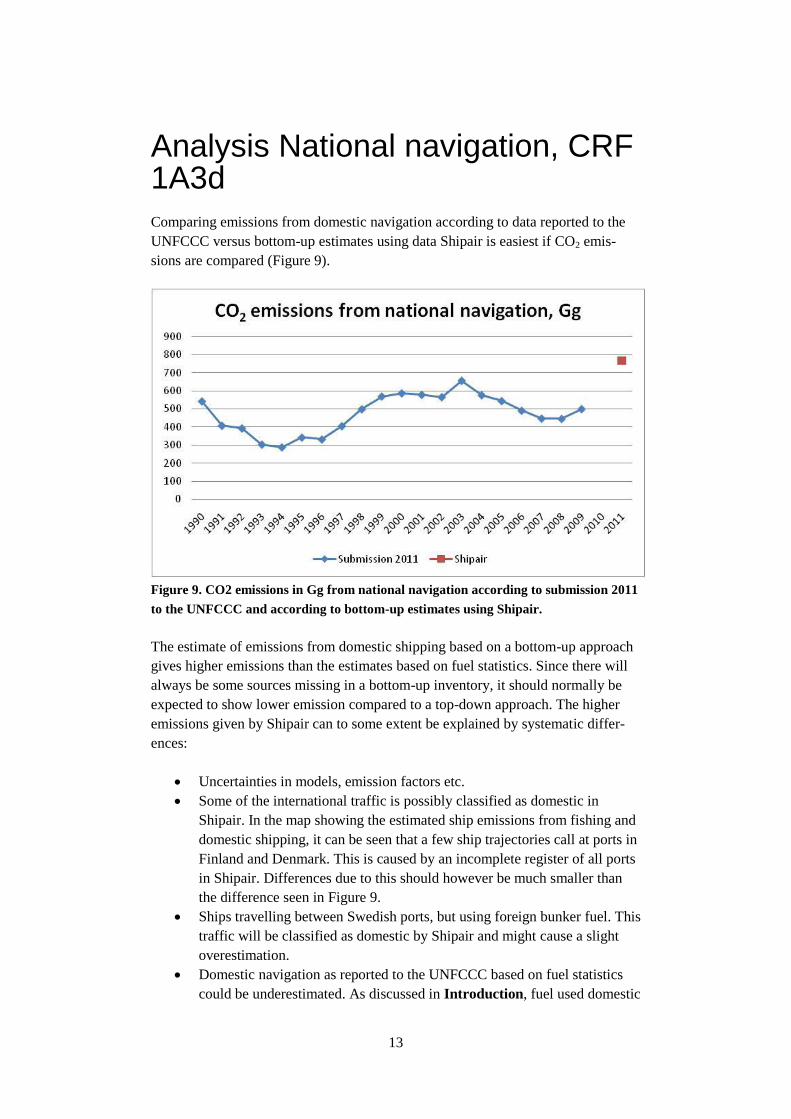
Comparing emissions from domestic navigation according to data reported to the
UNFCCC versus bottom-up estimates using data Shipair is easiest if CO2 emis-
sions are compared (Figure 9).
Figure 9. CO2 emissions in Gg from national navigation according to submission 2011
to the UNFCCC and according to bottom-up estimates using Shipair.
The estimate of emissions from domestic shipping based on a bottom-up approach
gives higher emissions than the estimates based on fuel statistics. Since there will
always be some sources missing in a bottom-up inventory, it should normally be
expected to show lower emission compared to a top-down approach. The higher
emissions given by Shipair can to some extent be explained by systematic differ-
ences:
Uncertainties in models, emission factors etc.
Some of the international traffic is possibly classified as domestic in
Shipair. In the map showing the estimated ship emissions from fishing and
domestic shipping, it can be seen that a few ship trajectories call at ports in
Finland and Denmark. This is caused by an incomplete register of all ports
in Shipair. Differences due to this should however be much smaller than
the difference seen in Figure 9.
Ships travelling between Swedish ports, but using foreign bunker fuel. This
traffic will be classified as domestic by Shipair and might cause a slight
overestimation.
Domestic navigation as reported to the UNFCCC based on fuel statistics
could be underestimated. As discussed in Introduction, fuel used domestic
14
is not always separated on a specific consumer category but simply report-
ed as “other”. It should be noted that if this is the reason behind the ob-
served discrepancy, emissions from domestic navigation are still accounted
for in other domestic categories and thus included in the national total re-
ported to the UNFCCC. See also section Analysis Fishing, CRF 1A4c.
Conclusions and recommendations Given the completely different approaches and uncertainties that are included in
models and emission factors, we find bottom-up estimates using Shipair to corre-
spond quite well with estimates produced using fuel data from energy statistics.
Results do not imply that there is an obvious need for revision of emissions report-
ed to the UNFCCC. A revision is not even possible with the current data situation.
Current methodology should be used for reporting to the UNFCCC also in the
future. Estimates using Shipair should preferably be updated for 2008-2010 and
also for coming years, thus producing a time series that in due time will yield more
information and verification of emissions reported to the UNFCCC.
15
Analysis Fishing, CRF 1A4c
Emissions from fishing are currently estimated using a methodology described in
Cooper et. al. (2005)5:
1. Installed power (kW) in the fishing fleet according to Swedish Board of Fisher-
ies (data available for 1996 and later years, 1990-1995 extrapolated).
2. Diesel consumption in the fishing fleet 2005 according to Statistics Sweden.6
3. For 2005, consumption of diesel/installed kWh can be calculated. This ratio is
applied for all years. Using the data on installed power for each year, an esti-
mate of diesel consumption for fishing is given for each year.
4. When diesel consumption is distributed on all kinds of transports, the remain-
ing residual is distributed proportionally on fishing, road traffic and navigation.
5. Energy amounts and emissions are calculated using national thermal values
and emission factors.
The model needs data on installed power in the Swedish fishing fleet. Updated data
2008-2010 has been collected from Swedish Board of Fisheries within this study.
A time series on CO2 emissions according to the model is provided in Figure 10
(the parameter CO2 is chosen to facilitate comparison with bottom-up estimates
using Shipair).
The model of course includes uncertainties. When distributing the remaining resid-
ual (see bullet point 4 above and Figure 10), amounts exceed 10% for 1990, 1991,
1998, 2004, 2005 and 2006. However, there seems to be no systematic over- or
underestimation in the model. It should be noted that these differences do not nec-
essarily imply that data for fishing is wrong. The residual might as well originate
from uncertainties in other models used for diesel-related emissions from mobile
combustion, for example emissions from road traffic or navigation.
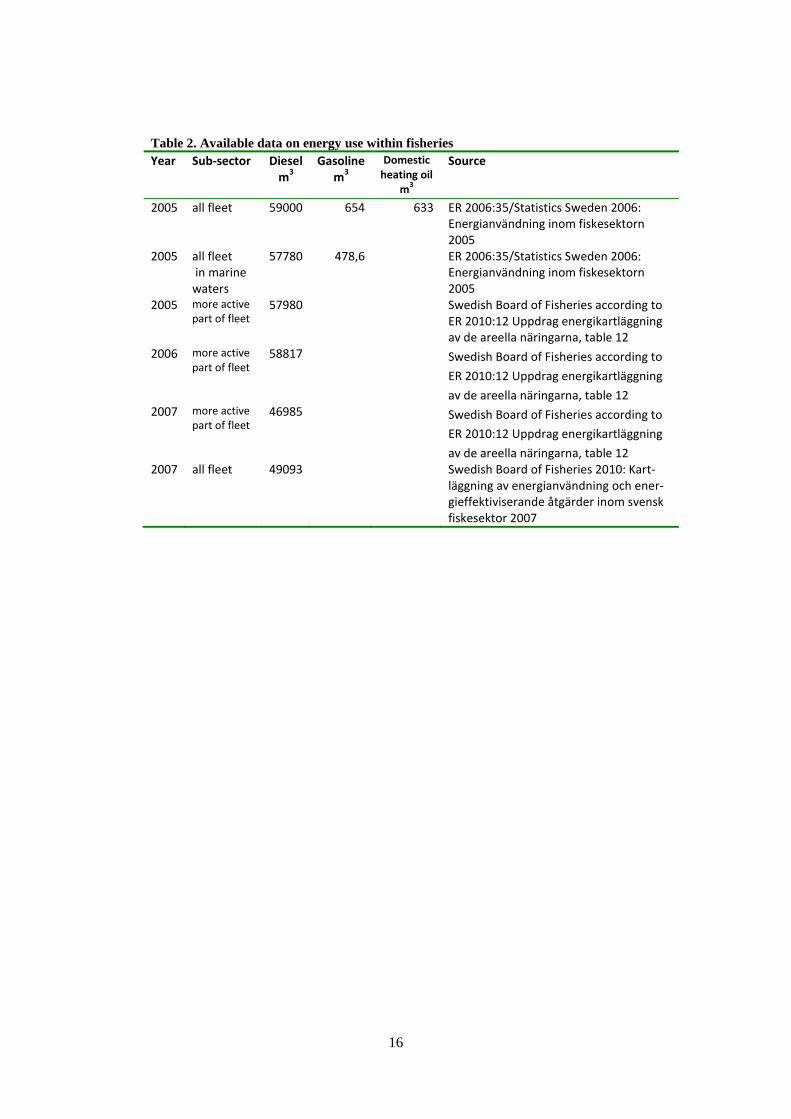
For energy consumption within fisheries, currently only data according to Table 2
exists. The survey on energy consumption within fishing (ER 2006:35) is planned
to be updated in the coming years.7 Data on gasoline and domestic heating oil are
excluded in the model used. This is a simplification. Given the small amounts,
errors introduced into the model could be considered negligible. Data on fuel con-
sumption 2007 according to Swedish Board of Fisheries is produced with a sample
survey. The amounts are 14% lower than modeled data for 2007 currently used in
the model, see Figure 10.
5 Cooper, D., Flodström, E. Gustafsson, T. and Jernström, M. (2005) Emission factors, fuel consump-
tion and emission estimates for Sweden’s fishing fleet 1990-2004
6 Statistics Sweden (2006) Energianvändning inom fiskesektorn 2005
7 Swedish Energy Agency, Niklas Notstrand, personal communication 2011-05-18
16
Table 2. Available data on energy use within fisheries
Year Sub-sector Diesel m
3
Gasoline m
3
Domestic heating oil
m3
Source
2005 all fleet 59000 654 633 ER 2006:35/Statistics Sweden 2006: Energianvändning inom fiskesektorn 2005
2005 all fleet in marine waters
57780 478,6 ER 2006:35/Statistics Sweden 2006: Energianvändning inom fiskesektorn 2005
2005 more active part of fleet
57980 Swedish Board of Fisheries according to ER 2010:12 Uppdrag energikartläggning av de areella näringarna, table 12
2006 more active part of fleet
58817 Swedish Board of Fisheries according to
ER 2010:12 Uppdrag energikartläggning
av de areella näringarna, table 12 2007 more active
part of fleet 46985 Swedish Board of Fisheries according to
ER 2010:12 Uppdrag energikartläggning
av de areella näringarna, table 12 2007 all fleet 49093 Swedish Board of Fisheries 2010: Kart-
läggning av energianvändning och ener-gieffektiviserande åtgärder inom svensk fiskesektor 2007
17
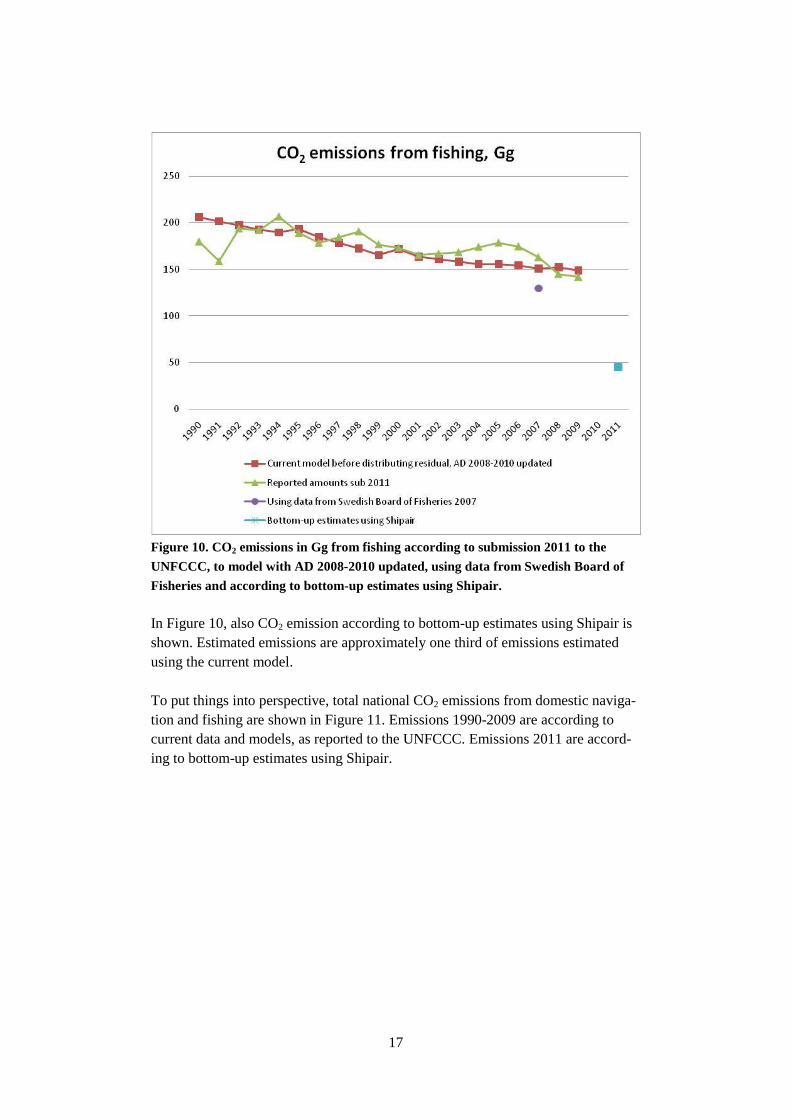
Figure 10. CO2 emissions in Gg from fishing according to submission 2011 to the
UNFCCC, to model with AD 2008-2010 updated, using data from Swedish Board of
Fisheries and according to bottom-up estimates using Shipair.
In Figure 10, also CO2 emission according to bottom-up estimates using Shipair is
shown. Estimated emissions are approximately one third of emissions estimated
using the current model.
To put things into perspective, total national CO2 emissions from domestic naviga-
tion and fishing are shown in Figure 11. Emissions 1990-2009 are according to
current data and models, as reported to the UNFCCC. Emissions 2011 are accord-
ing to bottom-up estimates using Shipair.
18
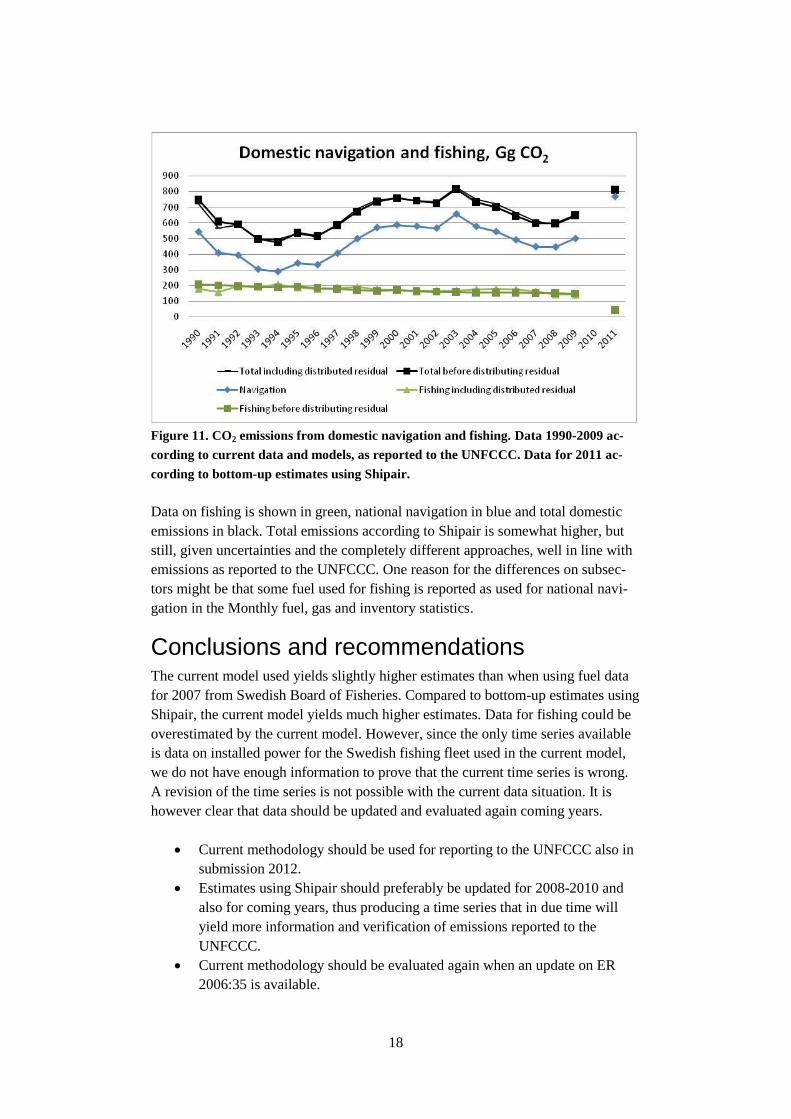
Figure 11. CO2 emissions from domestic navigation and fishing. Data 1990-2009 ac-
cording to current data and models, as reported to the UNFCCC. Data for 2011 ac-
cording to bottom-up estimates using Shipair.
Data on fishing is shown in green, national navigation in blue and total domestic
emissions in black. Total emissions according to Shipair is somewhat higher, but
still, given uncertainties and the completely different approaches, well in line with
emissions as reported to the UNFCCC. One reason for the differences on subsec-
tors might be that some fuel used for fishing is reported as used for national navi-
gation in the Monthly fuel, gas and inventory statistics.
Conclusions and recommendations The current model used yields slightly higher estimates than when using fuel data
for 2007 from Swedish Board of Fisheries. Compared to bottom-up estimates using
Shipair, the current model yields much higher estimates. Data for fishing could be
overestimated by the current model. However, since the only time series available
is data on installed power for the Swedish fishing fleet used in the current model,
we do not have enough information to prove that the current time series is wrong.
A revision of the time series is not possible with the current data situation. It is
however clear that data should be updated and evaluated again coming years.
Current methodology should be used for reporting to the UNFCCC also in
submission 2012.
Estimates using Shipair should preferably be updated for 2008-2010 and
also for coming years, thus producing a time series that in due time will
yield more information and verification of emissions reported to the
UNFCCC.
Current methodology should be evaluated again when an update on ER
2006:35 is available.
19
Analysis of International bunkers, CRF 1C1b
Definitions on domestic and international con-sumption When using IPCC guidelines for reporting to the UNFCCC, domestic emissions
from fuel consumption are defined as emissions within the country originating
from fuel sold within the country. International bunkers are defined as fuel sold
within the country but used abroad. Imports of fuels are on the other hand not to be
reported (amounts are reported by countries exporting the fuel). It is not important
who uses the fuel.
For the Swedish Energy Agency, the aim is to be able to show how much energy is
used for each sector in Sweden.8 For navigation this means knowledge is needed
about exact amounts of imported fuel used within Swedish borders as well as exact
amount of international bunkers (that is fuel exported and used outside Swedish
borders). Some work in this direction regarding energy consumption for navigation
has been done. Parts of results from the further work of Swedish Energy Agency
can be implemented in this study. See section on Swedish Energy Agency below
and section Bottom-up estimates 2010 for verification of domestic navigation
and fishing.
A third definition of domestic consumption is used by the System of Environmen-
tal and Economic Accounts at Statistics Sweden9. Here, the aim is to show emis-
sions originating from fuel consumption by Swedish residents, no matter where in
the world the fuel is bought or used.
Differences in definitions have to be kept in mind when discussing energy statistics
for domestic and international navigation. Current energy statistics are (as shown
below) well adapted for reporting of international bunkers according to IPCC
guidelines, but more difficult to use for the purposes for the Swedish Energy Agen-
cy or the System of Environmental and Economic Accounts at Statistics Sweden.
Verification of survey data As noted in Introduction, Monthly fuel, gas and inventory statistics
10 is a monthly
survey produced by Statistics Sweden on commissioned services to the Swedish
8 Swedish Energy Agency 2009: Utveckling av statistikunderlaget avseende transportsektorns
energianvändning
9 http://www.scb.se/Pages/Product____38175.aspx
10 http://www.scb.se/Pages/Product____6359.aspx (sv)
http://www.scb.se/Pages/Product____6347.aspx (en)
20
Energy Agency. Data are collected from oil companies and other sellers who have
stocks of petroleum products and coal. The survey also collects stock data from
companies with a large consumption of oil in the manufacturing industries and
energy industries. The population consists of approximately 70 companies, and all
of them are included in the survey.
Background data for all companies have been studied for the years 1993-2010 (data
1990-1992 was (in 2011) not available on this detailed level). For each company,
time series was produced for fuel amounts reported as domestic navigation (“Ship-
ping excl bunkering for foreign shipping”) and as international maritime bunkers
(“bunkering for foreign shipping”). The time series for domestic navigation and
international maritime bunkers consists of data from quite few companies (Table
3):
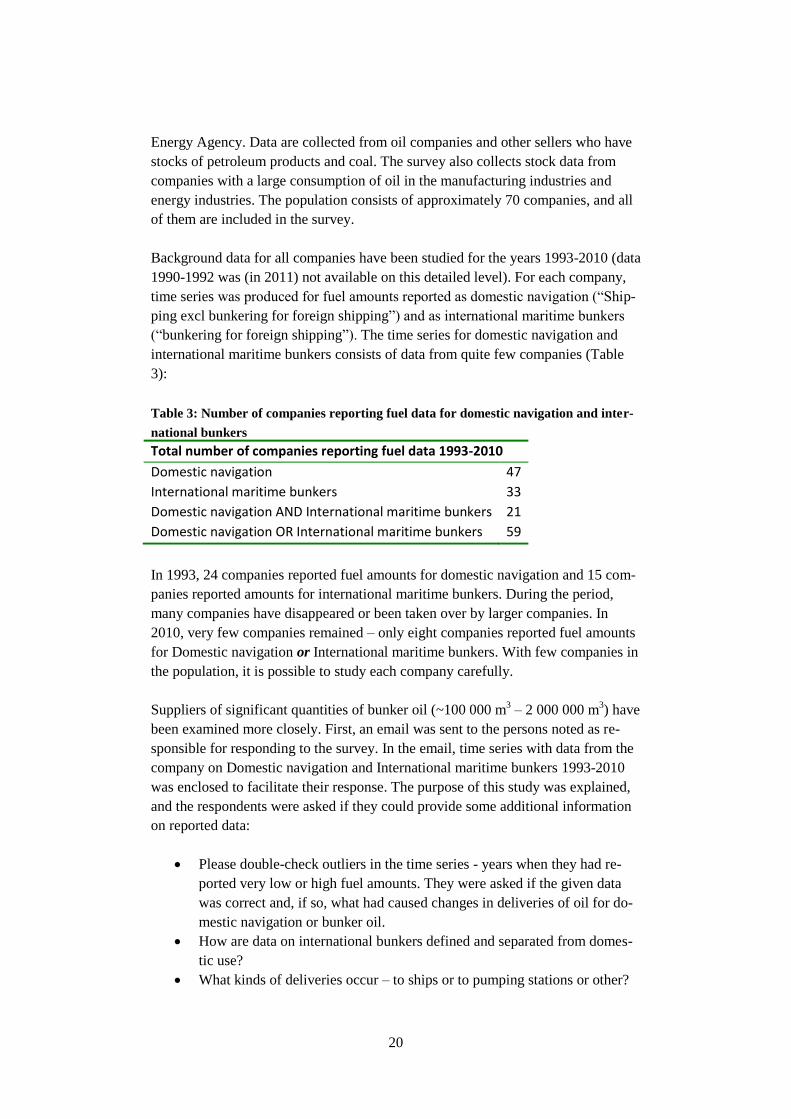
Table 3: Number of companies reporting fuel data for domestic navigation and inter-
national bunkers
Total number of companies reporting fuel data 1993-2010
Domestic navigation 47
International maritime bunkers 33
Domestic navigation AND International maritime bunkers 21
Domestic navigation OR International maritime bunkers 59
In 1993, 24 companies reported fuel amounts for domestic navigation and 15 com-
panies reported amounts for international maritime bunkers. During the period,
many companies have disappeared or been taken over by larger companies. In
2010, very few companies remained – only eight companies reported fuel amounts
for Domestic navigation or International maritime bunkers. With few companies in
the population, it is possible to study each company carefully.
Suppliers of significant quantities of bunker oil (~100 000 m3 – 2 000 000 m
3) have
been examined more closely. First, an email was sent to the persons noted as re-
sponsible for responding to the survey. In the email, time series with data from the
company on Domestic navigation and International maritime bunkers 1993-2010
was enclosed to facilitate their response. The purpose of this study was explained,
and the respondents were asked if they could provide some additional information
on reported data:
Please double-check outliers in the time series - years when they had re-
ported very low or high fuel amounts. They were asked if the given data
was correct and, if so, what had caused changes in deliveries of oil for do-
mestic navigation or bunker oil.
How are data on international bunkers defined and separated from domes-
tic use?
What kinds of deliveries occur – to ships or to pumping stations or other?
21
Are fuel delivered to Swedish and/or foreign companies?
What kind of ships are fuels delivered to – passenger ships or cargo ves-
sels?
Companies that were late at responding or provided especially interesting answers
were also contacted by telephone to ensure a complete response and that all details
in the response were understood correctly. In some cases, when companies had
been taken over by other companies, several persons were contacted until the accu-
rate respondents were located. We were able to track down all respondents that
have reported amounts of fuel that significantly affects the time series – at least for
the later part of the time series when amounts are higher. We were not able to get
hold of some of the suppliers for years back, since they had either been taken over
by other companies or had moved their business abroad.
The response was very good, producing reliable information regarding the amounts
and fluctuation of fuel deliveries for national navigation and international maritime
bunkers over the years:
The suppliers’ billing- and accounting systems clearly separate the sales of
domestic and international bunker oils, since this is a requirement from the
Swedish tax authorities (VAT is not applied on international bunkers).
Thus, we can be sure that reported data on international maritime bunkers
are truly international and that data on international bunkers are of high
quality. Fuels used for domestic and international navigation have been
separated correctly and in line with IPCC Guidelines.
Fuel is sold to ships, to depots or picked up by customers directly at the
stocks. Customers that pick up fuel themselves are responsible for report-
ing and paying correct taxes and VAT to the Swedish Tax Agency. This
implies that these customers are included in the population for the Monthly
fuel, gas and inventory statistics and that this fuel, if used for international
bunkers, is reported correctly.
Sudden increases of fuel amounts for international bunkers occur when oc-
casional customers buy shiploads of bunker fuels, so called “spot sale”.
These buyers are not on the “ordinary supply list”. According to the re-
spondents, this phenomenon is quite common and amounts may be signifi-
cant. Thus, occasional fluctuations in time series for international mari-
time bunkers should be expected.
During the period, merging of companies and take-over of companies is a
frequent phenomenon. This results in sudden increases in the supply of
bunkers for the company taking over, whilst the company that had been
taken over disappears from the population. National totals are however not
affected.
Bunker fuels are by nature an international market, and if customers
choose suppliers from other countries, national time series on international
bunkers will be affected. This happened for instance in 2001, when one
22
major supplier of bunker oil acquired additional international customers,
which led to a noticeable increase in their amount of sold fuel. Customers
stayed with the company, thus levels are higher also for years after 2001.
To be able to sell bunker oil directly to ships, supplier needs so called
lighters. A lighter is a ship that delivers oil to the customers, e.g. ships
which most of the time are anchored right outside the harbor. In 2005, one
major supplier of bunker oils expanded their fleet of lighters, which made
it possible for them to increase their sale of bunker oils. This is the major
cause for the increase in amounts of sold fuel for 2005 onwards.
Additional explanations of time series There are some other sources providing data that gives a better understanding of
the driving forces behind the development of international bunkers. Sources found
are discussed below.
Energy statistics
Energy consumption for transportation as reported by Statistics Sweden has been
analyzed by The Swedish Energy Agency. Variations in the time series are dis-
cussed. It is concluded that allocation on consumer categories has uncertainties, as
noted above.
The Energy Agency concludes that one reason for the decrease in use of heating oil
for domestic navigation might be that diesel oil (that has increased) is used instead.
Also for international bunkers, one reason for shifts in consumption of different
fuel types might be substitution of residual oil with diesel oil.11
PASSENGER TRAFFIC AND FREIGHT TRAFFIC
In “Transportsektorns energianvändning”12
, estimates on fuel consumption for
passenger traffic versus freight traffic are shown. It is stated that the distribution
includes uncertainties, but is still informative when trying to understand what the
driving forces behind the fuel consumption and related emissions are. Background
data for calculating ratios on domestic navigation are taken from ER2007:2613
, a
study covering professional traffic (no private traffic) in Swedish territorial water.
It is stated in the report that there are major uncertainties in results. Respondents
were obliged to respond only for 2006, thus results 2002-2005 became even more
uncertain. The overcoverage was according to the report significant. Results do not
match data in official energy statistics or data reported to UNFCCC very well.
11
ES 2011:05 Transportsektorns Energianvändning 2010
12 ES 2011:05 Transportsektorns Energianvändning 2010, ES 2009:04 Transportsektorns
energianvändning 2008, ES 2010:04 Transportsektorns energianvändning 2009
13 ER2007:26 Energianvändning för inrikes sjöfart år 2006.
23
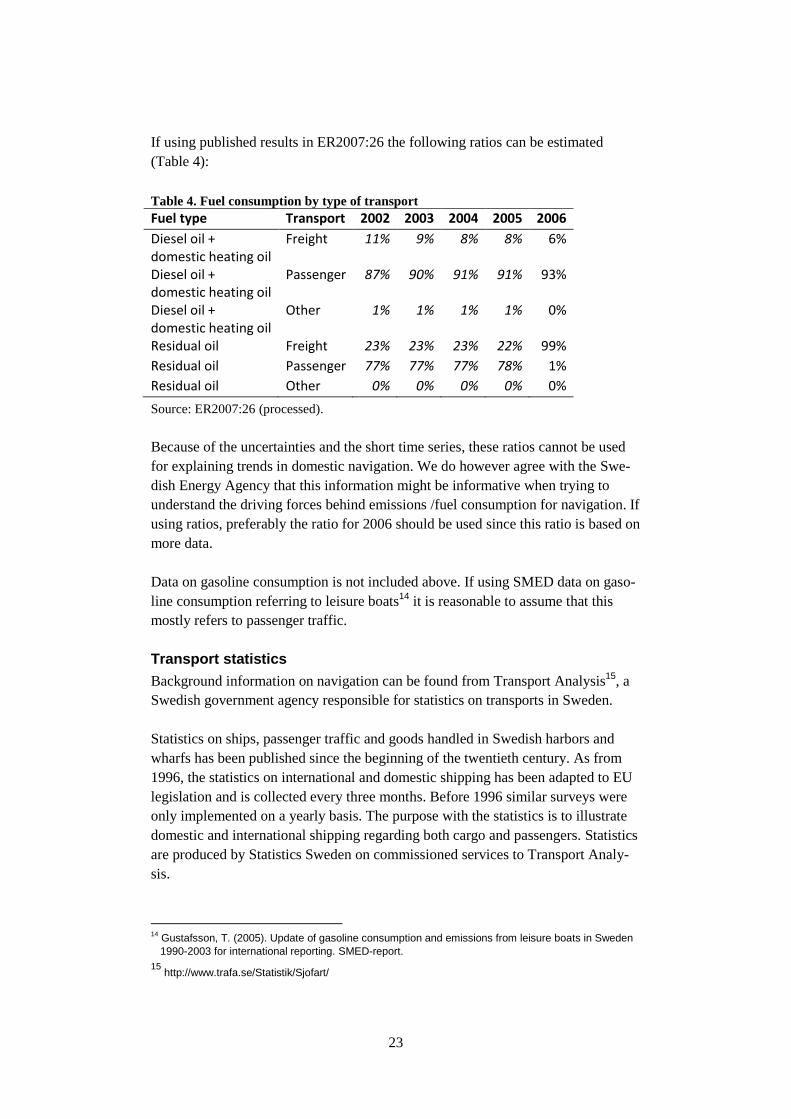
If using published results in ER2007:26 the following ratios can be estimated
(Table 4):
Table 4. Fuel consumption by type of transport
Fuel type Transport 2002 2003 2004 2005 2006
Diesel oil + domestic heating oil
Freight 11% 9% 8% 8% 6%
Diesel oil + domestic heating oil
Passenger 87% 90% 91% 91% 93%
Diesel oil + domestic heating oil
Other 1% 1% 1% 1% 0%
Residual oil Freight 23% 23% 23% 22% 99%
Residual oil Passenger 77% 77% 77% 78% 1%
Residual oil Other 0% 0% 0% 0% 0%
Source: ER2007:26 (processed).
Because of the uncertainties and the short time series, these ratios cannot be used
for explaining trends in domestic navigation. We do however agree with the Swe-
dish Energy Agency that this information might be informative when trying to
understand the driving forces behind emissions /fuel consumption for navigation. If
using ratios, preferably the ratio for 2006 should be used since this ratio is based on
more data.
Data on gasoline consumption is not included above. If using SMED data on gaso-
line consumption referring to leisure boats14
it is reasonable to assume that this
mostly refers to passenger traffic.
Transport statistics
Background information on navigation can be found from Transport Analysis15
, a
Swedish government agency responsible for statistics on transports in Sweden.
Statistics on ships, passenger traffic and goods handled in Swedish harbors and
wharfs has been published since the beginning of the twentieth century. As from
1996, the statistics on international and domestic shipping has been adapted to EU
legislation and is collected every three months. Before 1996 similar surveys were
only implemented on a yearly basis. The purpose with the statistics is to illustrate
domestic and international shipping regarding both cargo and passengers. Statistics
are produced by Statistics Sweden on commissioned services to Transport Analy-
sis.
14
Gustafsson, T. (2005). Update of gasoline consumption and emissions from leisure boats in Sweden
1990-2003 for international reporting. SMED-report.
15 http://www.trafa.se/Statistik/Sjofart/
24
In this section, the most relevant statistics is presented. If further analysis is need-
ed, there is a wide range of reports and statistics available at the Transport Analysis
website.
Since there is an upward trend for the supply of bunker fuel Sweden, it’s relevant
to compare it with the trend for international shipping; both of passenger and cargo.
International shipping applies to both Swedish vessels leaving Sweden and interna-
tional vessels entering Sweden.
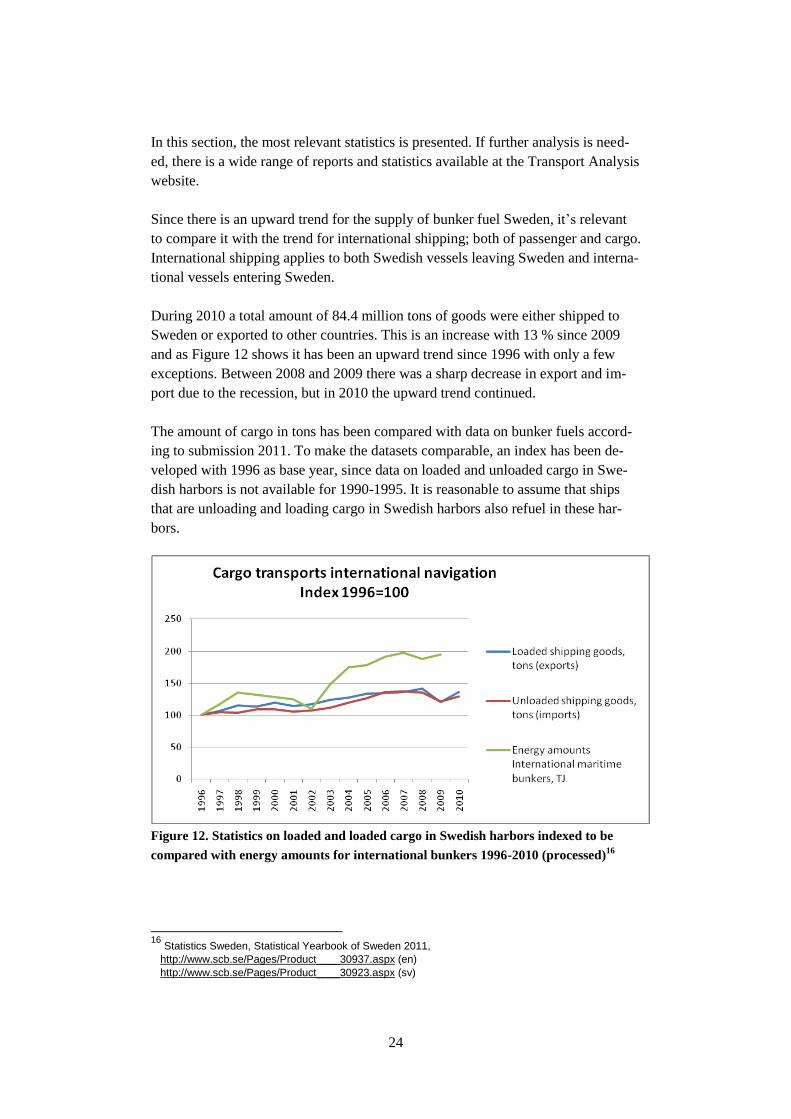
During 2010 a total amount of 84.4 million tons of goods were either shipped to
Sweden or exported to other countries. This is an increase with 13 % since 2009
and as Figure 12 shows it has been an upward trend since 1996 with only a few
exceptions. Between 2008 and 2009 there was a sharp decrease in export and im-
port due to the recession, but in 2010 the upward trend continued.
The amount of cargo in tons has been compared with data on bunker fuels accord-
ing to submission 2011. To make the datasets comparable, an index has been de-
veloped with 1996 as base year, since data on loaded and unloaded cargo in Swe-
dish harbors is not available for 1990-1995. It is reasonable to assume that ships
that are unloading and loading cargo in Swedish harbors also refuel in these har-
bors.
Figure 12. Statistics on loaded and loaded cargo in Swedish harbors indexed to be
compared with energy amounts for international bunkers 1996-2010 (processed)16
16
Statistics Sweden, Statistical Yearbook of Sweden 2011,
http://www.scb.se/Pages/Product____30937.aspx (en)
http://www.scb.se/Pages/Product____30923.aspx (sv)
25
Please note that passenger traffic is not included in the cargo data, however fuel
consumption for international passenger traffic is included in the data on fuel con-
sumption. Time series are clearly correlated until approximately 2003, however
fluctuations diverge. Cargo freight explains a large part of the fuel consumption for
international bunkers. For later years, the increase in international bunkers exceeds
the increase for shipping goods. This is mainly due to the expanded fleet of lighters
as discussed above. Ships may, more frequently, refuel in Sweden when passing by
(for example on the west coast), without loading or unloading any goods.
The number of passengers ships and ferries arriving and departing from Sweden
during 2009 amounted to 1 926 739, which is a decrease of 5 % since 2008. This
has been a decreasing trend since 1991, with only a few deviations. However, the
tonnage17 of both the passenger-ships and ferries has increased during the same
time span just as for cargo vessels. In other words, ships have become much larger
since 1991.
There has also been a decrease in the number of passengers; from 32 350 thousands
in 2001 to 30 171 thousand in 2010. The trend seems to be a decrease in the num-
ber of passengers as well as the amount of passenger ships and ferries, whilst the
volume of the passenger ships and ferries increase. But according to experts at
Statistics Sweden’s transport statistics18
, numerous ferries don’t carry passengers
but only cargo-trucks and their drivers. This means that this category of ships also
carries a lot of cargo and not only passengers, despite being referred to as ferries
and not cargo vessels.
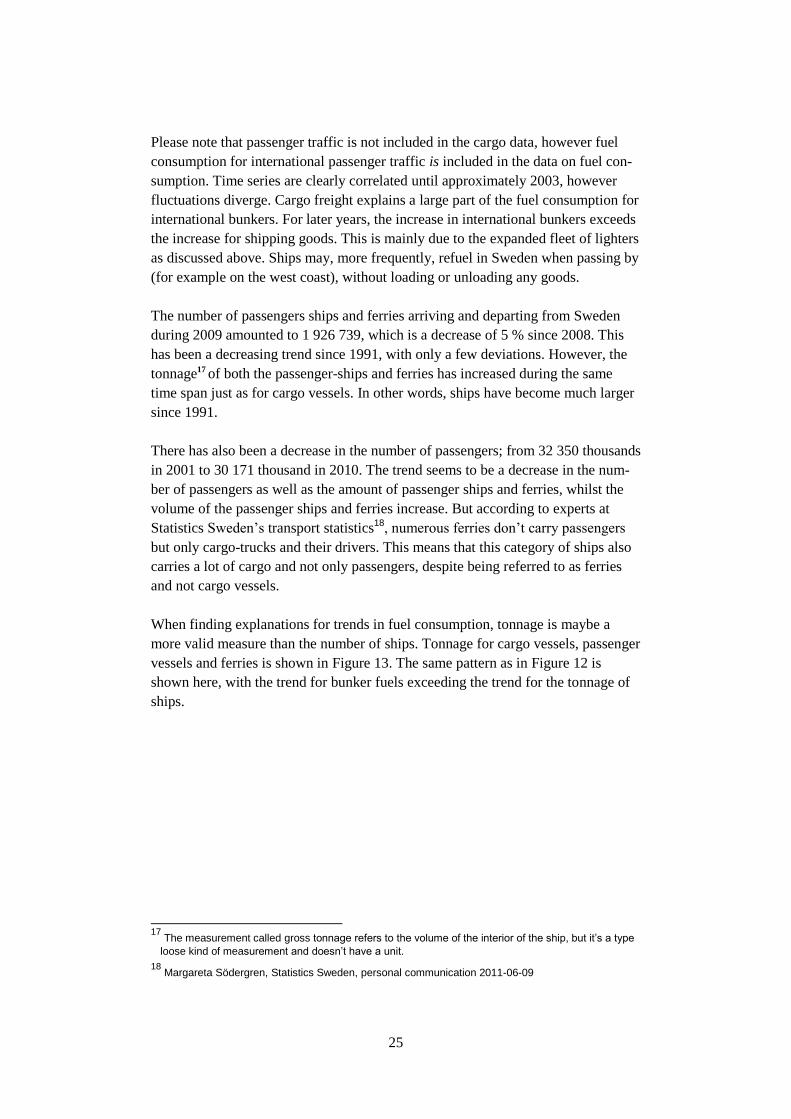
When finding explanations for trends in fuel consumption, tonnage is maybe a
more valid measure than the number of ships. Tonnage for cargo vessels, passenger
vessels and ferries is shown in Figure 13. The same pattern as in Figure 12 is
shown here, with the trend for bunker fuels exceeding the trend for the tonnage of
ships.
17
The measurement called gross tonnage refers to the volume of the interior of the ship, but it’s a type
loose kind of measurement and doesn’t have a unit.
18 Margareta Södergren, Statistics Sweden, personal communication 2011-06-09
26
Figure 13 Indexed statistics on gross tonnage of ships arriving and departing Sweden
compared with indexed energy amounts for international bunkers 1990-201019
National Accounts
Swedish National Accounts at Statistics Sweden (producing among other things the
Swedish GDP) includes information on exports of fuel to foreign ships. This in-
formation is based upon energy data in Monthly fuel, gas and inventory statistics,
which is the same source that is verified in this study.
Trade statistics
In Statistics Sweden trade statistics20
, information on amount of bunker fuels sold
to foreign registered aircrafts and ships can be found from 2004 onwards. (N.B
that Swedish registered ships buying bunker oils are not included in their statistics,
as in the bunker data reported to UNFCCC). Unfortunately, aviation fuel and mari-
time fuel cannot be separated. If adding aviation bunkers according to the
UNFCCC reporting, data can be compared and we get information on what share
of the bunker fuel is used by domestic actors or foreign actors, see Figure 14 be-
low.
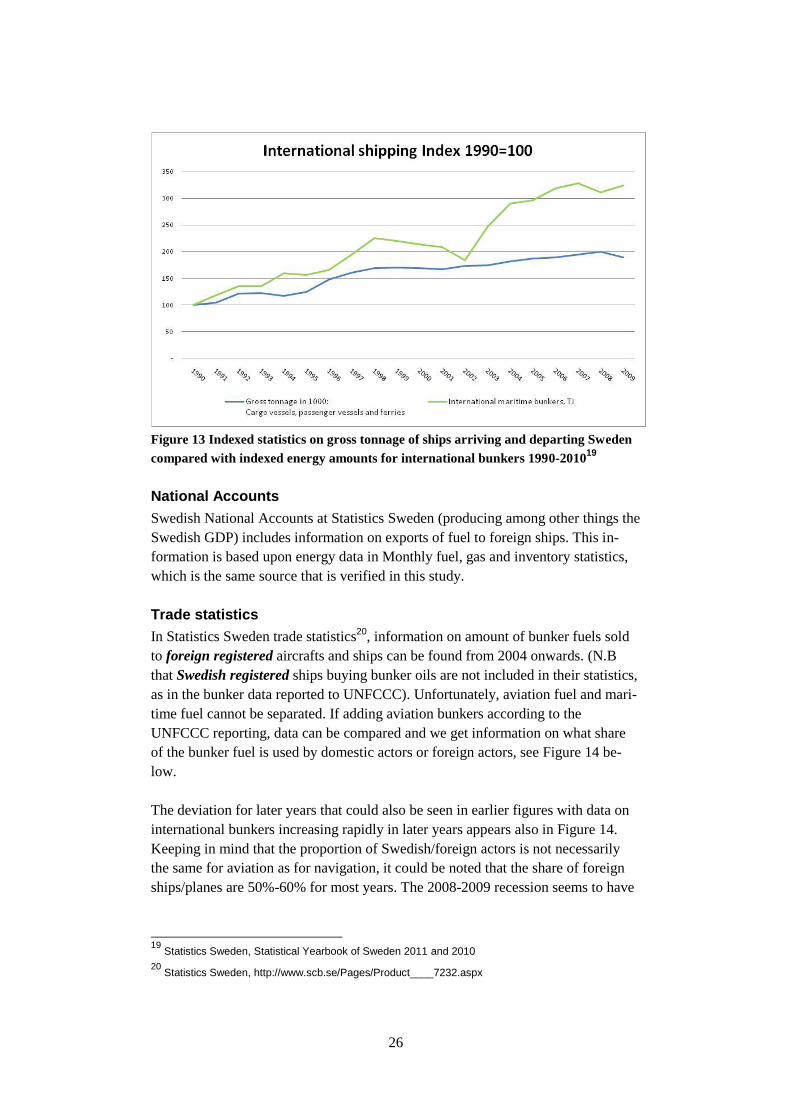
The deviation for later years that could also be seen in earlier figures with data on
international bunkers increasing rapidly in later years appears also in Figure 14.
Keeping in mind that the proportion of Swedish/foreign actors is not necessarily
the same for aviation as for navigation, it could be noted that the share of foreign
ships/planes are 50%-60% for most years. The 2008-2009 recession seems to have
19
Statistics Sweden, Statistical Yearbook of Sweden 2011 and 2010
20 Statistics Sweden, http://www.scb.se/Pages/Product____7232.aspx
27
affected foreign registered ships/planes more, the share of bunker fuels to foreign
registered ships and planes being 39% and 35% these years.
Figure 14. Bunker fuels according to UNFCCC reporting, covering Swedish as well as
foreign ships and aircrafts compared with bunker fuels to foreign ships and aircrafts
according to Trade statistics.
Fuel prices, taxes and VAT
Swedish Petroleum Institute (SPI) is a trade association for fuel companies in Swe-
den. Statistics published by SPI are mainly based on data from Statistics Sweden,
Eurostat, BP Statistical Review and Nordea e-Markets.
According to SPI, crude oil and oil products of equivalent quality are traded at
approximately the same price for each product all over the world if shipping costs
excluded. The global price of crude oil and petroleum products is controlled by
supply and demand, economic forecasts, conflicts, production forecasts, stocks,
season, weather forecasts, accidents and many other factors. As a result of this,
almost all trade is on shorter contracts, and prices are set by day.
Prices of oil products in Sweden are according to SPI determined by
Market conditions
International product prices in U.S. dollars
Exchange rate SEK/U.S. dollars
Taxes and VAT21
21
http://spi.se/var-bransch/marknadssituationen/oljepris
28
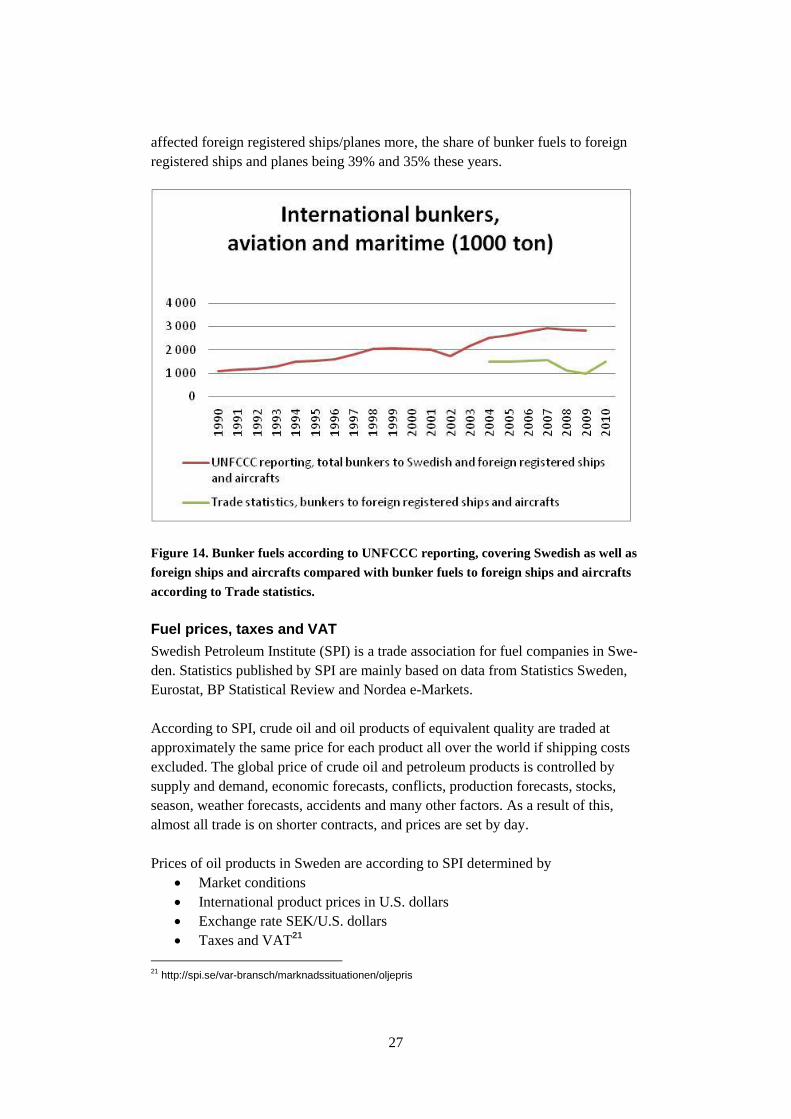
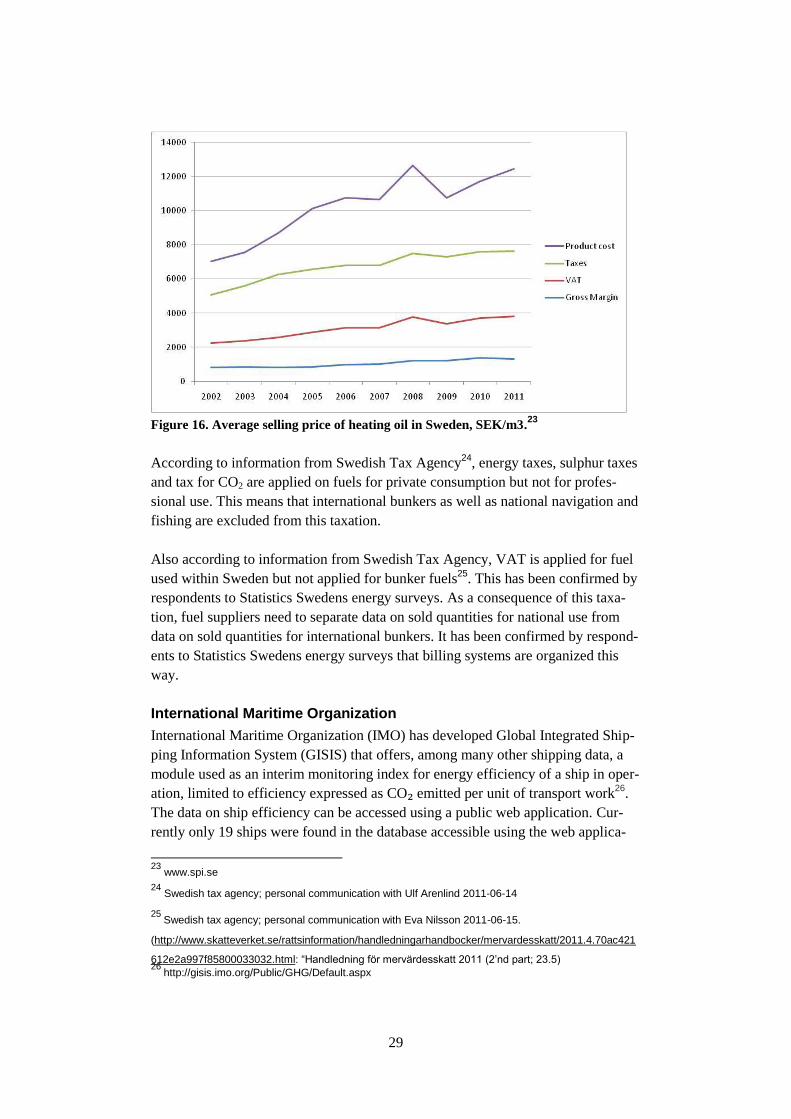
As can be seen from Figure 15 and Figure 16 below, prices have increased since
2001; the most significant change being within production costs, including large
fluctuations during the 2008-2009 recession. VAT is 20 % of sales prices all years.
Taxes have according to SPI actually decreased during the period, being 40% -
45% in the beginning of the period and 30% - 35% at the end of the period. Prices
as seen in these time series do not seem to have any significant influence on in-
creases or decreases in fuel consumption as reported to Monthly fuel, gas and in-
ventory statistics used for reporting to UNFCCC.
Figure 15. Sales prices (bulk) for diesel oil in Sweden, SEK / l. Average price for diesel
fuel for stocks selling via truck directly to large customer's facilities.22
22
www.spi.se
29
Figure 16. Average selling price of heating oil in Sweden, SEK/m3.
23
According to information from Swedish Tax Agency24
, energy taxes, sulphur taxes
and tax for CO2 are applied on fuels for private consumption but not for profes-
sional use. This means that international bunkers as well as national navigation and
fishing are excluded from this taxation.
Also according to information from Swedish Tax Agency, VAT is applied for fuel
used within Sweden but not applied for bunker fuels25
. This has been confirmed by
respondents to Statistics Swedens energy surveys. As a consequence of this taxa-
tion, fuel suppliers need to separate data on sold quantities for national use from
data on sold quantities for international bunkers. It has been confirmed by respond-
ents to Statistics Swedens energy surveys that billing systems are organized this
way.
International Maritime Organization
International Maritime Organization (IMO) has developed Global Integrated Ship-
ping Information System (GISIS) that offers, among many other shipping data, a
module used as an interim monitoring index for energy efficiency of a ship in oper-
ation, limited to efficiency expressed as CO₂ emitted per unit of transport work26
.
The data on ship efficiency can be accessed using a public web application. Cur-
rently only 19 ships were found in the database accessible using the web applica-
23
www.spi.se
24 Swedish tax agency; personal communication with Ulf Arenlind 2011-06-14
25 Swedish tax agency; personal communication with Eva Nilsson 2011-06-15.
(http://www.skatteverket.se/rattsinformation/handledningarhandbocker/mervardesskatt/2011.4.70ac421
612e2a997f85800033032.html: “Handledning för mervärdesskatt 2011 (2’nd part; 23.5) 26
http://gisis.imo.org/Public/GHG/Default.aspx

30
tion, suggesting that the database is not yet usable for global purposes. The data is
presented as a table with efficiency described as emitted CO2 per transported unit
of goods. One purpose of the system could be to compare different ships, in order
to select the most efficient one for transport services.
31
Conclusions and recommenda-tions
Data on international bunker fuel in Monthly fuel, gas and inventory statistics have
been found to be of excellent quality. As a consequence of that VAT is applied on
national fuel consumption but not on international bunkers, all respondents to the
survey are able to separate these fuel amounts with high accuracy. Fuels used for
domestic and international navigation have been separated correctly and in line
with IPCC Guidelines. Fluctuations in time series are to a large extent due to “spot
sales”. Occasional fluctuations in time series for international maritime bunkers
should be expected. The increasing trend is, in addition to driving forces such as
amount of goods or tonnage of the fleet, due to acquired international customers
and an expansion in the fleet of lighters.
Various data from energy statistics, transport statistics, trade statistics and fuel
price statistics have been found and could be used further if additional analysis is
wanted.
Current data should be used also in the future for reporting to the UNFCCC.
32
References
Data and websites
Data from Statistics Sweden Monthly fuel, gas and inventory statistics
Results from and documentation on this survey is available online at
http://www.scb.se/Pages/Product____6359.aspx (sv)
http://www.scb.se/Pages/Product____6347.aspx (en)
http://www.scb.se/Pages/ProductDocumentations____18813.aspx
Transport statistics: http://www.trafa.se/Statistik/Sjofart/
Trade statistics: http://www.scb.se/Pages/Product____7232.aspx
Swedish Petroleum Institute:
www.spi.se,
http://spi.se/var-bransch/marknadssituationen/oljepris
System of Environmental and Economic Accounts:
http://www.scb.se/Pages/Product____38175.aspx
Statistical Yearbook of Sweden:
http://www.scb.se/Pages/Product____30937.aspx (en)
http://www.scb.se/Pages/Product____30923.aspx (sv)
Swedish statutes: SFS 2001:99, SFS 2001:100, STEMFS 2006:1
http://www.sweden.gov.se/sb/d/3288/ (en)
http://62.95.69.15/ (sv)
Swedish Tax Agency:
http://www.skatteverket.se/rattsinformation/handledningarhandbocker/mer
vardesskatt/2011.4.70ac421612e2a997f85800033032.html
Reports
Cooper, D., Flodström, E. Gustafsson, T. and Jernström, M. (2005) Emission fac-
tors, fuel consumption and emission estimates for Sweden’s fishing fleet 1990-
2004
Gustafsson, T. (2005). Update of gasoline consumption and emissions from leisure
boats in Sweden 1990-2003 for international reporting. SMED-report.
Segersson D. et al, 2010. A dynamic emission database for shipping, phase 1.
SMHI Report 2010-37.
Statistics Sweden: Statistical Yearbook of Sweden 2011 and 2010
33
Swedish Board of Fisheries 2010: Kartläggning av energianvändning och energief-
fektiviserande åtgärder inom svensk fiskesektor 2007
Swedish Energy Agency:
ER 2006:35/Statistics Sweden 2006: Energianvändning inom fiskesektorn
2005
ER2007:26 Energianvändning för inrikes sjöfart år 2006.
ER 2010:12 Uppdrag energikartläggning av de areella näringarna
ES 2009:04 Transportsektorns energianvändning 2008
ES 2010:04 Transportsektorns energianvändning 2009
ES 2011:05 Transportsektorns Energianvändning 2010
Utveckling av statistikunderlaget avseende transportsektorns energian-
vändning (2009)
Personal communication
Statistics Sweden; Margareta Södergren 2011-06-09
Swedish Energy Agency; Niklas Notstrand 2011-05-18
Swedish Tax Agency; Ulf Arenlind 2011-06-14
Swedish Tax Agency; Eva Nilsson 2011-06-15