
Emerging Technologies and Opportunities for Improved ...
238
EMERGING TECHNOLOGIES AND OPPORTUNITIES FOR IMPROVED MOBILITY AND SAFETY FOR RURAL AREAS Final Report Publication No. FHWA-PL-022-004 September 3, 2021
-
Upload
khangminh22 -
Category
Documents
-
view
0 -
download
0
Transcript of Emerging Technologies and Opportunities for Improved ...
EMERGING TECHNOLOGIES AND OPPORTUNITIES FOR IMPROVED MOBILITY AND SAFETY FOR RURAL AREAS Final Report
Publication No. FHWA-PL-022-004
September 3, 2021
Notice
This document is disseminated under the sponsorship of the U.S. Department of Transportation in the interest of information exchange. The U.S. Government assumes no liability for the use of the information contained in this document.
The U.S. Government does not endorse products or manufacturers. Trademarks or manufacturers' names appear in this report only because they are considered essential to the objective of the document.
Quality Assurance Statement
The Federal Highway Administration (FHWA) provides high-quality information to serve Government, industry, and the public in a manner that promotes public understanding. Standards and policies are used to ensure and maximize the quality, objectivity, utility, and integrity of its information. FHWA periodically reviews quality issues and adjusts its programs and processes to ensure continuous quality improvement.
i
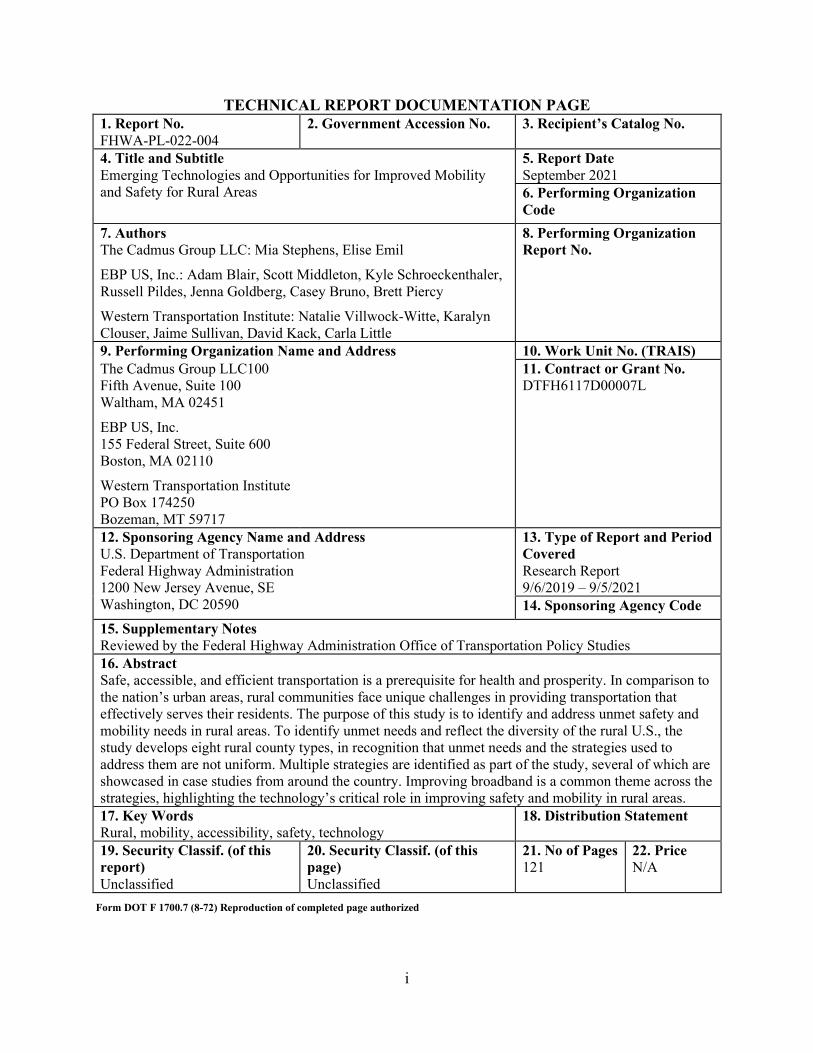
TECHNICAL REPORT DOCUMENTATION PAGE 1. Report No.FHWA-PL-022-004
2. Government Accession No. 3. Recipient’s Catalog No.
4. Title and SubtitleEmerging Technologies and Opportunities for Improved Mobilityand Safety for Rural Areas
5. Report DateSeptember 20216. Performing OrganizationCode
7. AuthorsThe Cadmus Group LLC: Mia Stephens, Elise Emil
EBP US, Inc.: Adam Blair, Scott Middleton, Kyle Schroeckenthaler, Russell Pildes, Jenna Goldberg, Casey Bruno, Brett Piercy
Western Transportation Institute: Natalie Villwock-Witte, Karalyn Clouser, Jaime Sullivan, David Kack, Carla Little
8. Performing OrganizationReport No.
9. Performing Organization Name and Address 10. Work Unit No. (TRAIS)The Cadmus Group LLC100Fifth Avenue, Suite 100Waltham, MA 02451
EBP US, Inc. 155 Federal Street, Suite 600 Boston, MA 02110
Western Transportation Institute PO Box 174250 Bozeman, MT 59717
11. Contract or Grant No.DTFH6117D00007L
12. Sponsoring Agency Name and AddressU.S. Department of TransportationFederal Highway Administration1200 New Jersey Avenue, SEWashington, DC 20590
13. Type of Report and PeriodCoveredResearch Report9/6/2019 – 9/5/202114. Sponsoring Agency Code
15. Supplementary NotesReviewed by the Federal Highway Administration Office of Transportation Policy Studies16. AbstractSafe, accessible, and efficient transportation is a prerequisite for health and prosperity. In comparison tothe nation’s urban areas, rural communities face unique challenges in providing transportation thateffectively serves their residents. The purpose of this study is to identify and address unmet safety andmobility needs in rural areas. To identify unmet needs and reflect the diversity of the rural U.S., thestudy develops eight rural county types, in recognition that unmet needs and the strategies used toaddress them are not uniform. Multiple strategies are identified as part of the study, several of which areshowcased in case studies from around the country. Improving broadband is a common theme across thestrategies, highlighting the technology’s critical role in improving safety and mobility in rural areas.17. Key WordsRural, mobility, accessibility, safety, technology
18. Distribution Statement
19. Security Classif. (of thisreport)Unclassified
20. Security Classif. (of thispage)Unclassified
21. No of Pages121
22. PriceN/A
Form DOT F 1700.7 (8-72) Reproduction of completed page authorized
ii
TABLE OF CONTENTS
Executive Summary ...................................................................................................................... 1
Defining Rural Area Types (See Chapter 2) ....................................................................... 1
Unmet Needs (See Chapter 3) .............................................................................................. 3
Strategies & Case Studies (See Chapters 4 & 5) ................................................................ 4
Research Findings (See Chapter 6) ..................................................................................... 6
Chapter 1. Introduction and Approach ...................................................................................... 7
Background ........................................................................................................................... 7
Research Overview and Objectives ..................................................................................... 7
Impact of COVID-19 on Research ...................................................................................... 8
Document Organization ....................................................................................................... 9
Chapter 2. Rural Area Classification System........................................................................... 10
Purpose of Classification System ....................................................................................... 10
Classification Process.......................................................................................................... 10
Adopted Classification System .......................................................................................... 11
Key Takeaways.................................................................................................................... 13
Chapter 3. Unmet Needs Analysis ............................................................................................. 14
What Are Unmet Needs? .................................................................................................... 14
Process for Identifying Unmet Needs for Performance Measure Calculation .............. 14
Unmet Safety Needs ............................................................................................................ 14
Unmet Mobility and Access Needs .................................................................................... 18
Influence of Vehicle Availability on Unmet Needs........................................................... 23
Key Takeaways.................................................................................................................... 24
Chapter 4. Strategies to Address Unmet Needs ....................................................................... 25
Strategy Development ......................................................................................................... 25
Broadband Strategies ......................................................................................................... 25
Vehicle Strategies ................................................................................................................ 27
Improved Communication Strategies ............................................................................... 30
Infrastructure and Program Development Strategies ..................................................... 32
Key Takeaways.................................................................................................................... 35
Chapter 5. Case Studies .............................................................................................................. 36
Case Study Development .................................................................................................... 36
Pocahontas Bikeshare ......................................................................................................... 37
Washington State Unmanned Aerial Systems (UAS) ...................................................... 38
iii
Door County Mobility-on-Demand (MOD) ...................................................................... 40
Jackson County Broadband ............................................................................................... 42
ITS for Speed Management in Elmira, New York........................................................... 44
Key Takeaways.................................................................................................................... 46
Chapter 6. Research Findings .................................................................................................... 48
Rural Area Classification ................................................................................................... 48
Unmet Needs in Diverse Rural Areas ................................................................................ 48
Strategies for Addressing Unmet Needs ........................................................................... 49
Case Study Findings ........................................................................................................... 50
Lessons Learned and Future Opportunities..................................................................... 50
References .................................................................................................................................... 52
Appendix A. Rural Area Classification Systems Reviewed .................................................... 58
Appendix B. County Classification Map .................................................................................. 66
Appendix C. Additional Unmet Needs Explored ..................................................................... 67
Appendix D. Unmet Needs and Performance Measures ....................................................... 184
Appendix E. Associated Unmet Needs, Performance Measures Impacted, Expected Impact on Travel Behavior & Challenges/Limitations of Strategies ................................................ 185
Appendix F. Organizations Contacted .................................................................................... 219
Appendix G. Strategies Identified and Considered ............................................................... 220
Appendix H. Summary Statistics for Case Study Locations ................................................ 223
Appendix I. Detailed Case Study Timelines ........................................................................... 226
iv
LIST OF FIGURES
Figure 1. U.S. counties shaded according to their county type. ................................................ 2 Figure 2. Share of households with no broadband available by county type. ......................... 4 Figure 3. Case study locations and their descriptions. .............................................................. 5 Figure 4. Case study locations and their descriptions. ............................................................ 36 Figure 5. Pocahontas County, Iowa .......................................................................................... 37 Figure 6. Washington State ........................................................................................................ 38 Figure 7. Door County, Wisconsin ............................................................................................ 40 Figure 8. Jackson County, Kentucky. ....................................................................................... 42 Figure 9. Elmira and Chemung County, New York. ............................................................... 44 Figure 10. U.S. counties shaded according to their classification category. .......................... 66

v
LIST OF TABLES
Table 1. Classification characteristics of county types, ordered by total population. ............ 1 Table 2. Prioritized needs and performance measures. ............................................................ 3 Table 3. Classification characteristics of rural counties ordered by total population. ......... 13 Table 4. Summary findings for worst-performing county types .......................................... 184
vi
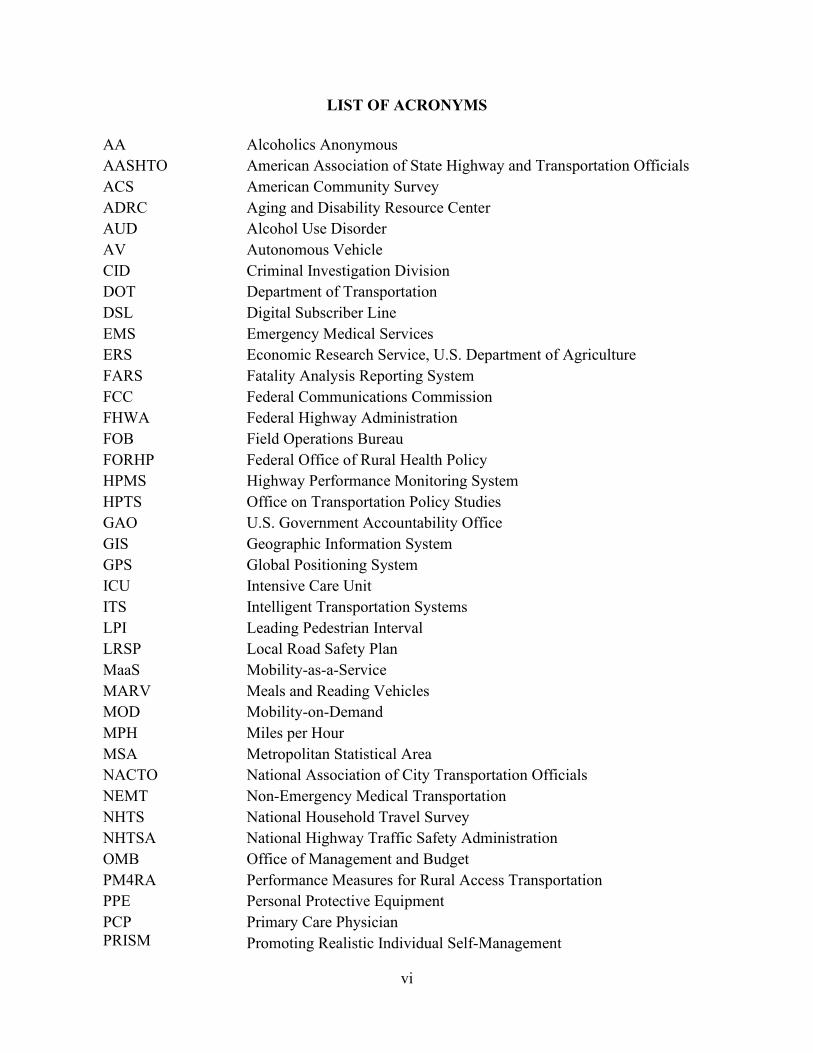
LIST OF ACRONYMS
AA AASHTO ACS ADRC AUD AV CID DOT DSL EMS ERS FARS FCC FHWA FOB FORHP HPMS HPTS GAO GIS GPS ICU ITS LPI LRSP MaaS MARV MOD MPH MSA NACTO NEMT NHTS NHTSA OMB PM4RA PPE PCP PRISM
Alcoholics Anonymous American Association of State Highway and Transportation Officials American Community Survey Aging and Disability Resource Center Alcohol Use Disorder Autonomous Vehicle Criminal Investigation Division Department of Transportation Digital Subscriber Line Emergency Medical Services Economic Research Service, U.S. Department of Agriculture Fatality Analysis Reporting System Federal Communications Commission Federal Highway Administration Field Operations Bureau Federal Office of Rural Health Policy Highway Performance Monitoring System Office on Transportation Policy Studies U.S. Government Accountability Office Geographic Information System Global Positioning System Intensive Care Unit Intelligent Transportation Systems Leading Pedestrian Interval Local Road Safety Plan Mobility-as-a-Service Meals and Reading Vehicles Mobility-on-Demand Miles per Hour Metropolitan Statistical Area National Association of City Transportation Officials Non-Emergency Medical Transportation National Household Travel Survey National Highway Traffic Safety Administration Office of Management and Budget Performance Measures for Rural Access Transportation Personal Protective Equipment Primary Care Physician Promoting Realistic Individual Self-Management
vii
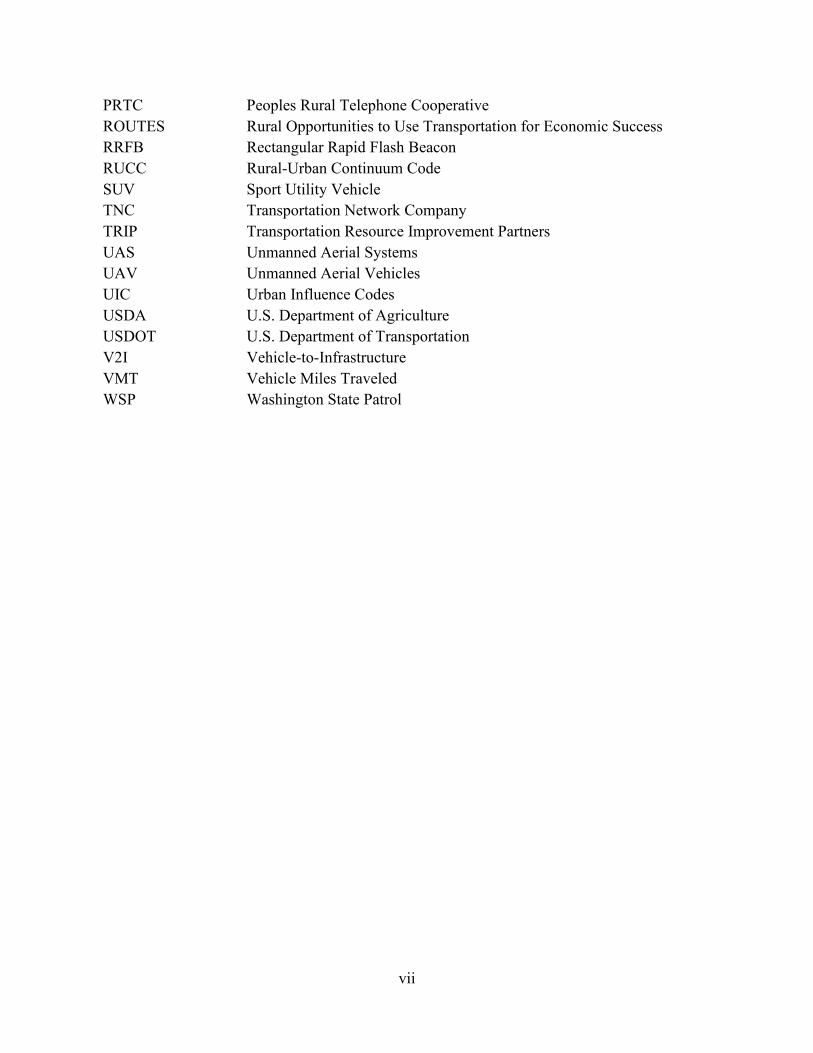
PRTC ROUTES RRFB RUCC SUV TNC TRIP UAS UAV UIC USDA USDOT V2I VMT WSP
Peoples Rural Telephone Cooperative Rural Opportunities to Use Transportation for Economic Success Rectangular Rapid Flash Beacon Rural-Urban Continuum Code Sport Utility Vehicle Transportation Network Company Transportation Resource Improvement Partners Unmanned Aerial Systems Unmanned Aerial Vehicles Urban Influence Codes U.S. Department of Agriculture U.S. Department of Transportation Vehicle-to-Infrastructure Vehicle Miles Traveled Washington State Patrol
1
EXECUTIVE SUMMARY
Safe, accessible, and efficient transportation enhances the quality of life and provides opportunities for people and businesses to thrive. Both rural and urban communities face unique challenges in providing transportation options to their residents. The purpose of this study is to explore the potential of new technologies and opportunities in providing solutions in rural areas. Rather than focusing on how technologies deployed in urban areas might be transferred to rural areas, the study approaches the topic through a rural lens. This means specifying rural needs and their potential costs then identifying the most appropriate strategies to address them.
Multiple strategies are identified as part of this study, several of which are exemplified in case studies from around the country. This study presents the many unmet safety, mobility, and access needs in rural counties. Improving broadband is a common theme across the strategies, which demonstrates the critical role of broadband in improving safety and mobility in rural areas.
Defining Rural Area Types (See Chapter 2)
Rural America is very diverse, spanning from the remote areas of Alaska to small towns in the Appalachian Mountains. A key requirement for identifying rural mobility and safety needs is
accurately classifying rural areas.
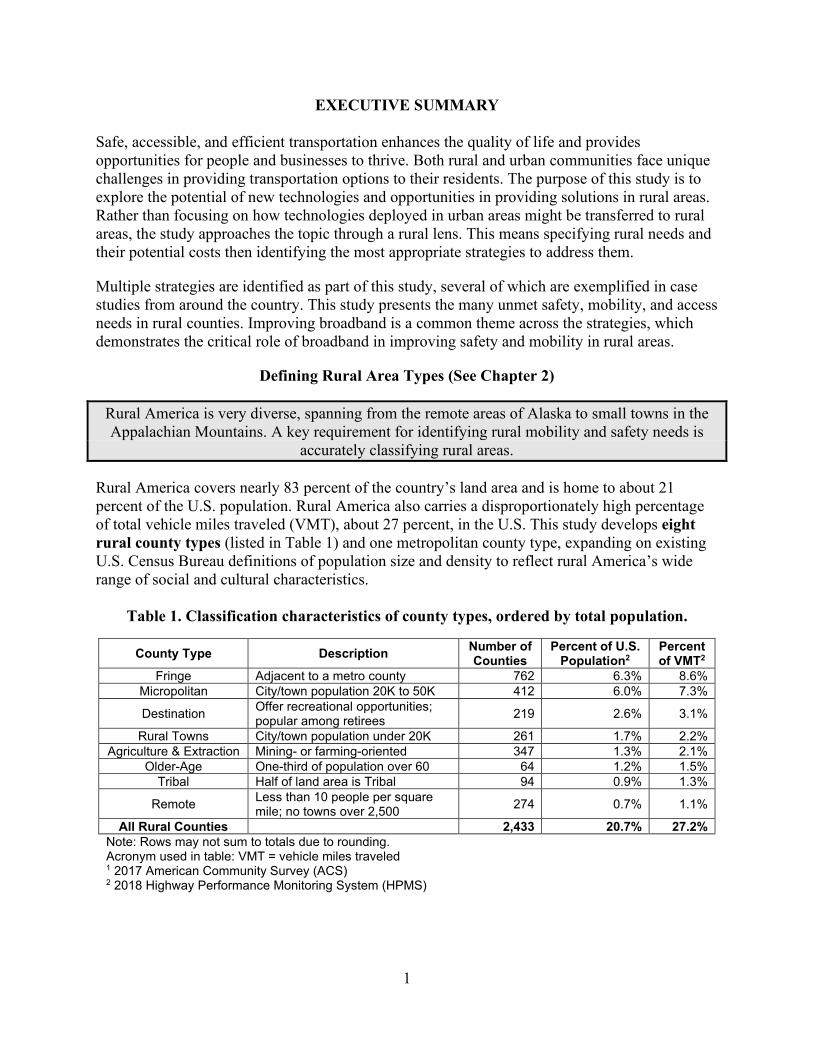
Rural America covers nearly 83 percent of the country’s land area and is home to about 21 percent of the U.S. population. Rural America also carries a disproportionately high percentage of total vehicle miles traveled (VMT), about 27 percent, in the U.S. This study develops eight rural county types (listed in Table 1) and one metropolitan county type, expanding on existing U.S. Census Bureau definitions of population size and density to reflect rural America’s wide range of social and cultural characteristics.
Table 1. Classification characteristics of county types, ordered by total population.
County Type Description Number of Counties
Percent of U.S. Population2
Percent of VMT2
Fringe Adjacent to a metro county 762 6.3% 8.6% Micropolitan City/town population 20K to 50K 412 6.0% 7.3%
Destination Offer recreational opportunities; popular among retirees 219 2.6% 3.1%
Rural Towns City/town population under 20K 261 1.7% 2.2% Agriculture & Extraction Mining- or farming-oriented 347 1.3% 2.1%
Older-Age One-third of population over 60 64 1.2% 1.5% Tribal Half of land area is Tribal 94 0.9% 1.3%
Remote Less than 10 people per square mile; no towns over 2,500 274 0.7% 1.1%
All Rural Counties 2,433 20.7% 27.2% Note: Rows may not sum to totals due to rounding. Acronym used in table: VMT = vehicle miles traveled 1 2017 American Community Survey (ACS) 2 2018 Highway Performance Monitoring System (HPMS)
2
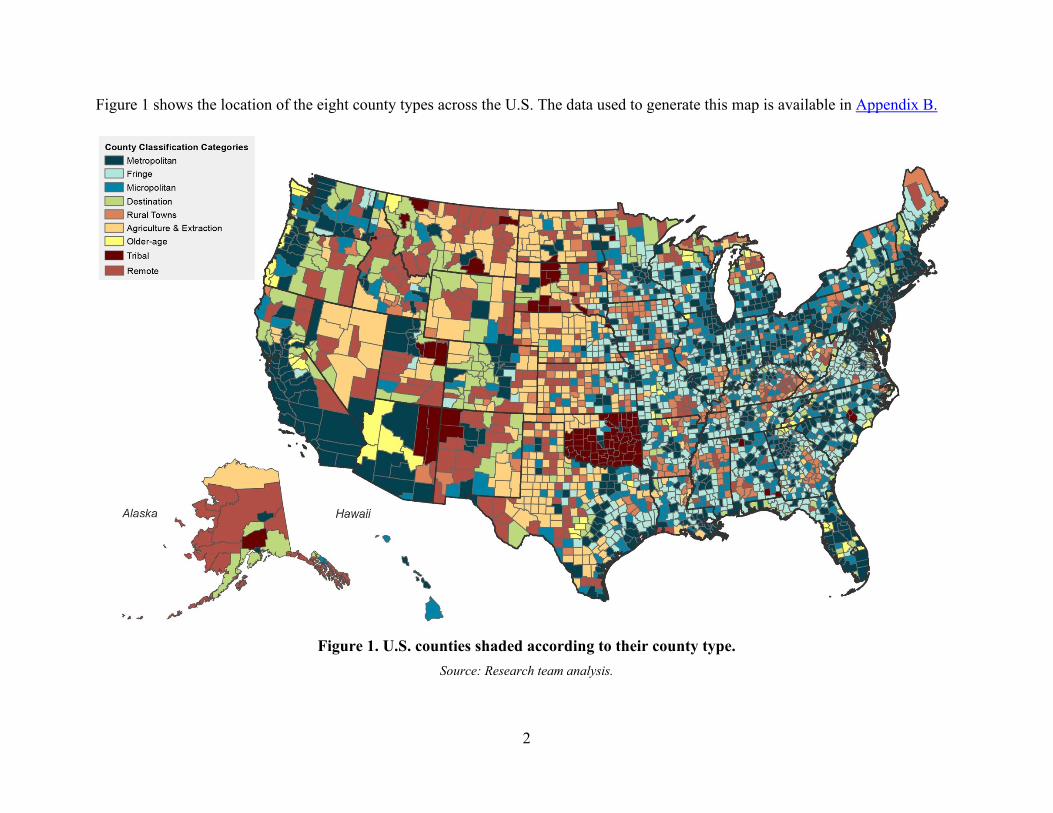
Figure 1 shows the location of the eight county types across the U.S. The data used to generate this map is available in Appendix B.
Figure 1. U.S. counties shaded according to their county type.
Source: Research team analysis.
3
Unmet Needs (See Chapter 3)
An unmet need represents a performance gap between rural places and urban places. Measuring these needs is necessary for understanding rural America’s safety and mobility challenges and
for identifying strategies that have the greatest chance of success.
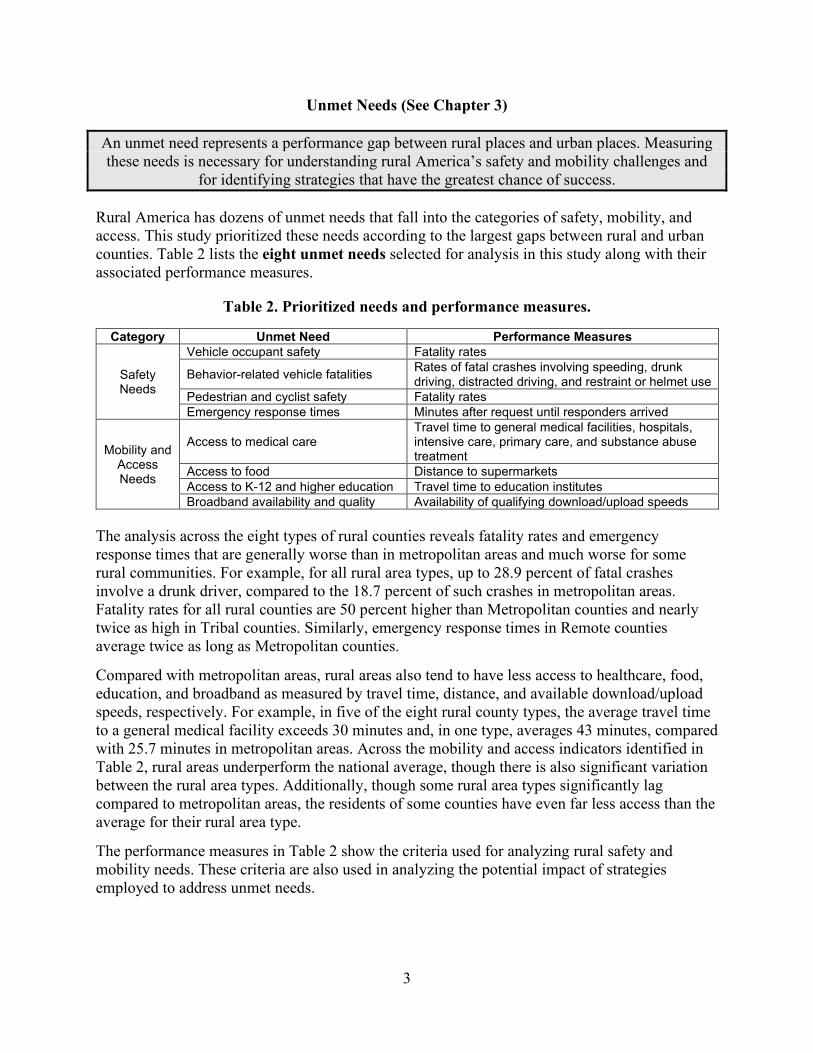
Rural America has dozens of unmet needs that fall into the categories of safety, mobility, and access. This study prioritized these needs according to the largest gaps between rural and urban counties. Table 2 lists the eight unmet needs selected for analysis in this study along with their associated performance measures.
Table 2. Prioritized needs and performance measures.
Category Unmet Need Performance Measures
Safety Needs
Vehicle occupant safety Fatality rates
Behavior-related vehicle fatalities Rates of fatal crashes involving speeding, drunk driving, distracted driving, and restraint or helmet use
Pedestrian and cyclist safety Fatality rates Emergency response times Minutes after request until responders arrived
Mobility and Access Needs
Access to medical care Travel time to general medical facilities, hospitals, intensive care, primary care, and substance abuse treatment
Access to food Distance to supermarkets Access to K-12 and higher education Travel time to education institutes Broadband availability and quality Availability of qualifying download/upload speeds
The analysis across the eight types of rural counties reveals fatality rates and emergency response times that are generally worse than in metropolitan areas and much worse for some rural communities. For example, for all rural area types, up to 28.9 percent of fatal crashes involve a drunk driver, compared to the 18.7 percent of such crashes in metropolitan areas. Fatality rates for all rural counties are 50 percent higher than Metropolitan counties and nearly twice as high in Tribal counties. Similarly, emergency response times in Remote counties average twice as long as Metropolitan counties.
Compared with metropolitan areas, rural areas also tend to have less access to healthcare, food, education, and broadband as measured by travel time, distance, and available download/upload speeds, respectively. For example, in five of the eight rural county types, the average travel time to a general medical facility exceeds 30 minutes and, in one type, averages 43 minutes, compared with 25.7 minutes in metropolitan areas. Across the mobility and access indicators identified in Table 2, rural areas underperform the national average, though there is also significant variation between the rural area types. Additionally, though some rural area types significantly lag compared to metropolitan areas, the residents of some counties have even far less access than the average for their rural area type.
The performance measures in Table 2 show the criteria used for analyzing rural safety and mobility needs. These criteria are also used in analyzing the potential impact of strategies employed to address unmet needs.
4
Strategies & Case Studies (See Chapters 4 & 5)
A strategy is broadly defined as a technology, system, or business model that helps address an unmet need in rural transportation safety and mobility. Strategies built on emerging technologies
and opportunities can address unmet needs faster or at a lower cost than strategies of the past.
The study identifies and prioritizes strategies that can help address unmet needs in rural America. Prioritization of strategies is based on multiple factors, including potential impact on the corresponding unmet need, scalability, and feasibility. Strategies fall into four categories:
• Vehicles. These strategies build on emerging vehicle technologies and mobility options available in urban areas but not available in most rural areas. Crash investigations by unmanned aerial systems is one example. Strategies like these can help address access limitations by adapting proven solutions to new settings.
• Improved communications. Communications strategies facilitate or expedite information exchange among systems and devices, resulting in safety or mobility benefits. Examples include vehicle speed feedback signs and telehealth treatment clinics.
• Infrastructure and program development. These strategies involve installation of or upgrades to supportive transportation infrastructure. They also include the development of specialized programs to address safety and mobility needs. Examples include mobility-on-demand programs and auto-activated flash beacons at crosswalks.
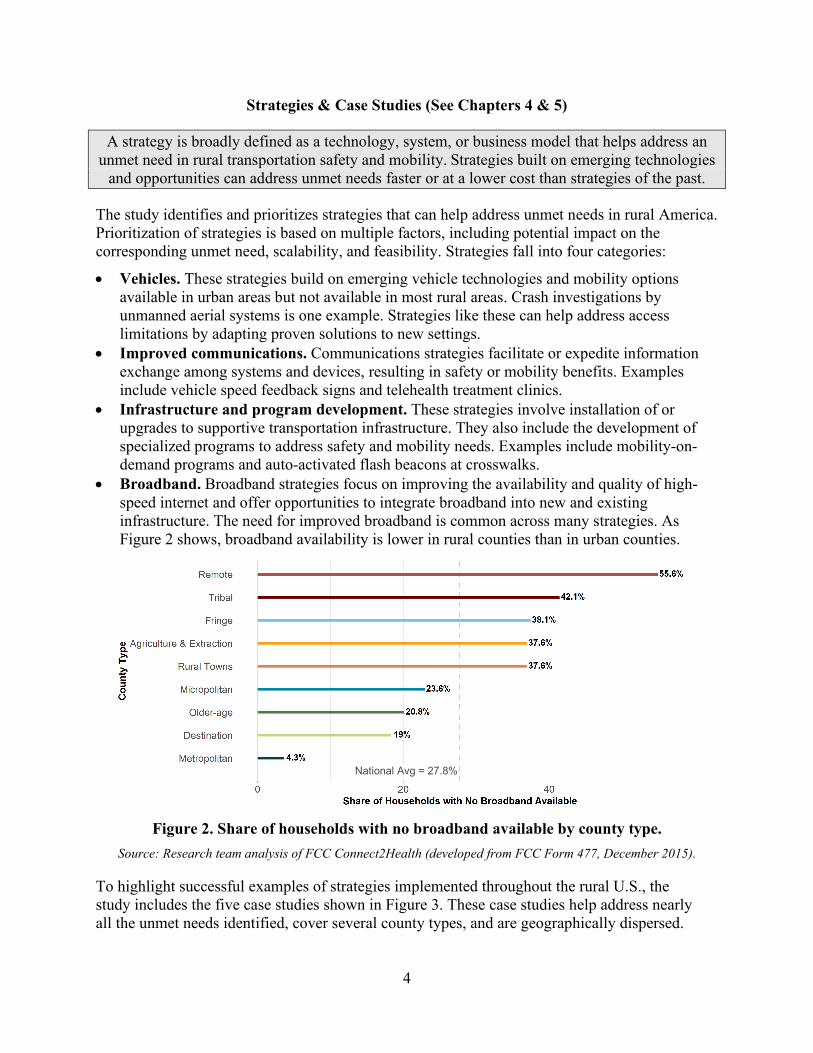
• Broadband. Broadband strategies focus on improving the availability and quality of high-speed internet and offer opportunities to integrate broadband into new and existing infrastructure. The need for improved broadband is common across many strategies. As Figure 2 shows, broadband availability is lower in rural counties than in urban counties.
Figure 2. Share of households with no broadband available by county type.
Source: Research team analysis of FCC Connect2Health (developed from FCC Form 477, December 2015).
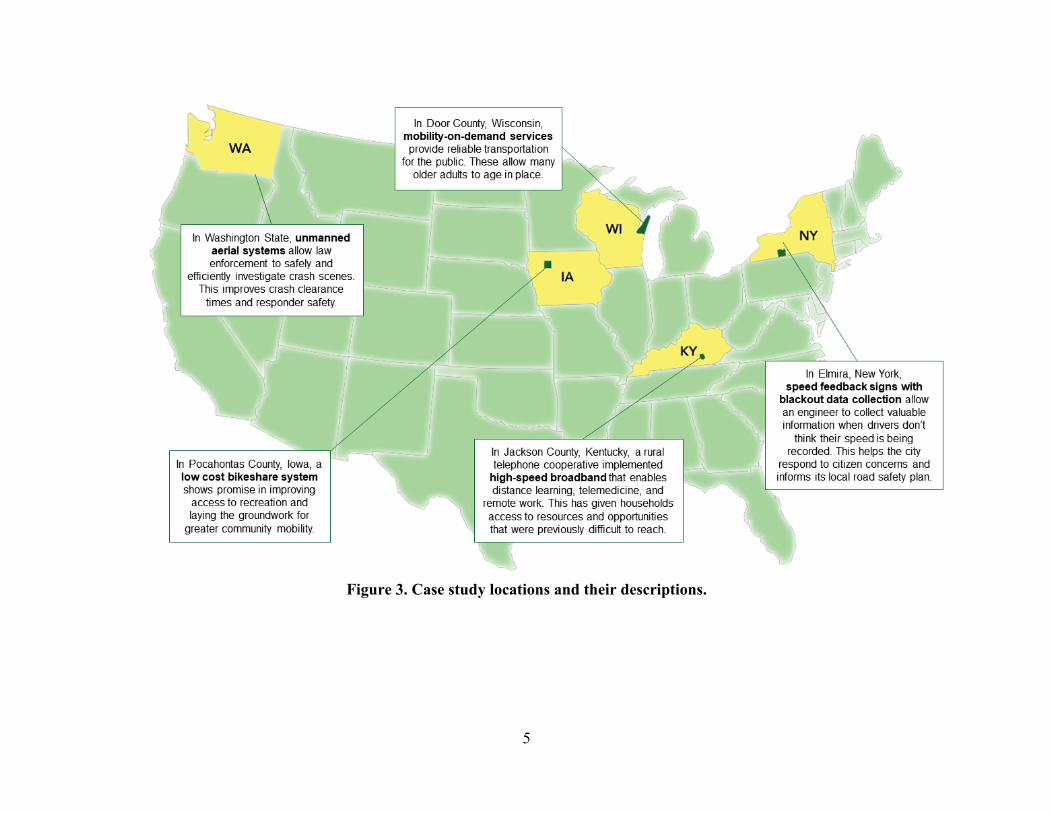
To highlight successful examples of strategies implemented throughout the rural U.S., the study includes the five case studies shown in Figure 3. These case studies help address nearly all the unmet needs identified, cover several county types, and are geographically dispersed.
National Avg = 27.8%
5
Figure 3. Case study locations and their descriptions.
6
Research Findings (See Chapter 6)
This study presents new detail on performance shortcomings for rural areas compared to metropolitan areas across various rural settings. The unmet needs to address these challenges are most acute in Remote counties, Agriculture & Extraction counties, and Tribal counties, where significant performance gaps exist. For example, Tribal counties have the highest vehicle fatality rate among all county types, at 1.9 fatalities per 100 million VMT. Similarly, rates of speeding-related fatal crashes are highest in Remote and Agriculture & Extraction counties, ranging from 23.5 to 25.5 percent of all fatal crashes. These county types also have relatively low access to medical facilities, education, and jobs.
By identifying these shortcomings, a rural lens can be applied to examine how new technologies and opportunities might be applied to close these gaps. Though requiring different solutions from metropolitan areas, rural areas deserve the same safety, mobility, and access. Emerging solutions offer new opportunities to address the unique challenges of rural areas, sometimes in very different ways than these technologies are being deployed in large cities.
The strategy analysis shows that, as new and emerging technologies continue to become available and cost-friendly, they can provide promising tools for improving access, mobility, and safety for rural residents. However, without access to broadband, many strategies cannot be implemented. Broadband today is synonymous with the economic benefits brought by the interstates of previous generations. Greater broadband deployments in rural areas will unlock new transportation options and transportation alternatives (such as telehealth), which together could improve connectivity and access in the way highway construction did 50 years ago.
Another common theme relates to the need for infrastructure to support non-motorized transportation in rural areas. Several strategies in the vehicle category involve more access to bicycles as an alternative transportation mode, but rural areas often lack bike lanes, separated trails, or other facilities that encourage bicycle use. Entities interested in these modes may also need to consider how to include supportive infrastructure, and in some cases vehicles, so rural residents have the same safe, healthy, low-cost, and environmentally friendly transportation choices as many metropolitan areas and equity is improved for all areas.
Finally, this research has shown that successful urban strategies cannot simply be transferred to a rural location without consideration of the infrastructure, resources, and challenges that exist in the rural environment. This research, as demonstrated in the case studies presented in Chapter 5, underscores the need for programs and expertise that are customized to rural transportation agencies and networks.
7
CHAPTER 1. INTRODUCTION AND APPROACH
This extensive study sheds new light on safety, mobility, and access needs in rural areas of the U.S. and identifies dozens of strategies that could be used to address such needs. The study also presents several case studies that demonstrate specific strategies in action. Uniquely, this research identifies the strategies appropriate for rural areas rather than simply applying urban solutions in the rural context.
This chapter provides a background on the purpose and motivations for the study, an overview of the research objectives, and a description of the study methodology, including the impact the COVID-19 pandemic had on the research. The methodology combines quantitative data analysis with qualitative discussions and literature reviews, which resulted in a nuanced understanding of the rural U.S. and its unique needs.
Background New approaches are needed to improve our understanding of rural areas. Emerging technologies are providing solutions to many transportation-related issues, especially in urban areas, but the feasibility and net benefits of technology-driven transportation solutions in a rural context are relatively unknown. The application of such solutions in rural communities is hampered by several factors including low density, local awareness, and funding availability, which can be explained in part by limited research on successes and failures. Specific emerging technologies could provide many opportunities for greater safety, mobility, and access in rural communities.
The purpose of this study is to explore the potential of new technologies and opportunities in providing solutions in rural areas. The study intentionally approaches the topic through a rural lens, rather than on how technologies deployed in urban areas might be transferred to rural areas. In practice, this means specifying rural needs and their potential costs then identifying the most appropriate strategies to address them.
Research Overview and Objectives This research provides a common understanding of the unmet safety, mobility and access needs of rural communities and their potential costs and of the applications of emerging modes and technologies that can improve rural safety, mobility, and access. Relationships are explored among the transportation technology, socioeconomics, infrastructure, travel behavior, and safety and mobility outcomes in rural areas.
The study uses data analysis, literature reviews, and case studies to accomplish several things. First, it analyzes the unique challenges faced in the rural U.S. Second, it provides insights into opportunities to turn the unique challenges of rural transportation into opportunities, including identifying dozens of strategies that may be specifically applicable to rural areas. For purposes of the study, a strategy is broadly defined as a technology, system, business model, process, or other means that helps facilitate enhanced transportation safety, mobility, and/or access. Finally, the study presents case studies that highlight lessons learned from the implementation of specific strategies. As discussed later in this report, the study found that limited access to quality broadband in rural areas is a common theme and major inhibitor to progress.
8
The study was guided by the following objectives:
• Address distinct needs across diverse rural areas. Rural areas in the U.S. have diverse populations and social/cultural characteristics. For instance, some are home to major extractive industries while others have tourism-dependent economies. Some are remote communities with limited access to resources while others are small towns at the fringes of metropolitan areas. To recognize the diversity of the rural U.S., this study defines eight distinct rural county types.
• Consider disparate safety outcomes in the rural U.S. Rural communities are disproportionately negatively affected by road safety issues. Of the 37,133 people who lost their lives in U.S. highway crashes in 2017, 15,565 of these deaths occurred in rural areas, making the fatality rate twice as high as in urban areas (NHTSA 2019). Adapting emerging transportation technologies and new opportunities to rural areas is a way to address this imbalance. Specifically, this research analyzes relationships among technology, infrastructure, travel patterns, and safety to better understand how to address unmet needs in rural areas through the application of emerging technologies and opportunities.
• Recognize the unique mobility and access challenges facing rural populations. For many residents of rural areas, access to medical care, food, education, broadband internet, and other essential goods and services is challenging. Rural mobility and access are limited by greater distances between destinations and fewer alternative means of travel for those without access to a personal vehicle (Mattson 2017). This study identifies emerging technologies and opportunities that can help address these gaps in mobility and access.
This research enhances the understanding of transportation planners and policymakers about rural communities and their unique transportation needs and opportunities. They can use insights from this research to inform how new technologies and opportunities to address mobility and safety issues in rural areas are incorporated into transportation programs and initiatives.
Impact of COVID-19 on Research
The research presented in this study was initiated in 2019, several months prior to the beginning of the COVID-19 pandemic. The pandemic and resulting social distancing requirements had a significant impact on the collection of case study data. The original plan was to complement phone conversations and publicly available data with in-person conversations and site visits in fall 2020. Though the study considered adjusting the timing of these in-person discussions to accommodate the pandemic, ultimately a decision was made to collect all data remotely (i.e., by telephone and video conference) due to the uncertainty of travel restrictions and personal safety. Though the case studies may be less comprehensive because the researchers could not collect details on site or take photographs, this approach ensured the safety of case study participants and researchers during the pandemic.
The pandemic also created the opportunity for rural residents to experiment with technology-driven solutions for mobility challenges. For example, in 2020, many underserved, rural communities in North Carolina were provided access to used school buses equipped with Wi-Fi hotspots to support telework, distance learning, and telehealth services (Childress 2020). Similarly, the pandemic has accelerated the testing and deployment of certain applications of
9
unmanned aerial system (UAS) delivery that could be used to increase safety and access. In North Carolina, for example, a UAS has been used to deliver personal protective equipment (PPE) to health care providers across the state during the pandemic.
Document Organization
The rest of this report is organized as follows, with each chapter building on preceding content:
• Chapter 2 defines eight distinct rural county types to be compared to Metropolitan counties and to one another in the subsequent analysis of mobility and safety needs.
• Chapter 3 uses the rural classification system to analyze mobility and safety performance measures that help identify unmet safety and mobility needs in rural areas.
• Chapter 4 presents strategies that have the potential to address the unmet mobility and safety needs.
• Chapter 5 contains case studies highlighting examples of rural organizations using various strategies to address unmet needs in their communities.
• Chapter 6 synthesizes and compiles the information gathered across the four preceding chapters.
10
CHAPTER 2. RURAL AREA CLASSIFICATION SYSTEM
There is significant diversity in social, cultural, and socioeconomic characteristics among rural areas in the U.S. In considering this diversity, research has tried to answer the question, “What is rural?” This study further refines this question by defining eight distinct rural county types to be compared with metropolitan areas and one another. This classification is critical to identifying unmet safety, mobility, and access needs, and to determine possible solutions appropriate for the communities where they are implemented.
Purpose of Classification System
Existing urban-rural classification systems lack the detail and organization necessary to analyze safety, mobility, and access needs in different types of rural areas. There are also inconsistent definitions of rural and urban areas across various entities, and many existing classification systems are based solely on population characteristics. This study developed a rural classification system that reflects the diversity of the rural United States and that can be used to compare how successful the possible solutions could be in one type of rural community or another.
By using quantitative analysis to define and group rural areas, this classification system reveals safety, mobility, and access gaps; helps identify gaps unique to rural areas as a group; and facilitates the understanding of potential mobility and safety outcomes. Specifically, the classification system is used to identify unmet needs (Chapter 3), potential strategies (Chapter 4), and case studies (Chapter 5). The system is flexible enough that it can be updated with the latest data to study how rural areas change over time.
Classification Process
The study reviewed existing urban-rural classification systems to build on those already in use. Appendix A provides extensive detail on the existing classification systems considered. Four of the systems reviewed that most influenced this classification system are the Office of Management and Budget (OMB) Metropolitan Statistical Area (MSA) definitions, the U.S. Department of Agriculture Economic Research Service (USDA ERS) Rural-Urban Continuum Codes (RUCC), the USDA ERS Urban Influence Codes (UIC), and the USDA ERS County Typologies.
The OMB definitions are a compact set of three categories (metropolitan, micropolitan, and non-core) based on U.S. Census Bureau population and commuting data. The ERS RUCC system offers greater nuance by considering population and adjacency to metropolitan areas. The ERS UIC system includes 12 categories that consider population, adjacency to metropolitan areas, and the presence of towns and other population clusters that are deemed too small to be considered urban. Finally, the ERS Economic Dependence County Typology system provides the greatest variety of information using many dimensions of data related to a county’s employment and earnings by major industry sector.
Each existing classification system was evaluated according to four considerations:
• Spatial detail. Spatial detail refers to the geographic units of analysis. Classification systems require a common unit of analysis across all classification categories. The research team considered existing classification systems with spatial detail ranging from counties to Census
11
blocks, block groups, and tracts. Ultimately, a county-based classification system was proposed to enable analysis using most national data sets.
• Categorical detail. Categorical detail refers to the number and complexity of classification categories. The research team considered existing classification systems with as many as 12 categories and as few as three. This study required a classification system with enough categories to support meaningful insights about rural mobility and safety while also not obscuring important detail with too much variation. For this reason, a classification system with five to 10 categories was proposed.
• Flexibility. Based on the review of existing classification systems and their data sources, it was determined that the classification system needed to be flexible enough to permit different permutations and accommodate future changes in the rural U.S. Specifically, it should allow analysts to aggregate classification categories and geographic units of analysis to meet specific research needs and to also allow analysts to work with new data releases. For these reasons, the categories are defined using data sources that are updated regularly rather than according to static classifications from a single point in time.
• Compatibility. Finally, existing classification systems were evaluated according to their ability to support the objectives of this study, that is, to expand FHWA’s understanding of critical transportation issues and to identify potential solutions to improve mobility and safety in rural communities. No existing system was directly compatible with this study.
As part of the review of existing classification systems, a test was carried out to determine how a set of preliminary, county-level performance measures reveal differences in transportation outcomes and characteristics within each classification system. These measures included vehicle crash rates, commute distance/duration, median household income, and several other important factors.
Adopted Classification System
The adopted classification system contains eight rural county types. The Metropolitan category is also included to enable comparisons between urban areas and various rural areas.
The four county types immediately following Metropolitan are based on population size, density, and spatial or economic relationship with a metropolitan area. The remaining four are based on distinct characteristics known to influence mobility and safety performance. Each county was assigned to one county type. Appendix B presents a map of county types across the U.S.
• Metropolitan: Metro counties were initially defined by their presence in a metropolitan statistical area (MSA) and whether they have a population density greater than 1,000 people per square mile or a total population greater than 250,000. However, all counties defined by the OMB as part of a Metropolitan area that did not meet the criteria for inclusion in any other category were also defined as Metropolitan. This was necessary to ensure that all U.S. counties were classified according to their dominant characteristics.
• Fringe: Fringe counties are non-metropolitan counties that are either adjacent to Metropolitan counties based on ERS RUCC Codes or are within MSAs but relatively rural (more than 50 percent of the population live outside of an urbanized area or cluster or the population density is lower than 100 people per square mile).
• Micropolitan: As defined by OMB as a Micropolitan area, Micropolitan counties contain one or more urbanized area with a population over 10,000 but less than 50,000 or are
12
adjacent to and linked economically with such a county. (Counties containing an urbanized area with a population between 10,000 and 20,000 are classified as Rural Towns.)
• Rural Towns: Rural Towns are not adjacent to a metropolitan area but have a population of 2,500 to 20,000, which the ERS RUCC Codes and ERS UIC Codes define as urban.
• Remote: Met at least one of the following parameters: o Population density is less than ten people per square mile, as defined by the U.S.
Census Bureau for highly rural areas. o A UIC defines the county as a non-metropolitan rural area that does not contain a
town of at least 2,500 people. • Agriculture & Extraction: These are mining- and farming-oriented counties as defined
by USDA ERS economic dependence typology codes. • Older-Age: These are counties in which 33 percent or more of the population is over 60
years of age. Study researchers chose the 95th percentile to capture counties with unusually large Older-Age populations compared to total population (i.e., counties with the most extreme 5 percent).
• Destination: Destination is defined using the methodology for ERS economic dependence typology codes. In simple terms, data on employment, earnings, and seasonal housing were used to identify counties with a large amount of recreational activity. American Community Survey (ACS) data on migration were also used to determine if counties are popular among retirees.
• Tribal: These are counties in which 50 percent or more of the land area is designated as Tribal territory, including American Indian, Alaska Native, and Native Hawaiian.
Counties were assigned to individual categories in the order listed above to ensure counties with the most unique characteristics were separated out first (e.g., Tribal counties could also be considered Remote).1
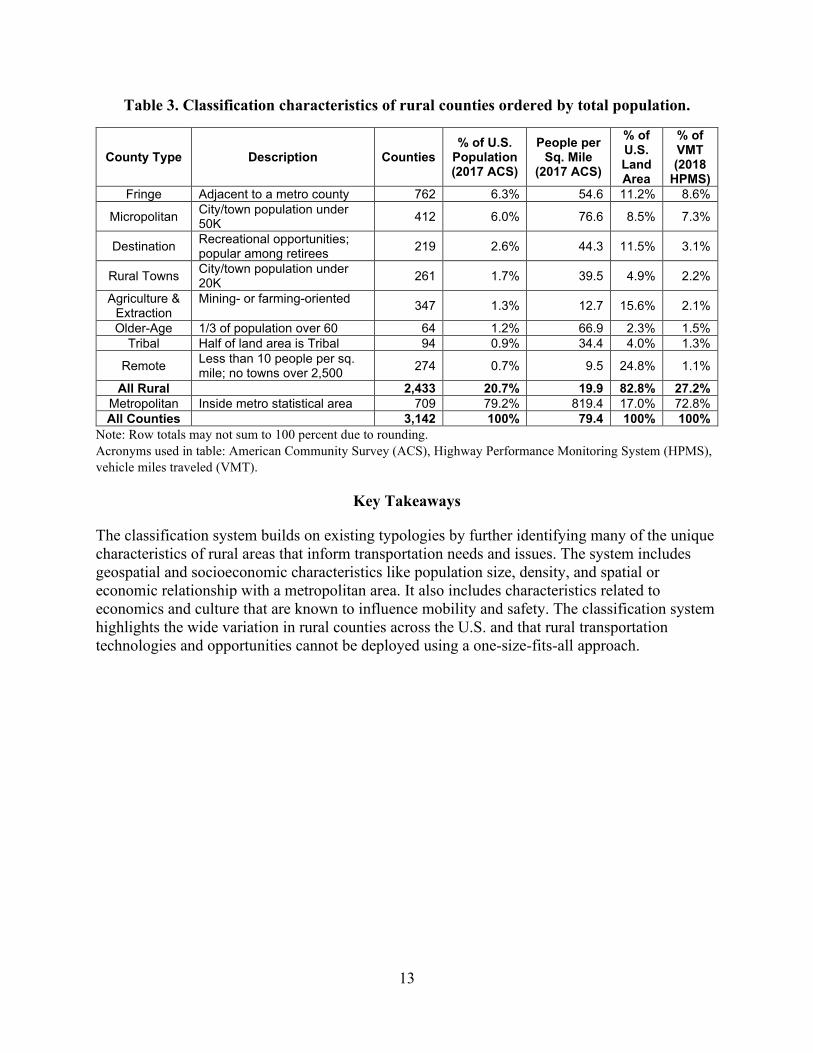
Table 3 illustrates differences among the proposed categories, in order of total population. Non-metropolitan (rural) counties account for about 21 percent of the U.S. population but 83 percent of the total land area. Average population density among the rural categories ranges from 76.6 people per square mile in Micropolitan counties to 9.5 people per square mile in Remote counties. Rural counties also have a higher share of national VMT, at 27.2 percent, though they are home to only 20.7 percent of the population.
1 Four counties were manually reclassified based on professional judgment because they had population characteristics that make them outliers within their original category. The Agriculture & Extraction county of Lafayette Parish, Louisiana, was reclassified as Metropolitan due to its relatively high population density. The Agriculture & Extraction county of St. Tammany Parish, Louisiana, and the Destination counties of St. Johns County, Florida, and Baldwin County, Alabama, were reclassified as Fringe due to relatively high populations and proximity to metropolitan counties.
13
Table 3. Classification characteristics of rural counties ordered by total population.
County Type Description Counties % of U.S.
Population (2017 ACS)
People per Sq. Mile
(2017 ACS)
% of U.S. Land Area
% of VMT (2018
HPMS) Fringe Adjacent to a metro county 762 6.3% 54.6 11.2% 8.6%
Micropolitan City/town population under 50K 412 6.0% 76.6 8.5% 7.3%
Destination Recreational opportunities; popular among retirees 219 2.6% 44.3 11.5% 3.1%
Rural Towns City/town population under 20K 261 1.7% 39.5 4.9% 2.2%
Agriculture & Extraction
Mining- or farming-oriented 347 1.3% 12.7 15.6% 2.1%
Older-Age 1/3 of population over 60 64 1.2% 66.9 2.3% 1.5% Tribal Half of land area is Tribal 94 0.9% 34.4 4.0% 1.3%
Remote Less than 10 people per sq. mile; no towns over 2,500 274 0.7% 9.5 24.8% 1.1%
All Rural 2,433 20.7% 19.9 82.8% 27.2% Metropolitan Inside metro statistical area 709 79.2% 819.4 17.0% 72.8% All Counties 3,142 100% 79.4 100% 100%
Note: Row totals may not sum to 100 percent due to rounding. Acronyms used in table: American Community Survey (ACS), Highway Performance Monitoring System (HPMS), vehicle miles traveled (VMT).
Key Takeaways
The classification system builds on existing typologies by further identifying many of the unique characteristics of rural areas that inform transportation needs and issues. The system includes geospatial and socioeconomic characteristics like population size, density, and spatial or economic relationship with a metropolitan area. It also includes characteristics related to economics and culture that are known to influence mobility and safety. The classification system highlights the wide variation in rural counties across the U.S. and that rural transportation technologies and opportunities cannot be deployed using a one-size-fits-all approach.
14
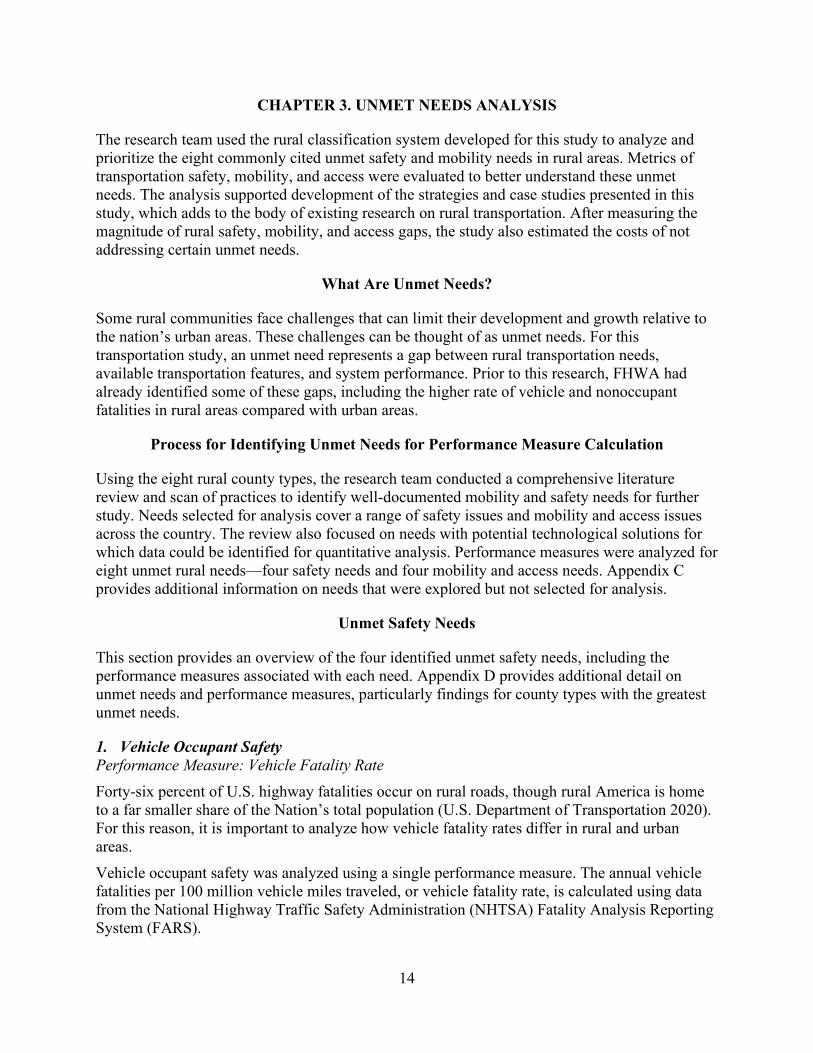
CHAPTER 3. UNMET NEEDS ANALYSIS
The research team used the rural classification system developed for this study to analyze and prioritize the eight commonly cited unmet safety and mobility needs in rural areas. Metrics of transportation safety, mobility, and access were evaluated to better understand these unmet needs. The analysis supported development of the strategies and case studies presented in this study, which adds to the body of existing research on rural transportation. After measuring the magnitude of rural safety, mobility, and access gaps, the study also estimated the costs of not addressing certain unmet needs.
What Are Unmet Needs?
Some rural communities face challenges that can limit their development and growth relative to the nation’s urban areas. These challenges can be thought of as unmet needs. For this transportation study, an unmet need represents a gap between rural transportation needs, available transportation features, and system performance. Prior to this research, FHWA had already identified some of these gaps, including the higher rate of vehicle and nonoccupant fatalities in rural areas compared with urban areas.
Process for Identifying Unmet Needs for Performance Measure Calculation
Using the eight rural county types, the research team conducted a comprehensive literature review and scan of practices to identify well-documented mobility and safety needs for further study. Needs selected for analysis cover a range of safety issues and mobility and access issues across the country. The review also focused on needs with potential technological solutions for which data could be identified for quantitative analysis. Performance measures were analyzed for eight unmet rural needs—four safety needs and four mobility and access needs. Appendix C provides additional information on needs that were explored but not selected for analysis.
Unmet Safety Needs
This section provides an overview of the four identified unmet safety needs, including the performance measures associated with each need. Appendix D provides additional detail on unmet needs and performance measures, particularly findings for county types with the greatest unmet needs.
1. Vehicle Occupant Safety Performance Measure: Vehicle Fatality Rate Forty-six percent of U.S. highway fatalities occur on rural roads, though rural America is home to a far smaller share of the Nation’s total population (U.S. Department of Transportation 2020). For this reason, it is important to analyze how vehicle fatality rates differ in rural and urban areas. Vehicle occupant safety was analyzed using a single performance measure. The annual vehicle fatalities per 100 million vehicle miles traveled, or vehicle fatality rate, is calculated using data from the National Highway Traffic Safety Administration (NHTSA) Fatality Analysis Reporting System (FARS).
15
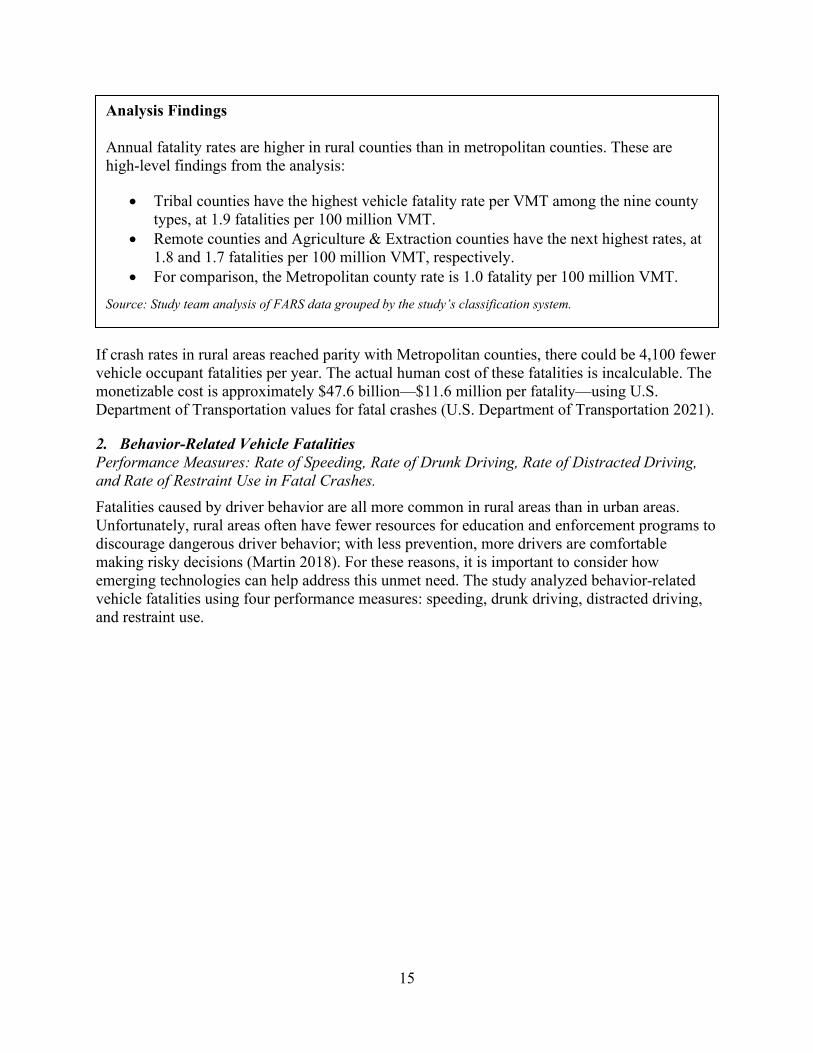
If crash rates in rural areas reached parity with Metropolitan counties, there could be 4,100 fewer vehicle occupant fatalities per year. The actual human cost of these fatalities is incalculable. The monetizable cost is approximately $47.6 billion—$11.6 million per fatality—using U.S. Department of Transportation values for fatal crashes (U.S. Department of Transportation 2021).
2. Behavior-Related Vehicle Fatalities Performance Measures: Rate of Speeding, Rate of Drunk Driving, Rate of Distracted Driving, and Rate of Restraint Use in Fatal Crashes. Fatalities caused by driver behavior are all more common in rural areas than in urban areas. Unfortunately, rural areas often have fewer resources for education and enforcement programs to discourage dangerous driver behavior; with less prevention, more drivers are comfortable making risky decisions (Martin 2018). For these reasons, it is important to consider how emerging technologies can help address this unmet need. The study analyzed behavior-related vehicle fatalities using four performance measures: speeding, drunk driving, distracted driving, and restraint use.
Analysis Findings Annual fatality rates are higher in rural counties than in metropolitan counties. These are high-level findings from the analysis:
• Tribal counties have the highest vehicle fatality rate per VMT among the nine county types, at 1.9 fatalities per 100 million VMT.
• Remote counties and Agriculture & Extraction counties have the next highest rates, at 1.8 and 1.7 fatalities per 100 million VMT, respectively.
• For comparison, the Metropolitan county rate is 1.0 fatality per 100 million VMT.
Source: Study team analysis of FARS data grouped by the study’s classification system.
16
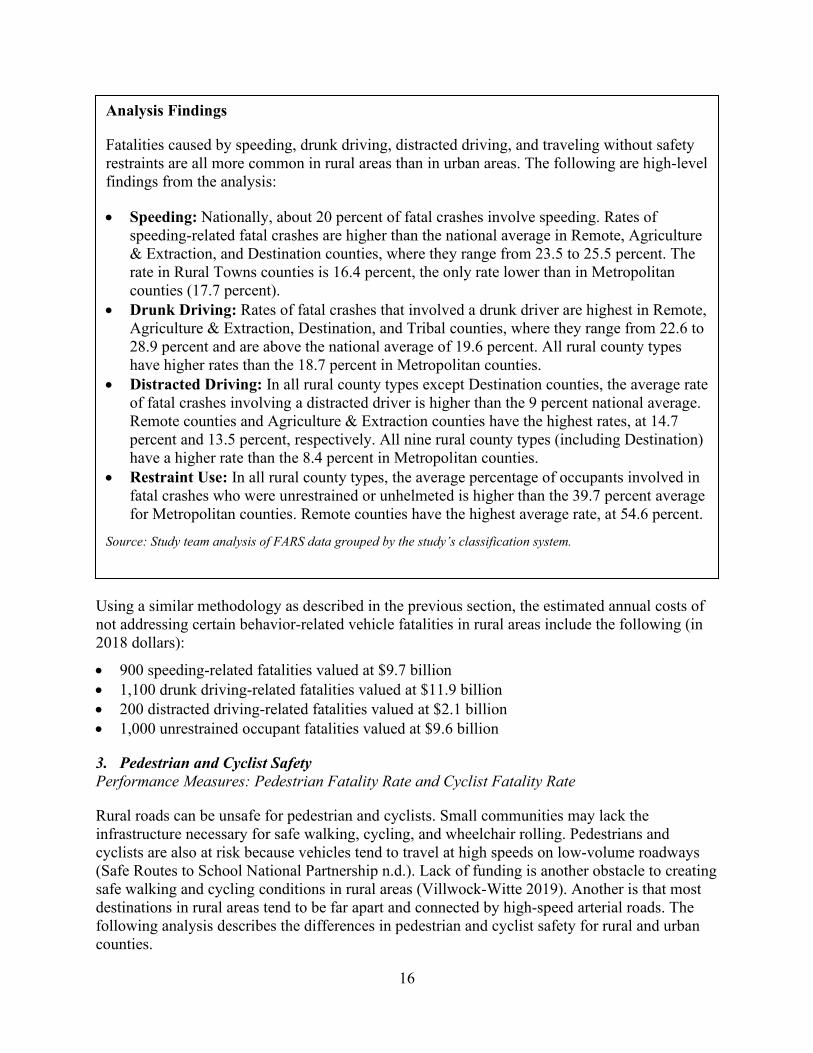
Using a similar methodology as described in the previous section, the estimated annual costs of not addressing certain behavior-related vehicle fatalities in rural areas include the following (in 2018 dollars):
• 900 speeding-related fatalities valued at $9.7 billion • 1,100 drunk driving-related fatalities valued at $11.9 billion • 200 distracted driving-related fatalities valued at $2.1 billion • 1,000 unrestrained occupant fatalities valued at $9.6 billion
3. Pedestrian and Cyclist Safety Performance Measures: Pedestrian Fatality Rate and Cyclist Fatality Rate
Rural roads can be unsafe for pedestrian and cyclists. Small communities may lack the infrastructure necessary for safe walking, cycling, and wheelchair rolling. Pedestrians and cyclists are also at risk because vehicles tend to travel at high speeds on low-volume roadways (Safe Routes to School National Partnership n.d.). Lack of funding is another obstacle to creating safe walking and cycling conditions in rural areas (Villwock-Witte 2019). Another is that most destinations in rural areas tend to be far apart and connected by high-speed arterial roads. The following analysis describes the differences in pedestrian and cyclist safety for rural and urban counties.
Analysis Findings
Fatalities caused by speeding, drunk driving, distracted driving, and traveling without safety restraints are all more common in rural areas than in urban areas. The following are high-level findings from the analysis:
• Speeding: Nationally, about 20 percent of fatal crashes involve speeding. Rates of speeding-related fatal crashes are higher than the national average in Remote, Agriculture & Extraction, and Destination counties, where they range from 23.5 to 25.5 percent. The rate in Rural Towns counties is 16.4 percent, the only rate lower than in Metropolitan counties (17.7 percent).
• Drunk Driving: Rates of fatal crashes that involved a drunk driver are highest in Remote, Agriculture & Extraction, Destination, and Tribal counties, where they range from 22.6 to 28.9 percent and are above the national average of 19.6 percent. All rural county types have higher rates than the 18.7 percent in Metropolitan counties.
• Distracted Driving: In all rural county types except Destination counties, the average rate of fatal crashes involving a distracted driver is higher than the 9 percent national average. Remote counties and Agriculture & Extraction counties have the highest rates, at 14.7 percent and 13.5 percent, respectively. All nine rural county types (including Destination) have a higher rate than the 8.4 percent in Metropolitan counties.
• Restraint Use: In all rural county types, the average percentage of occupants involved in fatal crashes who were unrestrained or unhelmeted is higher than the 39.7 percent average for Metropolitan counties. Remote counties have the highest average rate, at 54.6 percent.
Source: Study team analysis of FARS data grouped by the study’s classification system.
17
Pedestrian and cyclist safety were analyzed using two performance measures: pedestrian fatalities per 100 million miles walked and cyclist fatalities per 100 million bicycle miles traveled. In addition to FARS data, these performance measures used confidential 2017 National Household Travel Survey (NHTS) data on the number of miles traveled by mode.
Using a similar methodology as described in the previous sections, the estimated annual costs of not addressing pedestrian and cyclist safety in rural areas include the following (in 2018 dollars):
• 279 pedestrian fatalities valued at $2.7 billion • 60 cyclist fatalities valued at $576 million
4. Emergency Response Times Performance Measure: Average EMS Crash Response Time
Emergency medical services (EMS) are a safeguard to ensure people have access to time-sensitive, life-saving medical treatments for injuries resulting from crashes. However, in rural places where EMS service areas tend to be geographically large and sparsely populated, response times can be lengthy. This unmet need was measured though a single performance measure: average EMS response time to a crash in minutes.
Analysis Findings
Nearly all rural county types have higher pedestrian and cyclist fatality rates than Metropolitan counties. The following are high-level findings from the analysis:
• Pedestrians: Fringe counties and Agriculture & Extraction counties stand out as the most dangerous for pedestrians, with over 45 fatalities per 100 million miles walked (over 2.5 times the average in Metropolitan counties). Micropolitan counties are relatively safe for pedestrians.
• Cyclists: Tribal counties have the highest bicycle fatality rate among the nine county types, at 95 fatalities per 100 million bicycle miles traveled. This rate is 10 times the national average and the average for Metropolitan counties. Destination counties and Rural Town counties have relatively low cyclist fatality rates.
Source: Study team analysis of FARS crash data combined with confidential NHTS 2017 sample data and grouped by the study’s classification system.
18
Improving EMS response times in rural counties could generate costs savings by saving more lives. Research has found that, for the most critical incidents, a one-minute delay in response times can increase mortality rates by 1 percent to 2 percent (RapidSOS 2015). Additionally, for medical conditions that affect the passage of blood to the heart and brain (e.g., cardiac arrest, stroke), each minute of response delay can increase treatment costs by 7 percent. These costs include longer stays in an intensive care unit (ICU), additional procedures, and slower recoveries.
In rural counties, 47.4 percent of crashes had an emergency response time of more than 10 minutes. In Metropolitan counties, only 24.2 percent of crashes had response times greater than 10 minutes. This suggests that, in addition to lives saved, there could be significant cost savings if response times were lower in rural counties.
Unmet Mobility and Access Needs
This section provides an overview of the four identified unmet mobility and access needs, including a sample of the performance measures associated with each need. These unmet mobility and access needs have been amplified by the COVID-19 pandemic. Appendix D provides additional detail on unmet needs and performance measures, particularly findings for county types with the greatest number of unmet needs.
1. Access to Medical Care Performance Measures: Travel time to medical facility, Hospital proximity, Percent of counties without an ICU, ICU Bed Rate, Primary Care Physician Rate.
Access to medical care is an increasing concern for rural residents, in part because of ongoing rural hospital closures (Ollove 2020). The following analysis shows that, compared to urban residents, rural residents live farther, on average, from medical facilities. These include hospitals and facilities providing primary care, dental services, mental health services, prenatal care, and substance abuse treatment.
Analysis Findings
All rural county types have greater EMS response times than in Metropolitan counties. The following are high-level findings from the analysis:
• Three rural county types have higher EMS response times than the national average of 13 minutes: Remote counties (17.7 minutes), Agriculture & Extraction counties (14.9 minutes), and Tribal counties (14.5 minutes).
• Fringe counties, Rural Town counties, and Destination counties all have average EMS response times of 12.4 minutes, slightly lower than the national average but still almost four minutes longer than in Metropolitan counties.
Source: Study team analysis of FARS data grouped by the study’s classification system.
19
This unmet need was measured using seven performance measures:
• General medical facilities: Average travel time in minutes to a general medical facility • Hospitals: Percentage of the population living more than 30 minutes from a hospital (with
emergency department) • Intensive care: Percentage of counties without intensive care unit (ICU) beds • Intensive care: Average number of ICU beds per 10,000 people • Primary care: Primary care physicians (PCPs) per 10,000 people • Substance abuse treatment: Average distance in miles to a substance abuse treatment
facility that provides medication-assisted treatment • Substance abuse treatment: Average distance in miles to a syringe services program
Analysis Findings
Across several performance measures, rural counties have lower overall access to medical care than Metropolitan counties. The following are high-level findings from the analysis:
• General medical facilities: Agriculture & Extraction counties have the longest average travel time to a general medical facility, at nearly 43 minutes. All rural county types except Older-Age counties have travel times greater than the average of 25.7 minutes for Metropolitan counties.
• Hospitals: In the average Remote county, over one-third of the population lives more than 30 minutes from a hospital. This is the highest percentage among all county types and over four times the average in Metropolitan counties. Agriculture & Extraction and Destination counties also have relatively low hospital access.
• Intensive care: More than 90 percent of Remote counties have no ICU beds, compared to only 11 percent of Metropolitan counties. Rates vary widely for all other county types. Agriculture & Extraction counties have the fewest of all county types, at 0.3 ICU beds per 10,000 people. By comparison, Metropolitan counties have an average of 2.5 ICU beds per 10,000 people.
• Primary care: Fringe counties have the lowest number of PCPs per 10,000 people (4.3 PCPs) and Metropolitan counties have the greatest ( 7.9 PCPs). All rural county types have a lower rate than the national average of 7.3 PCPs per 10,000 people.
• Substance abuse treatment: In the average Remote county, the nearest facility that offers medication-assisted treatment is over 48 miles away, over five times the distance in the average Metropolitan county (8.9 miles). All rural county types have greater average distances than the Metropolitan county average and national average of 8.8 miles. Agriculture & Extraction counties have the greatest average distance to a syringe services program, at 164 miles. This is 89 miles farther than the national average and 92 miles farther than the average in Metropolitan counties.
Sources: Study team analysis of NHTS data (general medical facilities), Centers for Medicare and Medicaid Services (hospitals), Kaiser Family Foundation (intensive care), Federal Communications Commission (primary care), and the Foundation for AIDS Research (substance abuse treatment) grouped by the study’s classification
20
The potential costs of not addressing access to medical care could include the following (in 2018 dollars):
• $200 per missed appointment for physicians, which could be passed on to patients (Gier 2017)
• $524.6 million in annual travel time costs
In addition, rural residents may experience negative health impacts stemming from the relatively long distances they travel for medical care. One study found that 7.7 percent of surveyed patients delayed medical care because of distance to a provider (Syed, Gerber and Sharp 2013). As many as 4.7 million rural residents could delay medical care because of distance to a medical facility. Assuming conservatively that people make two trips to a non-emergency medical appointment per year, the annual per-capita travel time is 134 minutes in rural counties and 103 minutes in Metropolitan counties. This difference can be monetized using USDOT values for personal travel time of $15.20 per person-hour (in 2018 dollars) (U.S. Department of Transportation 2020).
2. Access to Food Performance Measure: Grocery store proximity.
In 2019, 12.1 percent of rural households were food insecure compared with 10.5 percent of all U.S. households (Coleman-Jensen, et al. 2020). The single performance measure in this category is the average share of the population living 10 miles or more from a supermarket.2
2 Defined by the U.S. Department of Agriculture as a “supermarket, supercenter, or large grocery store” (https://www.ers.usda.gov/data-products/food-access-research-atlas/documentation/).
Analysis Findings
Residents of rural counties are more likely to live farther than 10 miles from a supermarket than their urban counterparts. The following are high-level findings from the analysis:
• In the average Agriculture & Extraction county, over 35 percent of the population lives more than 10 miles from a supermarket.
• All rural county types have lower access to supermarkets than the average Metropolitan county, where only 1 percent of the population lives more than 10 miles from a supermarket.
Source: Study team analysis of USDA Economic Research Service data grouped by the study’s classification system.
21
The potential cost of not addressing access to food could include the following (in 2018 dollars):
• $58.3 million annually if the average vehicle trip to a supermarket was one mile farther in rural counties than in Metropolitan counties
Similar to medical care access, shorter distances to supermarkets could save residents travel time. Approximately 7.7 million people in rural counties live more than 10 miles from a supermarket, compared to 2.5 million people in Metropolitan counties. Considering that the primary shopper in a household makes 1.5 store trips per week and the average household contains 2.6 people,3 rural residents could collectively make 153.5 million more supermarket trips that are 10 miles longer than their urban counterparts (Food Marketing Institute 2015). The analysis conservatively assumes that the average vehicle trip to the supermarket is one mile farther in rural counties than in Metropolitan counties and travel speeds are 40 miles per hour (a 1.5-minute savings per trip).
3. Access to Education and Jobs Performance Measures: Average travel time to school, Community college proximity, Four-year college proximity.
In rural communities, transportation can be a challenge for both K-12 and post-secondary students, creating a potential barrier for rural students to acquire the same education as their urban peers (Smith 2017). The study analyzed access to three types of education: average travel time in minutes to a K-12 school, percentage of the population living over 30 minutes from a community college, and percentage of the population living over 30 minutes from a four-year college.
3 2018 American Community Survey 1-Year Estimates
22
The potential costs of not addressing access to higher education could include the following (in 2018 dollars):
• $8.4 billion in foregone annual earnings if 1 percent of the rural population did not pursue an associate degree because of distance to the nearest community college or vocational school4
• $19.1 billion in foregone annual earnings if 1 percent of the rural population did not pursue a bachelor’s degree because of distance to the nearest four-year college or university
This analysis is based on research showing that lower levels of postsecondary education could result in lower lifetime earnings or higher chances of falling into poverty (Smith 2017). Someone with an associate degree will earn about $12,600 more per year than someone with only a high school diploma (in 2018 dollars) (Carnevale, Rose and Cheah 2011). Someone with a bachelor’s degree will earn about $28,700 more per year than someone with only a high school diploma.
4 Assumed to be 666,000 people, all of whom have high school diplomas and no postsecondary education.
Analysis Findings Across three performance measures, rural counties have lower overall access to education than Metropolitan counties. The following are high-level findings from the analysis:
• K-12 schools: Most rural county types have slightly higher travel times to K-12 schools than in Metropolitan counties. Fringe counties have the greatest average travel time, at 23.8 minutes. The national average is 20 minutes, and the average for Metropolitan counties is 19.7 minutes.
• Community colleges and vocational schools: In Remote and Agriculture & Extraction counties, over 80 percent of the population lives more than 30 minutes from a community college or vocational school. Only 20 percent of the population in the average Metropolitan county lives that far.
• Four-year colleges and universities: Over 75 percent of the population of the average Remote county lives more than 30 minutes from a four-year college or university. The second highest is Agriculture & Extraction counties, with 68% of their population living more than 30 minutes.
Sources: Study team analysis of NHTS (K-12 schools) and National Center for Education Statistics (post-secondary schools) data grouped by the study’s classification system.
23
4. Broadband Availability Performance Measures: Broadband availability rate, Average service speeds.
Although broadband has the potential to provide significant benefits for rural communities, many rural residents lack access to fast and reliable internet service. This represents a significant missed opportunity since broadband supports many transportation technologies and can sometimes replace trips through telehealth and remote learning. (Chapter 5 presents a case study on broadband and remote learning.)
Broadband availability was measured in two ways: percentage of the population without broadband and the most common download and upload speed by county. The Federal Communications Commission (FCC) considers access to broadband as reliable internet service with a minimum download speed of 25 megabytes per second and a minimum upload speed of 3 megabytes per second.
One benefit of broadband is how it enables telemedicine appointments via video. The potential cost of not addressing broadband availability includes the following (in 2018 dollars):
• $1.1 billion in foregone annual travel time savings from not having the ability to replace in-person medical appointments with telemedicine (other benefits are difficult to monetize)
The study estimated the cost of not being able to replace trips to medical appointments with telemedicine using the same methodology as for estimating costs of medical facility travel times. The analysis assumes that by using telemedicine the average rural household could make one trip to a non-emergency medical appointment per year instead of two.
Influence of Vehicle Availability on Unmet Needs
Across all the unmet safety, mobility, and access needs, travel distances to medical care, food, education, and other needs are greater in rural areas than in urban areas. Long distances are an obstacle for rural residents, especially if they lack access to a vehicle, transit, or some other
Analysis Findings
The average rural county has lower broadband availability than the average Metropolitan County. The following are high-level findings from the analysis:
• In the average Remote county, about 56 percent of households have no broadband available. This is higher than the national average of 27.8 percent and the average for Metropolitan counties of 4.3 percent.
• The share of households without broadband is higher than the national average in five of eight rural county types: Tribal, Fringe, Agriculture & Extraction, Rural Towns, and Remote.
• Remote counties have significantly lower download and upload speeds than Metropolitan counties.
Source: Study team analysis of FCC Connect2Health data grouped by the study’s classification system.
24
means of travel. Most rural transit agencies offer only demand response services that require passengers to plan and schedule a ride well in advance. Therefore, even when transit service is available in a rural area, it is often not a viable option for spontaneous trips. Because personal vehicles offer more flexibility than transit service, the study analyzed vehicle availability levels for all nine county types.
The analysis found that rural counties tend to have higher levels of vehicle availability (i.e., at least one privately owned vehicle available per household) than Metropolitan counties. Though many rural residents lack access to a vehicle, this finding implies vehicle availability itself is not a significant unmet need compared to urban areas. (In other words, fewer households lack access to a vehicle in rural areas than in urban areas.)
However, this is not to suggest that increasing vehicle availability (or access to reliable vehicles) in rural counties would not improve mobility. For example, the USDA’s Food Research Atlas measures the share of housing units without a vehicle and located farther than a half-mile from a supermarket. In the average Remote county, the share is 5.6 percent, the highest among rural county types. In the average Metropolitan county, the share is 4.3 percent.
Key Takeaways
Key unmet safety needs in rural areas include vehicle occupant safety, behavioral safety issues such as speeding, pedestrian and cyclist safety, and EMS response times.
Unmet mobility/access needs include access to medical care, access to food, access to jobs and education, and access to quality broadband. These unmet needs also exist in urban areas but tend to be more pronounced in rural areas due to long distances between communities and other geographic, demographic, and socioeconomic characteristics. Many of these needs have also been exacerbated by the COVID-19 pandemic.
Places with the greatest unmet needs are Remote counties, Agriculture & Extraction counties, and Tribal counties. Across all county types, broadband was found to play a significant role, either in limiting or enabling efforts to meet the seven other unmet needs.
25
CHAPTER 4. STRATEGIES TO ADDRESS UNMET NEEDS
Various strategies can help address unmet safety, mobility, and access needs. A strategy is broadly defined as a technology, system, business model, process, or other means that helps facilitate enhanced transportation safety, mobility, and/or access. A more in-depth discussion of the strategies is included in Appendix E.
Strategy Development
Strategies were developed based on the knowledge of the project team and extensive outreach to rural organizations to gather novel or promising examples. The strategies highlighted in the following sections show strong potential for improving rural mobility, access, and safety based on the following screening questions:
• Does it solve a clear, unmet need? • Does it impact many people? • Is it scalable/feasible? • Does it apply an emerging technology/opportunity? • Does it impact more than one type or rural county? • Is there a known example in practice?
The strategies fall into four categories:
• Broadband (strategies B-1 through B-4) • Vehicles (strategies VEH-1 through VEH-16) • Improved communications (strategies C-1 through C-9) • Infrastructure and program development (strategies I&P-1 through I&P-16)
Broadband is a common need across all four strategy areas. Another common need is for the infrastructure to support non-motorized transportation in rural areas. Successful urban strategies cannot simply be transferred without considering the infrastructure, resources, and challenges of rural areas, such as large geographic areas, tough terrain, low population density, lack of cell service and/or broadband, and fewer route options. This underscores the need for programs and expertise customized to rural transportation agencies and networks.
Broadband Strategies Broadband generally describes high-speed internet access that is continuously available and faster than dial-up internet service. It includes several types of transmission technologies, such as a digital subscriber line (DSL), cable modem, fiber, wireless, and satellite (Federal Communication Commission 2014). This study identified numerous strategies that relate to broadband across all categories (including vehicles, improved communications, and infrastructure and program development). In particular, the presence, absence, or quality of broadband service directly impacts the ability to meet unmet needs with emerging business models, technologies, and other innovative solutions.
26
Much of the rural U.S. still lacks a high-speed connection to the internet. Even if a connection were available, it remains unaffordable for some low-income individuals. Furthermore, though the central core of a small, rural community may have access, individual homes in less-populated areas may not due to topographic limitations or because for-profit companies do not find it commercially viable to offer these connections. Having a fast, reliable connection to workplace systems means employees can work remotely. Without high-speed internet, rural job opportunities are more limited. Broadband also expands access to many educational, job training, and healthcare services. Connecting all residents in rural areas with high-speed internet bolsters economic opportunities and quality of life. The research identified four broadband strategies:
• Wi-Fi hotspots (B-1) • Fiber installations during rehabilitation/maintenance of roadways (B-2) • Fiber installations during multi-use trail implementation (B-3) • Rural connectivity hubs (B-4).
B-1 Wi-Fi hotspots: Often broadcast from public entities like libraries, Wi-Fi hotspots provide access for those without wireless connection or who cannot afford to pay for the connection (Halpern 2019). During the COVID-19 pandemic, some communities helped close the connectivity gap by using school buses equipped with Wi-Fi hotspots to provide internet access to rural and underserved areas. Students could access classes and residents could connect to telehealth providers, apply for jobs, and gain access to other critical services (Childress 2020).
B-2 Fiber installations during rehabilitation/maintenance of roadways: Bundling projects can often mitigate costs and contribute to accelerating the connectivity of more rural residents. According to a U.S. Government Accountability Office (GAO) report, “Utah DOT, in comparing two rural broadband deployment projects, estimated cost savings of roughly 15.5 percent per mile when conduit and fiber were installed during a road project rather than being installed independent of a road project” (U.S. Government Accountability Office 2012). However, this approach generally benefits the communities and residences near highways and interstates but not more remote locations.
B-3 Fiber installations during multi-use trail implementation: Installing fiber when constructing trails is another approach that may enhance the rural transportation network and support USDOT’s multi-modal transportation efforts. Multi-use trail networks for cyclists, pedestrians, and other users are often designed to connect small, rural communities and shorten the distances users must typically travel to gain connectivity (Godavarthy, Hough and Libberton, et al. 2019), (Kerr-Tar Regional Council of Governments 2018). Furthermore, users feel safer while using the trail because they have access in emergency situations.
B-4 Rural connectivity hubs: Hubs are centralized locations where residents can access broadband for a variety of activities. In Cook County, Minnesota, considered the “end of the line” for broadband service in the state, a converted church called North Shore Campus serves as a rural connectivity hub by allowing students to take online college courses (Vogel 2011).
27
Chapter 5 includes a case study of a rural connectivity hub in Jackson County, Kentucky.
Vehicle Strategies
Sixteen strategies involve technologies installed in vehicles or services that are provided by various types of vehicles in new ways:
• In-vehicle speed limit and speed information (VEH-1) • Unmanned aerial systems/vehicles (VEH-2) • Meals and reading vehicles (VEH-3) • Carsharing (VEH-4) • Ridesharing (VEH-5) • Microtransit (VEH-6) • Transportation network companies (VEH-7) • Mobility-on-demand (VEH-8) • Consolidated pick-up of rural students (VEH-9) • Extension of bus lines (VEH-10) • Intelligent carpool mapping systems (VEH-11) • E-scooters (VEH-12) • Bicycle libraries (VEH-13) • Bikeshare (VEH-14) • Connected vehicles (VEH-15) • Autonomous vehicles (VEH-16)
VEH-1 In-vehicle speed limit and speed information: Recent technological advances such as expanded informational and warning messages can warn drivers if they are operating a vehicle at unsafe speeds or miss the posted speed limit if a sign was obstructed.
VEH-2 Unmanned aerial systems/vehicles (UAS/UAV): Also called drones, these are becoming popular for a myriad of safety, mobility, and access applications. UAS applications include delivery of medical supplies and equipment (Mendoza 2020), delivery of groceries (Vincent 2020) (de Leon 2020), infrastructure inspection and monitoring (Wells and Lovelace 2018), and crash investigations (The Pew Charitable Trusts 2018) (National Operations Center of Excellence 2020) (Banse 2019) (Gettinger 2018). UAS are often deployed to avoid having to place a person in a potentially unsafe situation.
Chapter 5 includes a case study on how the Washington State Patrol has used UAS to reduce the time needed to collect crash and crime scene data, in turn reducing road closure times.
VEH-3 Meals and reading vehicles (MARVs): Old school buses are used to transport food and books so children can eat healthy meals and have access to educational materials. Historically, MARVs helped address these access needs during the summer when school was out of session, and the same model is being employed during the COVID-19 pandemic. An example is in Iola, Kansas, where every summer buses provide books and food to children living outside the core of the small community (Robert Wood Johnson Foundation n.d.).
28
The following five strategies (VEH-4, VEH-5, VEH-6, VEH-7, and VEH-8) provide alternative access to private automobile travel or a similar travel experience by using small vehicles in some type of shared concept to increase mobility. These strategies have been frequently deployed in urban areas but may need to operate differently to be successful in rural settings.
VEH-4 Carsharing: This service provides individuals “temporary access to a vehicle without the costs and responsibilities of ownership… Typically, the carsharing operator provides insurance, gasoline, parking, and maintenance. Generally, participants pay a fee each time they use a vehicle” (Federal Highway Administration 2020). Car rental agencies have begun to identify and address barriers to providing vehicles to low-income families, such as working cooperatively with lenders as in a carsharing program in Needles, California (Godavarthy and Hough 2019). Car rental agencies typically require a credit card, not a debit card, which may make carsharing inaccessible for many rural residents. Some carsharing entities, like CarShare Vermont, are helping address the specific needs of users, by offering pickup trucks, recreational vehicles, or fuel-efficient vehicles (CarShare Vermont 2020).
VEH-5 Ridesharing: The term ridesharing refers to activities like carpooling and vanpooling where multiple travelers with similar origins and destinations ride together either in an arranged trip (vanpooling) or by joining a private trip (carpooling) but differs from carsharing, for which the vehicle is common to multiple users rather than the trip purpose or destination. Most commonly, people use rideshare for commuting to work or for higher education. A rural rideshare service using electric vehicles has been implemented in agricultural communities in California’s San Joaquin Valley (EVgo 2018). Technology has especially increased informal carpooling possibilities by providing marketplaces for drivers and riders to find each other. This matching is sometimes referred to as social carpooling, and apps offering this technology have been deployed in suburban and small urban settings.
VEH-6 Microtransit: “This is a privately owned and operated shared transportation system that can have fixed routes and schedules, as well as flexible routes and on-demand scheduling. The vehicles generally include vans and buses” (Federal Highway Administration 2020). A microtransit strategy may offer a more flexible service than ridesharing (VEH-5) while using a larger vehicle and more trip consolidation that transportation network companies (VEH-7). Microtransit has been successfully implemented in Wilson, North Carolina, where on-demand vans replaced a traditional bus system, resulting in greater transit coverage for the rural community and an increase in ridership (Via 2021).
VEH-7 Transportation network companies (TNCs): Also called ridesourcing, these companies “provide prearranged and on-demand transportation services for compensation, which connect drivers of personal vehicles with passengers” (Federal Highway Administration 2020). Though the concept of ridesharing emerged in the 1980s, the use of technology such as smartphones has made ridesharing more convenient and easily accessible (Villwock-Witte 2019). TNCs are different than ridesharing, as there is an expectation by drivers to earn income (Villwock-Witte 2019). More recently, TNCs have provided non-emergency medical transport (NEMT) for grocery access and to enable access to jobs and education.
29
VEH-8 Mobility-on-demand (MOD): This strategy is “a multimodal, integrated, and connected transportation system in which mobility is a commodity and service” (Federal Highway Administration (FHWA) 2020). The MOD model integrates the various modes of transportation available within a community. A central agency serves as the hub and organizes available transportation options to schedule and coordinate rides for individuals.
Chapter 5 includes an example of a MOD system in Door County, Wisconsin, and describes how the system, Door-Tran, coordinates a variety of transportation solutions for residents.
VEH-9 Consolidated pick-up of rural students: This strategy would consolidate rural K-12 students into a single location, shortening the first mile/last mile access to education by achieve an economy of scale that allows an economical bus service to replace longer individual trips. Parents “in one rural school district… banded together and hired their own school bus to take students to another district” to enable their children to have access to better education (Meltzer 2018).
VEH-10 Extension of bus lines: The last mile can impact a student’s ability to get to higher education. When an institution of higher education provides an extension of bus lines, connectivity can improve and allow an individual to pursue such opportunities. Public transportation is still primarily viewed as an urban need, but recently there have been emerging opportunities, like at the University of Arkansas Fort Smith, that extend beyond the suburban barrier.
VEH-11 Intelligent carpool mapping systems: Geographic information system (GIS)-based mapping systems assist users in coordinating rides among other users. Using GIS, a map could be created to show where a user needs to be picked up and dropped off. This would allow users to easily find others nearby who need a ride for an essential trip. Some GIS systems can provide additional information such as trip distance or other transportation options.
The following three strategies (VEH-12, VEH-13, and VEH-14) present methods to improve access to active transportation modes. These strategies work better in communities that have some infrastructure to support active transportation (e.g., bicycle lanes, multi-use paths, protected cycle tracks, bicycle racks) or where low-volume roadways exist and the culture can facilitate safe travel.
VEH-12 E-scooters: E-scooters use a motor and recent advancements in technology for payment. E-scooters require less physical activity than walking or cycling and have become particularly popular in communities with universities or private high schools, suggesting the appeal of additional mobility to these user groups. Rural applications include Bozeman, Montana, a small urban area in a Destination county where e-scooters can be used to access key commercial districts and downtown (Loveridge 2020). Morehead, Kentucky, is another example.
VEH-13 Bicycle libraries: These services loan bicycles to users, often through a library in a community or visitor center. Bicycle libraries have been a mobility solution in rural areas, as a feasible step between individual bike ownership and the bikesharing systems more common in urban areas. Bicycle libraries often simply require a user to sign a liability release form. Examples of bicycle libraries are found in Iola, Kansas; Machias, Maine; Millicent, Maine; and
30
Newkirk, Oklahoma (Robert Wood Johnson Foundation n.d.), (Gedon 2019), (Villwock-Witte 2019).
VEH-14 Bikeshare: Bikeshares provide rentals to users for short-term use and has grown in popularity in the U.S. since 2010. With technology, applications (apps) associated with bikeshare systems can provide information about the availability of bicycles at stations. There are both docked and dockless systems. A docked system requires that the bicycle be returned to a station, whereas a dockless system allows users to leave a bicycle at their destination. An app usually accompanies such a system so the user can find either a bicycle (dockless system) or a station (docked system). Bikesharing often assists with first mile/last mile gaps not serviced by public transportation; however, in a rural area, bikesharing may better suit small communities with active transportation infrastructure already in place.
Chapter 5 includes an example of a bikeshare system in Pocahontas, Iowa.
VEH-15 Connected vehicles: These systems “enable safe, interoperable networked wireless communications among vehicles, the infrastructure, and passengers’ personal communications devices” (U.S. Department of Transportation n.d.). There have been limited implementations to date in rural areas. The standout example is Wyoming’s Connected Vehicle Pilot Deployment Program, which uses vehicle-to-infrastructure (V2I) communication to provide “roadside alerts, parking notifications and dynamic travel guidance” (U.S. Department of Transportation n.d.). Other ongoing studies, including the National Cooperative Highway Research Program’s 08-120, Initializing the Systems Engineering Process for Rural Connected Vehicle Corridors, contribute to filling the gap (The National Academies of Sciences, Engineering, and Medicine n.d.). A 2017 study, Rural Connected Vehicle Gap Analysis: Factors Impeding Developing and Recommendations for Moving Forward, helped identify the need for connected vehicles in the rural context (Intelligent Transportation Society of America 2017).
VEH-16 Autonomous vehicles (AVs): These systems use automation so vehicles can operate with little or no human assistance (Federal Highway Administration 2020). In rural areas, AVs can provide significant safety benefits, even without full automation. SAE International automation levels 1 through 3 require drivers to maintain control while offering several forms of assistance that help avoid human error, including acceleration, braking, and steering assistance. The University of Iowa is currently researching automated driving systems (ADS) with the goal of testing ADS on rural roadways to improve mobility and quality of life for rural residents (University of Iowa 2021).
Improved Communication Strategies
Nine strategies facilitate or expedite information exchange among systems, devices, and users, resulting in safety or mobility benefits to users:
• Automated speed enforcement (C-1) • Real-time feedback of speeding information on local display boards with blackout data
collection (C-2) • Crash detection technologies (C-3)
31
• Railroad crossings notifications via smartphone apps (C-4) • Mobility-as-a-Service (C-5) • Telehealth treatment clinics (C-6) • Direct digital connections between small farmers and consumers (C-7) • Apps from on-scene communication (C-8) • Technical assistance with ITS technology planning, implementation, and maintenance (C-9)
C-1 Automated speed enforcement: In rural areas, there are a limited number of patrol officers and many miles of roadway to cover. Automated speed enforcement systems have been employed to reduce resource requirements while also reminding drivers of the posted speed limit.
C-2 Real-time feedback of speeding information on local display boards with blackout data collection: These devices display the driver’s speed and remind them of the posted speed limit. Some jurisdictions have had additional success by alternating between live and blacked-out (i.e., no information conveyed to the motorist) to get a “true” measure of speed when drivers do not think their speed is being captured. Such test results may warrant additional law enforcement efforts to address speeding.
Chapter 5 describes how Elmira, New York, uses real-time feedback of speeding information on local display boards with blackout data collection.
C-3 Crash detection technology: Technologies like automated crash notification systems or smartphone apps like SOSmart or Life360 notify a response center of a crash or vehicle breakdown. These systems can be activated by a user or activate automatically during a crash and can improve emergency response times to the scene. As discussed in Chapter 3, average emergency response times are nearly 18 minutes in Remote counties, greater than the national average of 13 minutes. Response times in Agriculture & Extraction counties and Tribal counties are also greater than the national average. Crash detection technology can therefore be critical to improving patient outcomes and limiting travel disruptions in these areas.
C-4 Railroad crossings notifications via smartphone apps: The Google Maps and Waze smartphone apps have expanded their capabilities to provide alerts to users when they are approaching a railroad crossing (Moreno 2021). In rural areas where railroad crossings do not have warning signage or gates, these apps could provide vital safety information to travelers.
C-5 Mobility-as-a-service (MaaS): This system creates a unified location where users can schedule and pay for their trip from multiple transportation agencies. MaaS helps inform users of all their transportation options, improving access to mobility in rural areas (Foenix: Mobility Rising n.d.).
C-6 Telehealth treatment clinics: These services use digital information and technologies like smartphones and computers for remote access to health care services and providers. These programs can be particularly effective in rural areas where an individual may otherwise need to drive long distances to healthcare. Telehealth has been successfully used for patient counseling, monitoring chronic conditions, and basic medical care. In 2012, the Eastern Montana Telemedicine Network began the Promoting Realistic Individual Self-Management (PRISM)
32
program for diabetes patients. This program improved patient outcomes by using telehealth to promote blood sugar monitoring, diet management, and counseling (Holloway, et al. 2011). As a result of COVID-19, telehealth clinics have become more common.
C-7 Direct digital connection between small farmers and consumers: Directly connecting farmers and consumers can both alleviate transportation challenges for farmers in delivering products to market and improve consumers access to fresh and affordable produce. Such apps have been previously developed to improve access to fresh local food (Somers 2019). One example is the California-based app CropSwap, which helps connect consumers with local farmers and ranchers. The app offers a simple way to buy fresh produce, with plans to launch subscription-based CropBoxes in the future (NS Agriculture 2020).
C-8 Apps for on-scene communication: Improved communications between EMS and a medical center can allow paramedics at a crash scene to communicate critical patient information to the medical center (allowing for speedier treatment once the patient arrives) and ensure that a patient is transported to the appropriate medical facility. For example, Pulsara or BeOn allow for enhanced communications among all healthcare providers and work to improve patient outcomes.
C-9 Technical assistance with ITS technology planning, implementation, and maintenance: Technology is rapidly changing, and implementation or maintenance can often be intimidating and time-consuming. One way to make technology, particularly intelligent transportation systems (ITS), more widely available and used is to provide technical assistance to rural agencies.
Infrastructure and Program Development Strategies
Sixteen strategies involve the installation of or upgrades to supportive infrastructure or the development of a specialized program to address a safety or mobility need:
• Paved shoulders for bicycles (I&P-1) • Protected cycle tracks (I&P-2) • Clear, continuous shoulder delineation (I&P-3) • Waived match requirements for pedestrian/cycling facilities (I&P-4) • Value capture funding for pedestrian/cycling facilities (I&P-5) • Prioritization methods that ensure competitiveness of pedestrian/cycling facilities (I&P-6) • Connecting high school, middle school, and elementary schools with pedestrian/cycling
pathways (I&P-7) • Mobile health clinics (I&P-8) • Tactical pilots and temporary installations (I&P-9) • Rural complete streets (I&P-10) • Mumblestrips (I&P-11) • Auto-activated rapid flash beacons (I&P-12) • Solar-powered, user-activated lighting (I&P-13) • Rural mobility hubs (I&P-14) • Technology training in local road safety plans (LRSPs) (I&P-15) • Maintenance of signs and lane-markings (I&P-16)
33
I&P-1 Paved shoulders for bicycles: In very rural areas, interactions between cyclists and motorized vehicles can be very infrequent due to low average annual daily traffic. Expanding shoulders can allow separation between motor vehicles and cyclists. Administrators in a very small community in New Hampshire selected this option as an alternative to other cycle and pedestrian provisions (Villwock-Witte 2019).
I&P-2 Protected cycle tracks: Protected cycle tracks are street-level bikeways that provide physical protection from street traffic (National Association of City Transportation Officials n.d.). Different than having sufficient pavement width for bicycles, the track is a designated bicycle-specific lane along with physical elements to reinforce the separation, such as a vertical barrier or different elevation As stated in FHWA’s Small Town and Rural Multimodal Networks Guide, “the greater the speed and volume of motor vehicle traffic, the greater the amount of separation…desired” (Dickman, et al. 2016).
I&P-3 Clear, continuous shoulder delineation: Clear markings and other methods for distinguishing shoulders from travel lanes can provide space for cyclists while also ensuring that wider pavement widths do not encourage higher speeds (Dickman, et al. 2016).
I&P-4 Waived match requirements for pedestrian/cycling facilities: Funding can be a significant hurdle for many state, regional, and local agencies when improving pedestrian and bicycle facilities (e.g., updates of early designs) and/or extending the network. Furthermore, funding sources, historically used successfully at the local level because they did not require matching funds (e.g., Safe Routes to School), have been reduced and combined with other funding sources (Villwock-Witte 2019).
I&P-5 Value capture funding for pedestrian/cycling facilities: For value capture funding partnerships, a private entity pays the up-front costs of the infrastructure, generally supported by a bond that is repaid with the additional revenue the community expects to receive from tourism-based taxes such as lodging and transient guest taxes (Quantified Ventures n.d.).
I&P-6 Prioritization methods that ensure competitiveness of pedestrian/cycling facilities: Active transportation projects through a state department of transportation may not be as high a priority as auto-focused projects, which tend to “dominate the ratings” (Raulerson, et al. 2018). Equitable prioritization is imperative so multi-modal projects are not overlooked. A scoring process that includes pedestrian/cycling prioritization criteria or provides a greater weight to projects with multi-modal aspects can allow these projects to compete with auto-focused projects (Raulerson, et al. 2018).
I&P-7 Connecting high school, middle school, and elementary schools with pedestrian/cycling pathways: Older children may be responsible for picking up a younger sibling after school. Walking or cycling may be the only option, so safe pathways are needed for the older child to travel to the younger child’s school.
I&P-8 Mobile health clinics: Historically, the model for medical care required the patient to travel to where services are provided. Mobile health clinics bring the service to the patient and have been deployed to provide a range of services including immunizations, screenings, oral health services, laboratory services, or counseling (Rural Health Information Hub 2013).
34
I&P-9 Tactical pilots and temporary installations: Temporary “pop-up” installations can be an effective strategy to try out new safety mitigations. “By using mostly temporary materials… interventions are low-risk: if it doesn’t work, just take it down” (National Association of City Transportation Officials (NACTO) n.d.), (Watson and Owen 2020)). This approach may include using flexible posts to create a cycling lane on roadways that have enough space. Most often, these installations work best in small communities rather than very rural roadways.
I&P-10 Rural complete streets: The infrastructure in a community can influence how safe pedestrians and cyclists feel. Infrastructure components are more bicycle- and pedestrian-friendly include mini-roundabouts, posted (and enforced) school speed limits, leading pedestrian intervals (LPIs), rectangular rapid flash beacons (RRFBs) to allow for crossing of major arterials, chicanes, speed humps and speed tables, bump-outs, and reducing the radius of corners (thereby reducing the speed at which a vehicle can make a turn).
I&P-11 Mumblestrips: These installations provide drivers with an audible and tactile warning that they are leaving a traveling lane or the edge of a road. Mumblestrips produce less exterior noise “than a traditional rumblestrip[s]...Depending on the design, mumblestrips could also reduce interior noise levels” (ch2m 2015).
I&P-12 Auto-activated rapid flash beacons: These RRFBs do not require user-activation; instead they “supplement warning signs at unsignalized intersections or mid-block crosswalks” (National Association of City and Transportation Officials n.d.).
I&P-13 Solar-powered, user-activated lighting: Ensuring that pedestrians are visible on a roadway network increases safety. Some agencies prefer to provide fixed lighting only when a pedestrian/cyclist is present. Solar-powered, user-activated devices can improve conspicuity while minimizing light pollution, as was done by the Lummi Nation in Washington State (Sunna Design 2017).
I&P-14 Rural mobility hubs: These hubs, which can be physical or virtual, are designed as a central location where a variety of transportation options can be accessed, including local/regional public transportation systems, intercity/interstate public transportation systems (e.g., bus and railroad), bikeshare, rideshare, transportation network companies, e-scooters, and other mobility options.
I&P-15 Technology training in local road safety plans (LRSPs): This approach can empower local agencies to leverage technologies that improve safety and operations at significantly lower costs than traditional methods (e.g., geometric modifications).
I&P-16 Maintenance of signs and lane-markings: With the large number of lane-miles in the rural U.S., maintaining lane markings and signs in these rural areas is an ongoing challenge, especially in areas that experience extreme weather. However, automated driving systems, advanced safety features, and autonomous vehicles are likely to further increase the value of high-quality pavement markings. These systems may also provide data to identify maintenance issues.
35
Key Takeaways
This study identified 45 strategies across four categories: vehicles, improved communications, infrastructure and program development, and broadband. Though itself a broad category, broadband was found to be an essential component of many strategies, including but not limited to Wi-Fi hotspots, fiber installations during roadway/trail work, rural connectivity hubs, carpool mapping systems, e-scooters, bike programs, microtransit, and mobility-on-demand.
Some strategies rely on the availability of new technologies, while others adapt existing tools in new ways to address unique rural needs. Though many of these strategies lack concrete implementation examples or evaluation data, they can be the basis of models to be explored for use in rural areas. Because the strategies also vary in terms of their sophistication and scale, communities of all sizes have many possible options for implementation.
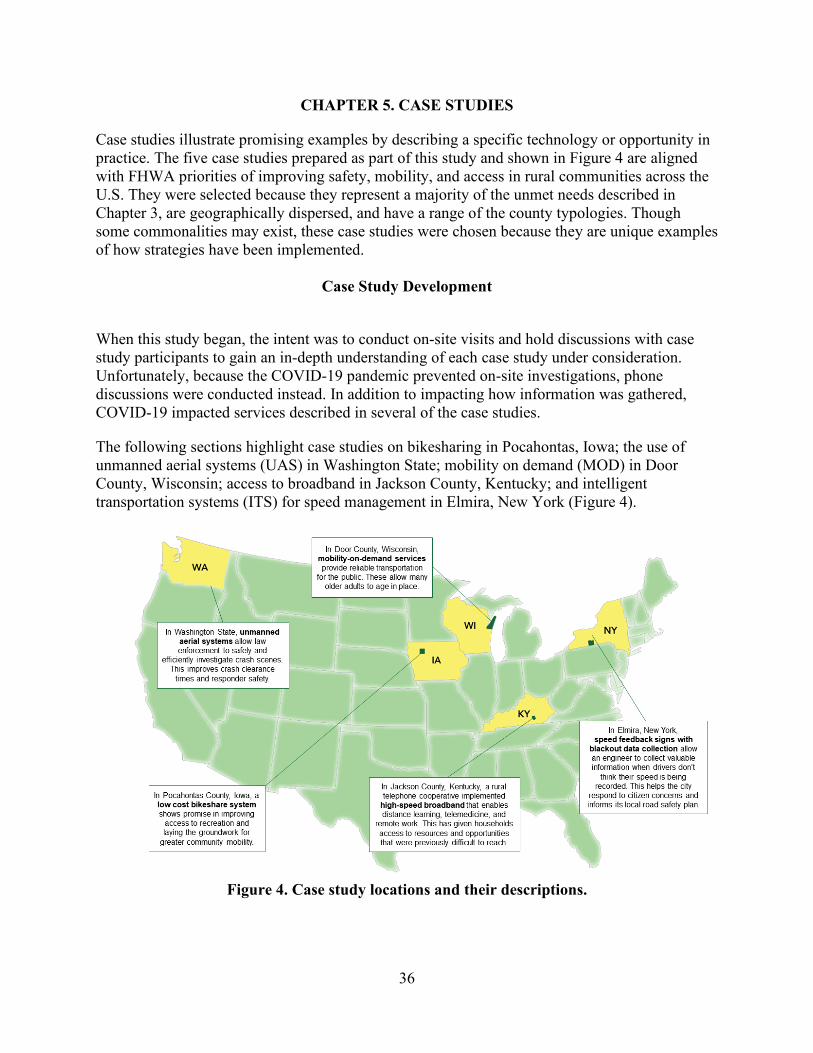
36
CHAPTER 5. CASE STUDIES
Case studies illustrate promising examples by describing a specific technology or opportunity in practice. The five case studies prepared as part of this study and shown in Figure 4 are aligned with FHWA priorities of improving safety, mobility, and access in rural communities across the U.S. They were selected because they represent a majority of the unmet needs described in Chapter 3, are geographically dispersed, and have a range of the county typologies. Though some commonalities may exist, these case studies were chosen because they are unique examples of how strategies have been implemented.
Case Study Development
When this study began, the intent was to conduct on-site visits and hold discussions with case study participants to gain an in-depth understanding of each case study under consideration. Unfortunately, because the COVID-19 pandemic prevented on-site investigations, phone discussions were conducted instead. In addition to impacting how information was gathered, COVID-19 impacted services described in several of the case studies.
The following sections highlight case studies on bikesharing in Pocahontas, Iowa; the use of unmanned aerial systems (UAS) in Washington State; mobility on demand (MOD) in Door County, Wisconsin; access to broadband in Jackson County, Kentucky; and intelligent transportation systems (ITS) for speed management in Elmira, New York (Figure 4).
Figure 4. Case study locations and their descriptions.
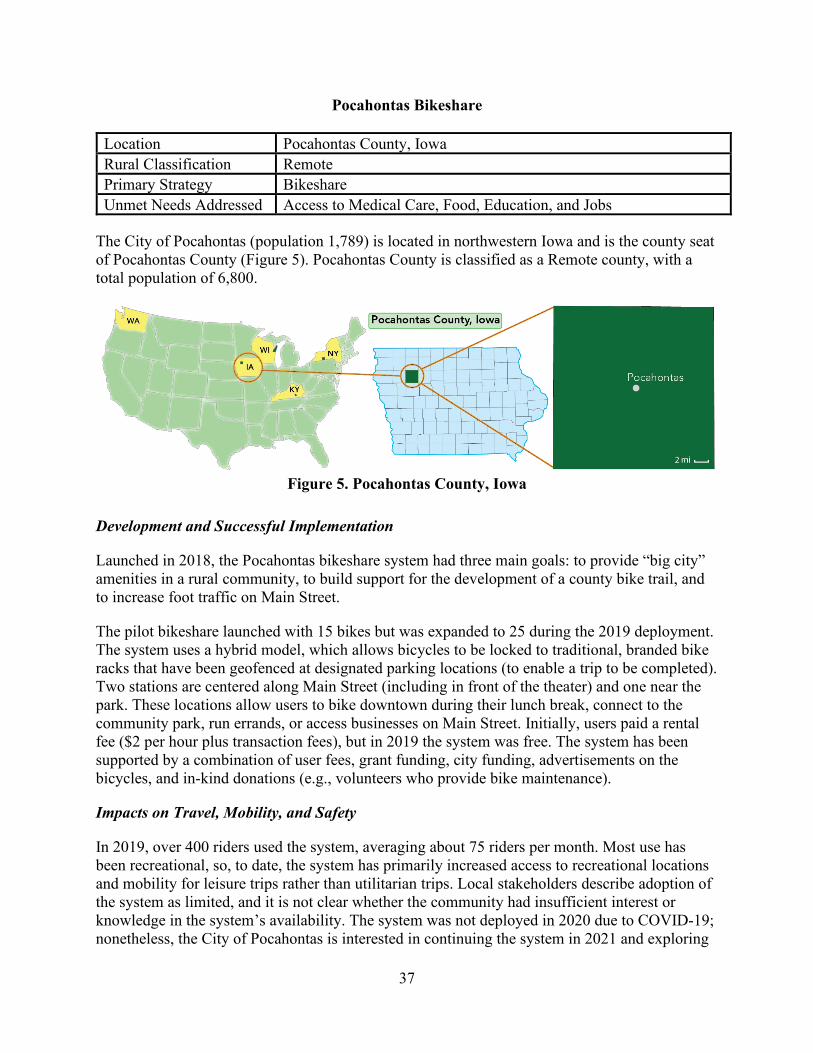
37
Pocahontas Bikeshare
Location Pocahontas County, Iowa Rural Classification Remote Primary Strategy Bikeshare Unmet Needs Addressed Access to Medical Care, Food, Education, and Jobs
The City of Pocahontas (population 1,789) is located in northwestern Iowa and is the county seat of Pocahontas County (Figure 5). Pocahontas County is classified as a Remote county, with a total population of 6,800.
Figure 5. Pocahontas County, Iowa
Development and Successful Implementation
Launched in 2018, the Pocahontas bikeshare system had three main goals: to provide “big city” amenities in a rural community, to build support for the development of a county bike trail, and to increase foot traffic on Main Street.
The pilot bikeshare launched with 15 bikes but was expanded to 25 during the 2019 deployment. The system uses a hybrid model, which allows bicycles to be locked to traditional, branded bike racks that have been geofenced at designated parking locations (to enable a trip to be completed). Two stations are centered along Main Street (including in front of the theater) and one near the park. These locations allow users to bike downtown during their lunch break, connect to the community park, run errands, or access businesses on Main Street. Initially, users paid a rental fee ($2 per hour plus transaction fees), but in 2019 the system was free. The system has been supported by a combination of user fees, grant funding, city funding, advertisements on the bicycles, and in-kind donations (e.g., volunteers who provide bike maintenance).
Impacts on Travel, Mobility, and Safety
In 2019, over 400 riders used the system, averaging about 75 riders per month. Most use has been recreational, so, to date, the system has primarily increased access to recreational locations and mobility for leisure trips rather than utilitarian trips. Local stakeholders describe adoption of the system as limited, and it is not clear whether the community had insufficient interest or knowledge in the system’s availability. The system was not deployed in 2020 due to COVID-19; nonetheless, the City of Pocahontas is interested in continuing the system in 2021 and exploring
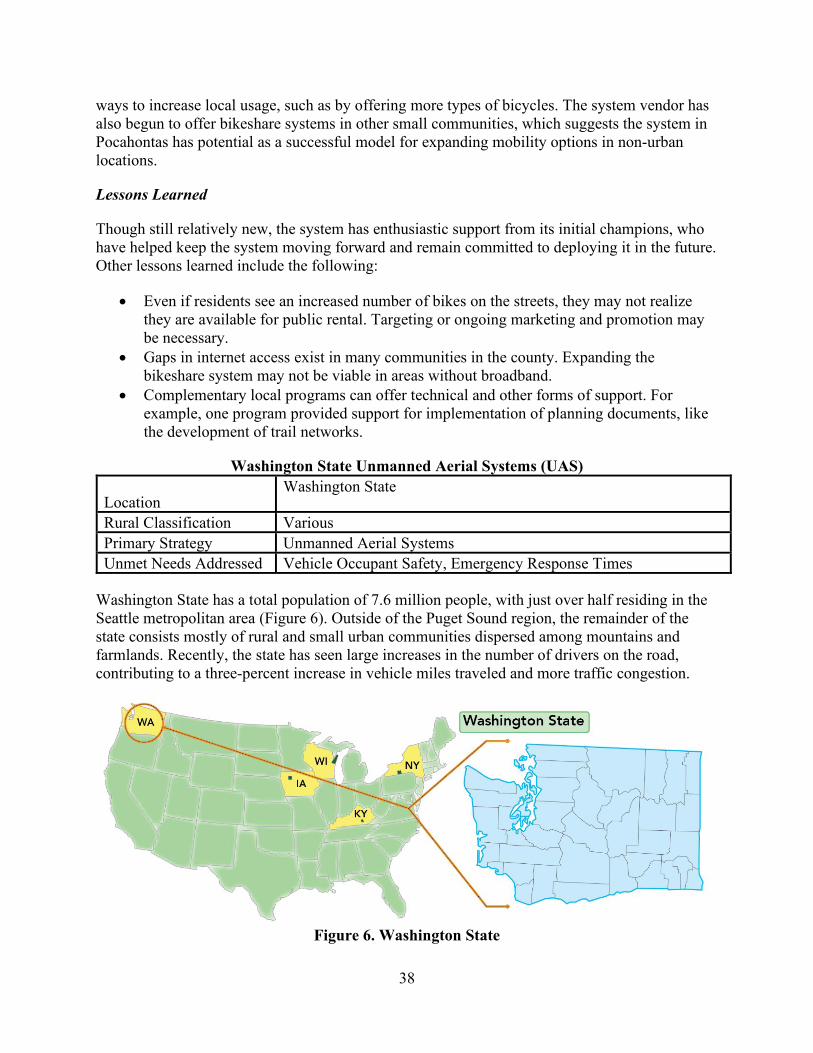
38
ways to increase local usage, such as by offering more types of bicycles. The system vendor has also begun to offer bikeshare systems in other small communities, which suggests the system in Pocahontas has potential as a successful model for expanding mobility options in non-urban locations.
Lessons Learned
Though still relatively new, the system has enthusiastic support from its initial champions, who have helped keep the system moving forward and remain committed to deploying it in the future. Other lessons learned include the following:
• Even if residents see an increased number of bikes on the streets, they may not realize they are available for public rental. Targeting or ongoing marketing and promotion may be necessary.
• Gaps in internet access exist in many communities in the county. Expanding the bikeshare system may not be viable in areas without broadband.
• Complementary local programs can offer technical and other forms of support. For example, one program provided support for implementation of planning documents, like the development of trail networks.
Washington State Unmanned Aerial Systems (UAS)
Location Washington State
Rural Classification Various Primary Strategy Unmanned Aerial Systems Unmet Needs Addressed Vehicle Occupant Safety, Emergency Response Times
Washington State has a total population of 7.6 million people, with just over half residing in the Seattle metropolitan area (Figure 6). Outside of the Puget Sound region, the remainder of the state consists mostly of rural and small urban communities dispersed among mountains and farmlands. Recently, the state has seen large increases in the number of drivers on the road, contributing to a three-percent increase in vehicle miles traveled and more traffic congestion.
Figure 6. Washington State
39
Methods to reduce crashes and the associated time to respond to and clear a crash are vital. The use of UAS to expedite crash investigations can have a large impact on reducing congestion and associated secondary crashes, especially in high traffic volume corridors. Considering the lack of viable detour routes in rural areas, UAS may also prove just as beneficial for rural areas, where the systems can access hard-to-reach locations and expedite emergency response.
Development and Successful Implementation
In 2016, the Washington State Patrol (WSP) Criminal Investigation Division (CID) began to evaluate the potential use of UAS to improve crash and crime scene investigations in the state. WSP worked with leadership among the governor’s staff, American Civil Liberties Union, Washington Association of Prosecuting Attorneys, and other stakeholders to develop UAS policy and procedures and establish clear goals for a UAS program. The WSP UAS program was developed with three primary goals: reduce road closure times associated with crash and crime scene investigations, improve data collection to be used for scene reconstruction, and improve officer safety.
In 2017, WSP conducted an initial pilot project to test the effectiveness of UAS for crash and crime scene data collection along the I-5 corridor in the Puget Sound region. Finding the first pilot project a success, WSP expanded the UAS program statewide to 42 detectives and to field operations bureau (FOB) troopers. In 2018, a second pilot project examined the expanded use of UAS statewide. After a second successful pilot project, WSP fully deployed the UAS program with over 110 troopers and detectives statewide. With rotating schedules for troopers, there is always someone available with a UAS who can respond to a scene.
The UAS device is stored in the vehicle of a WSP trooper. Once on the scene, the trooper can determine which evidence is critical and deploy the UAS in around 20 minutes. The trooper can set the crime scene or crash scene area on the UAS program, then the UAS can independently fly around the scene and take multiple photos. These photos are then imported into a software program and stitched together to create a seamless model of the scene that allows the trooper to mark the images with evidence and notes.
After testing several models, the program used UAS models that range in price from $1,600 to $6,000 each. There are also significant costs for the software licenses, approximately $3,000 per year per license. However, thus far, maintenance costs have been minimal.
WSP and the Washington State Department of Transportation have collaborated in developing an automated program to create pilot logs that document UAS deployments (a Federal Aviation Administration requirement) to streamline flight logs. As of this date, WSP has not yet deployed that software program due to fiscal constraints.
Impacts on Travel, Mobility, and Safety
To date, WSP has documented numerous time-saving impacts and associated safety benefits. During the second pilot project, UAS were utilized in 126 investigations and resulted in a significant reduction in road closure times. In 2018 alone, the WSP UAS program was estimated to decrease road closure times by 200.5 hours, which equates to an estimated savings in travel time of $4.2 million. In 2019, WSP performed a thorough review of the data, and staff
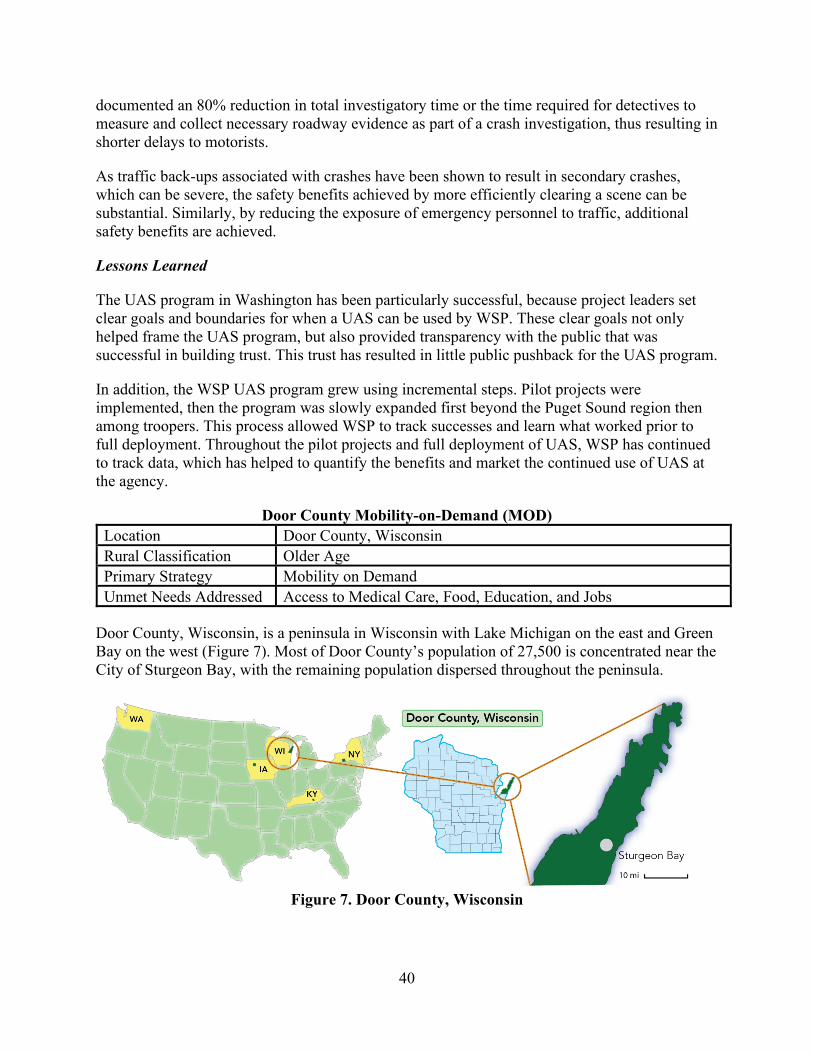
40
documented an 80% reduction in total investigatory time or the time required for detectives to measure and collect necessary roadway evidence as part of a crash investigation, thus resulting in shorter delays to motorists.
As traffic back-ups associated with crashes have been shown to result in secondary crashes, which can be severe, the safety benefits achieved by more efficiently clearing a scene can be substantial. Similarly, by reducing the exposure of emergency personnel to traffic, additional safety benefits are achieved.
Lessons Learned
The UAS program in Washington has been particularly successful, because project leaders set clear goals and boundaries for when a UAS can be used by WSP. These clear goals not only helped frame the UAS program, but also provided transparency with the public that was successful in building trust. This trust has resulted in little public pushback for the UAS program.
In addition, the WSP UAS program grew using incremental steps. Pilot projects were implemented, then the program was slowly expanded first beyond the Puget Sound region then among troopers. This process allowed WSP to track successes and learn what worked prior to full deployment. Throughout the pilot projects and full deployment of UAS, WSP has continued to track data, which has helped to quantify the benefits and market the continued use of UAS at the agency.
Door County Mobility-on-Demand (MOD) Location Door County, Wisconsin Rural Classification Older Age Primary Strategy Mobility on Demand Unmet Needs Addressed Access to Medical Care, Food, Education, and Jobs
Door County, Wisconsin, is a peninsula in Wisconsin with Lake Michigan on the east and Green Bay on the west (Figure 7). Most of Door County’s population of 27,500 is concentrated near the City of Sturgeon Bay, with the remaining population dispersed throughout the peninsula.
Figure 7. Door County, Wisconsin
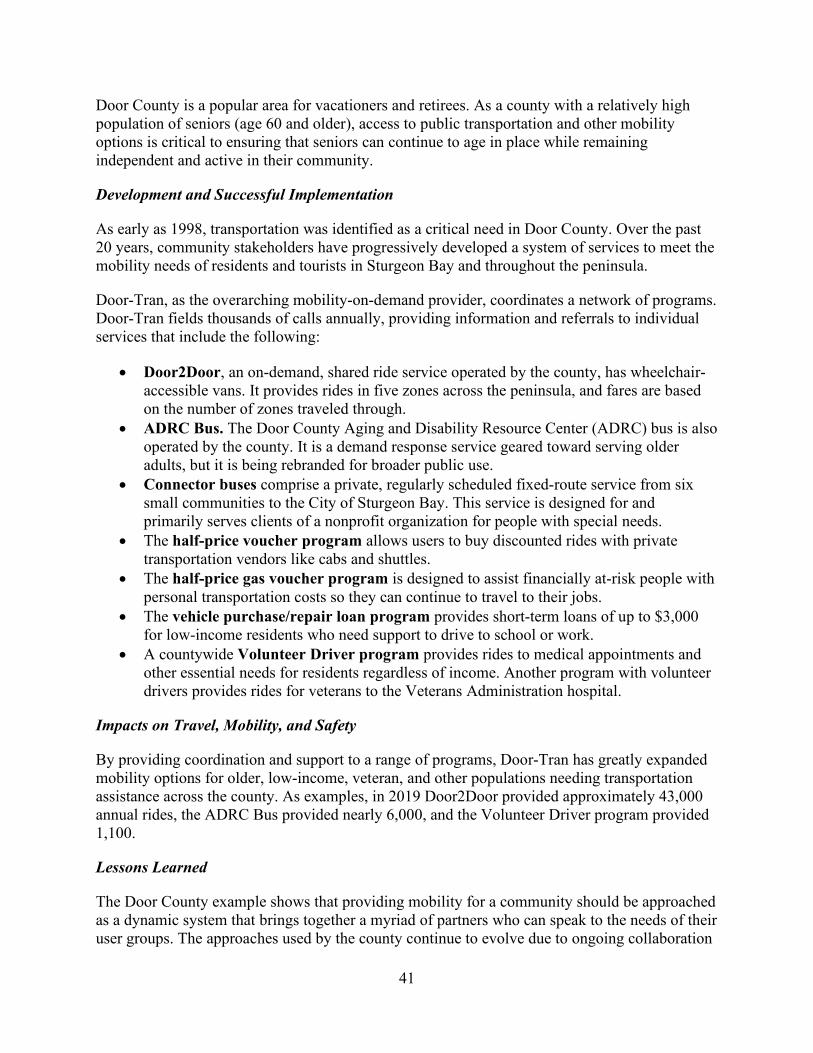
41
Door County is a popular area for vacationers and retirees. As a county with a relatively high population of seniors (age 60 and older), access to public transportation and other mobility options is critical to ensuring that seniors can continue to age in place while remaining independent and active in their community.
Development and Successful Implementation
As early as 1998, transportation was identified as a critical need in Door County. Over the past 20 years, community stakeholders have progressively developed a system of services to meet the mobility needs of residents and tourists in Sturgeon Bay and throughout the peninsula.
Door-Tran, as the overarching mobility-on-demand provider, coordinates a network of programs. Door-Tran fields thousands of calls annually, providing information and referrals to individual services that include the following:
• Door2Door, an on-demand, shared ride service operated by the county, has wheelchair-accessible vans. It provides rides in five zones across the peninsula, and fares are based on the number of zones traveled through.
• ADRC Bus. The Door County Aging and Disability Resource Center (ADRC) bus is also operated by the county. It is a demand response service geared toward serving older adults, but it is being rebranded for broader public use.
• Connector buses comprise a private, regularly scheduled fixed-route service from six small communities to the City of Sturgeon Bay. This service is designed for and primarily serves clients of a nonprofit organization for people with special needs.
• The half-price voucher program allows users to buy discounted rides with private transportation vendors like cabs and shuttles.
• The half-price gas voucher program is designed to assist financially at-risk people with personal transportation costs so they can continue to travel to their jobs.
• The vehicle purchase/repair loan program provides short-term loans of up to $3,000 for low-income residents who need support to drive to school or work.
• A countywide Volunteer Driver program provides rides to medical appointments and other essential needs for residents regardless of income. Another program with volunteer drivers provides rides for veterans to the Veterans Administration hospital.
Impacts on Travel, Mobility, and Safety
By providing coordination and support to a range of programs, Door-Tran has greatly expanded mobility options for older, low-income, veteran, and other populations needing transportation assistance across the county. As examples, in 2019 Door2Door provided approximately 43,000 annual rides, the ADRC Bus provided nearly 6,000, and the Volunteer Driver program provided 1,100.
Lessons Learned
The Door County example shows that providing mobility for a community should be approached as a dynamic system that brings together a myriad of partners who can speak to the needs of their user groups. The approaches used by the county continue to evolve due to ongoing collaboration
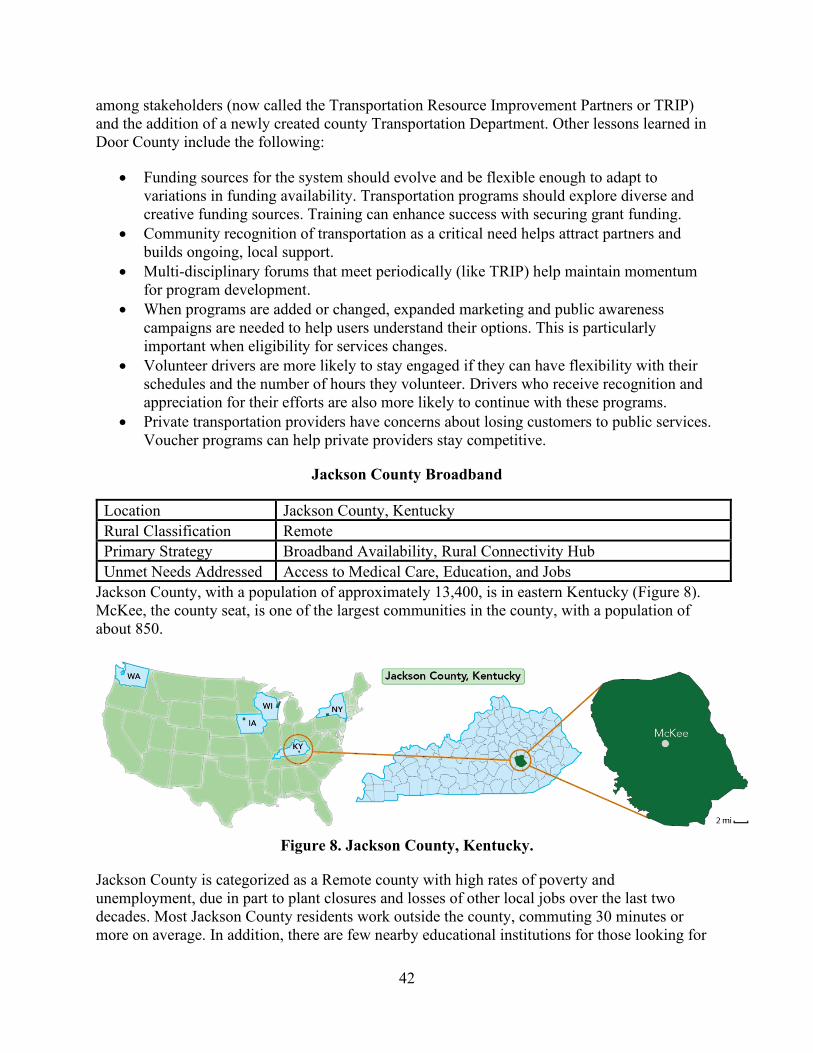
42
among stakeholders (now called the Transportation Resource Improvement Partners or TRIP) and the addition of a newly created county Transportation Department. Other lessons learned in Door County include the following:
• Funding sources for the system should evolve and be flexible enough to adapt to variations in funding availability. Transportation programs should explore diverse and creative funding sources. Training can enhance success with securing grant funding.
• Community recognition of transportation as a critical need helps attract partners and builds ongoing, local support.
• Multi-disciplinary forums that meet periodically (like TRIP) help maintain momentum for program development.
• When programs are added or changed, expanded marketing and public awareness campaigns are needed to help users understand their options. This is particularly important when eligibility for services changes.
• Volunteer drivers are more likely to stay engaged if they can have flexibility with their schedules and the number of hours they volunteer. Drivers who receive recognition and appreciation for their efforts are also more likely to continue with these programs.
• Private transportation providers have concerns about losing customers to public services. Voucher programs can help private providers stay competitive.
Jackson County Broadband
Location Jackson County, Kentucky Rural Classification Remote Primary Strategy Broadband Availability, Rural Connectivity Hub Unmet Needs Addressed Access to Medical Care, Education, and Jobs
Jackson County, with a population of approximately 13,400, is in eastern Kentucky (Figure 8). McKee, the county seat, is one of the largest communities in the county, with a population of about 850.
Figure 8. Jackson County, Kentucky.
Jackson County is categorized as a Remote county with high rates of poverty and unemployment, due in part to plant closures and losses of other local jobs over the last two decades. Most Jackson County residents work outside the county, commuting 30 minutes or more on average. In addition, there are few nearby educational institutions for those looking for
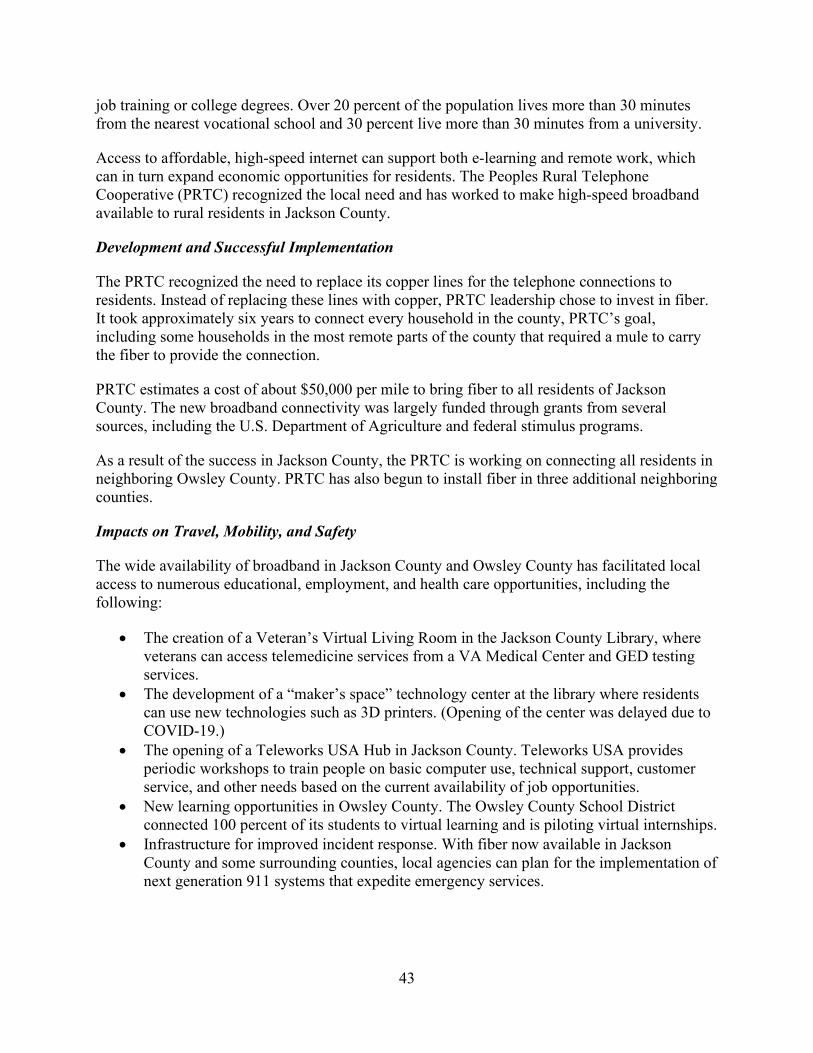
43
job training or college degrees. Over 20 percent of the population lives more than 30 minutes from the nearest vocational school and 30 percent live more than 30 minutes from a university.
Access to affordable, high-speed internet can support both e-learning and remote work, which can in turn expand economic opportunities for residents. The Peoples Rural Telephone Cooperative (PRTC) recognized the local need and has worked to make high-speed broadband available to rural residents in Jackson County.
Development and Successful Implementation
The PRTC recognized the need to replace its copper lines for the telephone connections to residents. Instead of replacing these lines with copper, PRTC leadership chose to invest in fiber. It took approximately six years to connect every household in the county, PRTC’s goal, including some households in the most remote parts of the county that required a mule to carry the fiber to provide the connection.
PRTC estimates a cost of about $50,000 per mile to bring fiber to all residents of Jackson County. The new broadband connectivity was largely funded through grants from several sources, including the U.S. Department of Agriculture and federal stimulus programs.
As a result of the success in Jackson County, the PRTC is working on connecting all residents in neighboring Owsley County. PRTC has also begun to install fiber in three additional neighboring counties.
Impacts on Travel, Mobility, and Safety
The wide availability of broadband in Jackson County and Owsley County has facilitated local access to numerous educational, employment, and health care opportunities, including the following:
• The creation of a Veteran’s Virtual Living Room in the Jackson County Library, where veterans can access telemedicine services from a VA Medical Center and GED testing services.
• The development of a “maker’s space” technology center at the library where residents can use new technologies such as 3D printers. (Opening of the center was delayed due to COVID-19.)
• The opening of a Teleworks USA Hub in Jackson County. Teleworks USA provides periodic workshops to train people on basic computer use, technical support, customer service, and other needs based on the current availability of job opportunities.
• New learning opportunities in Owsley County. The Owsley County School District connected 100 percent of its students to virtual learning and is piloting virtual internships.
• Infrastructure for improved incident response. With fiber now available in Jackson County and some surrounding counties, local agencies can plan for the implementation of next generation 911 systems that expedite emergency services.
44
Lessons Learned
In large part, the leadership of PRTC’s CEO led to the success of the broadband installation. This indicates the need for a champion at the highest levels of an organization to identify and remain dedicated to achieving the goal. Additional lessons learned include the following:
• Securing grant funding requires time, effort, a learning curve, and often multiple attempts.
• Providing broadband to every household does not mean that every family will use it. It may take time to overcome resistance to or distrust of connecting to the internet.
• Some skills such as grant writing and technical support could not be easily leveraged locally. Providing flexible work arrangements to staff can help retain skilled employees.
ITS for Speed Management in Elmira, New York
Location Elmira, New York Rural Classification Metropolitan Primary Strategy Speed Feedback Signs with Blackout Data Collection Unmet Needs Addressed Vehicle Occupant Safety, Behavior-Related Vehicle Fatalities
Elmira, New York, is located in Chemung County near the southern border with Pennsylvania (Figure 9). The county has about 83,500 residents. Chemung County is categorized as a Metropolitan county because of its proximity to Binghamton. However, Elmira and the surrounding towns are primarily in rural areas.
Figure 9. Elmira and Chemung County, New York.
According to Chemung County’s Local Road Safety Plan, motor vehicle crashes are the fourth leading cause of death (Storm, Ercisli and Neuner 2019). Speed and aggressive driving have been identified as emphasis areas, and Elmira and Chemung County have a strong interest in countermeasures to address these issues.
Development and Successful Implementation
Elmira and Chemung County were selected as a case study due to their innovative use of technology that is accessible, low-cost, and relatively common to state, county, and local agencies and includes portable dynamic message signs and permanently mounted speed feedback signs. In 2000, Chemung County staff observed intelligent transportation system (ITS) speed
45
management signs in use in nearby Ithaca, New York, and began efforts to implement a similar program. It was also the start of ongoing collaboration between these and other peer communities to pursue more local authority for speed control measures.
The county deployed speed feedback signs in Elmira to provide drivers with information about their driving speeds. Twelve mobile signs and six permanent signs have been installed since the start of the program. The signs measure the speed of approaching vehicles and display it to drivers as they pass. Some of the signs can also collect data for further analysis.
During the initial deployment, one of the signs malfunctioned and did not display speeds to drivers, even though it was collecting the speed data. Upon further analysis, county staff documented higher speeds when drivers thought the signs were turned off. This led to another valuable use of the technology—documenting “true” driving speeds of motorists when they think they are not being monitored.
The initial signs have limitations that prevent seamless data collection and remote transmission of data to county computers. As the speed feedback signs are being replaced, the county is working to procure replacement signs with enhanced collection capabilities. Long-term, the county would also like to enhance data transmission capabilities, but this is dependent on upgrades to cell and broadband networks in the area.
Impacts on Travel, Mobility, and Safety
Elmira’s use of ITS devices to support speed management has achieved speed reductions and generated additional, informative data that may help in planning refinements or complementary strategies. Speed continues to be a problem at the local level, even though the authority to significantly reduce the speed limits (e.g., down to 15 mph) tends to remain at the state level. Strategies like ITS technologies provide feasible alternatives to speed limit reductions for local agencies.
Lessons Learned
One of the main lessons learned from this example is that local agencies can use ITS equipment they already own to capture additional, useful information at no additional cost. Other lessons learned include the following:
• Data collected from speed feedback signs can help to either confirm or refute speeding complaints by providing evidence regarding the perception or reality of speeding behavior. It also allows pinpointing the days and times when speeding most often occurs.
• After removal of mobile speed feedback signs, drivers sustained a speed reduction for approximately two more weeks. Therefore, there is a diminishing effect.
• ITS signs to support speed management are one of many strategies to reduce speeds, and local road agencies can consider using and integrating multiple approaches.

46
Key Takeaways Strategies highlighted in these case studies address unmet needs in rural communities that speak to FHWA priorities of improving safety, access, and mobility in these communities across the country. Key takeaways from the case studies include the following:
• Contrary to what is typically found in large, urban areas, the bikeshare system in Pocahontas, Iowa, was largely implemented to justify recreational facilities in the community.
• New transportation offerings should be followed by targeted marketing. Pocahontas identified a need to engage residents as well as an opportunity to market the bikeshare system as an attractive amenity to potential visitors. For Door County, Wisconsin, marketing changes to the public transportation system were used to address public misperceptions, as many residents believed that the ADRC bus served only a specific age group.
• Case studies in Washington State, Chemung County, and Door County emphasized the importance of working with the public. Washington State Patrol emphasized the need to ensure trust and transparency with the deployment of its UAS program. Representatives from Chemung County noted attending public meetings to better understand public concerns regarding potential speed management tools (e.g., the inclusion of speed feedback signs).
• Both the Washington State Patrol and Pocahontas, Iowa, used a pilot to test the emerging technology and opportunity. In addition, Door County’s system has evolved over time, with changes to state and federal legislation that have impacted funding for the system and consequently the hours of operation.
• The COVID-19 pandemic significantly impacted Pocahontas, Iowa; Door County, Wisconsin; and Jackson County, Kentucky. Pocahontas’s bikeshare system did not operate in 2020. Some Door County volunteers who help provide transportation to residents sheltered at home to protect themselves. The launch of a “maker’s space” in Jackson County, largely enabled by the broadband available in the community, has been delayed by around a year in response to the pandemic.
• There is significant value in convening a multi-disciplinary group of individuals on a periodic but sustained basis (e.g., once every four months). Such groups ensure that everyone has a voice at the table, works together to address needs uniquely understood by each participant, and continues to collaboratively identify solutions. Such examples were seen in Door County, Chemung County (Elmira, New York), and Washington State.
• Not every application for funding is successful. However, there may be opportunities to “tweak” applications (as was done in Jackson County, Kentucky) by asking for feedback on how a grant application can be improved. Jackson County leveraged the grant writing skills of professionals but still adjusted or improved applications based on feedback. The Jackson County case study also revealed grant writing expertise as an unmet need in some rural areas and smaller towns.
• Additional training opportunities can also support grant applications. Door County and Jackson County identified conferences and events that served as the driving force behind writing an agency’s first grant (Door County) and creating a virtual living room (Jackson County).
47
• The case studies highlighted that strategies are more effective if their use is monitored over time to determine if implemented strategies are working as expected and if changes are needed to improve results.
• Engaging high-level leadership facilitates success. The Washington State example engaged the governor’s office. The implementation of broadband connectivity in Kentucky was led at the highest level of the utility company.
• Planning initiatives can support the implementation of new strategies. Local planning efforts in Door County documented the need for transportation services, which became a driving force behind the services provided. Similarly, the City of Pocahontas was planning to implement a bike path and created the bikeshare system as a way to document use that would show support for bike facilities.
• As seen with the speed feedback and dynamic message signs used in Elmira, New York, and the unmanned aerial systems in Washington State, new technologies continue to reveal opportunity for innovative uses to address needs.
48
CHAPTER 6. RESEARCH FINDINGS
The purpose of this study was to explore the potential of new technologies and opportunities to provide safety and mobility solutions in rural areas. This section summarizes findings from the major components of the study. Through a combination of quantitative and qualitative data collection and analysis, the study adds significant knowledge to the existing body of research on unmet transportation needs in rural areas, effective strategies to address them, and innovative practices in place across the U.S.
Rural Area Classification
To capture the geographic, economic, and demographic diversity of the rural U.S., this study categorized rural counties into eight types. The resulting rural classification system described in Chapter 2 supports analysis of mobility and safety needs by revealing mobility and safety gaps across rural classes. The rural classification was also used to identify potential strategies and case studies.
Unmet Needs in Diverse Rural Areas
The analyses presented in Chapter 3 and Appendix D demonstrate that there are many unmet safety, mobility, and access needs in rural counties. Some key takeaways from this analysis include the following:
• Many of the unmet needs are most acute in Remote counties, where performance measures indicate significant gaps compared with the national average and mean estimates for urban counties. Agriculture & Extraction counties also appear to have some of the greatest needs among rural counties. Approximately 6.3 million people live in these two county types.
• The 94 Tribal counties in the U.S. have significant unmet needs, especially related to vehicle fatality rates, traveling without a seatbelt or motorcycle helmet, and cyclist safety. Tribal counties also have relatively low access to general medical facilities and substance abuse treatment facilities.
• The performance measures for Destination, Rural Towns, Fringe, and Older-Age counties are closer to the national average than other rural county types across most performance measures. Exceptions include the following:
o Destination counties have higher rates of speeding- and drunk-driving-related crashes as well as longer distances to a hospital as compared to the national average.
o Fringe counties have relatively higher pedestrian fatality rates and relatively low access to medical care and available broadband.
o Rural Towns counties have relatively low access to available broadband. o Older-Age counties have higher cyclist fatality rates.
• Micropolitan counties tend to fare the best relative to other rural county types. This is perhaps unsurprising since they share many characteristics with Metropolitan counties, including the presence of urbanized areas, well-developed transportation networks, and broad resource availability (i.e., food, healthcare, education, and broadband).
49
• Across all county types, broadband was found to play a significant role, often limiting or enabling efforts to meet unmet needs with emerging business models, technologies, and other innovative, twenty-first century solutions.
Strategies for Addressing Unmet Needs
Chapter 4 identified strategies that can potentially address the unmet needs identified in prior tasks. Strategies identified were grouped into four categories: broadband, vehicle, communication technologies, and infrastructure and program development. Between four and sixteen strategies were identified for each of the four categories, as summarized in Appendix G.
Even though broadband is itself a broad category, it was found to be common and essential for many strategies, including but not limited to the following:
• Wi-Fi hotspots • Fiber installations during roadway/trail work • Rural connectivity hubs • GIS-based carpool mapping systems • E-scooters • Bicycle libraries • Bikeshare • Microtransit • Mobility-on-demand
One important takeaway from the strategy analysis is that as new and emerging technologies continue to become available and more affordable, they can provide a promising strategy to improve access, mobility, and safety for rural residents. However, without access to broadband, many of these strategies are out of reach. Broadband today is similar to the economic benefits brought by the interstates of previous generations.
Broadband, when quality is sufficiently high, may serve as an alternative to transportation for certain activities. State departments of transportation have worked with private sector companies to install broadband in their rights-of-way. Furthermore, broadband can enable the various business models that are becoming common in urban areas but have not taken hold in rural areas because of limited amounts of this supporting infrastructure. Broadband is fundamental for growing innovation in improving access and safety in the rural transportation sector.
Given the connection between broadband availability and the implementation of many of the other recommended strategies, transportation agencies and other stakeholder organizations may want to consider complementary initiatives focused on facilitating and incentivizing implementation of high-speed internet in rural communities. As broadband can improve access to many needs in addition to transportation (such as education, health care, etc.), there may be opportunities to develop initiatives across multiple federal agencies and funding sources. It is particularly important for rural areas to find innovative funding mechanisms since broadband profitability can be difficult to achieve in areas of low density. Future research could focus specifically on finding new ways to fund broadband.
50
Another common theme among these strategies is related to the need for infrastructure to support non-motorized transportation in rural areas. For example, several strategies in the vehicle category involve an increase in access to bicycles as an alternative transportation mode, but rural areas often lack bike lanes, separated trails, or other facilities that encourage bicycle use. Entities that are interested in these modes may also need to consider inclusion of supportive infrastructure.
ITS for speed management highlights another innovative approach that addresses speeding, which is a common rural problem. Addressing speeding on rural roads is of interest to FHWA due to the disproportionate number of fatalities compared to more urban areas.
Case Study Findings
The research summarized in Chapter 5 highlights how rural entities have worked to address unmet needs (many of which are FHWA priorities) in their communities using some of the strategies discussed previously in this report. The provision of bikeshare in the small, rural community of Pocahontas, Iowa, though currently primarily serving recreational trips, has the potential to be used for more utilitarian trips. Improving access to recreation facilities and improving mobility are both FHWA priorities.
The provision of broadband in Jackson County, Kentucky, and public transportation in Door County, Wisconsin, help residents access healthcare, an FHWA priority. The innovative use of speed feedback signs in Elmira, New York, helps address safety by aiming to reduce speeding. The reduction of road closure times enabled by efficient crash scene data collection by UAS in Washington State improves delay times and the safety experience of motorists. Improving safety with innovative technology like UAS is another FHWA priority.
Each case study was chosen to highlight a primary strategy addressing a single unmet need, but all demonstrate how communities use strategies to address multiple unmet needs at once.
Lessons Learned and Future Opportunities
This research provides important lessons and opportunities for the implementation and expansion of promising solutions for rural safety and mobility needs. Some of the key lessons and opportunities include the following:
• Improved rural broadband availability: Broadband is clearly critical for improving safety, mobility, and availability in rural areas. As emerging technologies continue to become available and more affordable, they can provide promising solutions for rural residents. However, without access to broadband, many technology-based strategies are out of reach. As made clear by feedback from case study organizations and from sources reviewed, broadband today is synonymous with the economic benefits brought by the interstate highways of previous generations.
• Cooperation among multi-disciplinary groups: Mobility-on-demand in Door County, Wisconsin; safety innovations in Chemung County, New York; and unmanned aerial systems in Washington State were all shown to benefit from convening multi-disciplinary groups of individuals. Incentivizing cooperation among such groups may help to identify
51
and subsequently address needs and solutions in a community. The success and longevity of such groups could be models for helping expand transportation solutions to other parts of the country.
• Grant writing resources and assistance: Skilled grant writing has enabled agencies to leverage opportunities, but this need cannot always be satisfied by many rural agencies. Providing support or incentives to agencies to write grants (and to provide feedback on how unsuccessful grants could have been improved) may foster opportunities for innovative mobility and safety solutions in rural communities.
• Bicycle and pedestrian infrastructure: Bicycle and pedestrian infrastructure in rural communities helps programs like the Pocahontas bikeshare succeed. This type of infrastructure helps alleviate relatively high pedestrian and cyclist fatality rates in rural communities and improve access to medical care, food, jobs, and education in some places.
This research project has shown that successful urban strategies cannot simply be transferred to a rural location without consideration of the infrastructure, resources, and challenges that exist in the rural environment. It underscores the need for programs and expertise customized to rural transportation agencies and networks, as demonstrated in the comprehensive research conducted for this study and by the successful projects exemplified in the five case studies.
52
REFERENCES Alanazy, Ahmed, Stuart Wark, John Fraser, and Amanda Nagle. 2019. "Factors Impacting
Patient Outcomes Associated with Use of Emergency Medical Services Operating in Urban Versus Rural Areas: A Systematic Review." (International Journal of Environmental Research and Public Health) 16 (10).
Banse, Tom. 2019. Washington State Patrol builds up fleet of 111 drones. July 9. Accessed October 13, 2020. https://www.nwpb.org/2019/07/10/washington-state-patrol-builds-up-its-drone-fleet-to-more-than-100/.
Cambridge Systematics, Incorporated; KFH Group, Incorporated. 2018. "Expanding Access to Our Communities: A Guide to Successful Mobility Management Practices in Small Urban and Rural Areas." Accessed December 15, 2020. https://trid.trb.org/view/1511932.
Carnevale, Anthony P., Stephen J. Rose, and Ban Cheah. 2011. The College Payoff. Washington, D.C.: Georgetown University Center on Education and the Workforce. https://1gyhoq479ufd3yna29x7ubjn-wpengine.netdna-ssl.com/wp-content/uploads/collegepayoff-completed.pdf.
CarShare Vermont. 2020. The right vehicle for the job. Accessed September 14, 2020. https://www.carsharevt.org/locations/.
Center for Neighborhood Technology. 2020. Housing and Transportation Affordability Index - About the Index. Accessed April 20, 2020. https://htaindex.cnt.org/about/.
ch2m. 2015. September. Accessed September 10, 2020. http://www.dot.minnesota.gov/trafficeng/safety/docs/mumblestripsummary.pdf.
Childress, Greg. 2020. "School buses to carry Wi-Fi hotspots to rural, underserved students." The Progressive Pulse, May 6. Accessed July 23, 2020. http://pulse.ncpolicywatch.org/2020/05/06/school-buses-to-carry-wi-fi-hotspots-to-rural-underserved-students/.
Coleman-Jensen, Alisha, Matthew P. Rabbitt, Christian A. Gregory, and Anita Singh. 2020. Household Food Security in the United States in 2019. Economic Research Report Number 275, Economic Research Service, United States Department of Agriculture, Washington, D.C.: United States Department of Agriculture. Accessed August 30, 2021. https://www.ers.usda.gov/webdocs/publications/99282/err-275.pdf?v=9813.1.
Combos, Lucas. 2020. Help Arrives For Those Cut Off by Highway 2 Closure. January 15. Accessed April 20, 2020. https://patch.com/washington/across-wa/help-arrives-those-cut-highway-2-closure.
de Leon, Concepcion. 2020. Drone Delivery? Amazon Moves Closer With F.A.A. Approval. The New York Times. August 31. Accessed September 18, 2020. https://www.nytimes.com/2020/08/31/business/amazon-drone-delivery.html.
Dickman, Dana, Nick Falbo, Steve Durrant, Joe Gilpin, Gena Gastaldi, Collin Chesston, Prescott Morrill, et al. 2016. Small and Rural Multimodal Networks. U.S. Department of Transportation, Federal Highway Administration, 134. Accessed July 16, 2020. https://www.fhwa.dot.gov/environment/bicycle_pedestrian/publications/small_towns/fhwahep17024_lg.pdf.
Dohms, Elizabeth. 2019. Shared-Ride Taxi Program In Door County Faces Unknown Future. April 11. Accessed December 3, 2020. https://www.wpr.org/shared-ride-taxi-program-door-county-faces-unknown-future.
53
Door-Tran. 2020. Door-Tran's Volunteer & Voucher Programs Receive Support. July. Accessed December 15, 2020. https://mailchi.mp/b67e94f900a9/door-tran-july-2020-newsletter.
EVgo. 2018. Green Raiteros Connects Rural Californians to Vital Services. October 12. Accessed April 9, 2021. https://www.evgo.com/press-release/green-raiteros-connects-rural-californians-vital-services/.
Federal Communication Commission. 2014. Types of Broadband Connections. June 23. Accessed October 28, 2020. https://www.fcc.gov/general/types-broadband-connections#:~:text=The%20term%20broadband%20commonly%20refers,Fiber.
Federal Highway Administration (FHWA). 2020. Integrated Corridor Management, Transit, and Mobility on Demand. May 4. Accessed July 19, 2021. https://ops.fhwa.dot.gov/publications/fhwahop16036/ch3.htm#s31.
Federal Highway Administration. 2019. "Chemung County, New York, Local Road Safety Plan." Technical Report, Washington, D.C. Accessed August 30, 2021. https://ruralsafetycenter.org/wp-content/uploads/2021/06/Chemung-LRSP-05172019_final.pdf.
—. 2020. Connected and Automated Vehicles. April 21. Accessed November 1, 2020. https://ops.fhwa.dot.gov/publications/fhwahop17001/ch1.htm#:~:text=Autonomous%20Vehicles%20are%20the%20final,with%20no%20human%20assistance%20whatsoever.
—. n.d. Pedestrian Crash Statistics. Accessed April 29, 2021. http://www.pedbikesafe.org/PEDSAFE/guide_statistics.cfm.
—. 2020. Shared Mobility: Current Practices and Guiding Principles. May 12. Accessed August 27, 2021. https://ops.fhwa.dot.gov/publications/fhwahop16022/ch1.htm.
Foenix: Mobility Rising. n.d. Winnebago County, Wisconsin. Accessed July 29, 2020. https://feonixmobilityrising.org/wisconsin.
Food Marketing Institute. 2015. U.S. Grocery Shopper Trends 2015. Arlington, VA: Food Marketing Institute. https://www.fmi.org/docs/default-source/document-share/fmitrends15-exec-summ-06-02-15.pdf.
Gedon, Trisha. 2019. Kay County 4-H'er has big plans for her community. Oklahoma State University. June 26. Accessed Septmber 14, 2020. https://news.okstate.edu/articles/agricultural-sciences-natural-resources/2019/gedon_catalyst_for_change.html.
Gettinger, Dan. 2018. "Public Safety Drones: An Update." May. Accessed October 13, 2020. https://dronecenter.bard.edu/public-safety-drones-update/.
Gier, Jamie. 2017. Missed appointments cost the U.S. healthcare system $150B each year. April 26. Accessed May 8, 2020. https://www.hcinnovationgroup.com/clinical-it/article/13008175/missed-appointments-cost-the-us-healthcare-system-150b-each-year.
Godavarthy, Ranjit, and Jill Hough. 2019. Opportunities for State DOTs (and others) to Encourage Shared-Use Mobility Practices in Rural Areas. National Cooperative Highway Research Program, Transportation Research Board, National Academy of Sciences, Engineering, and Medicine. Accessed July 29, 2020. http://onlinepubs.trb.org/onlinepubs/nchrp/2065/Task76Report.pdf.
Godavarthy, Ranjit, Jill Hough, Sean Libberton, and Russell Koff. 2019. Opportunities for State DOTs (and others) to Encourage Shared-Use Mobility Practices in Rural Areas. National Cooperative Highway Research Program, Transportation Research Board, National Academy of Science, Engineering, and Medicine. Accessed July 17, 2020. http://onlinepubs.trb.org/onlinepubs/nchrp/2065/Task76Report.pdf.
54
Halpern, Sue. 2019. The One-Traffic-Light Town with Some of the Fastest Internet in the U.S. The New Yorker. December 3. Accessed July 20, 2020. https://www.newyorker.com/tech/annals-of-technology/the-one-traffic-light-town-with-some-of-the-fastest-internet-in-the-us.
Holloway, Barbara, Patricia Coon, Diane Kersten, and Elizabeth Ciemins. 2011. "Telehealth in Rural Montana: Promoting Realistic Independent Self-Management of Diabetes." Diabetes Spectrum 50-54.
Intelligent Transportation Society of America. 2017. "Rural Connected Vehicle Gap Analysis: Factors Impeding Deployment and Recommendations for Moving Forward." Accessed September 11, 2020. https://rosap.ntl.bts.gov/view/dot/34723.
Kerr-Tar Regional Council of Governments. 2018. "East Coast Greenway BUILDs Rural NC." Larson, Gwen. 2019. "A New Public Transportation Model: Door County, Wisconsin." Accessed
December 15, 2020. https://www.co.door.wi.gov/DocumentCenter/View/2686/Door-County-Transportation-Model-Larson--Assoc-Feb-2019.
Loveridge, Melissa. 2020. E-scooters hit the Bozeman streets again - Bozeman Daily Chronicle. June 5. Accessed April 9, 2021. https://www.bozemandailychronicle.com/news/business/e-scooters-hit-the-bozeman-streets-again/article_fb94e7e0-9bec-54bf-9d1d-11c51efddd26.html.
Martin, Russ. 2018. "Doubling Down on Behavior Highway Safety." 2nd National Summit on Rural Road Safety. Governors Highway Safety Association. Accessed April 16, 2020. https://ruralsafetycenter.org/wp-content/uploads/2018/12/Doubling-Down_RussMartin.pdf.
Mattson, Jeremy. 2017. Rural Transit Fact Book 2017. Fargo, ND: Small Urban and Rural Transit Center.
Meltzer, Erica. 2018. "Lack of transportation, conflicting deadlines put school choice out of reach for some, study finds." December 11. Accessed April 1, 2020. https://chalkbeat.org/posts/co/2018/12/11/lack-of-transportation-conflicting-deadlines-put-school-choice-out-of-reach-for-some-study-finds/.
Mendoza, Martha. 2020. "In pandemic, using drones to drop medical supplies from sky." Albuquerque Journal, May 27.
Moreno, Johan. 2021. Google Maps Appears To Be Adding Railroad Crossing Alerts. February 28. Accessed August 30, 2021. https://www.forbes.com/sites/johanmoreno/2021/02/28/google-maps-appears-to-be-adding-railroad-crossing-alerts/?sh=2cc79dc77987.
National Association of City and Transportation Officials. n.d. Active Warning Beacon for Bike Route at Unsignalized Intersection. Accessed July 20, 2020. https://nacto.org/publication/urban-bikeway-design-guide/bicycle-signals/active-warning-beacon-for-bike-route-at-unsignalized-intersection/.
National Association of City Transportation Officials (NACTO). n.d. Tactical Urbanism: Quick Changes on the Ground. Accessed September 10, 2020. https://nacto.org/event/designingcities-2017-tactical-urbanism-quick-changes-on-the-ground/.
National Association of City Transportation Officials. n.d. "Urban Bikeway Design Guide." National Association of City Transportation Officials (NACTO). Accessed September 10, 2020. https://nacto.org/publication/urban-bikeway-design-guide/cycle-tracks/one-way-protected-cycle-tracks/#:~:text=Description,the%20motor%20vehicle%20travel%20lane.
55
National Highway Traffic Safety Administration. n.d. Automated Vehicles for Safety. Accessed November 1, 2020. https://www.nhtsa.gov/technology-innovation/automated-vehicles.
National Operations Center of Excellence. 2020. "The Use of Unmanned Aerial Systems (UAS) for Traffic Incident Management." Traffic Incident Management. July 22. Accessed October 13, 2020. https://transportationops.org/tim.
NHTSA. 2019. Traffic Safety Facts: Rural/Urban Comparison of Traffic Fatalities. June. Accessed April 29, 2021. https://crashstats.nhtsa.dot.gov/Api/Public/ViewPublication/812741#:~:text=In%202017%20the%20fatality%20rate,1.79%20and%200.85%2C%20respectively).&text=Speeding%2Drelated%20fatalities%20occurred%20in,in%20rural%20and%20urban%20areas.
NS Agriculture. 2020. "CropSwap launches new app connecting farmers and consumers." NS Agriculture, April 7. Accessed July 23, 2020. https://www.nsagriculture.com/news/cropswap/.
Ollove, Michael. 2020. Rural America’s Health Crisis Seizes States’ Attention. January 31. Accessed March 24, 2021. https://www.pewtrusts.org/en/research-and-analysis/blogs/stateline/2020/01/31/rural-americas-health-crisis-seizes-states-attention.
Quantified Ventures. n.d. Outdoor Recreation Environmental Impact Bond. Accessed July 20, 2020. https://www.quantifiedventures.com/outdoor-recreation-environmental-impact-bond.
RapidSOS. 2015. "Outcomes: Quantifying the Impact of Emergency Response Times." Raulerson, Mary Taylor, Amanda Leahy, Conor Semler, Susan Mah, Dan Gelinne, Kristen
Brookshire, Wes Kumfer, Oana Leahu-Aluas, Mark Stout, and Brian Smith. 2018. Strategies for Accelerating Multimodal Project Delivery. Washington, D.C.: Federal Highway Administration (FHWA). Accessed July 8, 2020. https://www.fhwa.dot.gov/environment/bicycle_pedestrian/publications/multimodal_delivery/.
Robert Wood Johnson Foundation. n.d. A 'Scrappy' Push for Health: 'Our Best Asset Is Our People'. Accessed July 16, 2020. https://www.rwjf.org/en/library/features/culture-of-health-prize/2017-winner-allen-county-kansas.html.
Rural Health Information Hub. 2013. Mobile Clinics. March. Accessed July 22, 2020. https://www.ruralhealthinfo.org/toolkits/transportation/2/models-to-overcome-barriers/mobile-clinics.
Safe Routes to School National Partnership. n.d. "Rural Communities: Best Practices and Promising Approaches for Safe Routes." Safe Routes to School National Parntership. Accessed April 16, 2020. https://www.saferoutespartnership.org/sites/default/files/resource_files/rural_communities_best_practices_and_promising_approaches_for_safe_routes.pdf.
Smith, Ashley A. 2017. Bumps in the Road for Rural Students. October 4. Accessed April 15, 2020. https://www.insidehighered.com/news/2017/10/04/nonacademic-barriers-highlight-challenges-facing-rural-colleges%C2%A0.
Somers, Meredith. 2019. Idea for small farms app wins 2019 Enterprise Management Lab hackathon. April 18. Accessed July 22, 2020. https://mitsloan.mit.edu/ideas-made-to-matter/idea-small-farms-app-wins-2019-enterprise-management-lab-hackathon.
Storm, Richard, Safak Ercisli, and Michelle Neuner. 2019. "Chemung County, New York Local Road Safety Plan." https://ruralsafetycenter.org/wp-content/uploads/2021/06/Chemung-LRSP-05172019_final.pdf.
56
Sunna Design. 2017. Solar-powered LED illuminated pathway. March 1. Accessed July 8, 2020. https://solarlighting.com/solar-pathway-lights-bellingham-washington/.
Syed, Samina T., Ben S. Gerber, and Lisa K. Sharp. 2013. "Traveling Towards Disease: Transportation Barriers to Health Care Access." J Community Health 976-993.
The National Academies of Sciences, Engineering, and Medicine. n.d. NCHRP 08-120 [Active]. Accessed September 11, 2020. https://apps.trb.org/cmsfeed/TRBNetProjectDisplay.asp?ProjectID=4557.
The Pew Charitable Trusts. 2018. August 6. Accessed October 28, 2020. https://www.route-fifty.com/public-safety/2018/08/another-use-drones-investigating-car-wrecks/150312/.
U.S. Department of Transportation. n.d. 20 Questions About Connected Vehicles. Accessed September 10, 2020. https://www.its.dot.gov/cv_basics/cv_basics_20qs.htm.
U.S. Department of Transportation. 2020. Benefit-Cost Analysis Guidance for Discretionary Grant Programs. USDOT Office of the Secretary.
—. 2021. Departmental Guidance on Valuation of a Statistical Life in Economic Analysis. May 13. Accessed August 30, 2021. https://www.transportation.gov/office-policy/transportation-policy/revised-departmental-guidance-on-valuation-of-a-statistical-life-in-economic-analysis.
—. 2020. Rural Opportunities to Use Transportation for Economic Success (ROUTES). April 23. Accessed April 30, 2020. https://www.transportation.gov/rural.
—. n.d. Wyoming (WY) DOT Pilot. Accessed September 20, 2020. https://www.its.dot.gov/pilots/pilots_wydot.htm#:~:text=WYDOT%20will%20develop%20systems%20that,of%20I%2D80%20in%20Wyoming.&text=In%20addition%2C%20of%20the%20400,OBUs%20and%20mobile%20weather%20sensors.
U.S. Government Accountability Office. 2012. "Planning and Flexibility Are Key to Effectively Deploying Broadband Conduit through Federal Highway Projects." Washington, D.C. Accessed March 31, 2021. https://www.gao.gov/assets/gao-12-687r.pdf.
University of Iowa. 2021. ADS For Rural America. Accessed April 9, 2021. https://adsforruralamerica.uiowa.edu/#:~:text=Automated%20Driving%20Systems%20(ADS)%20for,underrepresented%20in%20ADS%20research%20today.
Via. 2021. RIDE Wilson, NC - Case Study. February. Accessed April 9, 2021. https://orenvia-wpengine.netdna-ssl.com/wp-content/uploads/2021/02/20210330_casestudy_Wilson-US-Letter.pdf.
Villwock-Witte, Natalie. 2019. Bicycle & Pedestrian Infrastructure Improvements Realized in Communities of Less Than 10,000 People: Final Report. Western Transportation Institute (WTI), Montana State University (MSU), Bozeman: Small Urban and Rural Livability Center (SURLC). Accessed July 8, 2020. https://westerntransportationinstitute.org/research_projects/bicycle-and-pedestrian-infrastructure-improvements-realized-in-communities-of-less-than-10000/.
Villwock-Witte, Natalie. 2019. Bicycle and Pedestrian Infrastructure Improvements Realized in Communities of Less Than 10,000 People. Bozeman: Western Transportation Institute at Montana State University. https://westerntransportationinstitute.org/research_projects/bicycle-and-pedestrian-infrastructure-improvements-realized-in-communities-of-less-that-10000-people/.
Villwock-Witte, Natalie. 2019. New Mobility Opportunities in a Rural Context. Western Transportation Institute, Montana State University, Bozeman: Small Urban and Rural Livibility Center (SURLC). Accessed July 29, 2020.
57
https://westerntransportationinstitute.org/wp-content/uploads/2020/03/4W6590_RuralRidesharing_12202019_FINAL.pdf.
Vincent, James. 2020. Walmart begins testing drone deliveries for household goods and groceries. The Verge. September 10. Accessed September 18, 2020. https://www.theverge.com/2020/9/10/21430280/walmart-drone-delivery-pilot-program-north-carolina-flytrex.
Vogel, Jennifer. 2011. Grand Marais wants broadband to open doors but not wreck the allure of remoteness. March 24. Accessed October 2, 2019. https://www.mprnews.org/story/2011/03/24/ground-level-broadband-cook-county.
—. 2012. "Fixing a ride, fixing a life on the Iron Range." MPR News, April 30. Accessed April 17, 2020. https://www.mprnews.org/story/2012/05/01/ground-level-getting-there-rural-rides.
Watson, Mike, and Evey Owen. 2020. A Temporary Mobility Lane Helps Jump-Start Permanent Change. August. Accessed September 18, 2020. https://www.aarp.org/livable-communities/community-challenge/info-2020/missouri-kansas-city-2018-grantee.html?cmp=SNO-TW-LC&socialid=3610570935.
Wells, Jennifer, and Barritt Lovelace. 2018. Improving the Quality of Bridge Inspections Using Unmanned Aircraft Systems (UAS). St. Paul: Minnesota Department of Transportation (MnDOT).
58
APPENDIX A. RURAL AREA CLASSIFICATION SYSTEMS REVIEWED
This appendix describes existing rural-urban classification systems and the data used to support these systems. The systems and supporting reports scanned include the following:
• U.S. Census Bureau Urban Area Classifications • Office of Management and Budget (OMB) Metropolitan Statistical Area Definitions • USDA ERS Rural-Urban Continuum Codes • USDA ERS Urban Influence Codes • USDA ERS County Typology Codes • FHWA Developing Performance Measures for Rural Access Transportation (PM4RA) • USDA ERS Rural-Urban Commuting Area Codes • USDA Business and Industry Loan Program • Federal Office of Rural Health Policy (FORHP) Classification • NCHRP 20-122: Rural Transportation Issues: Research Roadmap Report • NCHRP 582: Best Practices to Enhance the Transportation-Land Use Connection in the
Rural U.S. • Place Matters: Challenges and Opportunities in Four Rural Americas (University of New
Hampshire) • Transportation, Economic Development, and Quality of Life in Rural America (Rural
Policy Research Institute) • Putting Smart Growth to Work in Rural Communities (International City/County
Management Association) • FHWA Planning for Transportation in Rural Areas • USDOT Rural Opportunities to Use Transportation for Economic Success (ROUTES)
U.S. Census Bureau Urban Area Classifications The U.S. Census defines rural as “open country and settlements with fewer than 2,500 residents.” This excludes urban areas, which are defined as either all urbanized areas with populations over 50,000, or urban clusters with populations between 2,500 and 49,999 people. The U.S. Census Bureau also defines urban areas as “core census block groups or blocks that have a population density of at least 1,000 people per square mile and surrounding census blocks that have an overall density of at least 500 people per square mile.” Urban area boundaries do not necessarily align with county boundaries, ZIP codes, or other common geographic units, which can make it difficult to work with some datasets. As with the OMB classification described next, this classification system is also too coarse for this research effort. However, it is included here because it is a standard method of classification and could be useful for verifying high-level trends in data across urban and rural areas.
Office and Management and Budget (OMB) Metropolitan Statistical Area Definitions The Office of Management and Budget (OMB) definition of rural areas is among the most used urban-rural classification systems. OMB defines rural areas simply as counties existing outside of metropolitan and micropolitan areas (metropolitan/micropolitan counties containing one or more urbanized area with a population over 50,000/10,000-49,999 or are adjacent to and linked economically with such a county). OMB defines a linked county as one where at least 25 percent of workers commute to a metropolitan/micropolitan area. This OMB definition involves
59
classifying many rural areas as part of metropolitan counties, possibly leading to an undercount of the rural population. The FHWA PM4RA study defines rural areas as metropolitan counties with population densities of less than 50 people per square mile, or non-metropolitan counties that meet the OMB’s county-based definition of rural areas.
As with the Census classification system discussed above, this system is too coarse for this research effort. However, it is included here because, like the Census system, it is a standard classification method and could be useful for verifying high-level trends in data across urban and rural areas. Relative to the Census system, it is useful because it assigns a category (i.e., metropolitan, micropolitan, or non-core) to each county rather than each Census tract.
USDA ERS Rural-Urban Continuum Codes The U.S. Department of Agriculture (USDA) Economic Research Service (ERS) has developed multiple rural/urban classification systems that are more nuanced than a simple binary definition. The first classification system is the Rural-Urban Continuum Codes (RUCC) system, which assigns every U.S. county one of the nine following codes based on size and proximity to metropolitan areas, with multiple implications for economic opportunities and resources:
• Metro Counties: Areas 1-3 define counties in areas having populations greater than 1 million (Area 1), 250,000 to 1 million (Area 2), and fewer than 250,000 (Area 3).
• Non-metro Counties: Areas 4-5 define counties with populations greater than 20,000 and proximity (Area 4) or not (Area 5) to a metropolitan area
• Non-metro Counties: Areas 6-7 define counties with populations between 2,500-19,999 and proximity (Area 6) or not (Area 7) to a metropolitan area.
• Non-metro Counties: Areas 8-9 define rural counties with populations under 2,500 and proximity (Area 8) or not (Area 9) to an area with a population greater than 250,000.
As with any classification system based on population, it is important to note that population estimates are a snapshot in time and do not capture ongoing in-migration and out-migration. Populations based on the latest Census count may not reflect the true population in all areas. One related limitation of population-based measures is that communities that are shrinking or growing may be quite different from one another in terms of resources, infrastructure, and demographics—nuances that can be belied by their similar populations.
Generally, the ERS RUCC codes are useful to this effort for the following reasons:
• They capture not only population, but also adjacency to metropolitan areas, which has implications for commuting patterns.
• RUCC codes capture differences between rural counties that are/are not near more populous metropolitan areas. Broadly speaking, these two types will be characterized by different travel times (i.e., longer commutes in areas adjacent to metros) and varying access to medical care and other services (i.e., less access to grocery stores further from metropolitan areas).
• RUCC codes present a gradient of “more urban” to “more rural” places, which provides a useful overview of how performance measures vary between urban and rural counties.
60
USDA ERS Urban Influence Codes The USDA has defined Urban Influence Codes (referenced above), which divide U.S. counties into finer, non-metropolitan gradations according to size (metropolitan, micropolitan, or non-core), proximity to a more populated area, and presence (or absence) of a town within the county.5 These codes provide pre-calculated adjacency information relevant to mobility and safety research. The latest codes were developed in 2013 and will be updated in 2023. The 12 urban influence codes are listed below.
• Large metro area with at least 1 million residents or more • Small metro area with fewer than 1 million residents • Micropolitan adjacent to a large metro area • Non-core adjacent to a large metro area • Micropolitan adjacent to a small metro area • Non-core adjacent to a small metro with a town of at least 2,500 residents • Non-core adjacent to a small metro and does not contain a town of at least 2,500 residents • Micropolitan not adjacent to a metro area • Non-core adjacent to micro area and contains a town of 2,500-19,999 residents • Non-core adjacent to micro area and does not contain a town of at least 2,500 residents • Non-core not adjacent to a metro/micro area and contains a town of 2,500 or more
residents • Non-core not adjacent to a metro/micro area and does not contain a town of at least 2,500
USDA ERS County Typology Codes The ERS County Typology Codes, last updated in 2015, classify rural counties according to economic and policy types. The intent of this classification system is to provide policy-relevant information about diverse county conditions to policymakers and researchers. To do so, these codes define counties according to a range of economic and social characteristics.
The codes classify all U.S. counties according to six mutually exclusive categories of economic dependence, and six overlapping categories of policy-relevant themes. The economic dependence types include the following:
• Farming-dependent counties • Mining-dependent counties • Manufacturing-dependent counties • Federal/state government-dependent counties • Recreation counties • Nonspecialized counties
5 In this classification, the ERS builds on OMB’s classification of counties as metropolitan, micropolitan, or neither (non-core). A metropolitan area contains a core urban area with a population of 50,000 or more. A micropolitan area contains an urban core of at least 10,000 (but less than 50,000) in population. All counties that are not part of a Metropolitan Statistical Area (MSA) are considered non-core.
61
The policy-relevant types are listed below. These types are not mutually exclusive; counties may be none, one, or more than one type.
• Low education counties • Low employment counties • Persistent poverty counties • Persistent child poverty counties • Population loss counties • Retirement destination counties
The ERS County Typology codes are useful to this effort for the following reasons:
• They describe counties according to their economic and social characteristics rather than population and adjacency to more populous areas.
• These county types may be combined with other classifications to explore differences between, for example, farming-dependent counties within metropolitan areas and farming-dependent counties outside of metropolitan areas.
• They support analysis of relationships between performance measures such as access and safety and social characteristics such as poverty and education.
FHWA Developing Performance Measures for Rural Access Transportation (PM4RA) This FHWA report provides measures for assessing rural access at the national level. In this document, FHWA defines rural:
• According to Urban Influence Codes from USDA ERS to capture differences in economic development and access, and
• As metropolitan counties with a population density less than 50 people per square mile, or non-metropolitan counties following the OMB county-based definition.
Regarding geographic units, the report notes that counties are practical for national-level analyses because much data are available at the county level (e.g., County Business Patterns, Census data, travel survey data, Highway Performance Monitoring System data). However, smaller and more detailed census units (urban areas, tracts, blocks) are useful for regional or local analyses and case studies, although they require more intensive data processing and analysis. Census units also offer the advantage that they are more uniform in size than counties, which can vary widely within and between states.
USDA ERS Rural-Urban Commuting Area Codes USDA’s Rural-Urban Commuting Area (RUCA) codes provide census tract detail on commuting ties to urban areas of different sizes for sub-county analysis. The ten primary RUCA codes are presented below, along with secondary codes that subdivide primary codes to identify areas where classification categories overlap based on secondary commuting flows.
• 1. Metropolitan area core: primary flow within an urbanized area (UA) • 1.0 No additional code • 1.1 Secondary flow 30% to 50% to a larger UA • 2. Metropolitan area high commuting: primary flow 30% or more to a UA
62
• 2.0 No additional code • 2.1 Secondary flow 30% to 50% to a larger UA • 3. Metropolitan area low commuting: primary flow 10% to 30% to a UA • 3.0 No additional code • 4. Micropolitan area core: primary flow within an urban cluster of 10,000 to 49,999
(large UC) • 4.0 No additional code • 4.1 Secondary flow 30% to 50% to a UA • 5. Micropolitan high commuting: primary flow 30% or more to a large UC • 5.0 No additional code • 5.1 Secondary flow 30% to 50% to a UA • 6. Micropolitan low commuting: primary flow 10% to 30% to a large UC • 6.0 No additional code • 7. Small town core: primary flow within an urban cluster of 2,500 to 9,999 (small UC) • 7.0 No additional code • 7.1 Secondary flow 30% to 50% to a UA • 7.2 Secondary flow 30% to 50% to a large UC • 8. Small town high commuting: primary flow 30% or more to a small UC • 8.0 No additional code • 8.1 Secondary flow 30% to 50% to a UA • 8.2 Secondary flow 30% to 50% to a large UC • 9. Small town low commuting: primary flow 10% to 30% to a small UC • 9.0 No additional code • 10. Rural areas: primary flow to a tract outside a UA or UC • 10.0 No additional code • 10.1 Secondary flow 30% to 50% to a UA • 10.2 Secondary flow 30% to 50% to a large UC • 10.3 Secondary flow 30% to 50% to a small UC • Not coded: Census tract has zero population and no rural-urban identifier information
These codes identify influence areas of metropolitan, micropolitan, and small-town cores, similar in concept to the non-metropolitan adjacent codes found in the Rural-Urban Continuum Codes and Urban Influence Codes. These tracts can be consolidated into various subcategories (i.e., small/large metro areas). Tracts may be too granular for a national study (one cannot, for example, intersect HPMS data with tracts) but could still be used to identify which counties should be considered urban fringe. Given these characteristics, RUCA offers many advantages. Specifically, it provides sub-county classifications, considers functional relationships in addition to population and population density, and offers an adjustable taxonomy to fit unique needs.
USDA Business and Industry Loan Program The USDA established eligibility criteria for its Business and Industry Loan Program starting in 2002. Specifically, eligible rural areas are those outside of “places of 50,000 or more people and their adjacent and contiguous urbanized areas.” This scheme applies a combination of Census Places and Census Urban Areas. Census Places may be incorporated, in which case they conform
63
to Census-defined boundaries, or unincorporated areas, in which case they conform to locally determined boundaries.
As a simple binary system, this classification system offers limited value to this project. However, the definition of contiguous urban areas is distinct among the classification systems considered here, although it builds on the general U.S. Census Bureau classifications discussed above.
Federal Office of Rural Health Policy (FORHP) Classification
The Federal Office of Rural Health Policy (FORHP) in the Department of Health and Human Services (HHS) accepts all non-metropolitan counties as rural, but it also uses RUCA codes to identify additional rural areas. Specifically, tracts inside metropolitan counties with RUCA codes 4 through 10 are considered rural. Though this approach allows for a more nuanced definition of rural census tracts, RUCA codes are insufficient for certain very large tracts. For this reason, FORHP has also designated 132 large area census tracts with RUCA codes 2 or 3 as rural. These tracts are at least 400 square miles in area with a population density of no more than 35 people per square mile.
Like other binary systems, the disadvantage of this classification system is its lack of nuance among different types of rural areas. However, this system presents a useful option for overcoming measurement challenges associated with the Census and OMB definitions. Though the Census definition may classify suburban areas as rural, the OMB definition suffers from the opposite problem: classifying rural areas in metropolitan counties as urban. The FORHP system overcomes these challenges by sorting metropolitan counties into rural and non-rural categories according to commuter flows, so it offers the most nuanced binary system for classifying Census areas.
NCHRP 20-122: Rural Transportation Issues: Research Roadmap Report This project aims to help transportation agencies inform policy-driven investment decisions by identifying critical rural transportation issues that can be addressed by NCHRP and other research programs. Acknowledging the diverse nature of rural communities, one important part of this roadmap was stakeholder engagement in communities that are representative of the nation as a whole. To accomplish this, the report identifies six overlapping rural community types that were considered in the development of this report’s proposed classification system. The six types include the following:
• Resource Oriented • Exurban • Tourism Based • Frontier and Remote • Beyond the Lower 48 • Tribal Lands and Alaska Native Villages
64
NCHRP 582: Best Practices to Enhance the Transportation-Land Use Connection in the Rural U.S.
This study classifies rural counties into three types based on their growth rate and primary economic drivers. These categories include the following:
• Exurban/growing counties: located in proximity to urban areas • Destination counties: those with natural environments and amenities that tend to attract
tourists, second-home owners, and retirees • Production counties: those that depend on economic drivers that are declining such as
mining, agriculture, and manufacturing
As with the ERS County Typology Codes, this classification system offers the opportunity to consider counties according to economic characteristics rather than simply population and commuter behavior (although exurban counties are defined according to their proximity to urban areas). However, the ERS County Typology Codes offer a greater variety of production-dependent counties (e.g., mining, farming, and manufacturing). Combining and reconciling these classifications systems may offer an opportunity to take advantage of both systems.
Place Matters: Challenges and Opportunities in Four Rural Americas (University of New Hampshire)
This research included an extensive survey of rural residents and socioeconomic, demographic, and related factors to identify the following types of rural places:
• Amenity-rich • Declining resource-dependent • Chronically poor • Transitional, with both amenity-driven growth and resource-based decline
Five sets of issues were evaluated to provide a matrix for understanding each type of rural places. These five issues are economic changes, demographic changes, civil institutions, environment and natural resources, and infrastructure. The study identifies regions that meet the criteria for the four types of rural places and also defines counties within each of these regions for further analysis.
Transportation, Economic Development, and Quality of Life in Rural America (Rural Policy Research Institute)
This report identifies a complex classification system based on the following types of indicators:
• Demand indicators including growing population, agriculture dependence, tourism dependence, poverty rates, percentage of the population between the ages of five and 18, and the ratio of residents without automobiles.
• Supply indicators including spatial characteristics such as rural road miles as a percentage of total road miles, public transit availability, distance to commercial air service, and distance to a hospital.
65
• Outcome indicators including economic development, cost of living, access, safety, health, sustainability, and walkability. An example of a county-level outcome indicator would be the five-year average gross domestic product (GDP) growth rate.
Putting Smart Growth to Work in Rural Communities (International City/County Management Association) This study uses a qualitative categorization of rural communities based on their economic, geographic, and design characteristics. These community types include the following:
• Gateway communities (i.e., near high-amenity recreation areas) • Resource-dependent communities • Edge communities (i.e., located at the fringe of a metropolitan area but well- connected • Traditional Main Street (i.e., compact street networks and historic landmarks) • Second home and retirement communities
FHWA Planning for Transportation in Rural Areas This study defines rural as “non-metropolitan areas outside the limits of any incorporated or unincorporated city, town, or village,” and establishes the following categories:
• Basic rural (dispersed counties with few major populations centers) • Developed rural (dispersed counties with one or more populations centers with over
5,000 people) • Urban boundary rural (counties that border metropolitan areas)
USDOT Rural Opportunities to Use Transportation for Economic Success (ROUTES) Rural Opportunities to Use Transportation for Economic Success (ROUTES) is a recent initiative of the U.S. Department of Transportation to address economic and safety disparities in rural transportation. The program is guided by the ROUTES Council, which will oversee the ROUTES Infrastructure Management Team in carrying out the following activities:
• Collecting input from stakeholders on the benefits rural projects offer for safety and economic development, as well as the type and degree of assistance rural projects require.
• Providing user-friendly information to rural communities to assist them in understanding and applying for DOT discretionary grants.
• Improving DOT’s data-driven approaches to better assess needs for and benefits of rural transportation infrastructure projects.
Because ROUTES held its first meeting in November 2019, it has not yet adopted or developed a specific classification of rural areas. However, subsequent tasks in this project could involve using data or other information from ROUTES as the program grows.
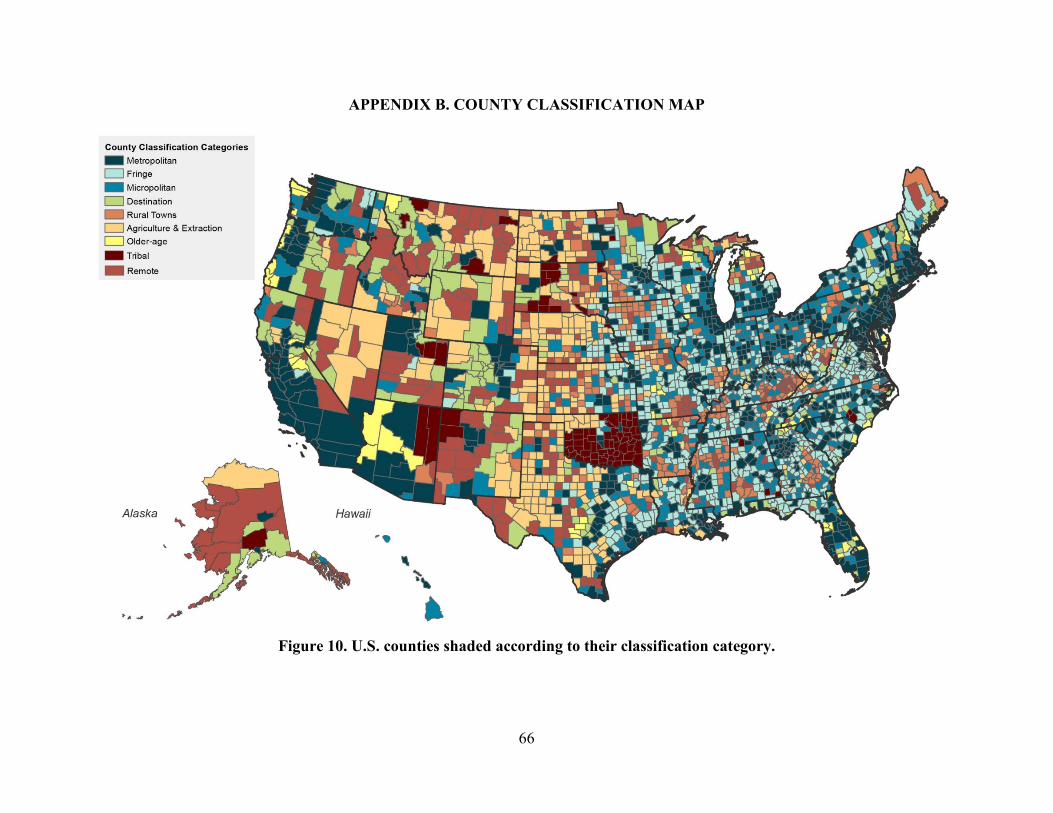
66
APPENDIX B. COUNTY CLASSIFICATION MAP
Figure 10. U.S. counties shaded according to their classification category.
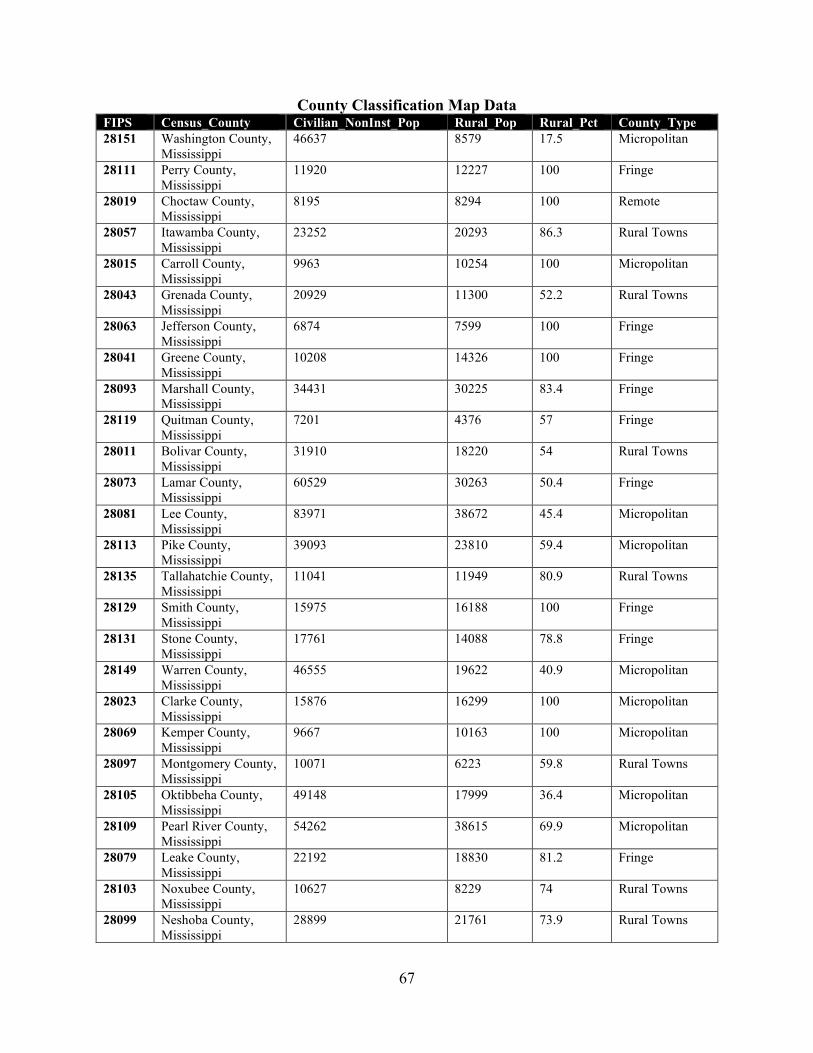
67
County Classification Map Data FIPS Census_County Civilian_NonInst_Pop Rural_Pop Rural_Pct County_Type 28151 Washington County,
Mississippi 46637 8579 17.5 Micropolitan
28111 Perry County, Mississippi
11920 12227 100 Fringe
28019 Choctaw County, Mississippi
8195 8294 100 Remote
28057 Itawamba County, Mississippi
23252 20293 86.3 Rural Towns
28015 Carroll County, Mississippi
9963 10254 100 Micropolitan
28043 Grenada County, Mississippi
20929 11300 52.2 Rural Towns
28063 Jefferson County, Mississippi
6874 7599 100 Fringe
28041 Greene County, Mississippi
10208 14326 100 Fringe
28093 Marshall County, Mississippi
34431 30225 83.4 Fringe
28119 Quitman County, Mississippi
7201 4376 57 Fringe
28011 Bolivar County, Mississippi
31910 18220 54 Rural Towns
28073 Lamar County, Mississippi
60529 30263 50.4 Fringe
28081 Lee County, Mississippi
83971 38672 45.4 Micropolitan
28113 Pike County, Mississippi
39093 23810 59.4 Micropolitan
28135 Tallahatchie County, Mississippi
11041 11949 80.9 Rural Towns
28129 Smith County, Mississippi
15975 16188 100 Fringe
28131 Stone County, Mississippi
17761 14088 78.8 Fringe
28149 Warren County, Mississippi
46555 19622 40.9 Micropolitan
28023 Clarke County, Mississippi
15876 16299 100 Micropolitan
28069 Kemper County, Mississippi
9667 10163 100 Micropolitan
28097 Montgomery County, Mississippi
10071 6223 59.8 Rural Towns
28105 Oktibbeha County, Mississippi
49148 17999 36.4 Micropolitan
28109 Pearl River County, Mississippi
54262 38615 69.9 Micropolitan
28079 Leake County, Mississippi
22192 18830 81.2 Fringe
28103 Noxubee County, Mississippi
10627 8229 74 Rural Towns
28099 Neshoba County, Mississippi
28899 21761 73.9 Rural Towns
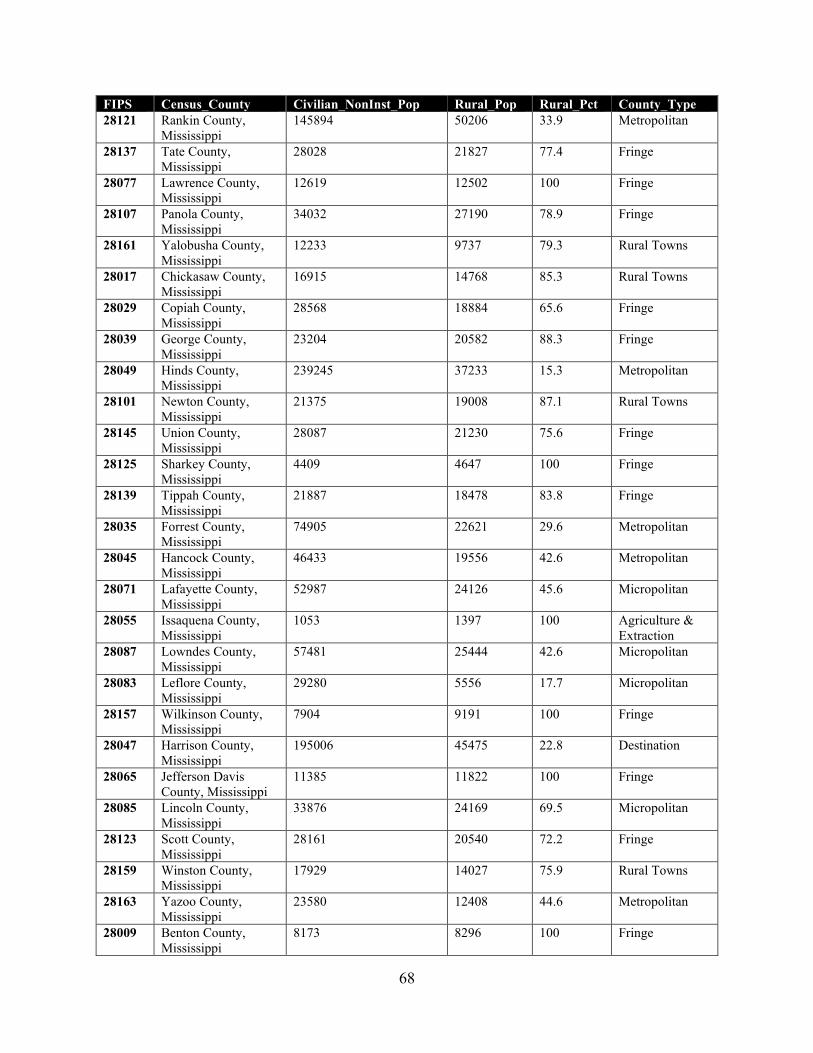
68
FIPS Census_County Civilian_NonInst_Pop Rural_Pop Rural_Pct County_Type 28121 Rankin County,
Mississippi 145894 50206 33.9 Metropolitan
28137 Tate County, Mississippi
28028 21827 77.4 Fringe
28077 Lawrence County, Mississippi
12619 12502 100 Fringe
28107 Panola County, Mississippi
34032 27190 78.9 Fringe
28161 Yalobusha County, Mississippi
12233 9737 79.3 Rural Towns
28017 Chickasaw County, Mississippi
16915 14768 85.3 Rural Towns
28029 Copiah County, Mississippi
28568 18884 65.6 Fringe
28039 George County, Mississippi
23204 20582 88.3 Fringe
28049 Hinds County, Mississippi
239245 37233 15.3 Metropolitan
28101 Newton County, Mississippi
21375 19008 87.1 Rural Towns
28145 Union County, Mississippi
28087 21230 75.6 Fringe
28125 Sharkey County, Mississippi
4409 4647 100 Fringe
28139 Tippah County, Mississippi
21887 18478 83.8 Fringe
28035 Forrest County, Mississippi
74905 22621 29.6 Metropolitan
28045 Hancock County, Mississippi
46433 19556 42.6 Metropolitan
28071 Lafayette County, Mississippi
52987 24126 45.6 Micropolitan
28055 Issaquena County, Mississippi
1053 1397 100 Agriculture & Extraction
28087 Lowndes County, Mississippi
57481 25444 42.6 Micropolitan
28083 Leflore County, Mississippi
29280 5556 17.7 Micropolitan
28157 Wilkinson County, Mississippi
7904 9191 100 Fringe
28047 Harrison County, Mississippi
195006 45475 22.8 Destination
28065 Jefferson Davis County, Mississippi
11385 11822 100 Fringe
28085 Lincoln County, Mississippi
33876 24169 69.5 Micropolitan
28123 Scott County, Mississippi
28161 20540 72.2 Fringe
28159 Winston County, Mississippi
17929 14027 75.9 Rural Towns
28163 Yazoo County, Mississippi
23580 12408 44.6 Metropolitan
28009 Benton County, Mississippi
8173 8296 100 Fringe
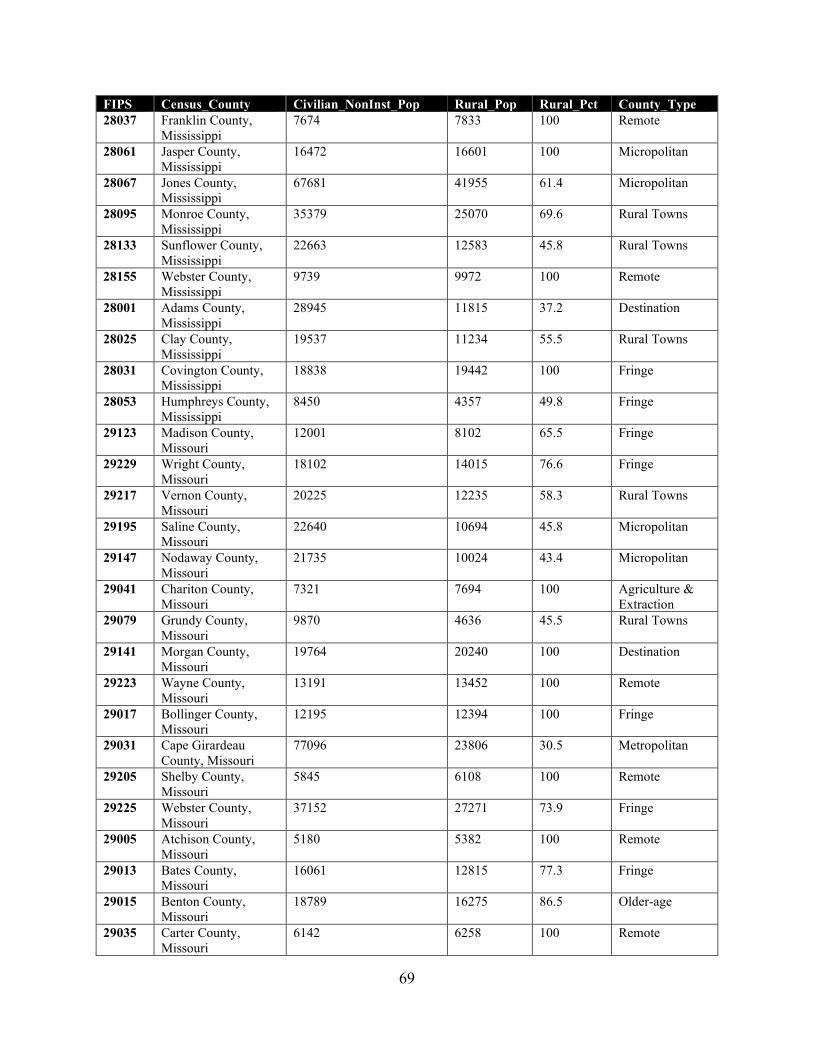
69
FIPS Census_County Civilian_NonInst_Pop Rural_Pop Rural_Pct County_Type 28037 Franklin County,
Mississippi 7674 7833 100 Remote
28061 Jasper County, Mississippi
16472 16601 100 Micropolitan
28067 Jones County, Mississippi
67681 41955 61.4 Micropolitan
28095 Monroe County, Mississippi
35379 25070 69.6 Rural Towns
28133 Sunflower County, Mississippi
22663 12583 45.8 Rural Towns
28155 Webster County, Mississippi
9739 9972 100 Remote
28001 Adams County, Mississippi
28945 11815 37.2 Destination
28025 Clay County, Mississippi
19537 11234 55.5 Rural Towns
28031 Covington County, Mississippi
18838 19442 100 Fringe
28053 Humphreys County, Mississippi
8450 4357 49.8 Fringe
29123 Madison County, Missouri
12001 8102 65.5 Fringe
29229 Wright County, Missouri
18102 14015 76.6 Fringe
29217 Vernon County, Missouri
20225 12235 58.3 Rural Towns
29195 Saline County, Missouri
22640 10694 45.8 Micropolitan
29147 Nodaway County, Missouri
21735 10024 43.4 Micropolitan
29041 Chariton County, Missouri
7321 7694 100 Agriculture & Extraction
29079 Grundy County, Missouri
9870 4636 45.5 Rural Towns
29141 Morgan County, Missouri
19764 20240 100 Destination
29223 Wayne County, Missouri
13191 13452 100 Remote
29017 Bollinger County, Missouri
12195 12394 100 Fringe
29031 Cape Girardeau County, Missouri
77096 23806 30.5 Metropolitan
29205 Shelby County, Missouri
5845 6108 100 Remote
29225 Webster County, Missouri
37152 27271 73.9 Fringe
29005 Atchison County, Missouri
5180 5382 100 Remote
29013 Bates County, Missouri
16061 12815 77.3 Fringe
29015 Benton County, Missouri
18789 16275 86.5 Older-age
29035 Carter County, Missouri
6142 6258 100 Remote
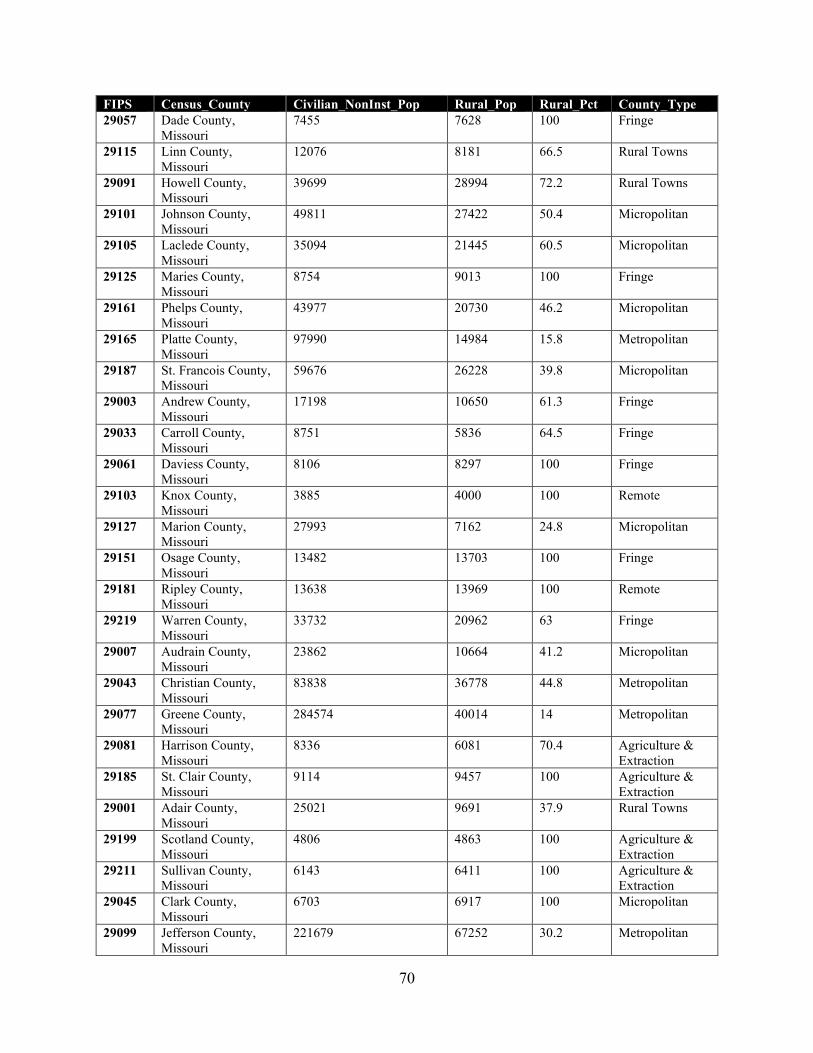
70
FIPS Census_County Civilian_NonInst_Pop Rural_Pop Rural_Pct County_Type 29057 Dade County,
Missouri 7455 7628 100 Fringe
29115 Linn County, Missouri
12076 8181 66.5 Rural Towns
29091 Howell County, Missouri
39699 28994 72.2 Rural Towns
29101 Johnson County, Missouri
49811 27422 50.4 Micropolitan
29105 Laclede County, Missouri
35094 21445 60.5 Micropolitan
29125 Maries County, Missouri
8754 9013 100 Fringe
29161 Phelps County, Missouri
43977 20730 46.2 Micropolitan
29165 Platte County, Missouri
97990 14984 15.8 Metropolitan
29187 St. Francois County, Missouri
59676 26228 39.8 Micropolitan
29003 Andrew County, Missouri
17198 10650 61.3 Fringe
29033 Carroll County, Missouri
8751 5836 64.5 Fringe
29061 Daviess County, Missouri
8106 8297 100 Fringe
29103 Knox County, Missouri
3885 4000 100 Remote
29127 Marion County, Missouri
27993 7162 24.8 Micropolitan
29151 Osage County, Missouri
13482 13703 100 Fringe
29181 Ripley County, Missouri
13638 13969 100 Remote
29219 Warren County, Missouri
33732 20962 63 Fringe
29007 Audrain County, Missouri
23862 10664 41.2 Micropolitan
29043 Christian County, Missouri
83838 36778 44.8 Metropolitan
29077 Greene County, Missouri
284574 40014 14 Metropolitan
29081 Harrison County, Missouri
8336 6081 70.4 Agriculture & Extraction
29185 St. Clair County, Missouri
9114 9457 100 Agriculture & Extraction
29001 Adair County, Missouri
25021 9691 37.9 Rural Towns
29199 Scotland County, Missouri
4806 4863 100 Agriculture & Extraction
29211 Sullivan County, Missouri
6143 6411 100 Agriculture & Extraction
29045 Clark County, Missouri
6703 6917 100 Micropolitan
29099 Jefferson County, Missouri
221679 67252 30.2 Metropolitan
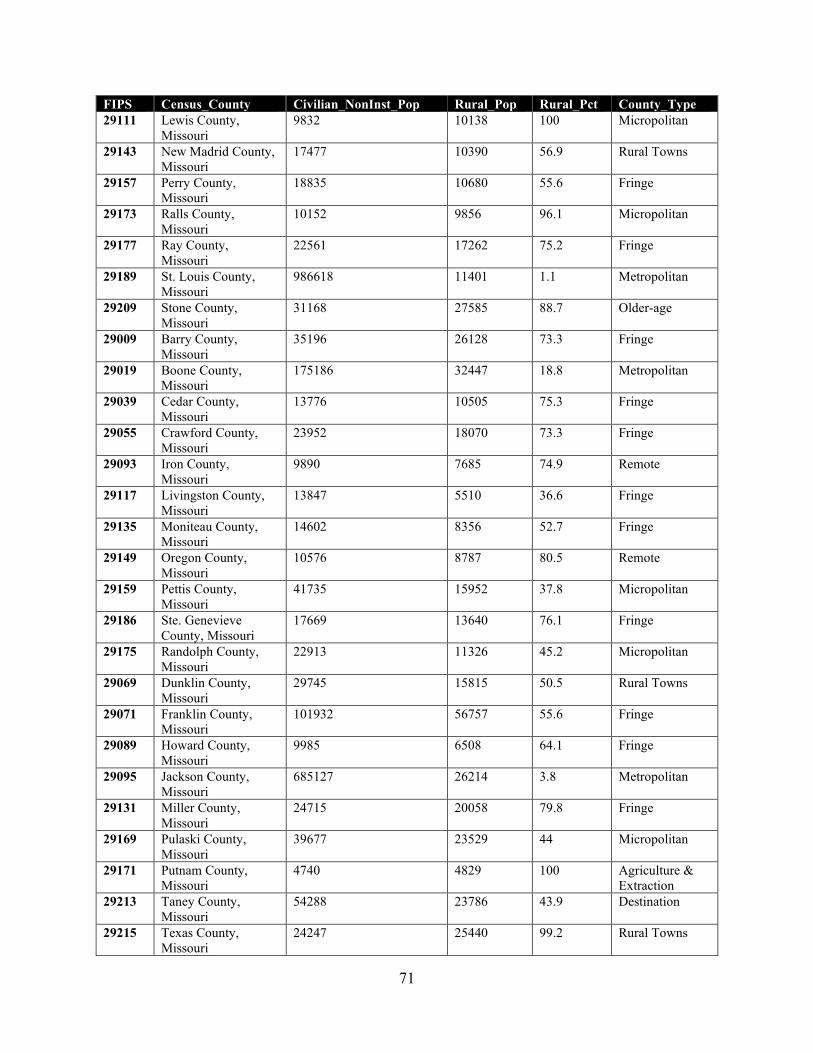
71
FIPS Census_County Civilian_NonInst_Pop Rural_Pop Rural_Pct County_Type 29111 Lewis County,
Missouri 9832 10138 100 Micropolitan
29143 New Madrid County, Missouri
17477 10390 56.9 Rural Towns
29157 Perry County, Missouri
18835 10680 55.6 Fringe
29173 Ralls County, Missouri
10152 9856 96.1 Micropolitan
29177 Ray County, Missouri
22561 17262 75.2 Fringe
29189 St. Louis County, Missouri
986618 11401 1.1 Metropolitan
29209 Stone County, Missouri
31168 27585 88.7 Older-age
29009 Barry County, Missouri
35196 26128 73.3 Fringe
29019 Boone County, Missouri
175186 32447 18.8 Metropolitan
29039 Cedar County, Missouri
13776 10505 75.3 Fringe
29055 Crawford County, Missouri
23952 18070 73.3 Fringe
29093 Iron County, Missouri
9890 7685 74.9 Remote
29117 Livingston County, Missouri
13847 5510 36.6 Fringe
29135 Moniteau County, Missouri
14602 8356 52.7 Fringe
29149 Oregon County, Missouri
10576 8787 80.5 Remote
29159 Pettis County, Missouri
41735 15952 37.8 Micropolitan
29186 Ste. Genevieve County, Missouri
17669 13640 76.1 Fringe
29175 Randolph County, Missouri
22913 11326 45.2 Micropolitan
29069 Dunklin County, Missouri
29745 15815 50.5 Rural Towns
29071 Franklin County, Missouri
101932 56757 55.6 Fringe
29089 Howard County, Missouri
9985 6508 64.1 Fringe
29095 Jackson County, Missouri
685127 26214 3.8 Metropolitan
29131 Miller County, Missouri
24715 20058 79.8 Fringe
29169 Pulaski County, Missouri
39677 23529 44 Micropolitan
29171 Putnam County, Missouri
4740 4829 100 Agriculture & Extraction
29213 Taney County, Missouri
54288 23786 43.9 Destination
29215 Texas County, Missouri
24247 25440 99.2 Rural Towns
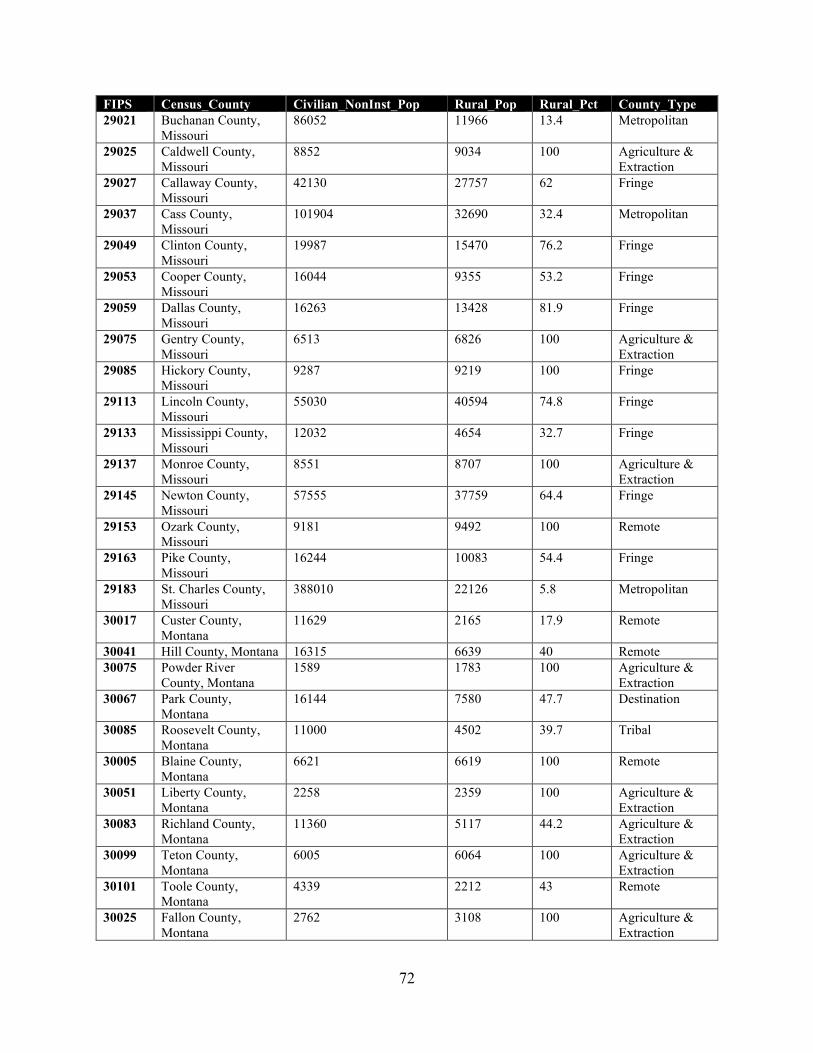
72
FIPS Census_County Civilian_NonInst_Pop Rural_Pop Rural_Pct County_Type 29021 Buchanan County,
Missouri 86052 11966 13.4 Metropolitan
29025 Caldwell County, Missouri
8852 9034 100 Agriculture & Extraction
29027 Callaway County, Missouri
42130 27757 62 Fringe
29037 Cass County, Missouri
101904 32690 32.4 Metropolitan
29049 Clinton County, Missouri
19987 15470 76.2 Fringe
29053 Cooper County, Missouri
16044 9355 53.2 Fringe
29059 Dallas County, Missouri
16263 13428 81.9 Fringe
29075 Gentry County, Missouri
6513 6826 100 Agriculture & Extraction
29085 Hickory County, Missouri
9287 9219 100 Fringe
29113 Lincoln County, Missouri
55030 40594 74.8 Fringe
29133 Mississippi County, Missouri
12032 4654 32.7 Fringe
29137 Monroe County, Missouri
8551 8707 100 Agriculture & Extraction
29145 Newton County, Missouri
57555 37759 64.4 Fringe
29153 Ozark County, Missouri
9181 9492 100 Remote
29163 Pike County, Missouri
16244 10083 54.4 Fringe
29183 St. Charles County, Missouri
388010 22126 5.8 Metropolitan
30017 Custer County, Montana
11629 2165 17.9 Remote
30041 Hill County, Montana 16315 6639 40 Remote 30075 Powder River
County, Montana 1589 1783 100 Agriculture &
Extraction 30067 Park County,
Montana 16144 7580 47.7 Destination
30085 Roosevelt County, Montana
11000 4502 39.7 Tribal
30005 Blaine County, Montana
6621 6619 100 Remote
30051 Liberty County, Montana
2258 2359 100 Agriculture & Extraction
30083 Richland County, Montana
11360 5117 44.2 Agriculture & Extraction
30099 Teton County, Montana
6005 6064 100 Agriculture & Extraction
30101 Toole County, Montana
4339 2212 43 Remote
30025 Fallon County, Montana
2762 3108 100 Agriculture & Extraction
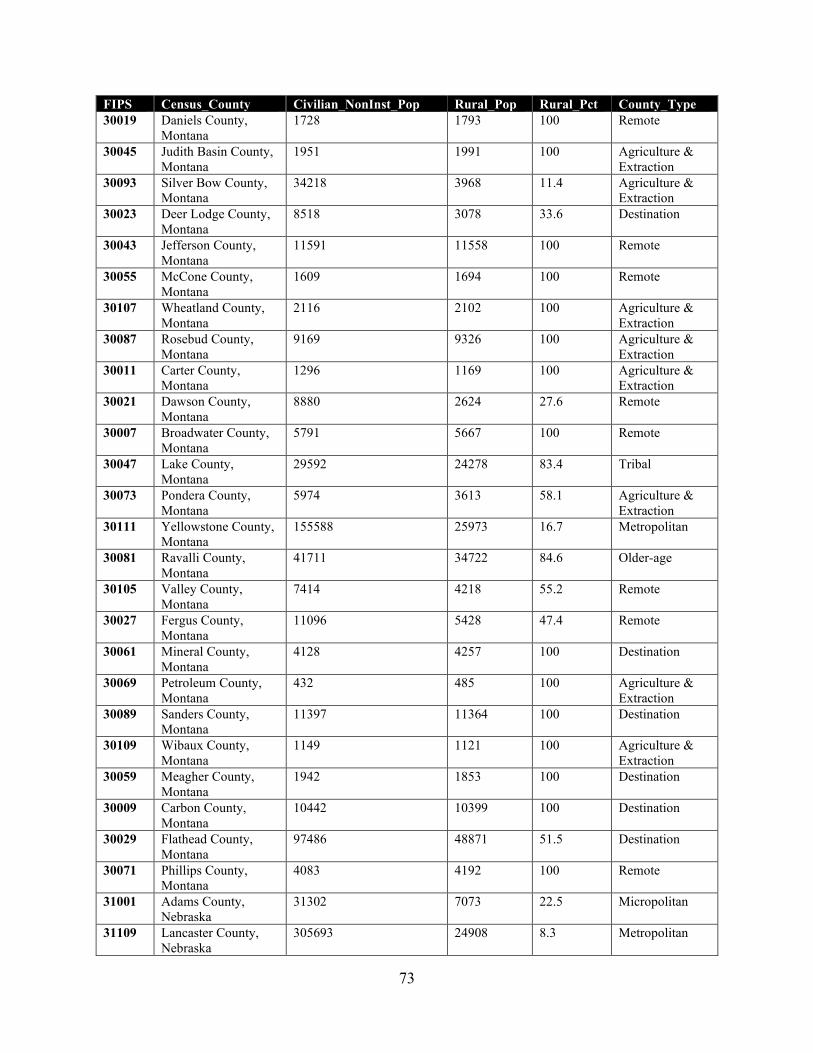
73
FIPS Census_County Civilian_NonInst_Pop Rural_Pop Rural_Pct County_Type 30019 Daniels County,
Montana 1728 1793 100 Remote
30045 Judith Basin County, Montana
1951 1991 100 Agriculture & Extraction
30093 Silver Bow County, Montana
34218 3968 11.4 Agriculture & Extraction
30023 Deer Lodge County, Montana
8518 3078 33.6 Destination
30043 Jefferson County, Montana
11591 11558 100 Remote
30055 McCone County, Montana
1609 1694 100 Remote
30107 Wheatland County, Montana
2116 2102 100 Agriculture & Extraction
30087 Rosebud County, Montana
9169 9326 100 Agriculture & Extraction
30011 Carter County, Montana
1296 1169 100 Agriculture & Extraction
30021 Dawson County, Montana
8880 2624 27.6 Remote
30007 Broadwater County, Montana
5791 5667 100 Remote
30047 Lake County, Montana
29592 24278 83.4 Tribal
30073 Pondera County, Montana
5974 3613 58.1 Agriculture & Extraction
30111 Yellowstone County, Montana
155588 25973 16.7 Metropolitan
30081 Ravalli County, Montana
41711 34722 84.6 Older-age
30105 Valley County, Montana
7414 4218 55.2 Remote
30027 Fergus County, Montana
11096 5428 47.4 Remote
30061 Mineral County, Montana
4128 4257 100 Destination
30069 Petroleum County, Montana
432 485 100 Agriculture & Extraction
30089 Sanders County, Montana
11397 11364 100 Destination
30109 Wibaux County, Montana
1149 1121 100 Agriculture & Extraction
30059 Meagher County, Montana
1942 1853 100 Destination
30009 Carbon County, Montana
10442 10399 100 Destination
30029 Flathead County, Montana
97486 48871 51.5 Destination
30071 Phillips County, Montana
4083 4192 100 Remote
31001 Adams County, Nebraska
31302 7073 22.5 Micropolitan
31109 Lancaster County, Nebraska
305693 24908 8.3 Metropolitan
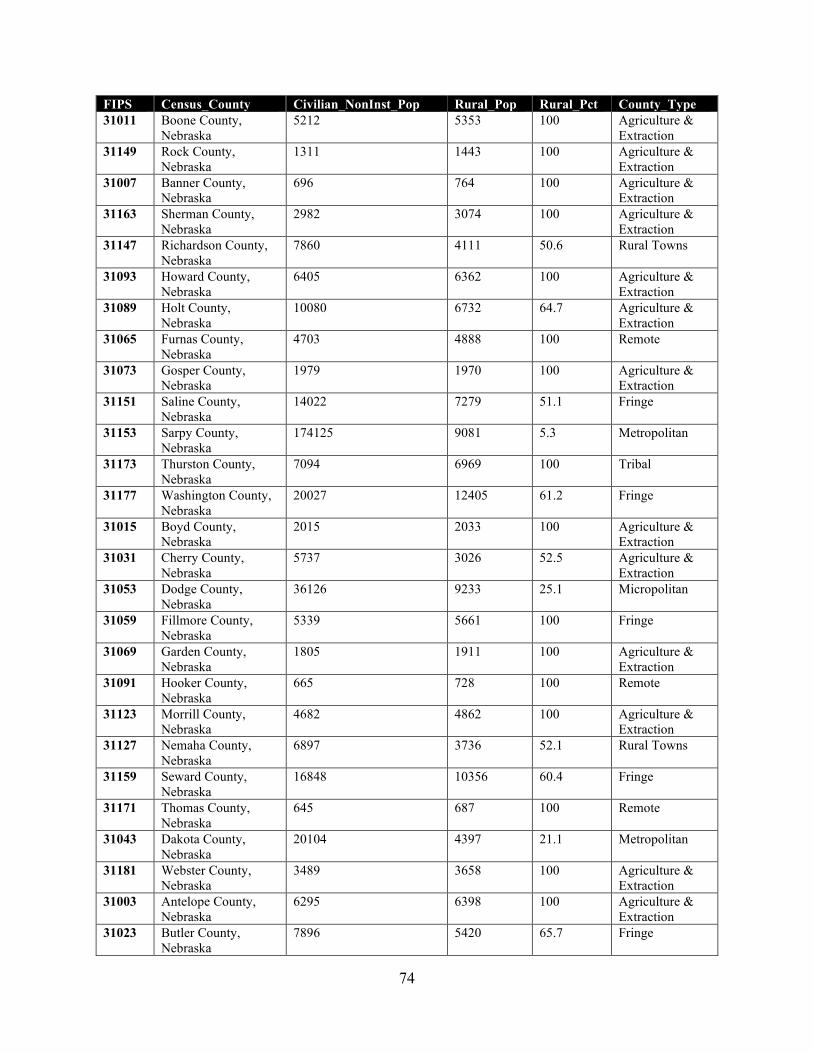
74
FIPS Census_County Civilian_NonInst_Pop Rural_Pop Rural_Pct County_Type 31011 Boone County,
Nebraska 5212 5353 100 Agriculture &
Extraction 31149 Rock County,
Nebraska 1311 1443 100 Agriculture &
Extraction 31007 Banner County,
Nebraska 696 764 100 Agriculture &
Extraction 31163 Sherman County,
Nebraska 2982 3074 100 Agriculture &
Extraction 31147 Richardson County,
Nebraska 7860 4111 50.6 Rural Towns
31093 Howard County, Nebraska
6405 6362 100 Agriculture & Extraction
31089 Holt County, Nebraska
10080 6732 64.7 Agriculture & Extraction
31065 Furnas County, Nebraska
4703 4888 100 Remote
31073 Gosper County, Nebraska
1979 1970 100 Agriculture & Extraction
31151 Saline County, Nebraska
14022 7279 51.1 Fringe
31153 Sarpy County, Nebraska
174125 9081 5.3 Metropolitan
31173 Thurston County, Nebraska
7094 6969 100 Tribal
31177 Washington County, Nebraska
20027 12405 61.2 Fringe
31015 Boyd County, Nebraska
2015 2033 100 Agriculture & Extraction
31031 Cherry County, Nebraska
5737 3026 52.5 Agriculture & Extraction
31053 Dodge County, Nebraska
36126 9233 25.1 Micropolitan
31059 Fillmore County, Nebraska
5339 5661 100 Fringe
31069 Garden County, Nebraska
1805 1911 100 Agriculture & Extraction
31091 Hooker County, Nebraska
665 728 100 Remote
31123 Morrill County, Nebraska
4682 4862 100 Agriculture & Extraction
31127 Nemaha County, Nebraska
6897 3736 52.1 Rural Towns
31159 Seward County, Nebraska
16848 10356 60.4 Fringe
31171 Thomas County, Nebraska
645 687 100 Remote
31043 Dakota County, Nebraska
20104 4397 21.1 Metropolitan
31181 Webster County, Nebraska
3489 3658 100 Agriculture & Extraction
31003 Antelope County, Nebraska
6295 6398 100 Agriculture & Extraction
31023 Butler County, Nebraska
7896 5420 65.7 Fringe
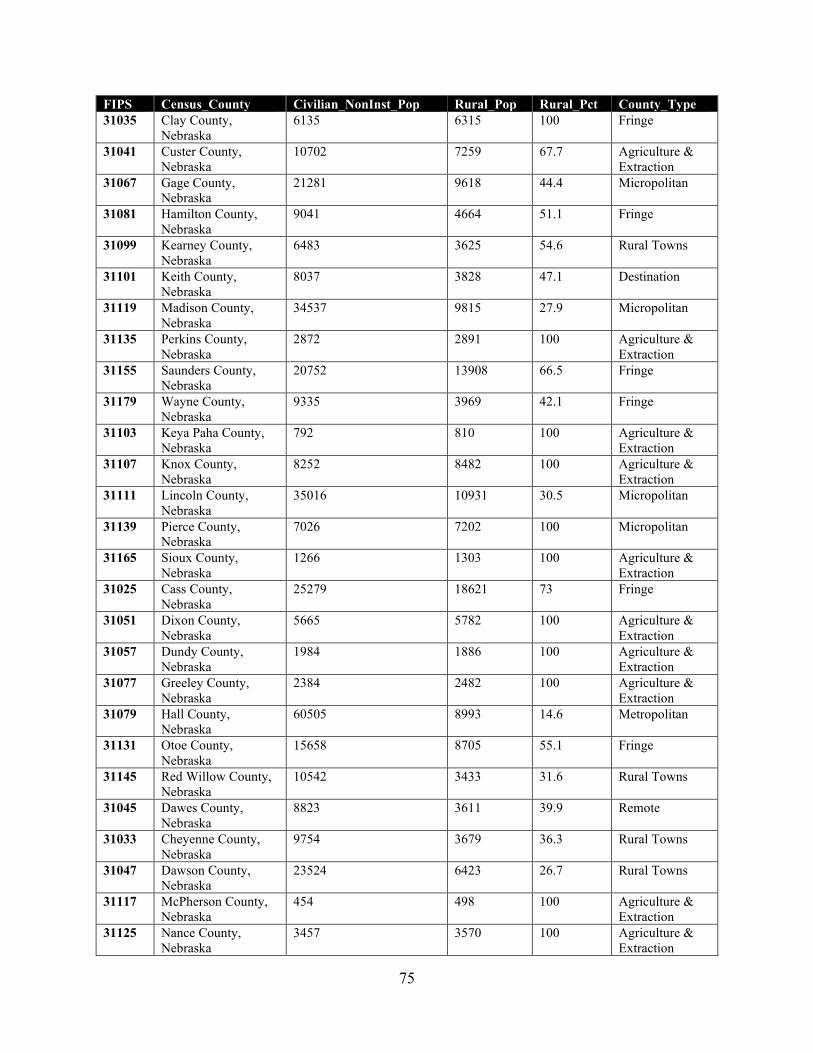
75
FIPS Census_County Civilian_NonInst_Pop Rural_Pop Rural_Pct County_Type 31035 Clay County,
Nebraska 6135 6315 100 Fringe
31041 Custer County, Nebraska
10702 7259 67.7 Agriculture & Extraction
31067 Gage County, Nebraska
21281 9618 44.4 Micropolitan
31081 Hamilton County, Nebraska
9041 4664 51.1 Fringe
31099 Kearney County, Nebraska
6483 3625 54.6 Rural Towns
31101 Keith County, Nebraska
8037 3828 47.1 Destination
31119 Madison County, Nebraska
34537 9815 27.9 Micropolitan
31135 Perkins County, Nebraska
2872 2891 100 Agriculture & Extraction
31155 Saunders County, Nebraska
20752 13908 66.5 Fringe
31179 Wayne County, Nebraska
9335 3969 42.1 Fringe
31103 Keya Paha County, Nebraska
792 810 100 Agriculture & Extraction
31107 Knox County, Nebraska
8252 8482 100 Agriculture & Extraction
31111 Lincoln County, Nebraska
35016 10931 30.5 Micropolitan
31139 Pierce County, Nebraska
7026 7202 100 Micropolitan
31165 Sioux County, Nebraska
1266 1303 100 Agriculture & Extraction
31025 Cass County, Nebraska
25279 18621 73 Fringe
31051 Dixon County, Nebraska
5665 5782 100 Agriculture & Extraction
31057 Dundy County, Nebraska
1984 1886 100 Agriculture & Extraction
31077 Greeley County, Nebraska
2384 2482 100 Agriculture & Extraction
31079 Hall County, Nebraska
60505 8993 14.6 Metropolitan
31131 Otoe County, Nebraska
15658 8705 55.1 Fringe
31145 Red Willow County, Nebraska
10542 3433 31.6 Rural Towns
31045 Dawes County, Nebraska
8823 3611 39.9 Remote
31033 Cheyenne County, Nebraska
9754 3679 36.3 Rural Towns
31047 Dawson County, Nebraska
23524 6423 26.7 Rural Towns
31117 McPherson County, Nebraska
454 498 100 Agriculture & Extraction
31125 Nance County, Nebraska
3457 3570 100 Agriculture & Extraction
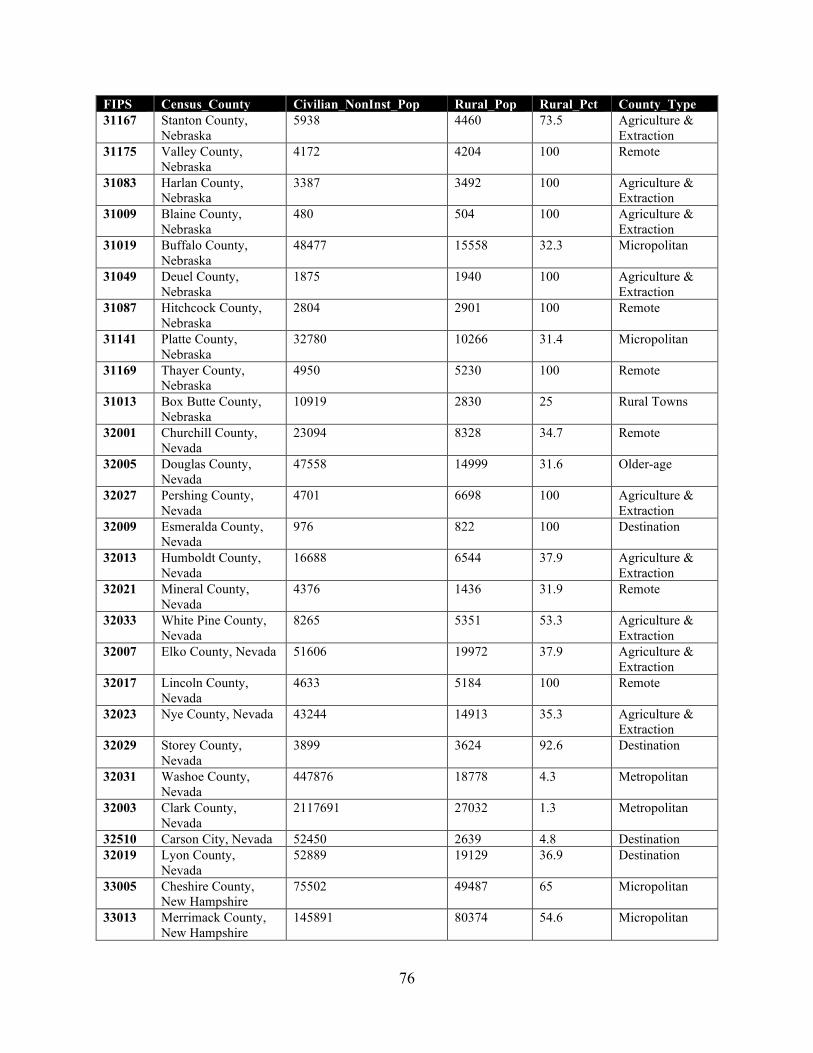
76
FIPS Census_County Civilian_NonInst_Pop Rural_Pop Rural_Pct County_Type 31167 Stanton County,
Nebraska 5938 4460 73.5 Agriculture &
Extraction 31175 Valley County,
Nebraska 4172 4204 100 Remote
31083 Harlan County, Nebraska
3387 3492 100 Agriculture & Extraction
31009 Blaine County, Nebraska
480 504 100 Agriculture & Extraction
31019 Buffalo County, Nebraska
48477 15558 32.3 Micropolitan
31049 Deuel County, Nebraska
1875 1940 100 Agriculture & Extraction
31087 Hitchcock County, Nebraska
2804 2901 100 Remote
31141 Platte County, Nebraska
32780 10266 31.4 Micropolitan
31169 Thayer County, Nebraska
4950 5230 100 Remote
31013 Box Butte County, Nebraska
10919 2830 25 Rural Towns
32001 Churchill County, Nevada
23094 8328 34.7 Remote
32005 Douglas County, Nevada
47558 14999 31.6 Older-age
32027 Pershing County, Nevada
4701 6698 100 Agriculture & Extraction
32009 Esmeralda County, Nevada
976 822 100 Destination
32013 Humboldt County, Nevada
16688 6544 37.9 Agriculture & Extraction
32021 Mineral County, Nevada
4376 1436 31.9 Remote
32033 White Pine County, Nevada
8265 5351 53.3 Agriculture & Extraction
32007 Elko County, Nevada 51606 19972 37.9 Agriculture & Extraction
32017 Lincoln County, Nevada
4633 5184 100 Remote
32023 Nye County, Nevada 43244 14913 35.3 Agriculture & Extraction
32029 Storey County, Nevada
3899 3624 92.6 Destination
32031 Washoe County, Nevada
447876 18778 4.3 Metropolitan
32003 Clark County, Nevada
2117691 27032 1.3 Metropolitan
32510 Carson City, Nevada 52450 2639 4.8 Destination 32019 Lyon County,
Nevada 52889 19129 36.9 Destination
33005 Cheshire County, New Hampshire
75502 49487 65 Micropolitan
33013 Merrimack County, New Hampshire
145891 80374 54.6 Micropolitan
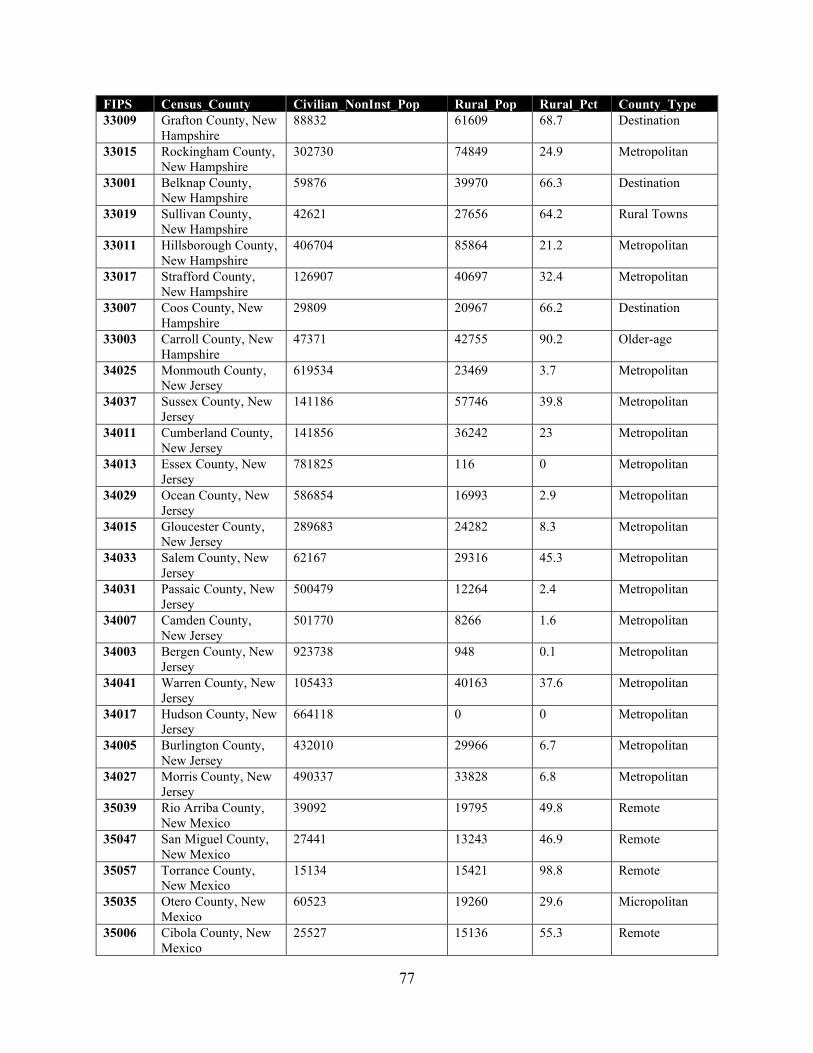
77
FIPS Census_County Civilian_NonInst_Pop Rural_Pop Rural_Pct County_Type 33009 Grafton County, New
Hampshire 88832 61609 68.7 Destination
33015 Rockingham County, New Hampshire
302730 74849 24.9 Metropolitan
33001 Belknap County, New Hampshire
59876 39970 66.3 Destination
33019 Sullivan County, New Hampshire
42621 27656 64.2 Rural Towns
33011 Hillsborough County, New Hampshire
406704 85864 21.2 Metropolitan
33017 Strafford County, New Hampshire
126907 40697 32.4 Metropolitan
33007 Coos County, New Hampshire
29809 20967 66.2 Destination
33003 Carroll County, New Hampshire
47371 42755 90.2 Older-age
34025 Monmouth County, New Jersey
619534 23469 3.7 Metropolitan
34037 Sussex County, New Jersey
141186 57746 39.8 Metropolitan
34011 Cumberland County, New Jersey
141856 36242 23 Metropolitan
34013 Essex County, New Jersey
781825 116 0 Metropolitan
34029 Ocean County, New Jersey
586854 16993 2.9 Metropolitan
34015 Gloucester County, New Jersey
289683 24282 8.3 Metropolitan
34033 Salem County, New Jersey
62167 29316 45.3 Metropolitan
34031 Passaic County, New Jersey
500479 12264 2.4 Metropolitan
34007 Camden County, New Jersey
501770 8266 1.6 Metropolitan
34003 Bergen County, New Jersey
923738 948 0.1 Metropolitan
34041 Warren County, New Jersey
105433 40163 37.6 Metropolitan
34017 Hudson County, New Jersey
664118 0 0 Metropolitan
34005 Burlington County, New Jersey
432010 29966 6.7 Metropolitan
34027 Morris County, New Jersey
490337 33828 6.8 Metropolitan
35039 Rio Arriba County, New Mexico
39092 19795 49.8 Remote
35047 San Miguel County, New Mexico
27441 13243 46.9 Remote
35057 Torrance County, New Mexico
15134 15421 98.8 Remote
35035 Otero County, New Mexico
60523 19260 29.6 Micropolitan
35006 Cibola County, New Mexico
25527 15136 55.3 Remote
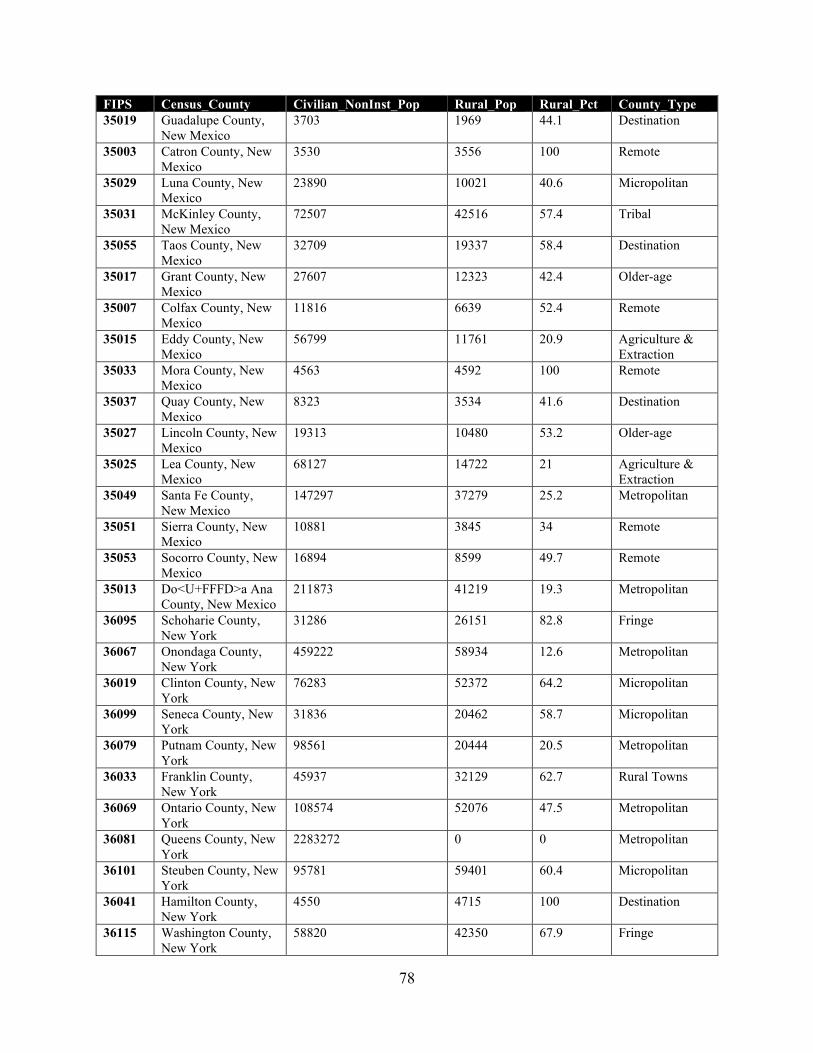
78
FIPS Census_County Civilian_NonInst_Pop Rural_Pop Rural_Pct County_Type 35019 Guadalupe County,
New Mexico 3703 1969 44.1 Destination
35003 Catron County, New Mexico
3530 3556 100 Remote
35029 Luna County, New Mexico
23890 10021 40.6 Micropolitan
35031 McKinley County, New Mexico
72507 42516 57.4 Tribal
35055 Taos County, New Mexico
32709 19337 58.4 Destination
35017 Grant County, New Mexico
27607 12323 42.4 Older-age
35007 Colfax County, New Mexico
11816 6639 52.4 Remote
35015 Eddy County, New Mexico
56799 11761 20.9 Agriculture & Extraction
35033 Mora County, New Mexico
4563 4592 100 Remote
35037 Quay County, New Mexico
8323 3534 41.6 Destination
35027 Lincoln County, New Mexico
19313 10480 53.2 Older-age
35025 Lea County, New Mexico
68127 14722 21 Agriculture & Extraction
35049 Santa Fe County, New Mexico
147297 37279 25.2 Metropolitan
35051 Sierra County, New Mexico
10881 3845 34 Remote
35053 Socorro County, New Mexico
16894 8599 49.7 Remote
35013 Do<U+FFFD>a Ana County, New Mexico
211873 41219 19.3 Metropolitan
36095 Schoharie County, New York
31286 26151 82.8 Fringe
36067 Onondaga County, New York
459222 58934 12.6 Metropolitan
36019 Clinton County, New York
76283 52372 64.2 Micropolitan
36099 Seneca County, New York
31836 20462 58.7 Micropolitan
36079 Putnam County, New York
98561 20444 20.5 Metropolitan
36033 Franklin County, New York
45937 32129 62.7 Rural Towns
36069 Ontario County, New York
108574 52076 47.5 Metropolitan
36081 Queens County, New York
2283272 0 0 Metropolitan
36101 Steuben County, New York
95781 59401 60.4 Micropolitan
36041 Hamilton County, New York
4550 4715 100 Destination
36115 Washington County, New York
58820 42350 67.9 Fringe
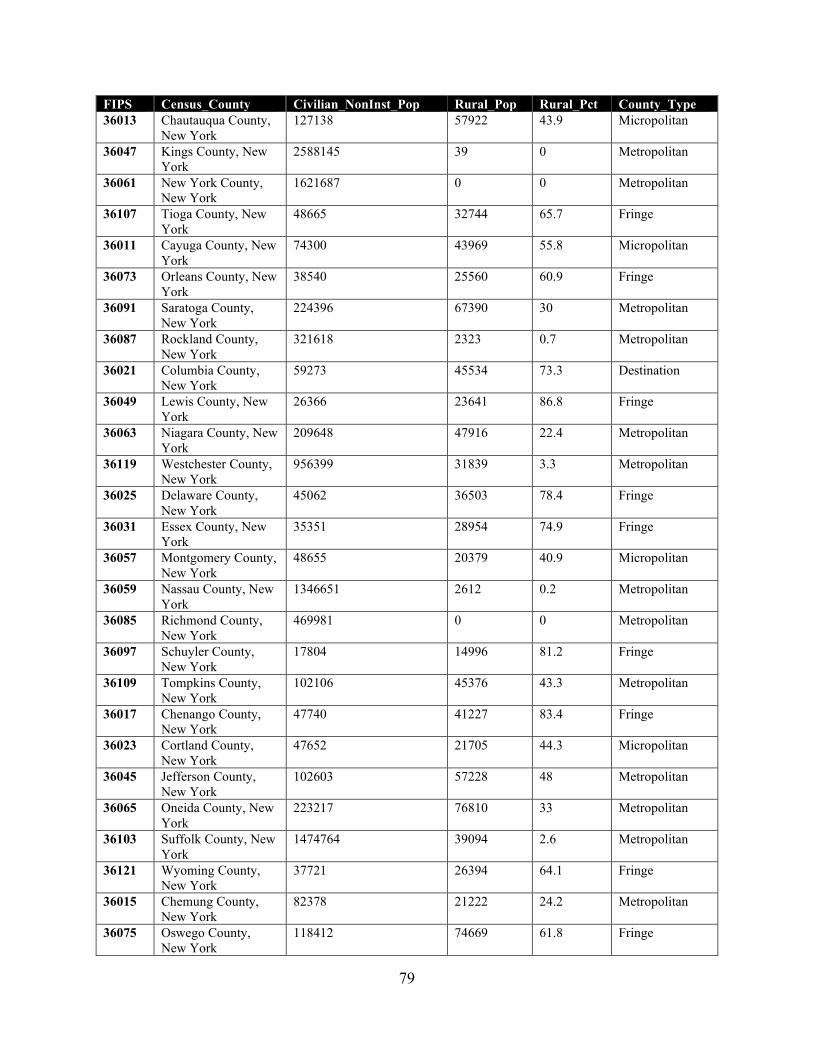
79
FIPS Census_County Civilian_NonInst_Pop Rural_Pop Rural_Pct County_Type 36013 Chautauqua County,
New York 127138 57922 43.9 Micropolitan
36047 Kings County, New York
2588145 39 0 Metropolitan
36061 New York County, New York
1621687 0 0 Metropolitan
36107 Tioga County, New York
48665 32744 65.7 Fringe
36011 Cayuga County, New York
74300 43969 55.8 Micropolitan
36073 Orleans County, New York
38540 25560 60.9 Fringe
36091 Saratoga County, New York
224396 67390 30 Metropolitan
36087 Rockland County, New York
321618 2323 0.7 Metropolitan
36021 Columbia County, New York
59273 45534 73.3 Destination
36049 Lewis County, New York
26366 23641 86.8 Fringe
36063 Niagara County, New York
209648 47916 22.4 Metropolitan
36119 Westchester County, New York
956399 31839 3.3 Metropolitan
36025 Delaware County, New York
45062 36503 78.4 Fringe
36031 Essex County, New York
35351 28954 74.9 Fringe
36057 Montgomery County, New York
48655 20379 40.9 Micropolitan
36059 Nassau County, New York
1346651 2612 0.2 Metropolitan
36085 Richmond County, New York
469981 0 0 Metropolitan
36097 Schuyler County, New York
17804 14996 81.2 Fringe
36109 Tompkins County, New York
102106 45376 43.3 Metropolitan
36017 Chenango County, New York
47740 41227 83.4 Fringe
36023 Cortland County, New York
47652 21705 44.3 Micropolitan
36045 Jefferson County, New York
102603 57228 48 Metropolitan
36065 Oneida County, New York
223217 76810 33 Metropolitan
36103 Suffolk County, New York
1474764 39094 2.6 Metropolitan
36121 Wyoming County, New York
37721 26394 64.1 Fringe
36015 Chemung County, New York
82378 21222 24.2 Metropolitan
36075 Oswego County, New York
118412 74669 61.8 Fringe
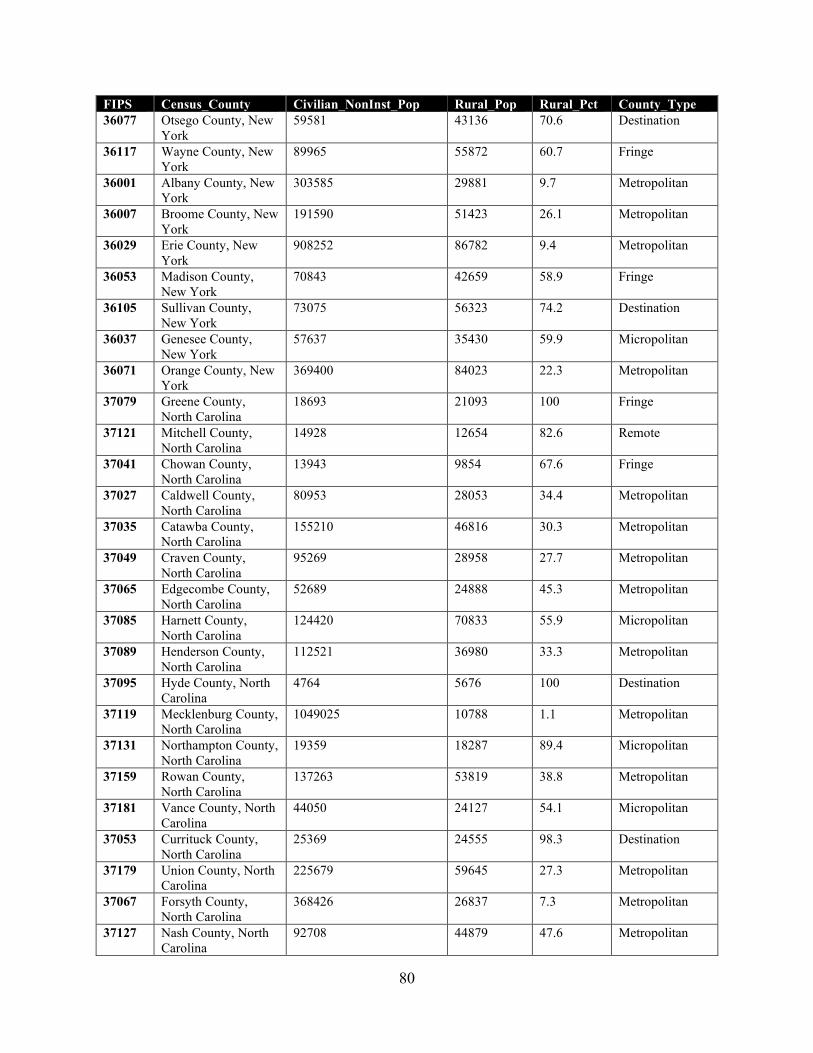
80
FIPS Census_County Civilian_NonInst_Pop Rural_Pop Rural_Pct County_Type 36077 Otsego County, New
York 59581 43136 70.6 Destination
36117 Wayne County, New York
89965 55872 60.7 Fringe
36001 Albany County, New York
303585 29881 9.7 Metropolitan
36007 Broome County, New York
191590 51423 26.1 Metropolitan
36029 Erie County, New York
908252 86782 9.4 Metropolitan
36053 Madison County, New York
70843 42659 58.9 Fringe
36105 Sullivan County, New York
73075 56323 74.2 Destination
36037 Genesee County, New York
57637 35430 59.9 Micropolitan
36071 Orange County, New York
369400 84023 22.3 Metropolitan
37079 Greene County, North Carolina
18693 21093 100 Fringe
37121 Mitchell County, North Carolina
14928 12654 82.6 Remote
37041 Chowan County, North Carolina
13943 9854 67.6 Fringe
37027 Caldwell County, North Carolina
80953 28053 34.4 Metropolitan
37035 Catawba County, North Carolina
155210 46816 30.3 Metropolitan
37049 Craven County, North Carolina
95269 28958 27.7 Metropolitan
37065 Edgecombe County, North Carolina
52689 24888 45.3 Metropolitan
37085 Harnett County, North Carolina
124420 70833 55.9 Micropolitan
37089 Henderson County, North Carolina
112521 36980 33.3 Metropolitan
37095 Hyde County, North Carolina
4764 5676 100 Destination
37119 Mecklenburg County, North Carolina
1049025 10788 1.1 Metropolitan
37131 Northampton County, North Carolina
19359 18287 89.4 Micropolitan
37159 Rowan County, North Carolina
137263 53819 38.8 Metropolitan
37181 Vance County, North Carolina
44050 24127 54.1 Micropolitan
37053 Currituck County, North Carolina
25369 24555 98.3 Destination
37179 Union County, North Carolina
225679 59645 27.3 Metropolitan
37067 Forsyth County, North Carolina
368426 26837 7.3 Metropolitan
37127 Nash County, North Carolina
92708 44879 47.6 Metropolitan
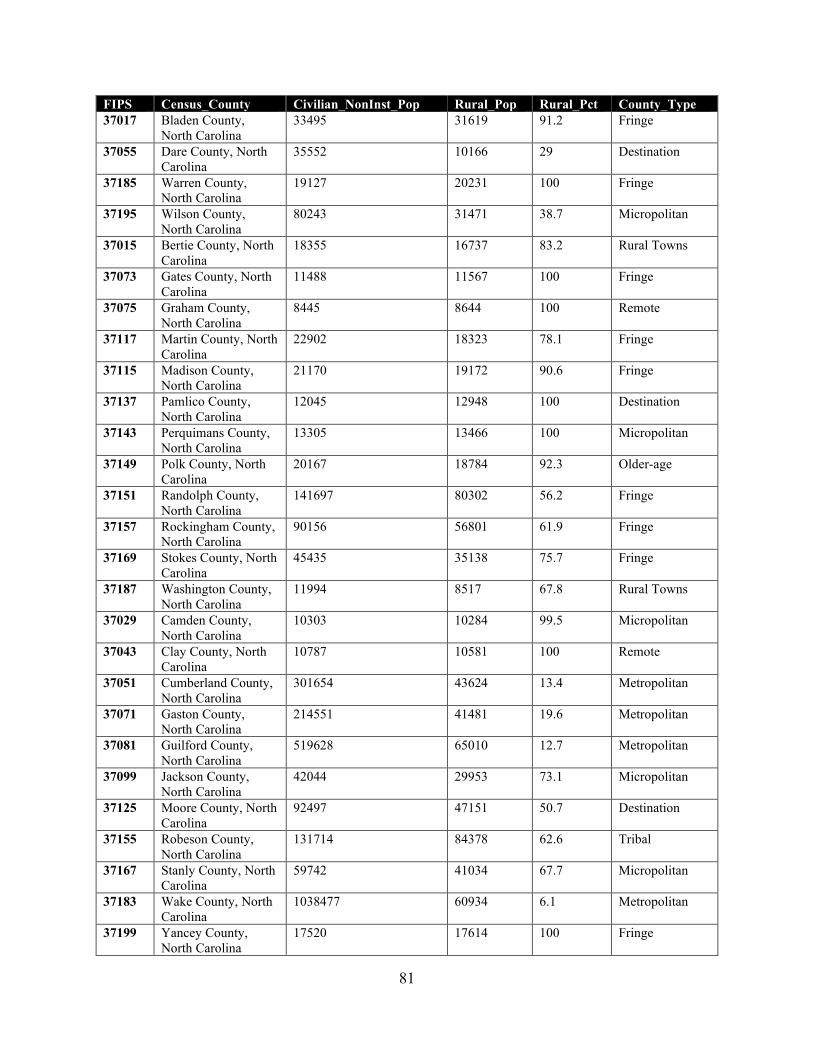
81
FIPS Census_County Civilian_NonInst_Pop Rural_Pop Rural_Pct County_Type 37017 Bladen County,
North Carolina 33495 31619 91.2 Fringe
37055 Dare County, North Carolina
35552 10166 29 Destination
37185 Warren County, North Carolina
19127 20231 100 Fringe
37195 Wilson County, North Carolina
80243 31471 38.7 Micropolitan
37015 Bertie County, North Carolina
18355 16737 83.2 Rural Towns
37073 Gates County, North Carolina
11488 11567 100 Fringe
37075 Graham County, North Carolina
8445 8644 100 Remote
37117 Martin County, North Carolina
22902 18323 78.1 Fringe
37115 Madison County, North Carolina
21170 19172 90.6 Fringe
37137 Pamlico County, North Carolina
12045 12948 100 Destination
37143 Perquimans County, North Carolina
13305 13466 100 Micropolitan
37149 Polk County, North Carolina
20167 18784 92.3 Older-age
37151 Randolph County, North Carolina
141697 80302 56.2 Fringe
37157 Rockingham County, North Carolina
90156 56801 61.9 Fringe
37169 Stokes County, North Carolina
45435 35138 75.7 Fringe
37187 Washington County, North Carolina
11994 8517 67.8 Rural Towns
37029 Camden County, North Carolina
10303 10284 99.5 Micropolitan
37043 Clay County, North Carolina
10787 10581 100 Remote
37051 Cumberland County, North Carolina
301654 43624 13.4 Metropolitan
37071 Gaston County, North Carolina
214551 41481 19.6 Metropolitan
37081 Guilford County, North Carolina
519628 65010 12.7 Metropolitan
37099 Jackson County, North Carolina
42044 29953 73.1 Micropolitan
37125 Moore County, North Carolina
92497 47151 50.7 Destination
37155 Robeson County, North Carolina
131714 84378 62.6 Tribal
37167 Stanly County, North Carolina
59742 41034 67.7 Micropolitan
37183 Wake County, North Carolina
1038477 60934 6.1 Metropolitan
37199 Yancey County, North Carolina
17520 17614 100 Fringe
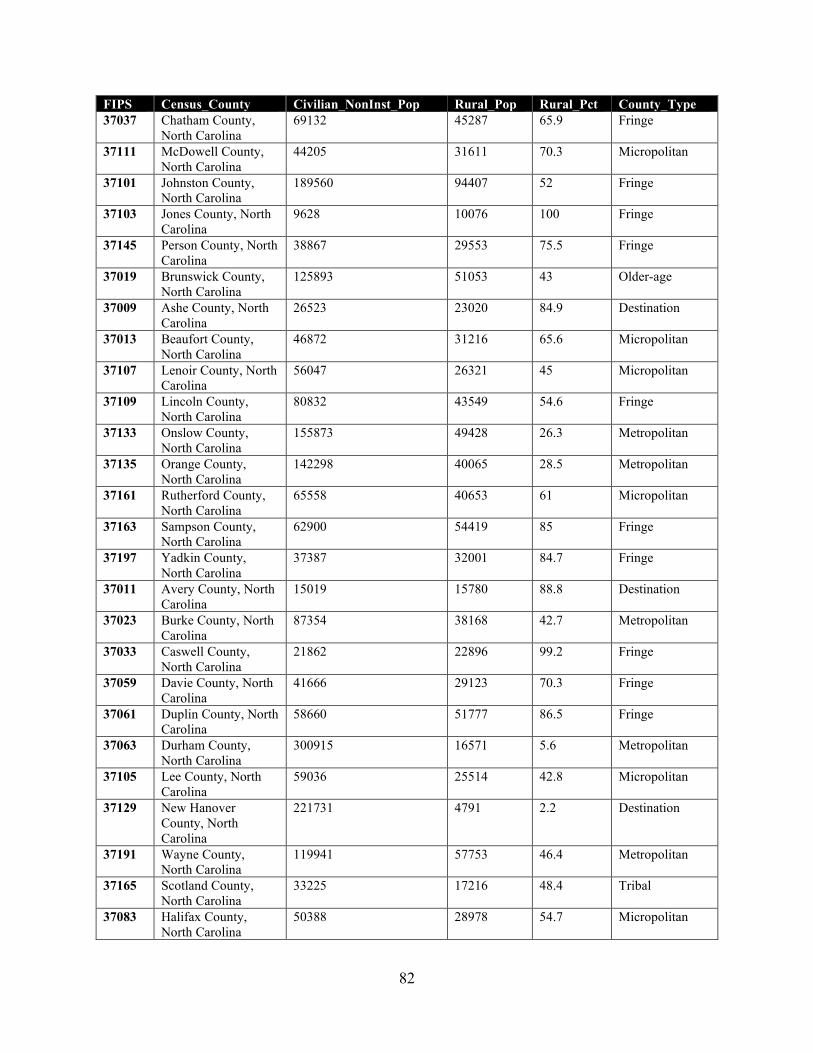
82
FIPS Census_County Civilian_NonInst_Pop Rural_Pop Rural_Pct County_Type 37037 Chatham County,
North Carolina 69132 45287 65.9 Fringe
37111 McDowell County, North Carolina
44205 31611 70.3 Micropolitan
37101 Johnston County, North Carolina
189560 94407 52 Fringe
37103 Jones County, North Carolina
9628 10076 100 Fringe
37145 Person County, North Carolina
38867 29553 75.5 Fringe
37019 Brunswick County, North Carolina
125893 51053 43 Older-age
37009 Ashe County, North Carolina
26523 23020 84.9 Destination
37013 Beaufort County, North Carolina
46872 31216 65.6 Micropolitan
37107 Lenoir County, North Carolina
56047 26321 45 Micropolitan
37109 Lincoln County, North Carolina
80832 43549 54.6 Fringe
37133 Onslow County, North Carolina
155873 49428 26.3 Metropolitan
37135 Orange County, North Carolina
142298 40065 28.5 Metropolitan
37161 Rutherford County, North Carolina
65558 40653 61 Micropolitan
37163 Sampson County, North Carolina
62900 54419 85 Fringe
37197 Yadkin County, North Carolina
37387 32001 84.7 Fringe
37011 Avery County, North Carolina
15019 15780 88.8 Destination
37023 Burke County, North Carolina
87354 38168 42.7 Metropolitan
37033 Caswell County, North Carolina
21862 22896 99.2 Fringe
37059 Davie County, North Carolina
41666 29123 70.3 Fringe
37061 Duplin County, North Carolina
58660 51777 86.5 Fringe
37063 Durham County, North Carolina
300915 16571 5.6 Metropolitan
37105 Lee County, North Carolina
59036 25514 42.8 Micropolitan
37129 New Hanover County, North Carolina
221731 4791 2.2 Destination
37191 Wayne County, North Carolina
119941 57753 46.4 Metropolitan
37165 Scotland County, North Carolina
33225 17216 48.4 Tribal
37083 Halifax County, North Carolina
50388 28978 54.7 Micropolitan
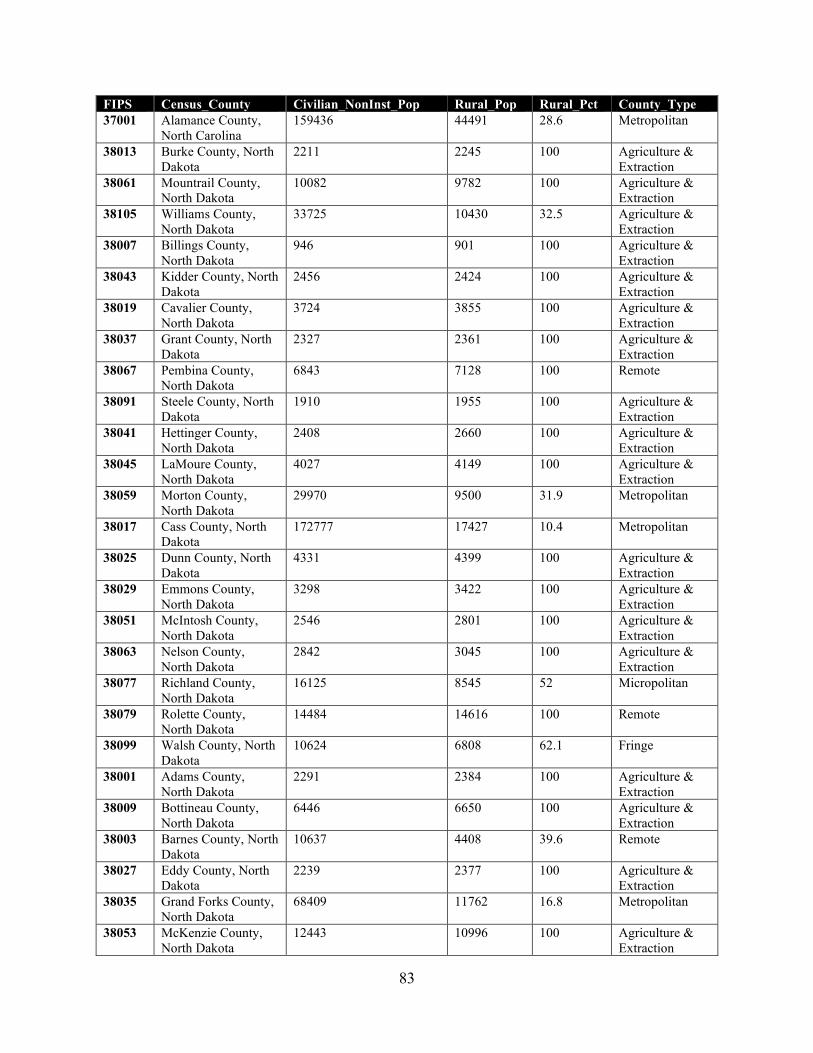
83
FIPS Census_County Civilian_NonInst_Pop Rural_Pop Rural_Pct County_Type 37001 Alamance County,
North Carolina 159436 44491 28.6 Metropolitan
38013 Burke County, North Dakota
2211 2245 100 Agriculture & Extraction
38061 Mountrail County, North Dakota
10082 9782 100 Agriculture & Extraction
38105 Williams County, North Dakota
33725 10430 32.5 Agriculture & Extraction
38007 Billings County, North Dakota
946 901 100 Agriculture & Extraction
38043 Kidder County, North Dakota
2456 2424 100 Agriculture & Extraction
38019 Cavalier County, North Dakota
3724 3855 100 Agriculture & Extraction
38037 Grant County, North Dakota
2327 2361 100 Agriculture & Extraction
38067 Pembina County, North Dakota
6843 7128 100 Remote
38091 Steele County, North Dakota
1910 1955 100 Agriculture & Extraction
38041 Hettinger County, North Dakota
2408 2660 100 Agriculture & Extraction
38045 LaMoure County, North Dakota
4027 4149 100 Agriculture & Extraction
38059 Morton County, North Dakota
29970 9500 31.9 Metropolitan
38017 Cass County, North Dakota
172777 17427 10.4 Metropolitan
38025 Dunn County, North Dakota
4331 4399 100 Agriculture & Extraction
38029 Emmons County, North Dakota
3298 3422 100 Agriculture & Extraction
38051 McIntosh County, North Dakota
2546 2801 100 Agriculture & Extraction
38063 Nelson County, North Dakota
2842 3045 100 Agriculture & Extraction
38077 Richland County, North Dakota
16125 8545 52 Micropolitan
38079 Rolette County, North Dakota
14484 14616 100 Remote
38099 Walsh County, North Dakota
10624 6808 62.1 Fringe
38001 Adams County, North Dakota
2291 2384 100 Agriculture & Extraction
38009 Bottineau County, North Dakota
6446 6650 100 Agriculture & Extraction
38003 Barnes County, North Dakota
10637 4408 39.6 Remote
38027 Eddy County, North Dakota
2239 2377 100 Agriculture & Extraction
38035 Grand Forks County, North Dakota
68409 11762 16.8 Metropolitan
38053 McKenzie County, North Dakota
12443 10996 100 Agriculture & Extraction
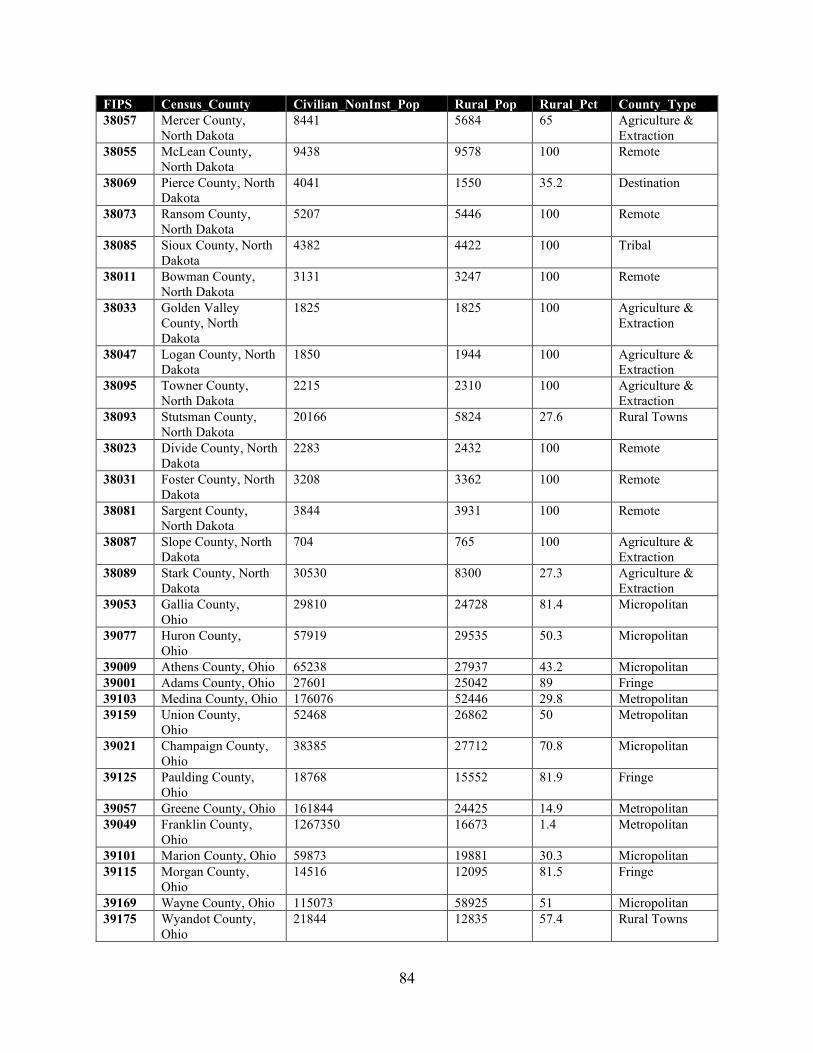
84
FIPS Census_County Civilian_NonInst_Pop Rural_Pop Rural_Pct County_Type 38057 Mercer County,
North Dakota 8441 5684 65 Agriculture &
Extraction 38055 McLean County,
North Dakota 9438 9578 100 Remote
38069 Pierce County, North Dakota
4041 1550 35.2 Destination
38073 Ransom County, North Dakota
5207 5446 100 Remote
38085 Sioux County, North Dakota
4382 4422 100 Tribal
38011 Bowman County, North Dakota
3131 3247 100 Remote
38033 Golden Valley County, North Dakota
1825 1825 100 Agriculture & Extraction
38047 Logan County, North Dakota
1850 1944 100 Agriculture & Extraction
38095 Towner County, North Dakota
2215 2310 100 Agriculture & Extraction
38093 Stutsman County, North Dakota
20166 5824 27.6 Rural Towns
38023 Divide County, North Dakota
2283 2432 100 Remote
38031 Foster County, North Dakota
3208 3362 100 Remote
38081 Sargent County, North Dakota
3844 3931 100 Remote
38087 Slope County, North Dakota
704 765 100 Agriculture & Extraction
38089 Stark County, North Dakota
30530 8300 27.3 Agriculture & Extraction
39053 Gallia County, Ohio
29810 24728 81.4 Micropolitan
39077 Huron County, Ohio
57919 29535 50.3 Micropolitan
39009 Athens County, Ohio 65238 27937 43.2 Micropolitan 39001 Adams County, Ohio 27601 25042 89 Fringe 39103 Medina County, Ohio 176076 52446 29.8 Metropolitan 39159 Union County,
Ohio 52468 26862 50 Metropolitan
39021 Champaign County, Ohio
38385 27712 70.8 Micropolitan
39125 Paulding County, Ohio
18768 15552 81.9 Fringe
39057 Greene County, Ohio 161844 24425 14.9 Metropolitan 39049 Franklin County,
Ohio 1267350 16673 1.4 Metropolitan
39101 Marion County, Ohio 59873 19881 30.3 Micropolitan 39115 Morgan County,
Ohio 14516 12095 81.5 Fringe
39169 Wayne County, Ohio 115073 58925 51 Micropolitan 39175 Wyandot County,
Ohio 21844 12835 57.4 Rural Towns
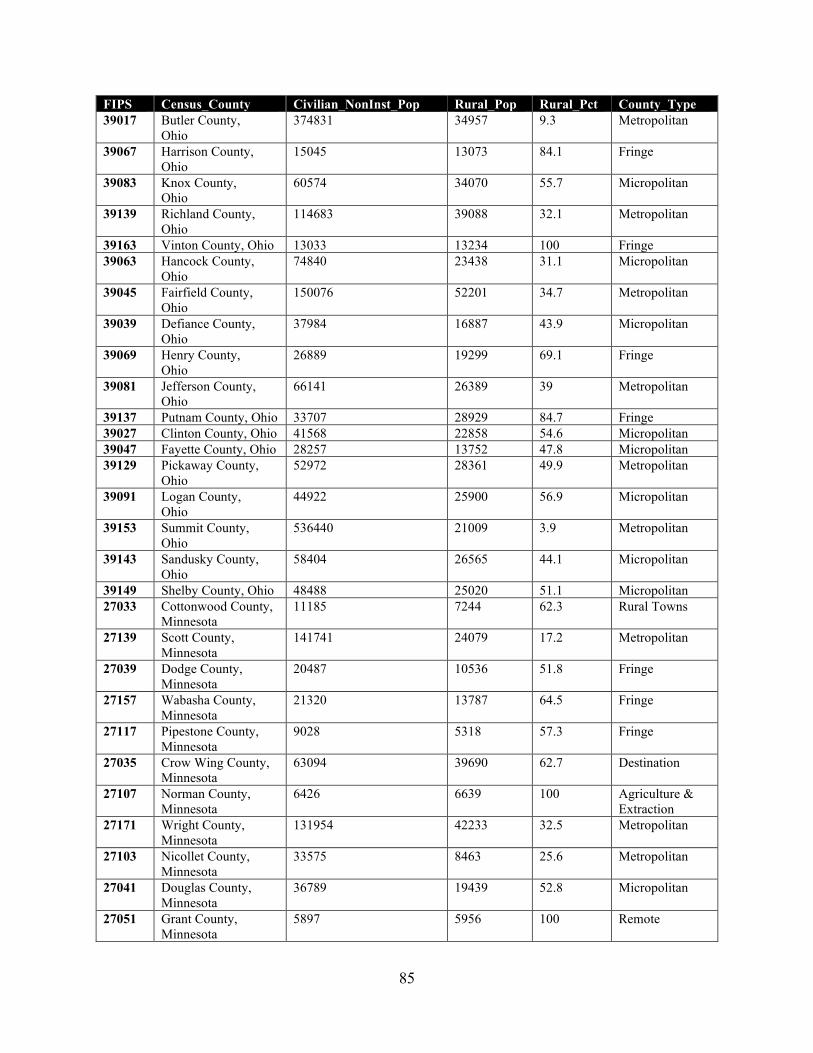
85
FIPS Census_County Civilian_NonInst_Pop Rural_Pop Rural_Pct County_Type 39017 Butler County,
Ohio 374831 34957 9.3 Metropolitan
39067 Harrison County, Ohio
15045 13073 84.1 Fringe
39083 Knox County, Ohio
60574 34070 55.7 Micropolitan
39139 Richland County, Ohio
114683 39088 32.1 Metropolitan
39163 Vinton County, Ohio 13033 13234 100 Fringe 39063 Hancock County,
Ohio 74840 23438 31.1 Micropolitan
39045 Fairfield County, Ohio
150076 52201 34.7 Metropolitan
39039 Defiance County, Ohio
37984 16887 43.9 Micropolitan
39069 Henry County, Ohio
26889 19299 69.1 Fringe
39081 Jefferson County, Ohio
66141 26389 39 Metropolitan
39137 Putnam County, Ohio 33707 28929 84.7 Fringe 39027 Clinton County, Ohio 41568 22858 54.6 Micropolitan 39047 Fayette County, Ohio 28257 13752 47.8 Micropolitan 39129 Pickaway County,
Ohio 52972 28361 49.9 Metropolitan
39091 Logan County, Ohio
44922 25900 56.9 Micropolitan
39153 Summit County, Ohio
536440 21009 3.9 Metropolitan
39143 Sandusky County, Ohio
58404 26565 44.1 Micropolitan
39149 Shelby County, Ohio 48488 25020 51.1 Micropolitan 27033 Cottonwood County,
Minnesota 11185 7244 62.3 Rural Towns
27139 Scott County, Minnesota
141741 24079 17.2 Metropolitan
27039 Dodge County, Minnesota
20487 10536 51.8 Fringe
27157 Wabasha County, Minnesota
21320 13787 64.5 Fringe
27117 Pipestone County, Minnesota
9028 5318 57.3 Fringe
27035 Crow Wing County, Minnesota
63094 39690 62.7 Destination
27107 Norman County, Minnesota
6426 6639 100 Agriculture & Extraction
27171 Wright County, Minnesota
131954 42233 32.5 Metropolitan
27103 Nicollet County, Minnesota
33575 8463 25.6 Metropolitan
27041 Douglas County, Minnesota
36789 19439 52.8 Micropolitan
27051 Grant County, Minnesota
5897 5956 100 Remote
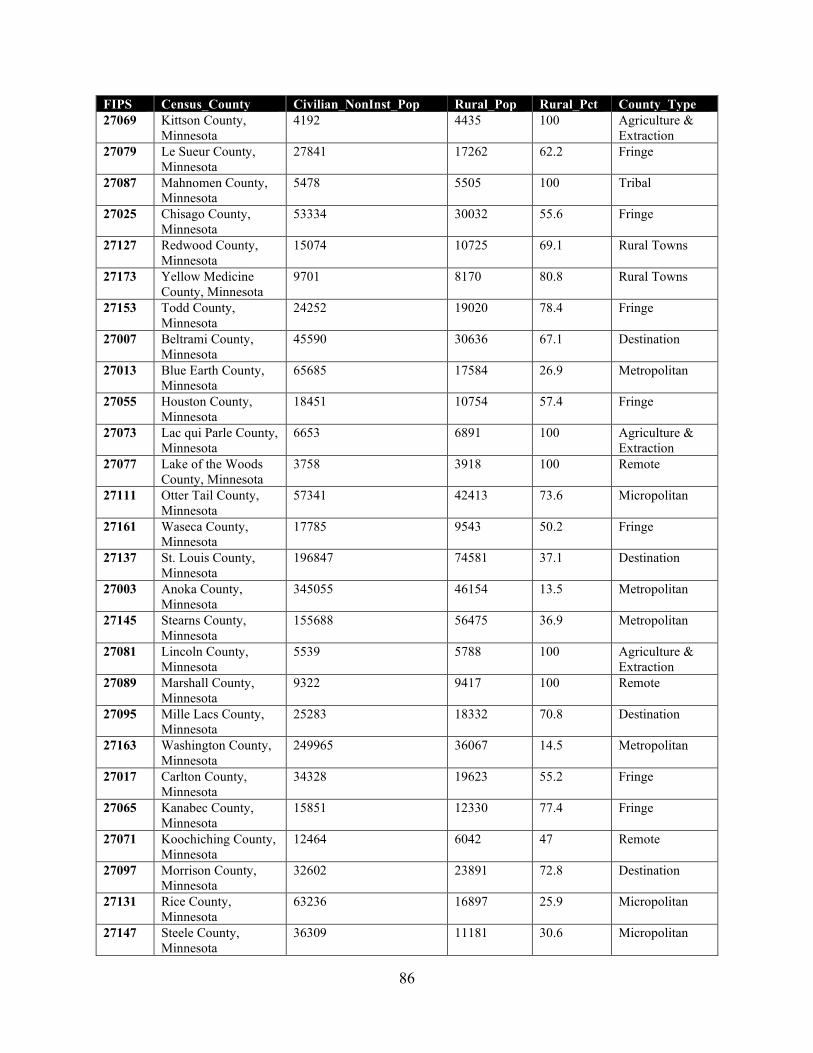
86
FIPS Census_County Civilian_NonInst_Pop Rural_Pop Rural_Pct County_Type 27069 Kittson County,
Minnesota 4192 4435 100 Agriculture &
Extraction 27079 Le Sueur County,
Minnesota 27841 17262 62.2 Fringe
27087 Mahnomen County, Minnesota
5478 5505 100 Tribal
27025 Chisago County, Minnesota
53334 30032 55.6 Fringe
27127 Redwood County, Minnesota
15074 10725 69.1 Rural Towns
27173 Yellow Medicine County, Minnesota
9701 8170 80.8 Rural Towns
27153 Todd County, Minnesota
24252 19020 78.4 Fringe
27007 Beltrami County, Minnesota
45590 30636 67.1 Destination
27013 Blue Earth County, Minnesota
65685 17584 26.9 Metropolitan
27055 Houston County, Minnesota
18451 10754 57.4 Fringe
27073 Lac qui Parle County, Minnesota
6653 6891 100 Agriculture & Extraction
27077 Lake of the Woods County, Minnesota
3758 3918 100 Remote
27111 Otter Tail County, Minnesota
57341 42413 73.6 Micropolitan
27161 Waseca County, Minnesota
17785 9543 50.2 Fringe
27137 St. Louis County, Minnesota
196847 74581 37.1 Destination
27003 Anoka County, Minnesota
345055 46154 13.5 Metropolitan
27145 Stearns County, Minnesota
155688 56475 36.9 Metropolitan
27081 Lincoln County, Minnesota
5539 5788 100 Agriculture & Extraction
27089 Marshall County, Minnesota
9322 9417 100 Remote
27095 Mille Lacs County, Minnesota
25283 18332 70.8 Destination
27163 Washington County, Minnesota
249965 36067 14.5 Metropolitan
27017 Carlton County, Minnesota
34328 19623 55.2 Fringe
27065 Kanabec County, Minnesota
15851 12330 77.4 Fringe
27071 Koochiching County, Minnesota
12464 6042 47 Remote
27097 Morrison County, Minnesota
32602 23891 72.8 Destination
27131 Rice County, Minnesota
63236 16897 25.9 Micropolitan
27147 Steele County, Minnesota
36309 11181 30.6 Micropolitan

87
FIPS Census_County Civilian_NonInst_Pop Rural_Pop Rural_Pct County_Type 27125 Red Lake County,
Minnesota 3985 4043 100 Fringe
27001 Aitkin County, Minnesota
15655 15771 100 Fringe
27043 Faribault County, Minnesota
13621 11016 77.6 Fringe
27101 Murray County, Minnesota
8246 8470 100 Remote
27067 Kandiyohi County, Minnesota
41983 18827 44.5 Micropolitan
27075 Lake County, Minnesota
10397 7153 67 Remote
27133 Rock County, Minnesota
9187 4997 52.3 Fringe
27143 Sibley County, Minnesota
14787 14918 100 Fringe
27155 Traverse County, Minnesota
3249 3387 100 Agriculture & Extraction
27005 Becker County, Minnesota
33380 25101 75.5 Fringe
27053 Hennepin County, Minnesota
1226779 26968 2.2 Metropolitan
27015 Brown County, Minnesota
24876 8837 34.9 Micropolitan
27023 Chippewa County, Minnesota
11821 6096 50.3 Rural Towns
27029 Clearwater County, Minnesota
8714 8791 100 Fringe
27057 Hubbard County, Minnesota
20732 17151 83.4 Older-age
27059 Isanti County, Minnesota
38665 23918 62.3 Fringe
27091 Martin County, Minnesota
19756 10927 54 Rural Towns
27099 Mower County, Minnesota
39155 14117 35.9 Micropolitan
27115 Pine County, Minnesota
27562 25982 89.3 Fringe
27109 Olmsted County, Minnesota
151291 24937 16.6 Metropolitan
27159 Wadena County, Minnesota
13355 9215 67 Rural Towns
27009 Benton County, Minnesota
39249 15807 40 Metropolitan
27047 Freeborn County, Minnesota
30077 13209 42.8 Rural Towns
27085 McLeod County, Minnesota
35580 16705 46.6 Micropolitan
27121 Pope County, Minnesota
10804 10984 100 Fringe
27149 Stevens County, Minnesota
9696 4638 47.3 Rural Towns
27151 Swift County, Minnesota
9286 6358 67.4 Rural Towns
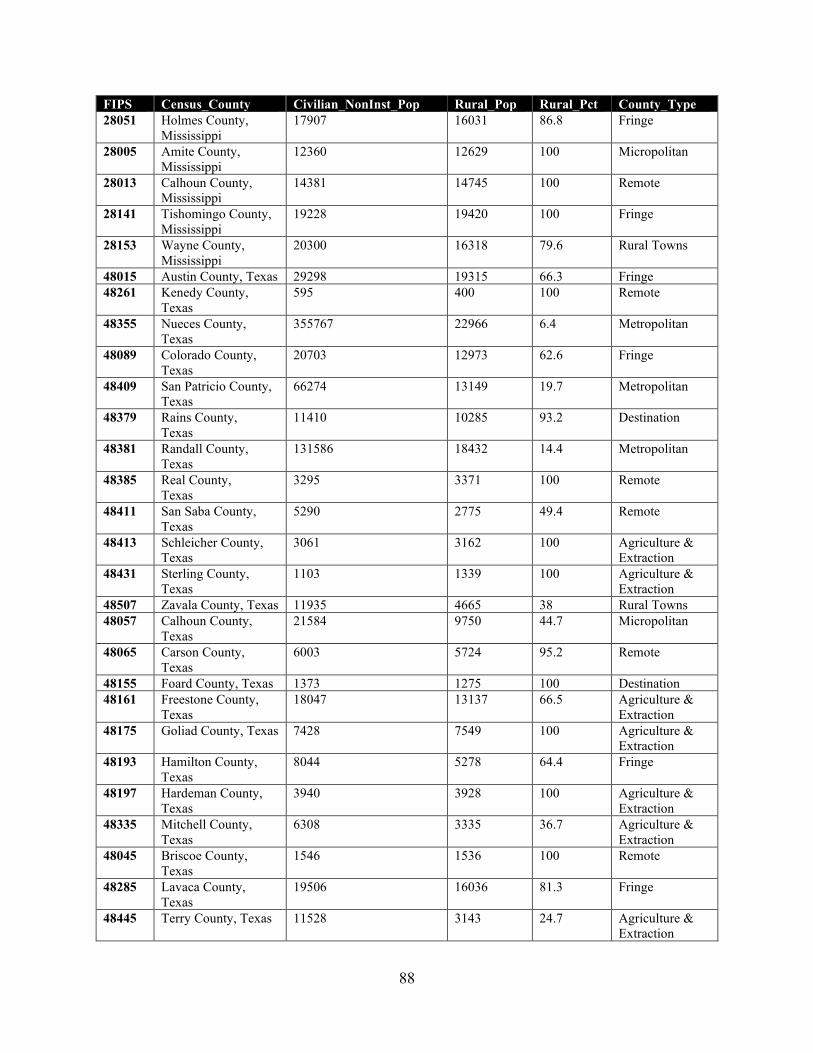
88
FIPS Census_County Civilian_NonInst_Pop Rural_Pop Rural_Pct County_Type 28051 Holmes County,
Mississippi 17907 16031 86.8 Fringe
28005 Amite County, Mississippi
12360 12629 100 Micropolitan
28013 Calhoun County, Mississippi
14381 14745 100 Remote
28141 Tishomingo County, Mississippi
19228 19420 100 Fringe
28153 Wayne County, Mississippi
20300 16318 79.6 Rural Towns
48015 Austin County, Texas 29298 19315 66.3 Fringe 48261 Kenedy County,
Texas 595 400 100 Remote
48355 Nueces County, Texas
355767 22966 6.4 Metropolitan
48089 Colorado County, Texas
20703 12973 62.6 Fringe
48409 San Patricio County, Texas
66274 13149 19.7 Metropolitan
48379 Rains County, Texas
11410 10285 93.2 Destination
48381 Randall County, Texas
131586 18432 14.4 Metropolitan
48385 Real County, Texas
3295 3371 100 Remote
48411 San Saba County, Texas
5290 2775 49.4 Remote
48413 Schleicher County, Texas
3061 3162 100 Agriculture & Extraction
48431 Sterling County, Texas
1103 1339 100 Agriculture & Extraction
48507 Zavala County, Texas 11935 4665 38 Rural Towns 48057 Calhoun County,
Texas 21584 9750 44.7 Micropolitan
48065 Carson County, Texas
6003 5724 95.2 Remote
48155 Foard County, Texas 1373 1275 100 Destination 48161 Freestone County,
Texas 18047 13137 66.5 Agriculture &
Extraction 48175 Goliad County, Texas 7428 7549 100 Agriculture &
Extraction 48193 Hamilton County,
Texas 8044 5278 64.4 Fringe
48197 Hardeman County, Texas
3940 3928 100 Agriculture & Extraction
48335 Mitchell County, Texas
6308 3335 36.7 Agriculture & Extraction
48045 Briscoe County, Texas
1546 1536 100 Remote
48285 Lavaca County, Texas
19506 16036 81.3 Fringe
48445 Terry County, Texas 11528 3143 24.7 Agriculture & Extraction
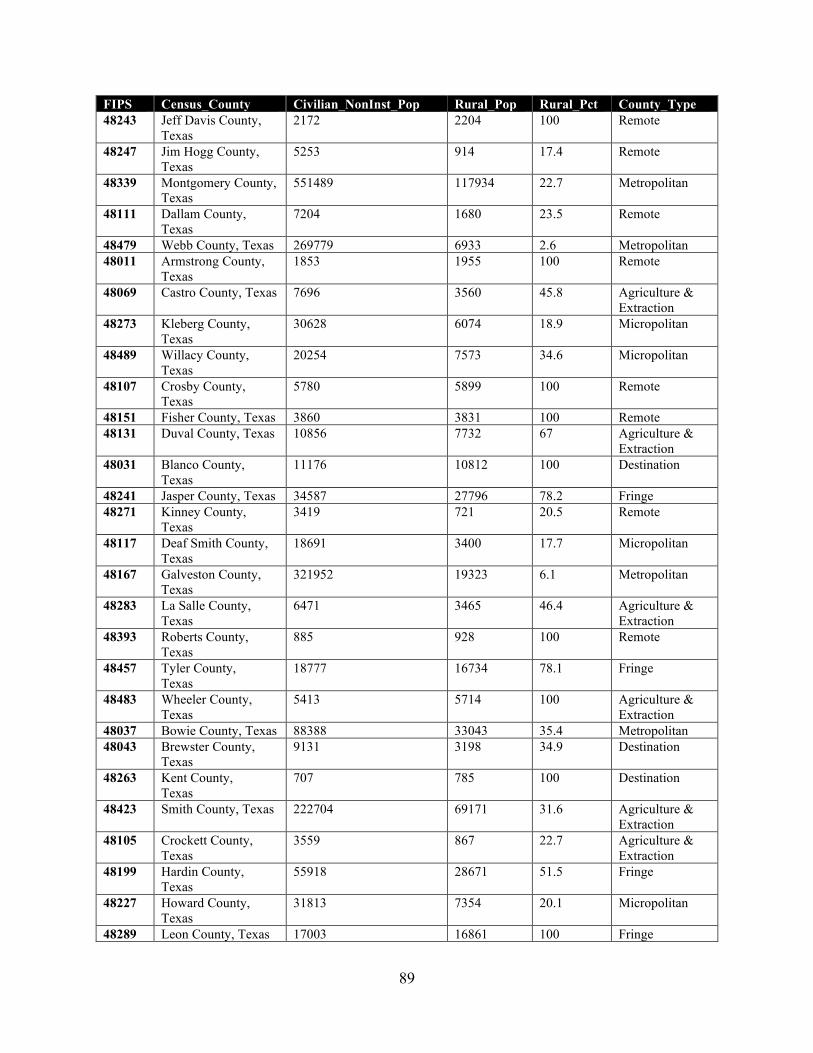
89
FIPS Census_County Civilian_NonInst_Pop Rural_Pop Rural_Pct County_Type 48243 Jeff Davis County,
Texas 2172 2204 100 Remote
48247 Jim Hogg County, Texas
5253 914 17.4 Remote
48339 Montgomery County, Texas
551489 117934 22.7 Metropolitan
48111 Dallam County, Texas
7204 1680 23.5 Remote
48479 Webb County, Texas 269779 6933 2.6 Metropolitan 48011 Armstrong County,
Texas 1853 1955 100 Remote
48069 Castro County, Texas 7696 3560 45.8 Agriculture & Extraction
48273 Kleberg County, Texas
30628 6074 18.9 Micropolitan
48489 Willacy County, Texas
20254 7573 34.6 Micropolitan
48107 Crosby County, Texas
5780 5899 100 Remote
48151 Fisher County, Texas 3860 3831 100 Remote 48131 Duval County, Texas 10856 7732 67 Agriculture &
Extraction 48031 Blanco County,
Texas 11176 10812 100 Destination
48241 Jasper County, Texas 34587 27796 78.2 Fringe 48271 Kinney County,
Texas 3419 721 20.5 Remote
48117 Deaf Smith County, Texas
18691 3400 17.7 Micropolitan
48167 Galveston County, Texas
321952 19323 6.1 Metropolitan
48283 La Salle County, Texas
6471 3465 46.4 Agriculture & Extraction
48393 Roberts County, Texas
885 928 100 Remote
48457 Tyler County, Texas
18777 16734 78.1 Fringe
48483 Wheeler County, Texas
5413 5714 100 Agriculture & Extraction
48037 Bowie County, Texas 88388 33043 35.4 Metropolitan 48043 Brewster County,
Texas 9131 3198 34.9 Destination
48263 Kent County, Texas
707 785 100 Destination
48423 Smith County, Texas 222704 69171 31.6 Agriculture & Extraction
48105 Crockett County, Texas
3559 867 22.7 Agriculture & Extraction
48199 Hardin County, Texas
55918 28671 51.5 Fringe
48227 Howard County, Texas
31813 7354 20.1 Micropolitan
48289 Leon County, Texas 17003 16861 100 Fringe
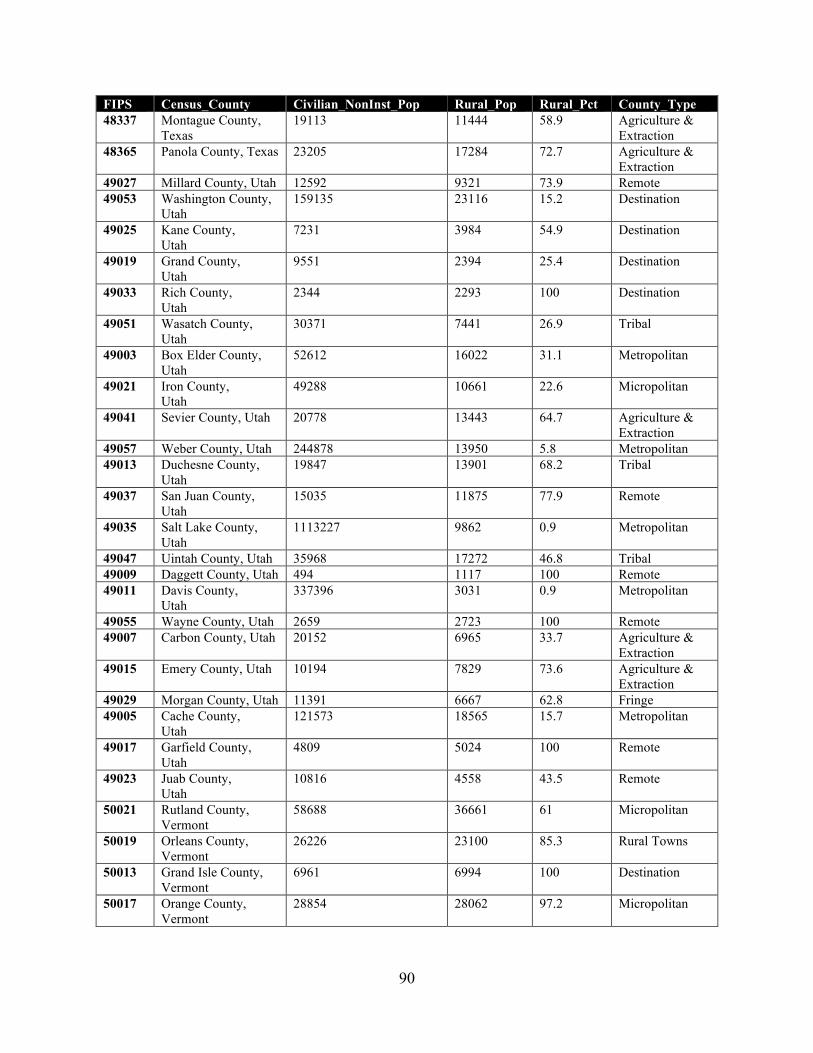
90
FIPS Census_County Civilian_NonInst_Pop Rural_Pop Rural_Pct County_Type 48337 Montague County,
Texas 19113 11444 58.9 Agriculture &
Extraction 48365 Panola County, Texas 23205 17284 72.7 Agriculture &
Extraction 49027 Millard County, Utah 12592 9321 73.9 Remote 49053 Washington County,
Utah 159135 23116 15.2 Destination
49025 Kane County, Utah
7231 3984 54.9 Destination
49019 Grand County, Utah
9551 2394 25.4 Destination
49033 Rich County, Utah
2344 2293 100 Destination
49051 Wasatch County, Utah
30371 7441 26.9 Tribal
49003 Box Elder County, Utah
52612 16022 31.1 Metropolitan
49021 Iron County, Utah
49288 10661 22.6 Micropolitan
49041 Sevier County, Utah 20778 13443 64.7 Agriculture & Extraction
49057 Weber County, Utah 244878 13950 5.8 Metropolitan 49013 Duchesne County,
Utah 19847 13901 68.2 Tribal
49037 San Juan County, Utah
15035 11875 77.9 Remote
49035 Salt Lake County, Utah
1113227 9862 0.9 Metropolitan
49047 Uintah County, Utah 35968 17272 46.8 Tribal 49009 Daggett County, Utah 494 1117 100 Remote 49011 Davis County,
Utah 337396 3031 0.9 Metropolitan
49055 Wayne County, Utah 2659 2723 100 Remote 49007 Carbon County, Utah 20152 6965 33.7 Agriculture &
Extraction 49015 Emery County, Utah 10194 7829 73.6 Agriculture &
Extraction 49029 Morgan County, Utah 11391 6667 62.8 Fringe 49005 Cache County,
Utah 121573 18565 15.7 Metropolitan
49017 Garfield County, Utah
4809 5024 100 Remote
49023 Juab County, Utah
10816 4558 43.5 Remote
50021 Rutland County, Vermont
58688 36661 61 Micropolitan
50019 Orleans County, Vermont
26226 23100 85.3 Rural Towns
50013 Grand Isle County, Vermont
6961 6994 100 Destination
50017 Orange County, Vermont
28854 28062 97.2 Micropolitan
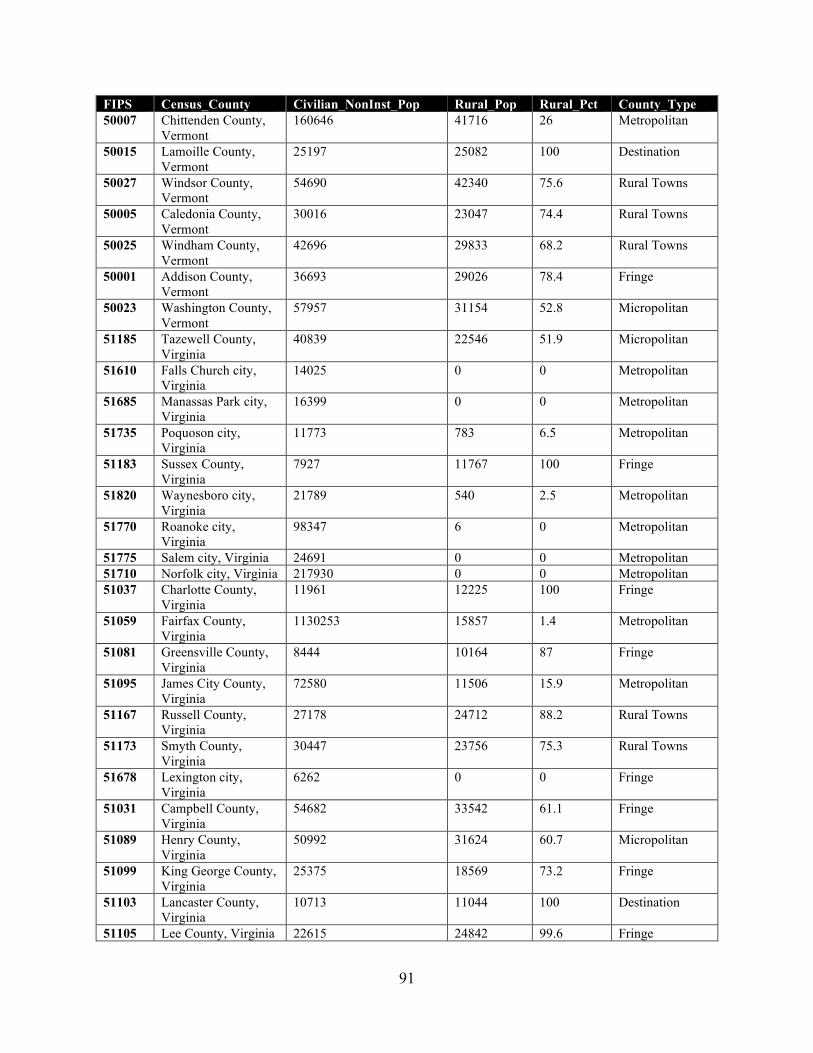
91
FIPS Census_County Civilian_NonInst_Pop Rural_Pop Rural_Pct County_Type 50007 Chittenden County,
Vermont 160646 41716 26 Metropolitan
50015 Lamoille County, Vermont
25197 25082 100 Destination
50027 Windsor County, Vermont
54690 42340 75.6 Rural Towns
50005 Caledonia County, Vermont
30016 23047 74.4 Rural Towns
50025 Windham County, Vermont
42696 29833 68.2 Rural Towns
50001 Addison County, Vermont
36693 29026 78.4 Fringe
50023 Washington County, Vermont
57957 31154 52.8 Micropolitan
51185 Tazewell County, Virginia
40839 22546 51.9 Micropolitan
51610 Falls Church city, Virginia
14025 0 0 Metropolitan
51685 Manassas Park city, Virginia
16399 0 0 Metropolitan
51735 Poquoson city, Virginia
11773 783 6.5 Metropolitan
51183 Sussex County, Virginia
7927 11767 100 Fringe
51820 Waynesboro city, Virginia
21789 540 2.5 Metropolitan
51770 Roanoke city, Virginia
98347 6 0 Metropolitan
51775 Salem city, Virginia 24691 0 0 Metropolitan 51710 Norfolk city, Virginia 217930 0 0 Metropolitan 51037 Charlotte County,
Virginia 11961 12225 100 Fringe
51059 Fairfax County, Virginia
1130253 15857 1.4 Metropolitan
51081 Greensville County, Virginia
8444 10164 87 Fringe
51095 James City County, Virginia
72580 11506 15.9 Metropolitan
51167 Russell County, Virginia
27178 24712 88.2 Rural Towns
51173 Smyth County, Virginia
30447 23756 75.3 Rural Towns
51678 Lexington city, Virginia
6262 0 0 Fringe
51031 Campbell County, Virginia
54682 33542 61.1 Fringe
51089 Henry County, Virginia
50992 31624 60.7 Micropolitan
51099 King George County, Virginia
25375 18569 73.2 Fringe
51103 Lancaster County, Virginia
10713 11044 100 Destination
51105 Lee County, Virginia 22615 24842 99.6 Fringe
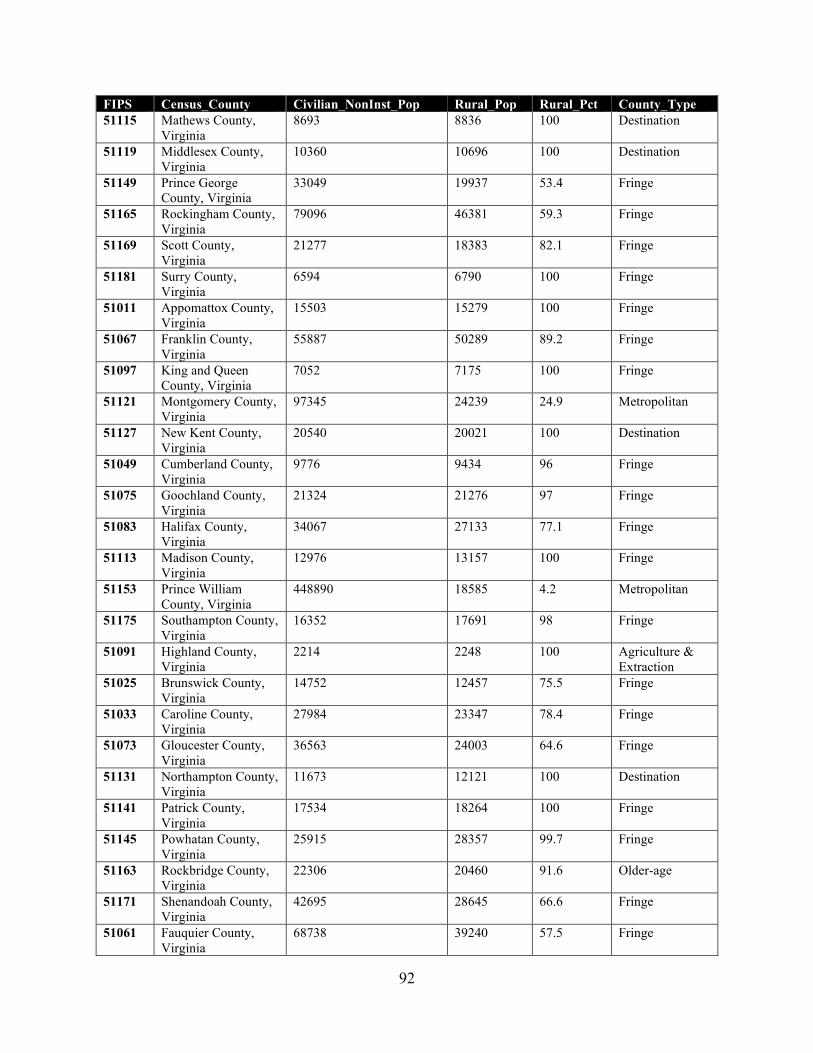
92
FIPS Census_County Civilian_NonInst_Pop Rural_Pop Rural_Pct County_Type 51115 Mathews County,
Virginia 8693 8836 100 Destination
51119 Middlesex County, Virginia
10360 10696 100 Destination
51149 Prince George County, Virginia
33049 19937 53.4 Fringe
51165 Rockingham County, Virginia
79096 46381 59.3 Fringe
51169 Scott County, Virginia
21277 18383 82.1 Fringe
51181 Surry County, Virginia
6594 6790 100 Fringe
51011 Appomattox County, Virginia
15503 15279 100 Fringe
51067 Franklin County, Virginia
55887 50289 89.2 Fringe
51097 King and Queen County, Virginia
7052 7175 100 Fringe
51121 Montgomery County, Virginia
97345 24239 24.9 Metropolitan
51127 New Kent County, Virginia
20540 20021 100 Destination
51049 Cumberland County, Virginia
9776 9434 96 Fringe
51075 Goochland County, Virginia
21324 21276 97 Fringe
51083 Halifax County, Virginia
34067 27133 77.1 Fringe
51113 Madison County, Virginia
12976 13157 100 Fringe
51153 Prince William County, Virginia
448890 18585 4.2 Metropolitan
51175 Southampton County, Virginia
16352 17691 98 Fringe
51091 Highland County, Virginia
2214 2248 100 Agriculture & Extraction
51025 Brunswick County, Virginia
14752 12457 75.5 Fringe
51033 Caroline County, Virginia
27984 23347 78.4 Fringe
51073 Gloucester County, Virginia
36563 24003 64.6 Fringe
51131 Northampton County, Virginia
11673 12121 100 Destination
51141 Patrick County, Virginia
17534 18264 100 Fringe
51145 Powhatan County, Virginia
25915 28357 99.7 Fringe
51163 Rockbridge County, Virginia
22306 20460 91.6 Older-age
51171 Shenandoah County, Virginia
42695 28645 66.6 Fringe
51061 Fauquier County, Virginia
68738 39240 57.5 Fringe
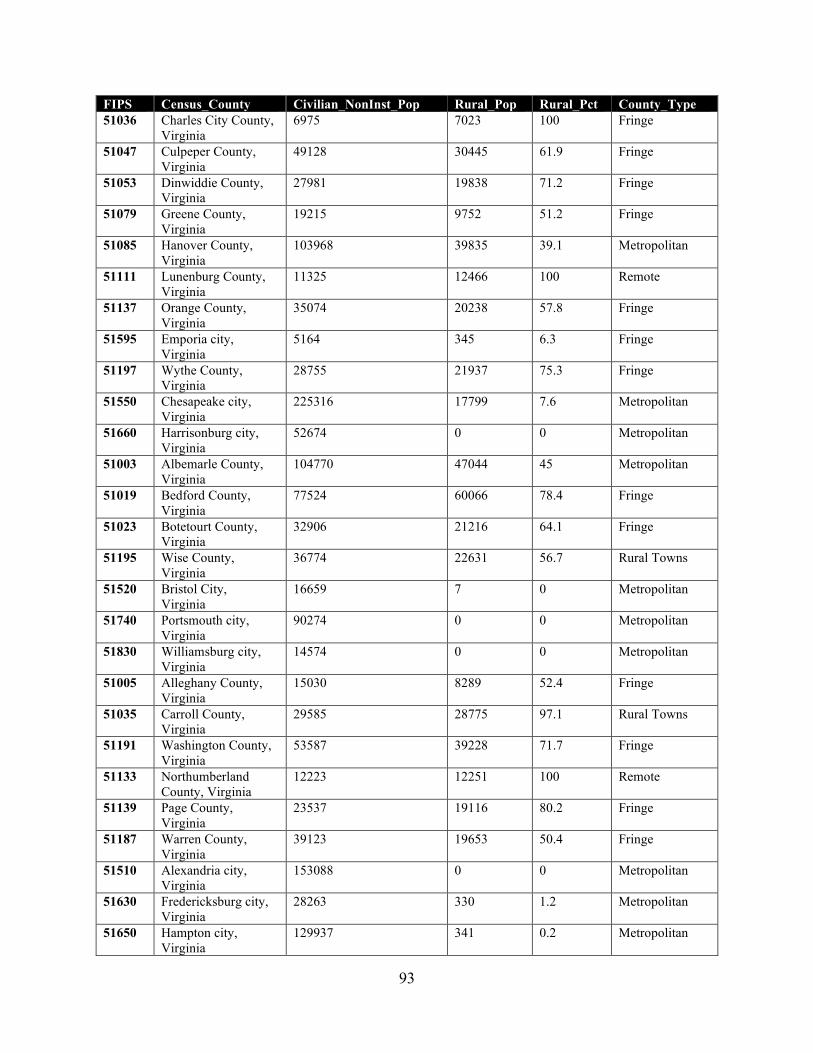
93
FIPS Census_County Civilian_NonInst_Pop Rural_Pop Rural_Pct County_Type 51036 Charles City County,
Virginia 6975 7023 100 Fringe
51047 Culpeper County, Virginia
49128 30445 61.9 Fringe
51053 Dinwiddie County, Virginia
27981 19838 71.2 Fringe
51079 Greene County, Virginia
19215 9752 51.2 Fringe
51085 Hanover County, Virginia
103968 39835 39.1 Metropolitan
51111 Lunenburg County, Virginia
11325 12466 100 Remote
51137 Orange County, Virginia
35074 20238 57.8 Fringe
51595 Emporia city, Virginia
5164 345 6.3 Fringe
51197 Wythe County, Virginia
28755 21937 75.3 Fringe
51550 Chesapeake city, Virginia
225316 17799 7.6 Metropolitan
51660 Harrisonburg city, Virginia
52674 0 0 Metropolitan
51003 Albemarle County, Virginia
104770 47044 45 Metropolitan
51019 Bedford County, Virginia
77524 60066 78.4 Fringe
51023 Botetourt County, Virginia
32906 21216 64.1 Fringe
51195 Wise County, Virginia
36774 22631 56.7 Rural Towns
51520 Bristol City, Virginia
16659 7 0 Metropolitan
51740 Portsmouth city, Virginia
90274 0 0 Metropolitan
51830 Williamsburg city, Virginia
14574 0 0 Metropolitan
51005 Alleghany County, Virginia
15030 8289 52.4 Fringe
51035 Carroll County, Virginia
29585 28775 97.1 Rural Towns
51191 Washington County, Virginia
53587 39228 71.7 Fringe
51133 Northumberland County, Virginia
12223 12251 100 Remote
51139 Page County, Virginia
23537 19116 80.2 Fringe
51187 Warren County, Virginia
39123 19653 50.4 Fringe
51510 Alexandria city, Virginia
153088 0 0 Metropolitan
51630 Fredericksburg city, Virginia
28263 330 1.2 Metropolitan
51650 Hampton city, Virginia
129937 341 0.2 Metropolitan
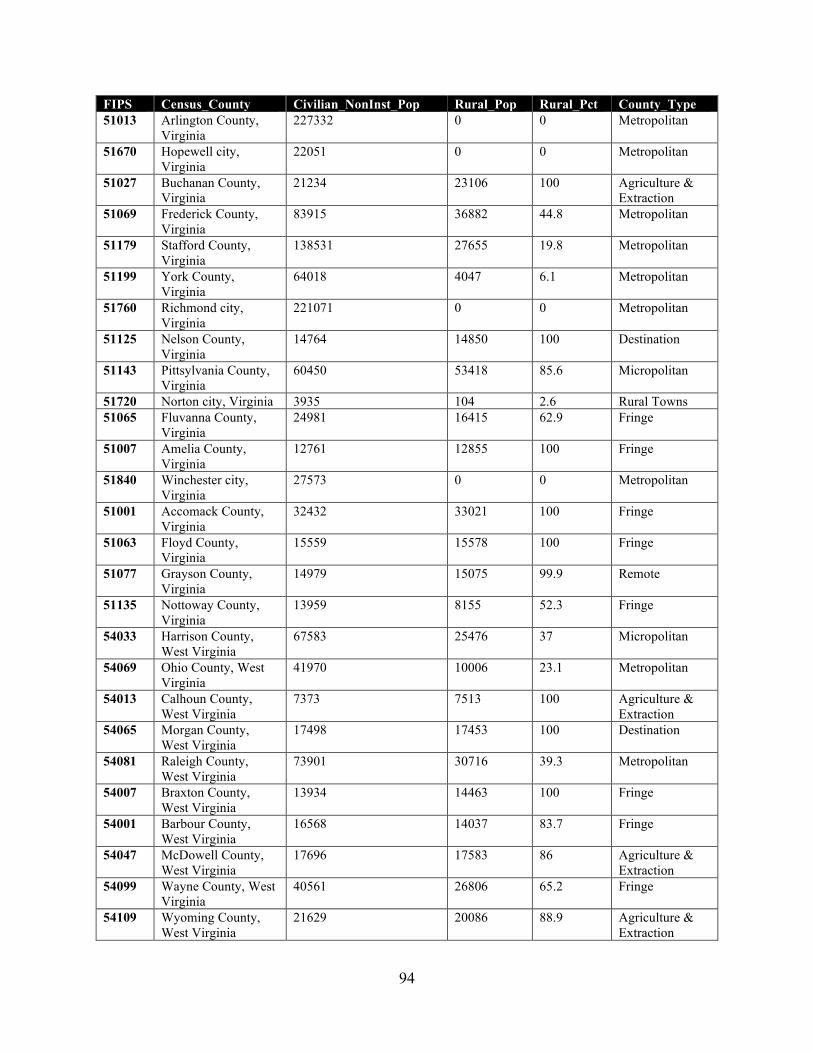
94
FIPS Census_County Civilian_NonInst_Pop Rural_Pop Rural_Pct County_Type 51013 Arlington County,
Virginia 227332 0 0 Metropolitan
51670 Hopewell city, Virginia
22051 0 0 Metropolitan
51027 Buchanan County, Virginia
21234 23106 100 Agriculture & Extraction
51069 Frederick County, Virginia
83915 36882 44.8 Metropolitan
51179 Stafford County, Virginia
138531 27655 19.8 Metropolitan
51199 York County, Virginia
64018 4047 6.1 Metropolitan
51760 Richmond city, Virginia
221071 0 0 Metropolitan
51125 Nelson County, Virginia
14764 14850 100 Destination
51143 Pittsylvania County, Virginia
60450 53418 85.6 Micropolitan
51720 Norton city, Virginia 3935 104 2.6 Rural Towns 51065 Fluvanna County,
Virginia 24981 16415 62.9 Fringe
51007 Amelia County, Virginia
12761 12855 100 Fringe
51840 Winchester city, Virginia
27573 0 0 Metropolitan
51001 Accomack County, Virginia
32432 33021 100 Fringe
51063 Floyd County, Virginia
15559 15578 100 Fringe
51077 Grayson County, Virginia
14979 15075 99.9 Remote
51135 Nottoway County, Virginia
13959 8155 52.3 Fringe
54033 Harrison County, West Virginia
67583 25476 37 Micropolitan
54069 Ohio County, West Virginia
41970 10006 23.1 Metropolitan
54013 Calhoun County, West Virginia
7373 7513 100 Agriculture & Extraction
54065 Morgan County, West Virginia
17498 17453 100 Destination
54081 Raleigh County, West Virginia
73901 30716 39.3 Metropolitan
54007 Braxton County, West Virginia
13934 14463 100 Fringe
54001 Barbour County, West Virginia
16568 14037 83.7 Fringe
54047 McDowell County, West Virginia
17696 17583 86 Agriculture & Extraction
54099 Wayne County, West Virginia
40561 26806 65.2 Fringe
54109 Wyoming County, West Virginia
21629 20086 88.9 Agriculture & Extraction
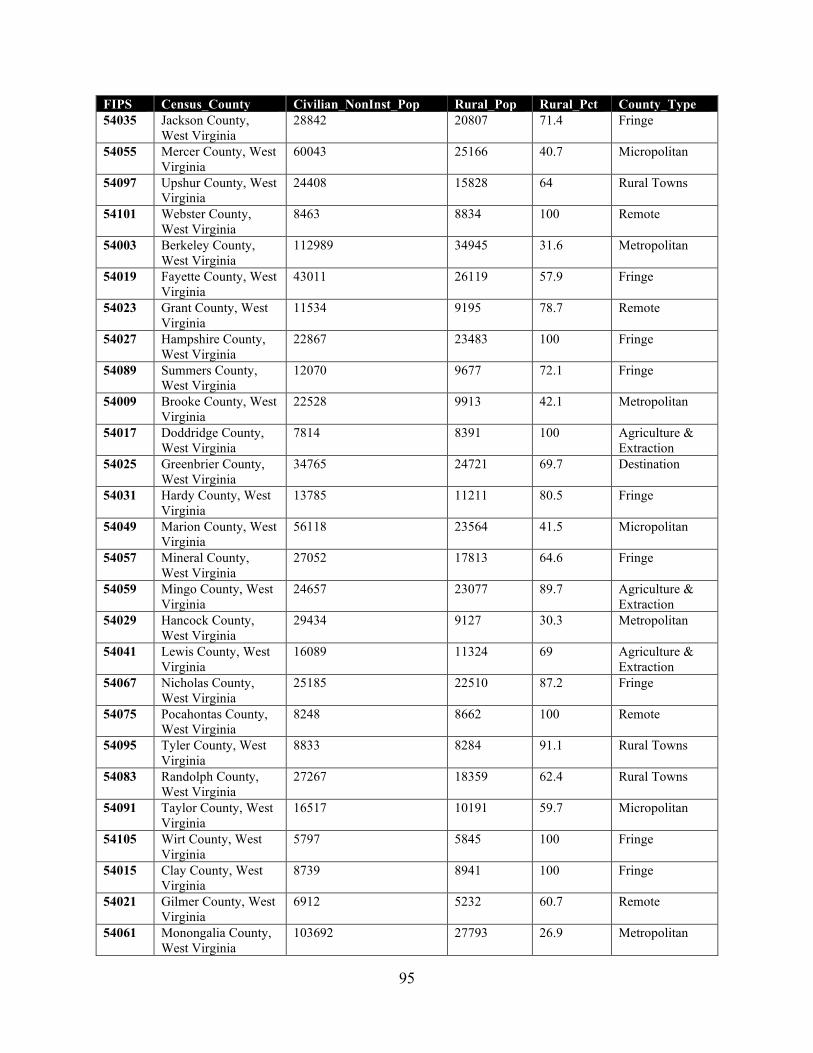
95
FIPS Census_County Civilian_NonInst_Pop Rural_Pop Rural_Pct County_Type 54035 Jackson County,
West Virginia 28842 20807 71.4 Fringe
54055 Mercer County, West Virginia
60043 25166 40.7 Micropolitan
54097 Upshur County, West Virginia
24408 15828 64 Rural Towns
54101 Webster County, West Virginia
8463 8834 100 Remote
54003 Berkeley County, West Virginia
112989 34945 31.6 Metropolitan
54019 Fayette County, West Virginia
43011 26119 57.9 Fringe
54023 Grant County, West Virginia
11534 9195 78.7 Remote
54027 Hampshire County, West Virginia
22867 23483 100 Fringe
54089 Summers County, West Virginia
12070 9677 72.1 Fringe
54009 Brooke County, West Virginia
22528 9913 42.1 Metropolitan
54017 Doddridge County, West Virginia
7814 8391 100 Agriculture & Extraction
54025 Greenbrier County, West Virginia
34765 24721 69.7 Destination
54031 Hardy County, West Virginia
13785 11211 80.5 Fringe
54049 Marion County, West Virginia
56118 23564 41.5 Micropolitan
54057 Mineral County, West Virginia
27052 17813 64.6 Fringe
54059 Mingo County, West Virginia
24657 23077 89.7 Agriculture & Extraction
54029 Hancock County, West Virginia
29434 9127 30.3 Metropolitan
54041 Lewis County, West Virginia
16089 11324 69 Agriculture & Extraction
54067 Nicholas County, West Virginia
25185 22510 87.2 Fringe
54075 Pocahontas County, West Virginia
8248 8662 100 Remote
54095 Tyler County, West Virginia
8833 8284 91.1 Rural Towns
54083 Randolph County, West Virginia
27267 18359 62.4 Rural Towns
54091 Taylor County, West Virginia
16517 10191 59.7 Micropolitan
54105 Wirt County, West Virginia
5797 5845 100 Fringe
54015 Clay County, West Virginia
8739 8941 100 Fringe
54021 Gilmer County, West Virginia
6912 5232 60.7 Remote
54061 Monongalia County, West Virginia
103692 27793 26.9 Metropolitan
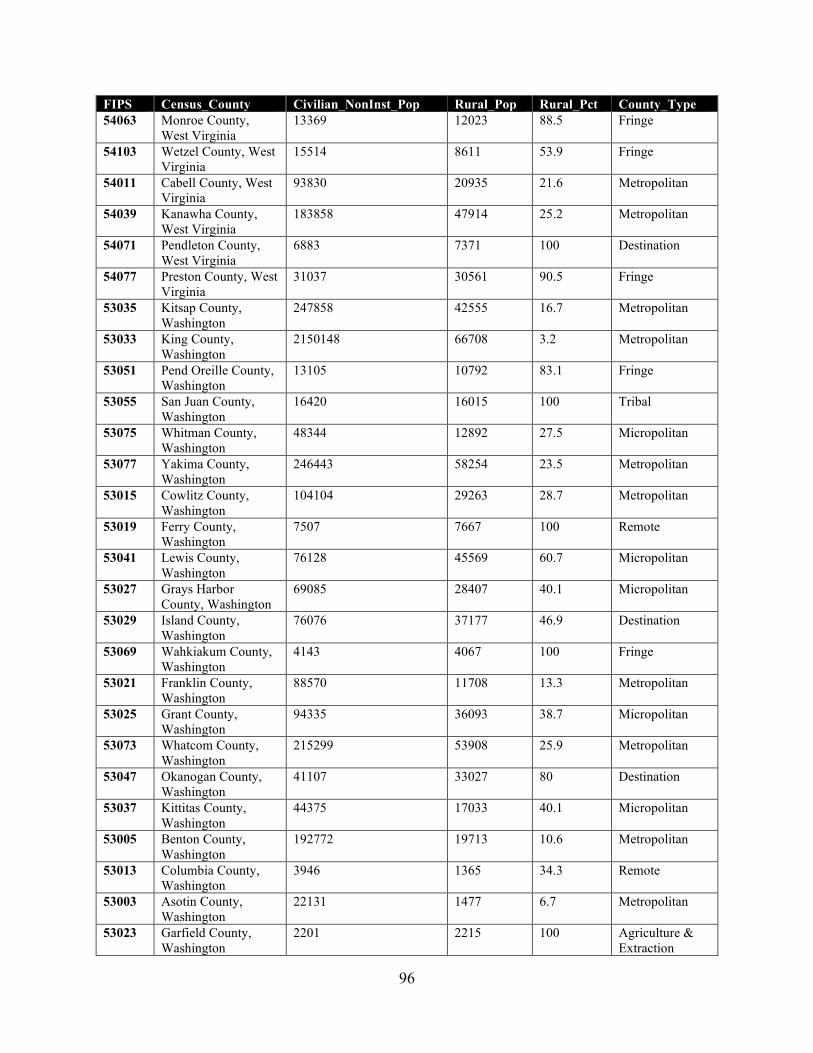
96
FIPS Census_County Civilian_NonInst_Pop Rural_Pop Rural_Pct County_Type 54063 Monroe County,
West Virginia 13369 12023 88.5 Fringe
54103 Wetzel County, West Virginia
15514 8611 53.9 Fringe
54011 Cabell County, West Virginia
93830 20935 21.6 Metropolitan
54039 Kanawha County, West Virginia
183858 47914 25.2 Metropolitan
54071 Pendleton County, West Virginia
6883 7371 100 Destination
54077 Preston County, West Virginia
31037 30561 90.5 Fringe
53035 Kitsap County, Washington
247858 42555 16.7 Metropolitan
53033 King County, Washington
2150148 66708 3.2 Metropolitan
53051 Pend Oreille County, Washington
13105 10792 83.1 Fringe
53055 San Juan County, Washington
16420 16015 100 Tribal
53075 Whitman County, Washington
48344 12892 27.5 Micropolitan
53077 Yakima County, Washington
246443 58254 23.5 Metropolitan
53015 Cowlitz County, Washington
104104 29263 28.7 Metropolitan
53019 Ferry County, Washington
7507 7667 100 Remote
53041 Lewis County, Washington
76128 45569 60.7 Micropolitan
53027 Grays Harbor County, Washington
69085 28407 40.1 Micropolitan
53029 Island County, Washington
76076 37177 46.9 Destination
53069 Wahkiakum County, Washington
4143 4067 100 Fringe
53021 Franklin County, Washington
88570 11708 13.3 Metropolitan
53025 Grant County, Washington
94335 36093 38.7 Micropolitan
53073 Whatcom County, Washington
215299 53908 25.9 Metropolitan
53047 Okanogan County, Washington
41107 33027 80 Destination
53037 Kittitas County, Washington
44375 17033 40.1 Micropolitan
53005 Benton County, Washington
192772 19713 10.6 Metropolitan
53013 Columbia County, Washington
3946 1365 34.3 Remote
53003 Asotin County, Washington
22131 1477 6.7 Metropolitan
53023 Garfield County, Washington
2201 2215 100 Agriculture & Extraction
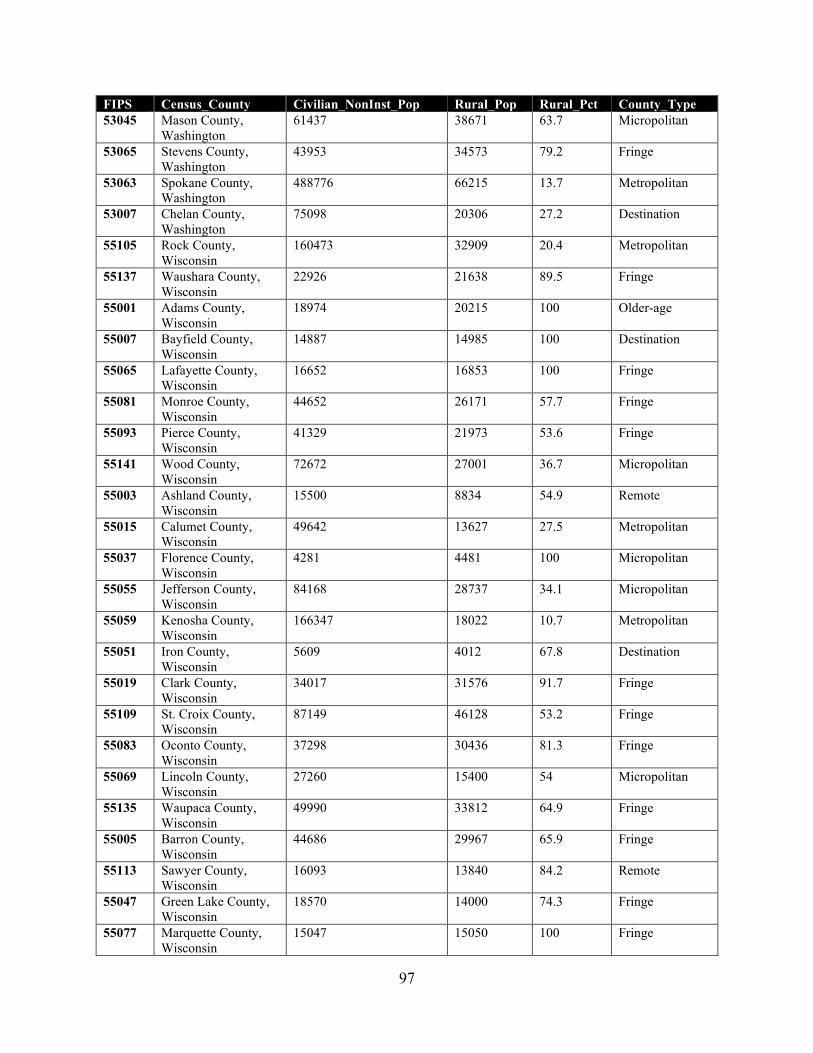
97
FIPS Census_County Civilian_NonInst_Pop Rural_Pop Rural_Pct County_Type 53045 Mason County,
Washington 61437 38671 63.7 Micropolitan
53065 Stevens County, Washington
43953 34573 79.2 Fringe
53063 Spokane County, Washington
488776 66215 13.7 Metropolitan
53007 Chelan County, Washington
75098 20306 27.2 Destination
55105 Rock County, Wisconsin
160473 32909 20.4 Metropolitan
55137 Waushara County, Wisconsin
22926 21638 89.5 Fringe
55001 Adams County, Wisconsin
18974 20215 100 Older-age
55007 Bayfield County, Wisconsin
14887 14985 100 Destination
55065 Lafayette County, Wisconsin
16652 16853 100 Fringe
55081 Monroe County, Wisconsin
44652 26171 57.7 Fringe
55093 Pierce County, Wisconsin
41329 21973 53.6 Fringe
55141 Wood County, Wisconsin
72672 27001 36.7 Micropolitan
55003 Ashland County, Wisconsin
15500 8834 54.9 Remote
55015 Calumet County, Wisconsin
49642 13627 27.5 Metropolitan
55037 Florence County, Wisconsin
4281 4481 100 Micropolitan
55055 Jefferson County, Wisconsin
84168 28737 34.1 Micropolitan
55059 Kenosha County, Wisconsin
166347 18022 10.7 Metropolitan
55051 Iron County, Wisconsin
5609 4012 67.8 Destination
55019 Clark County, Wisconsin
34017 31576 91.7 Fringe
55109 St. Croix County, Wisconsin
87149 46128 53.2 Fringe
55083 Oconto County, Wisconsin
37298 30436 81.3 Fringe
55069 Lincoln County, Wisconsin
27260 15400 54 Micropolitan
55135 Waupaca County, Wisconsin
49990 33812 64.9 Fringe
55005 Barron County, Wisconsin
44686 29967 65.9 Fringe
55113 Sawyer County, Wisconsin
16093 13840 84.2 Remote
55047 Green Lake County, Wisconsin
18570 14000 74.3 Fringe
55077 Marquette County, Wisconsin
15047 15050 100 Fringe
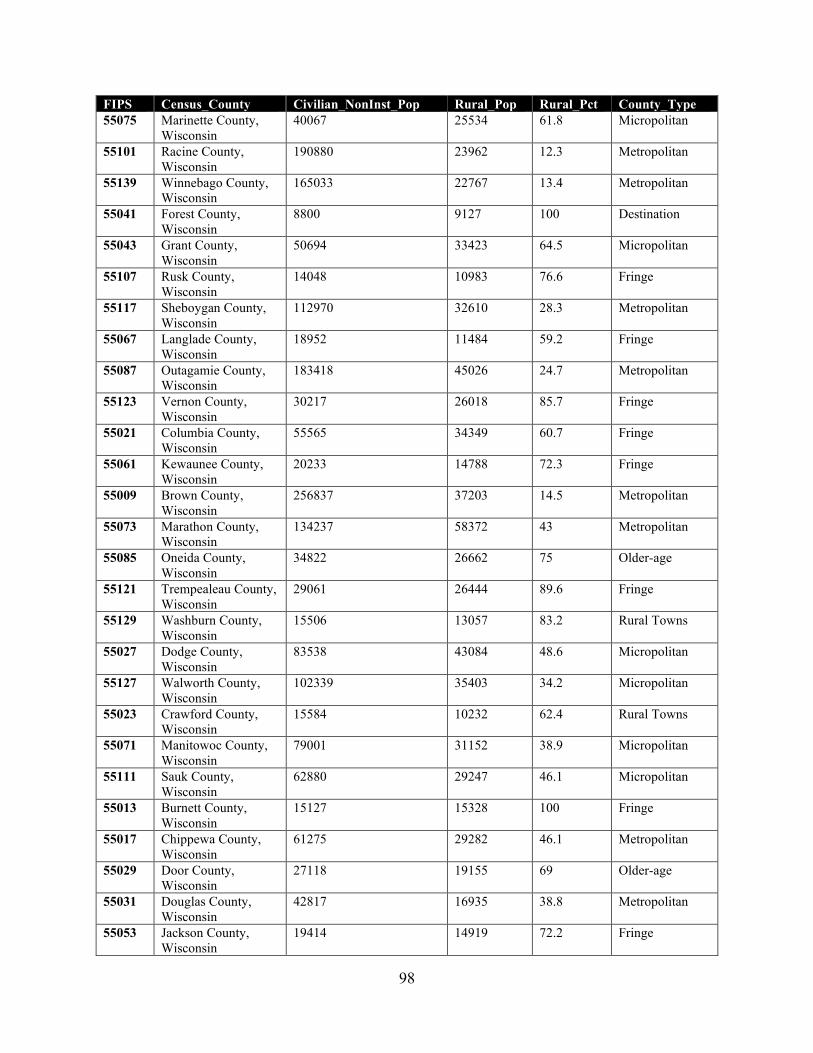
98
FIPS Census_County Civilian_NonInst_Pop Rural_Pop Rural_Pct County_Type 55075 Marinette County,
Wisconsin 40067 25534 61.8 Micropolitan
55101 Racine County, Wisconsin
190880 23962 12.3 Metropolitan
55139 Winnebago County, Wisconsin
165033 22767 13.4 Metropolitan
55041 Forest County, Wisconsin
8800 9127 100 Destination
55043 Grant County, Wisconsin
50694 33423 64.5 Micropolitan
55107 Rusk County, Wisconsin
14048 10983 76.6 Fringe
55117 Sheboygan County, Wisconsin
112970 32610 28.3 Metropolitan
55067 Langlade County, Wisconsin
18952 11484 59.2 Fringe
55087 Outagamie County, Wisconsin
183418 45026 24.7 Metropolitan
55123 Vernon County, Wisconsin
30217 26018 85.7 Fringe
55021 Columbia County, Wisconsin
55565 34349 60.7 Fringe
55061 Kewaunee County, Wisconsin
20233 14788 72.3 Fringe
55009 Brown County, Wisconsin
256837 37203 14.5 Metropolitan
55073 Marathon County, Wisconsin
134237 58372 43 Metropolitan
55085 Oneida County, Wisconsin
34822 26662 75 Older-age
55121 Trempealeau County, Wisconsin
29061 26444 89.6 Fringe
55129 Washburn County, Wisconsin
15506 13057 83.2 Rural Towns
55027 Dodge County, Wisconsin
83538 43084 48.6 Micropolitan
55127 Walworth County, Wisconsin
102339 35403 34.2 Micropolitan
55023 Crawford County, Wisconsin
15584 10232 62.4 Rural Towns
55071 Manitowoc County, Wisconsin
79001 31152 38.9 Micropolitan
55111 Sauk County, Wisconsin
62880 29247 46.1 Micropolitan
55013 Burnett County, Wisconsin
15127 15328 100 Fringe
55017 Chippewa County, Wisconsin
61275 29282 46.1 Metropolitan
55029 Door County, Wisconsin
27118 19155 69 Older-age
55031 Douglas County, Wisconsin
42817 16935 38.8 Metropolitan
55053 Jackson County, Wisconsin
19414 14919 72.2 Fringe
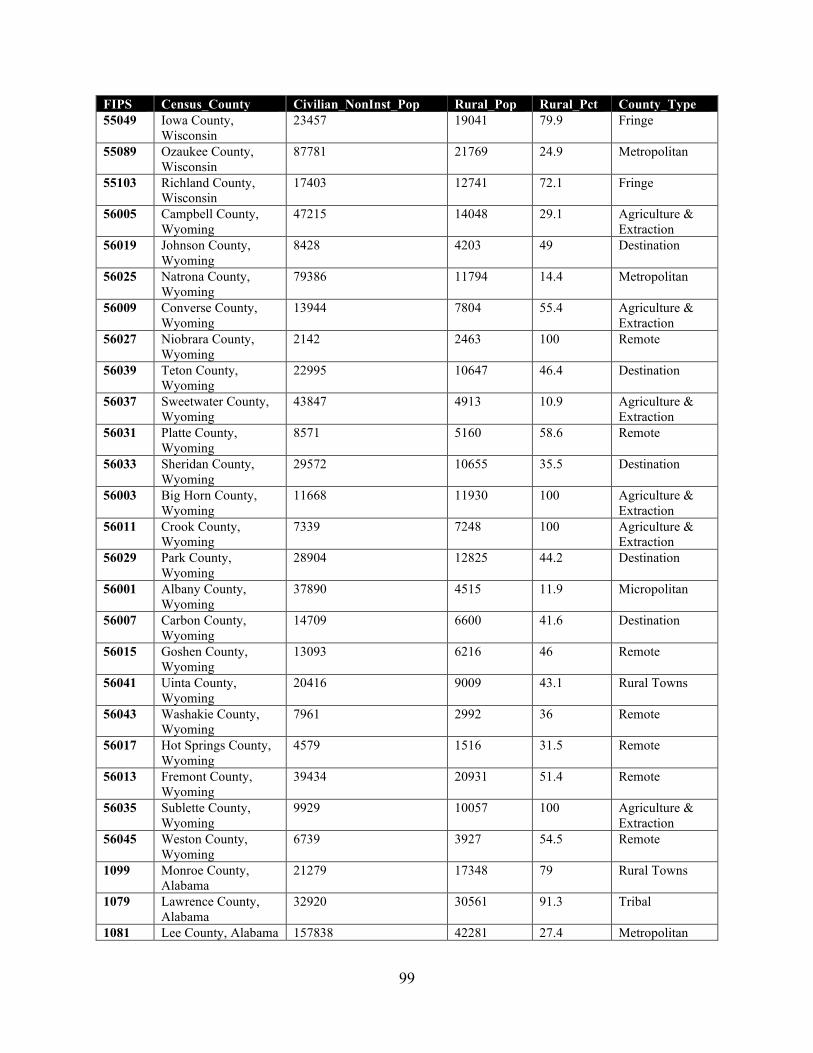
99
FIPS Census_County Civilian_NonInst_Pop Rural_Pop Rural_Pct County_Type 55049 Iowa County,
Wisconsin 23457 19041 79.9 Fringe
55089 Ozaukee County, Wisconsin
87781 21769 24.9 Metropolitan
55103 Richland County, Wisconsin
17403 12741 72.1 Fringe
56005 Campbell County, Wyoming
47215 14048 29.1 Agriculture & Extraction
56019 Johnson County, Wyoming
8428 4203 49 Destination
56025 Natrona County, Wyoming
79386 11794 14.4 Metropolitan
56009 Converse County, Wyoming
13944 7804 55.4 Agriculture & Extraction
56027 Niobrara County, Wyoming
2142 2463 100 Remote
56039 Teton County, Wyoming
22995 10647 46.4 Destination
56037 Sweetwater County, Wyoming
43847 4913 10.9 Agriculture & Extraction
56031 Platte County, Wyoming
8571 5160 58.6 Remote
56033 Sheridan County, Wyoming
29572 10655 35.5 Destination
56003 Big Horn County, Wyoming
11668 11930 100 Agriculture & Extraction
56011 Crook County, Wyoming
7339 7248 100 Agriculture & Extraction
56029 Park County, Wyoming
28904 12825 44.2 Destination
56001 Albany County, Wyoming
37890 4515 11.9 Micropolitan
56007 Carbon County, Wyoming
14709 6600 41.6 Destination
56015 Goshen County, Wyoming
13093 6216 46 Remote
56041 Uinta County, Wyoming
20416 9009 43.1 Rural Towns
56043 Washakie County, Wyoming
7961 2992 36 Remote
56017 Hot Springs County, Wyoming
4579 1516 31.5 Remote
56013 Fremont County, Wyoming
39434 20931 51.4 Remote
56035 Sublette County, Wyoming
9929 10057 100 Agriculture & Extraction
56045 Weston County, Wyoming
6739 3927 54.5 Remote
1099 Monroe County, Alabama
21279 17348 79 Rural Towns
1079 Lawrence County, Alabama
32920 30561 91.3 Tribal
1081 Lee County, Alabama 157838 42281 27.4 Metropolitan
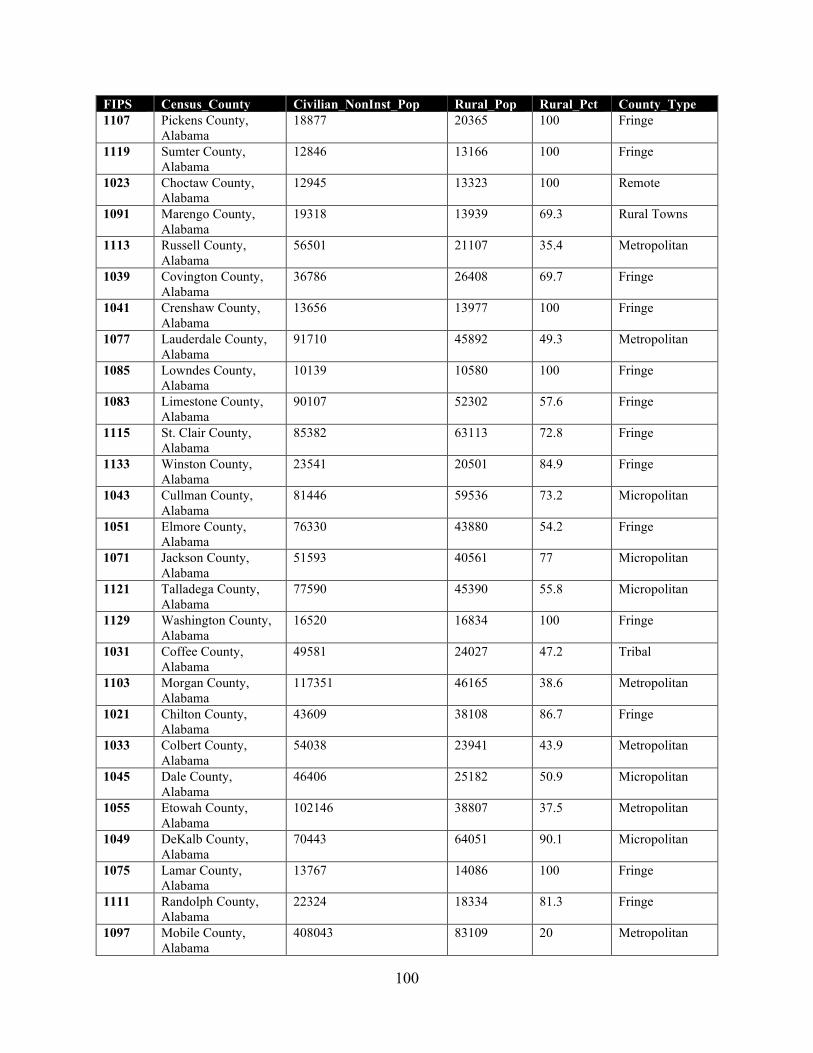
100
FIPS Census_County Civilian_NonInst_Pop Rural_Pop Rural_Pct County_Type 1107 Pickens County,
Alabama 18877 20365 100 Fringe
1119 Sumter County, Alabama
12846 13166 100 Fringe
1023 Choctaw County, Alabama
12945 13323 100 Remote
1091 Marengo County, Alabama
19318 13939 69.3 Rural Towns
1113 Russell County, Alabama
56501 21107 35.4 Metropolitan
1039 Covington County, Alabama
36786 26408 69.7 Fringe
1041 Crenshaw County, Alabama
13656 13977 100 Fringe
1077 Lauderdale County, Alabama
91710 45892 49.3 Metropolitan
1085 Lowndes County, Alabama
10139 10580 100 Fringe
1083 Limestone County, Alabama
90107 52302 57.6 Fringe
1115 St. Clair County, Alabama
85382 63113 72.8 Fringe
1133 Winston County, Alabama
23541 20501 84.9 Fringe
1043 Cullman County, Alabama
81446 59536 73.2 Micropolitan
1051 Elmore County, Alabama
76330 43880 54.2 Fringe
1071 Jackson County, Alabama
51593 40561 77 Micropolitan
1121 Talladega County, Alabama
77590 45390 55.8 Micropolitan
1129 Washington County, Alabama
16520 16834 100 Fringe
1031 Coffee County, Alabama
49581 24027 47.2 Tribal
1103 Morgan County, Alabama
117351 46165 38.6 Metropolitan
1021 Chilton County, Alabama
43609 38108 86.7 Fringe
1033 Colbert County, Alabama
54038 23941 43.9 Metropolitan
1045 Dale County, Alabama
46406 25182 50.9 Micropolitan
1055 Etowah County, Alabama
102146 38807 37.5 Metropolitan
1049 DeKalb County, Alabama
70443 64051 90.1 Micropolitan
1075 Lamar County, Alabama
13767 14086 100 Fringe
1111 Randolph County, Alabama
22324 18334 81.3 Fringe
1097 Mobile County, Alabama
408043 83109 20 Metropolitan
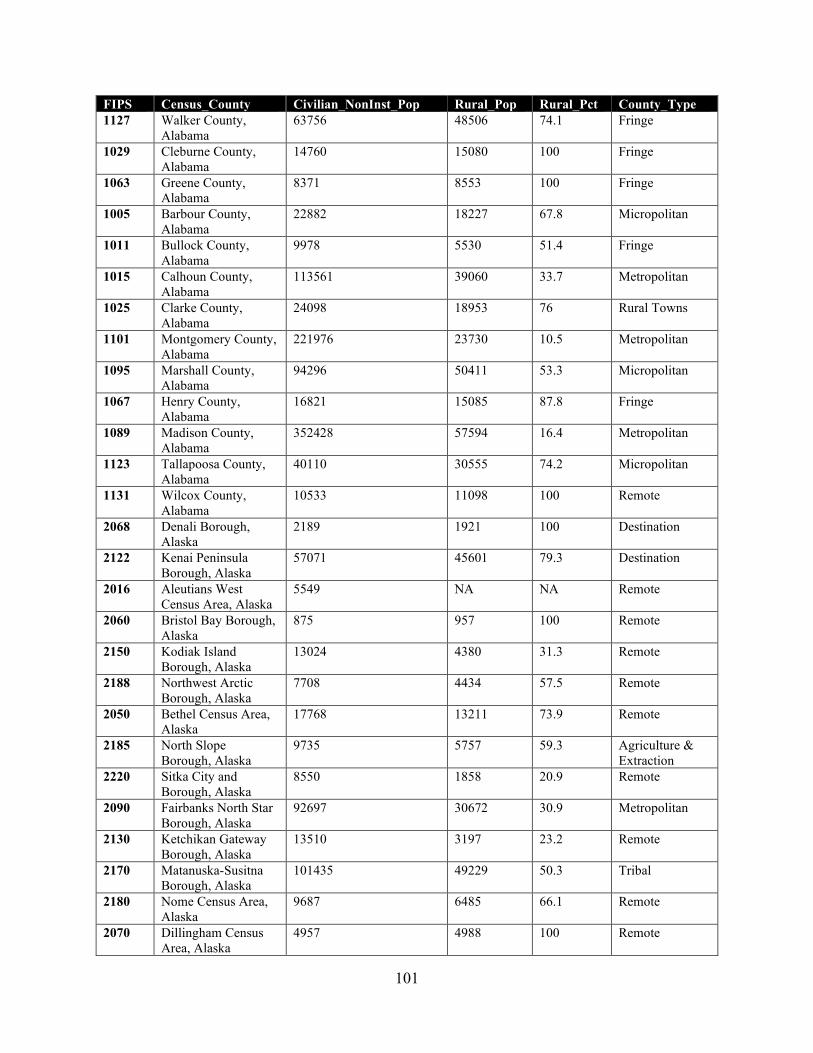
101
FIPS Census_County Civilian_NonInst_Pop Rural_Pop Rural_Pct County_Type 1127 Walker County,
Alabama 63756 48506 74.1 Fringe
1029 Cleburne County, Alabama
14760 15080 100 Fringe
1063 Greene County, Alabama
8371 8553 100 Fringe
1005 Barbour County, Alabama
22882 18227 67.8 Micropolitan
1011 Bullock County, Alabama
9978 5530 51.4 Fringe
1015 Calhoun County, Alabama
113561 39060 33.7 Metropolitan
1025 Clarke County, Alabama
24098 18953 76 Rural Towns
1101 Montgomery County, Alabama
221976 23730 10.5 Metropolitan
1095 Marshall County, Alabama
94296 50411 53.3 Micropolitan
1067 Henry County, Alabama
16821 15085 87.8 Fringe
1089 Madison County, Alabama
352428 57594 16.4 Metropolitan
1123 Tallapoosa County, Alabama
40110 30555 74.2 Micropolitan
1131 Wilcox County, Alabama
10533 11098 100 Remote
2068 Denali Borough, Alaska
2189 1921 100 Destination
2122 Kenai Peninsula Borough, Alaska
57071 45601 79.3 Destination
2016 Aleutians West Census Area, Alaska
5549 NA NA Remote
2060 Bristol Bay Borough, Alaska
875 957 100 Remote
2150 Kodiak Island Borough, Alaska
13024 4380 31.3 Remote
2188 Northwest Arctic Borough, Alaska
7708 4434 57.5 Remote
2050 Bethel Census Area, Alaska
17768 13211 73.9 Remote
2185 North Slope Borough, Alaska
9735 5757 59.3 Agriculture & Extraction
2220 Sitka City and Borough, Alaska
8550 1858 20.9 Remote
2090 Fairbanks North Star Borough, Alaska
92697 30672 30.9 Metropolitan
2130 Ketchikan Gateway Borough, Alaska
13510 3197 23.2 Remote
2170 Matanuska-Susitna Borough, Alaska
101435 49229 50.3 Tribal
2180 Nome Census Area, Alaska
9687 6485 66.1 Remote
2070 Dillingham Census Area, Alaska
4957 4988 100 Remote
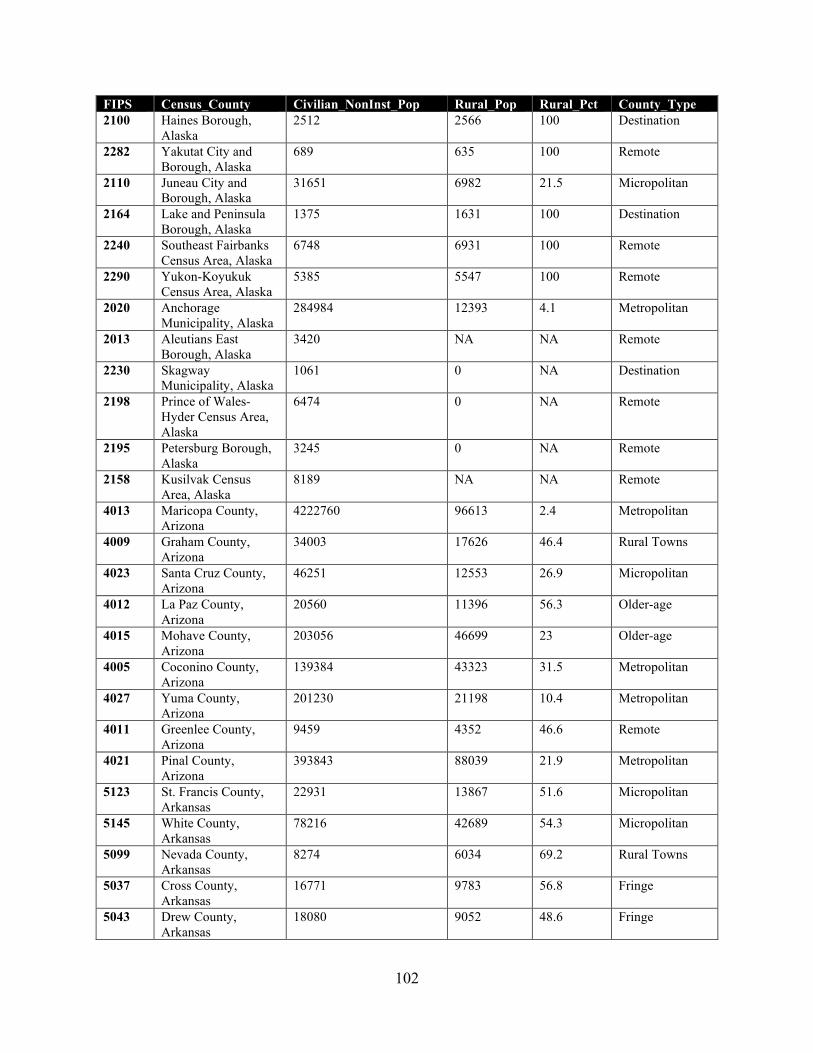
102
FIPS Census_County Civilian_NonInst_Pop Rural_Pop Rural_Pct County_Type 2100 Haines Borough,
Alaska 2512 2566 100 Destination
2282 Yakutat City and Borough, Alaska
689 635 100 Remote
2110 Juneau City and Borough, Alaska
31651 6982 21.5 Micropolitan
2164 Lake and Peninsula Borough, Alaska
1375 1631 100 Destination
2240 Southeast Fairbanks Census Area, Alaska
6748 6931 100 Remote
2290 Yukon-Koyukuk Census Area, Alaska
5385 5547 100 Remote
2020 Anchorage Municipality, Alaska
284984 12393 4.1 Metropolitan
2013 Aleutians East Borough, Alaska
3420 NA NA Remote
2230 Skagway Municipality, Alaska
1061 0 NA Destination
2198 Prince of Wales-Hyder Census Area, Alaska
6474 0 NA Remote
2195 Petersburg Borough, Alaska
3245 0 NA Remote
2158 Kusilvak Census Area, Alaska
8189 NA NA Remote
4013 Maricopa County, Arizona
4222760 96613 2.4 Metropolitan
4009 Graham County, Arizona
34003 17626 46.4 Rural Towns
4023 Santa Cruz County, Arizona
46251 12553 26.9 Micropolitan
4012 La Paz County, Arizona
20560 11396 56.3 Older-age
4015 Mohave County, Arizona
203056 46699 23 Older-age
4005 Coconino County, Arizona
139384 43323 31.5 Metropolitan
4027 Yuma County, Arizona
201230 21198 10.4 Metropolitan
4011 Greenlee County, Arizona
9459 4352 46.6 Remote
4021 Pinal County, Arizona
393843 88039 21.9 Metropolitan
5123 St. Francis County, Arkansas
22931 13867 51.6 Micropolitan
5145 White County, Arkansas
78216 42689 54.3 Micropolitan
5099 Nevada County, Arkansas
8274 6034 69.2 Rural Towns
5037 Cross County, Arkansas
16771 9783 56.8 Fringe
5043 Drew County, Arkansas
18080 9052 48.6 Fringe
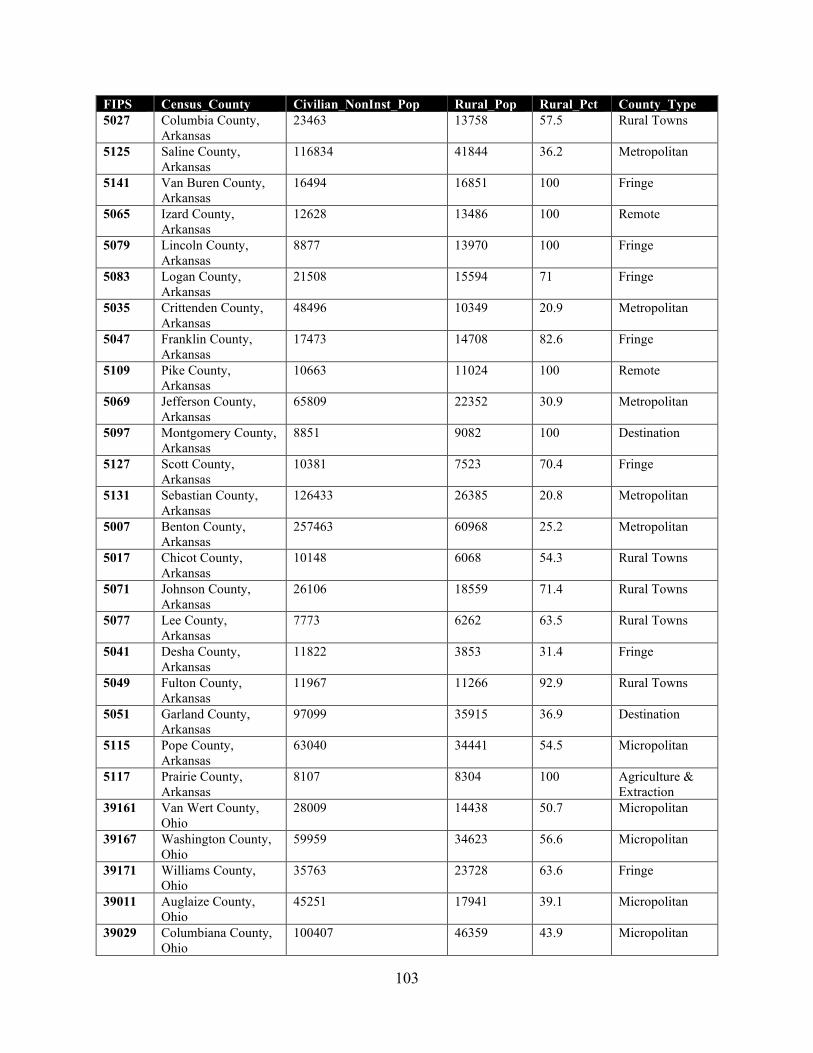
103
FIPS Census_County Civilian_NonInst_Pop Rural_Pop Rural_Pct County_Type 5027 Columbia County,
Arkansas 23463 13758 57.5 Rural Towns
5125 Saline County, Arkansas
116834 41844 36.2 Metropolitan
5141 Van Buren County, Arkansas
16494 16851 100 Fringe
5065 Izard County, Arkansas
12628 13486 100 Remote
5079 Lincoln County, Arkansas
8877 13970 100 Fringe
5083 Logan County, Arkansas
21508 15594 71 Fringe
5035 Crittenden County, Arkansas
48496 10349 20.9 Metropolitan
5047 Franklin County, Arkansas
17473 14708 82.6 Fringe
5109 Pike County, Arkansas
10663 11024 100 Remote
5069 Jefferson County, Arkansas
65809 22352 30.9 Metropolitan
5097 Montgomery County, Arkansas
8851 9082 100 Destination
5127 Scott County, Arkansas
10381 7523 70.4 Fringe
5131 Sebastian County, Arkansas
126433 26385 20.8 Metropolitan
5007 Benton County, Arkansas
257463 60968 25.2 Metropolitan
5017 Chicot County, Arkansas
10148 6068 54.3 Rural Towns
5071 Johnson County, Arkansas
26106 18559 71.4 Rural Towns
5077 Lee County, Arkansas
7773 6262 63.5 Rural Towns
5041 Desha County, Arkansas
11822 3853 31.4 Fringe
5049 Fulton County, Arkansas
11967 11266 92.9 Rural Towns
5051 Garland County, Arkansas
97099 35915 36.9 Destination
5115 Pope County, Arkansas
63040 34441 54.5 Micropolitan
5117 Prairie County, Arkansas
8107 8304 100 Agriculture & Extraction
39161 Van Wert County, Ohio
28009 14438 50.7 Micropolitan
39167 Washington County, Ohio
59959 34623 56.6 Micropolitan
39171 Williams County, Ohio
35763 23728 63.6 Fringe
39011 Auglaize County, Ohio
45251 17941 39.1 Micropolitan
39029 Columbiana County, Ohio
100407 46359 43.9 Micropolitan
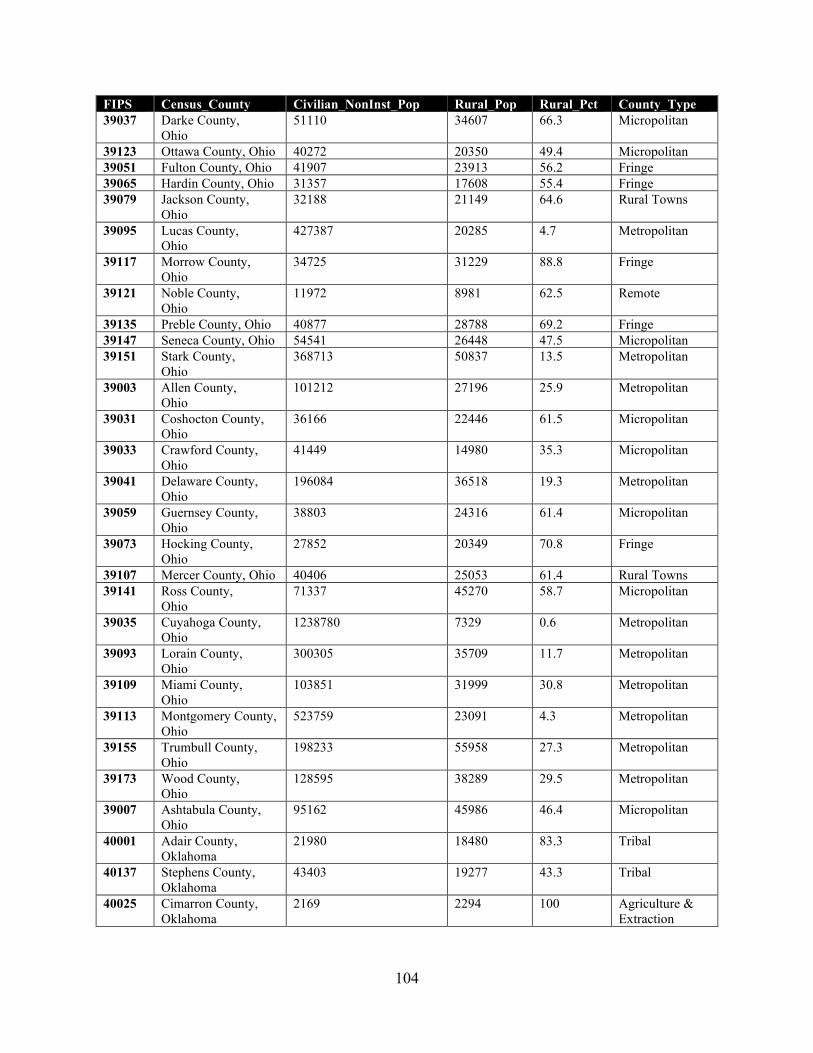
104
FIPS Census_County Civilian_NonInst_Pop Rural_Pop Rural_Pct County_Type 39037 Darke County,
Ohio 51110 34607 66.3 Micropolitan
39123 Ottawa County, Ohio 40272 20350 49.4 Micropolitan 39051 Fulton County, Ohio 41907 23913 56.2 Fringe 39065 Hardin County, Ohio 31357 17608 55.4 Fringe 39079 Jackson County,
Ohio 32188 21149 64.6 Rural Towns
39095 Lucas County, Ohio
427387 20285 4.7 Metropolitan
39117 Morrow County, Ohio
34725 31229 88.8 Fringe
39121 Noble County, Ohio
11972 8981 62.5 Remote
39135 Preble County, Ohio 40877 28788 69.2 Fringe 39147 Seneca County, Ohio 54541 26448 47.5 Micropolitan 39151 Stark County,
Ohio 368713 50837 13.5 Metropolitan
39003 Allen County, Ohio
101212 27196 25.9 Metropolitan
39031 Coshocton County, Ohio
36166 22446 61.5 Micropolitan
39033 Crawford County, Ohio
41449 14980 35.3 Micropolitan
39041 Delaware County, Ohio
196084 36518 19.3 Metropolitan
39059 Guernsey County, Ohio
38803 24316 61.4 Micropolitan
39073 Hocking County, Ohio
27852 20349 70.8 Fringe
39107 Mercer County, Ohio 40406 25053 61.4 Rural Towns 39141 Ross County,
Ohio 71337 45270 58.7 Micropolitan
39035 Cuyahoga County, Ohio
1238780 7329 0.6 Metropolitan
39093 Lorain County, Ohio
300305 35709 11.7 Metropolitan
39109 Miami County, Ohio
103851 31999 30.8 Metropolitan
39113 Montgomery County, Ohio
523759 23091 4.3 Metropolitan
39155 Trumbull County, Ohio
198233 55958 27.3 Metropolitan
39173 Wood County, Ohio
128595 38289 29.5 Metropolitan
39007 Ashtabula County, Ohio
95162 45986 46.4 Micropolitan
40001 Adair County, Oklahoma
21980 18480 83.3 Tribal
40137 Stephens County, Oklahoma
43403 19277 43.3 Tribal
40025 Cimarron County, Oklahoma
2169 2294 100 Agriculture & Extraction
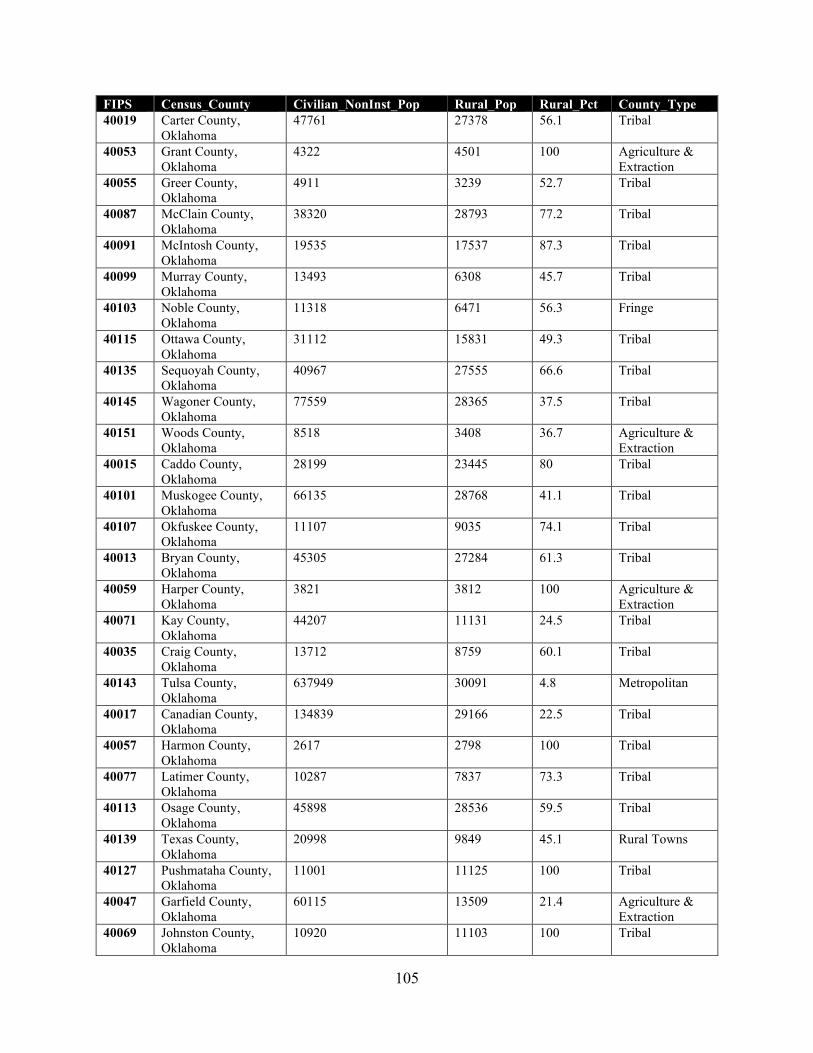
105
FIPS Census_County Civilian_NonInst_Pop Rural_Pop Rural_Pct County_Type 40019 Carter County,
Oklahoma 47761 27378 56.1 Tribal
40053 Grant County, Oklahoma
4322 4501 100 Agriculture & Extraction
40055 Greer County, Oklahoma
4911 3239 52.7 Tribal
40087 McClain County, Oklahoma
38320 28793 77.2 Tribal
40091 McIntosh County, Oklahoma
19535 17537 87.3 Tribal
40099 Murray County, Oklahoma
13493 6308 45.7 Tribal
40103 Noble County, Oklahoma
11318 6471 56.3 Fringe
40115 Ottawa County, Oklahoma
31112 15831 49.3 Tribal
40135 Sequoyah County, Oklahoma
40967 27555 66.6 Tribal
40145 Wagoner County, Oklahoma
77559 28365 37.5 Tribal
40151 Woods County, Oklahoma
8518 3408 36.7 Agriculture & Extraction
40015 Caddo County, Oklahoma
28199 23445 80 Tribal
40101 Muskogee County, Oklahoma
66135 28768 41.1 Tribal
40107 Okfuskee County, Oklahoma
11107 9035 74.1 Tribal
40013 Bryan County, Oklahoma
45305 27284 61.3 Tribal
40059 Harper County, Oklahoma
3821 3812 100 Agriculture & Extraction
40071 Kay County, Oklahoma
44207 11131 24.5 Tribal
40035 Craig County, Oklahoma
13712 8759 60.1 Tribal
40143 Tulsa County, Oklahoma
637949 30091 4.8 Metropolitan
40017 Canadian County, Oklahoma
134839 29166 22.5 Tribal
40057 Harmon County, Oklahoma
2617 2798 100 Tribal
40077 Latimer County, Oklahoma
10287 7837 73.3 Tribal
40113 Osage County, Oklahoma
45898 28536 59.5 Tribal
40139 Texas County, Oklahoma
20998 9849 45.1 Rural Towns
40127 Pushmataha County, Oklahoma
11001 11125 100 Tribal
40047 Garfield County, Oklahoma
60115 13509 21.4 Agriculture & Extraction
40069 Johnston County, Oklahoma
10920 11103 100 Tribal
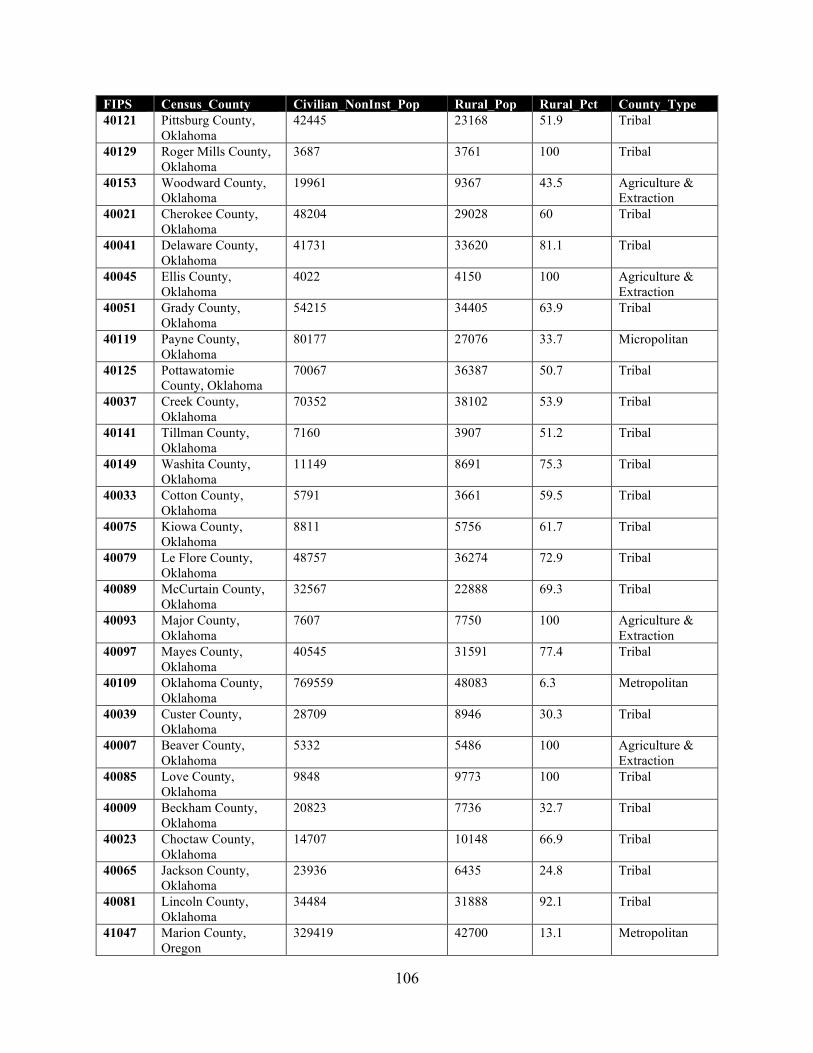
106
FIPS Census_County Civilian_NonInst_Pop Rural_Pop Rural_Pct County_Type 40121 Pittsburg County,
Oklahoma 42445 23168 51.9 Tribal
40129 Roger Mills County, Oklahoma
3687 3761 100 Tribal
40153 Woodward County, Oklahoma
19961 9367 43.5 Agriculture & Extraction
40021 Cherokee County, Oklahoma
48204 29028 60 Tribal
40041 Delaware County, Oklahoma
41731 33620 81.1 Tribal
40045 Ellis County, Oklahoma
4022 4150 100 Agriculture & Extraction
40051 Grady County, Oklahoma
54215 34405 63.9 Tribal
40119 Payne County, Oklahoma
80177 27076 33.7 Micropolitan
40125 Pottawatomie County, Oklahoma
70067 36387 50.7 Tribal
40037 Creek County, Oklahoma
70352 38102 53.9 Tribal
40141 Tillman County, Oklahoma
7160 3907 51.2 Tribal
40149 Washita County, Oklahoma
11149 8691 75.3 Tribal
40033 Cotton County, Oklahoma
5791 3661 59.5 Tribal
40075 Kiowa County, Oklahoma
8811 5756 61.7 Tribal
40079 Le Flore County, Oklahoma
48757 36274 72.9 Tribal
40089 McCurtain County, Oklahoma
32567 22888 69.3 Tribal
40093 Major County, Oklahoma
7607 7750 100 Agriculture & Extraction
40097 Mayes County, Oklahoma
40545 31591 77.4 Tribal
40109 Oklahoma County, Oklahoma
769559 48083 6.3 Metropolitan
40039 Custer County, Oklahoma
28709 8946 30.3 Tribal
40007 Beaver County, Oklahoma
5332 5486 100 Agriculture & Extraction
40085 Love County, Oklahoma
9848 9773 100 Tribal
40009 Beckham County, Oklahoma
20823 7736 32.7 Tribal
40023 Choctaw County, Oklahoma
14707 10148 66.9 Tribal
40065 Jackson County, Oklahoma
23936 6435 24.8 Tribal
40081 Lincoln County, Oklahoma
34484 31888 92.1 Tribal
41047 Marion County, Oregon
329419 42700 13.1 Metropolitan
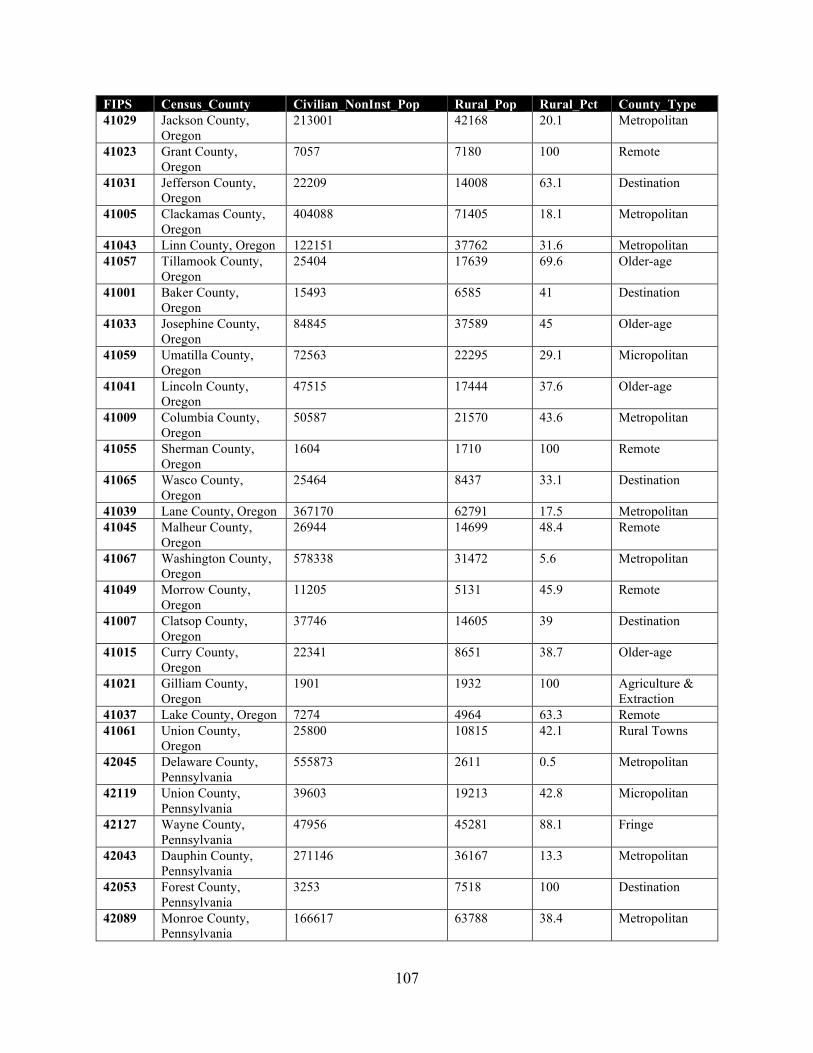
107
FIPS Census_County Civilian_NonInst_Pop Rural_Pop Rural_Pct County_Type 41029 Jackson County,
Oregon 213001 42168 20.1 Metropolitan
41023 Grant County, Oregon
7057 7180 100 Remote
41031 Jefferson County, Oregon
22209 14008 63.1 Destination
41005 Clackamas County, Oregon
404088 71405 18.1 Metropolitan
41043 Linn County, Oregon 122151 37762 31.6 Metropolitan 41057 Tillamook County,
Oregon 25404 17639 69.6 Older-age
41001 Baker County, Oregon
15493 6585 41 Destination
41033 Josephine County, Oregon
84845 37589 45 Older-age
41059 Umatilla County, Oregon
72563 22295 29.1 Micropolitan
41041 Lincoln County, Oregon
47515 17444 37.6 Older-age
41009 Columbia County, Oregon
50587 21570 43.6 Metropolitan
41055 Sherman County, Oregon
1604 1710 100 Remote
41065 Wasco County, Oregon
25464 8437 33.1 Destination
41039 Lane County, Oregon 367170 62791 17.5 Metropolitan 41045 Malheur County,
Oregon 26944 14699 48.4 Remote
41067 Washington County, Oregon
578338 31472 5.6 Metropolitan
41049 Morrow County, Oregon
11205 5131 45.9 Remote
41007 Clatsop County, Oregon
37746 14605 39 Destination
41015 Curry County, Oregon
22341 8651 38.7 Older-age
41021 Gilliam County, Oregon
1901 1932 100 Agriculture & Extraction
41037 Lake County, Oregon 7274 4964 63.3 Remote 41061 Union County,
Oregon 25800 10815 42.1 Rural Towns
42045 Delaware County, Pennsylvania
555873 2611 0.5 Metropolitan
42119 Union County, Pennsylvania
39603 19213 42.8 Micropolitan
42127 Wayne County, Pennsylvania
47956 45281 88.1 Fringe
42043 Dauphin County, Pennsylvania
271146 36167 13.3 Metropolitan
42053 Forest County, Pennsylvania
3253 7518 100 Destination
42089 Monroe County, Pennsylvania
166617 63788 38.4 Metropolitan
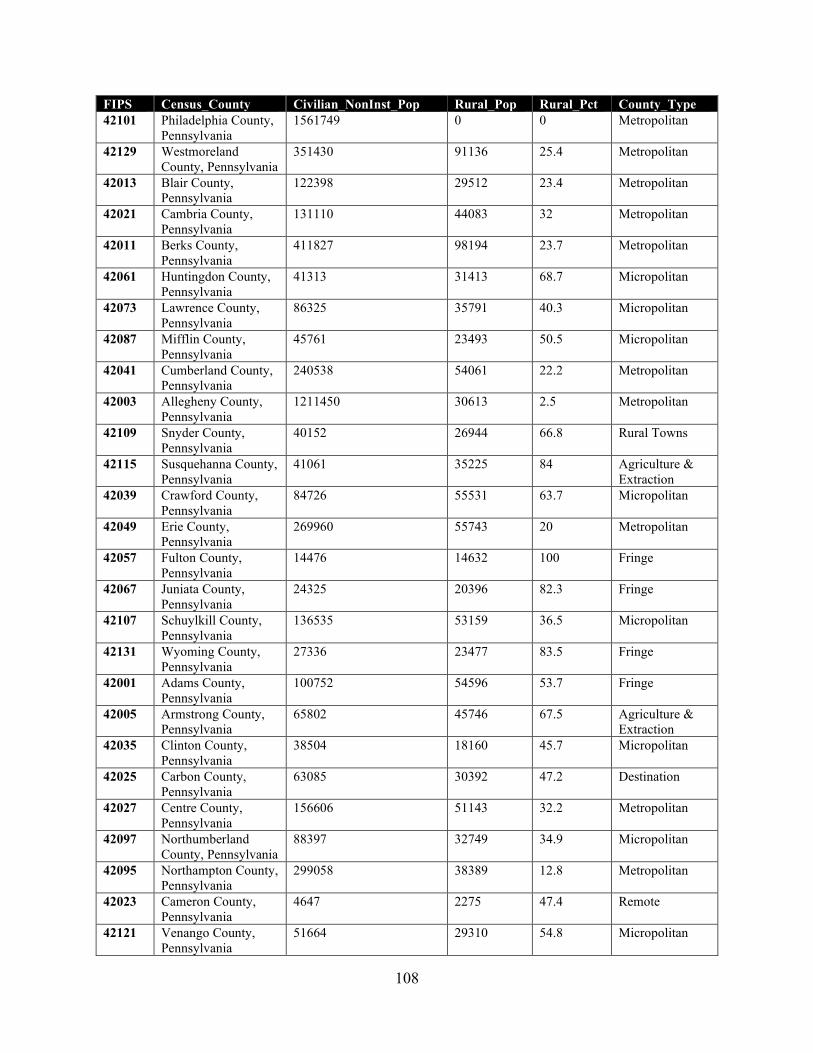
108
FIPS Census_County Civilian_NonInst_Pop Rural_Pop Rural_Pct County_Type 42101 Philadelphia County,
Pennsylvania 1561749 0 0 Metropolitan
42129 Westmoreland County, Pennsylvania
351430 91136 25.4 Metropolitan
42013 Blair County, Pennsylvania
122398 29512 23.4 Metropolitan
42021 Cambria County, Pennsylvania
131110 44083 32 Metropolitan
42011 Berks County, Pennsylvania
411827 98194 23.7 Metropolitan
42061 Huntingdon County, Pennsylvania
41313 31413 68.7 Micropolitan
42073 Lawrence County, Pennsylvania
86325 35791 40.3 Micropolitan
42087 Mifflin County, Pennsylvania
45761 23493 50.5 Micropolitan
42041 Cumberland County, Pennsylvania
240538 54061 22.2 Metropolitan
42003 Allegheny County, Pennsylvania
1211450 30613 2.5 Metropolitan
42109 Snyder County, Pennsylvania
40152 26944 66.8 Rural Towns
42115 Susquehanna County, Pennsylvania
41061 35225 84 Agriculture & Extraction
42039 Crawford County, Pennsylvania
84726 55531 63.7 Micropolitan
42049 Erie County, Pennsylvania
269960 55743 20 Metropolitan
42057 Fulton County, Pennsylvania
14476 14632 100 Fringe
42067 Juniata County, Pennsylvania
24325 20396 82.3 Fringe
42107 Schuylkill County, Pennsylvania
136535 53159 36.5 Micropolitan
42131 Wyoming County, Pennsylvania
27336 23477 83.5 Fringe
42001 Adams County, Pennsylvania
100752 54596 53.7 Fringe
42005 Armstrong County, Pennsylvania
65802 45746 67.5 Agriculture & Extraction
42035 Clinton County, Pennsylvania
38504 18160 45.7 Micropolitan
42025 Carbon County, Pennsylvania
63085 30392 47.2 Destination
42027 Centre County, Pennsylvania
156606 51143 32.2 Metropolitan
42097 Northumberland County, Pennsylvania
88397 32749 34.9 Micropolitan
42095 Northampton County, Pennsylvania
299058 38389 12.8 Metropolitan
42023 Cameron County, Pennsylvania
4647 2275 47.4 Remote
42121 Venango County, Pennsylvania
51664 29310 54.8 Micropolitan
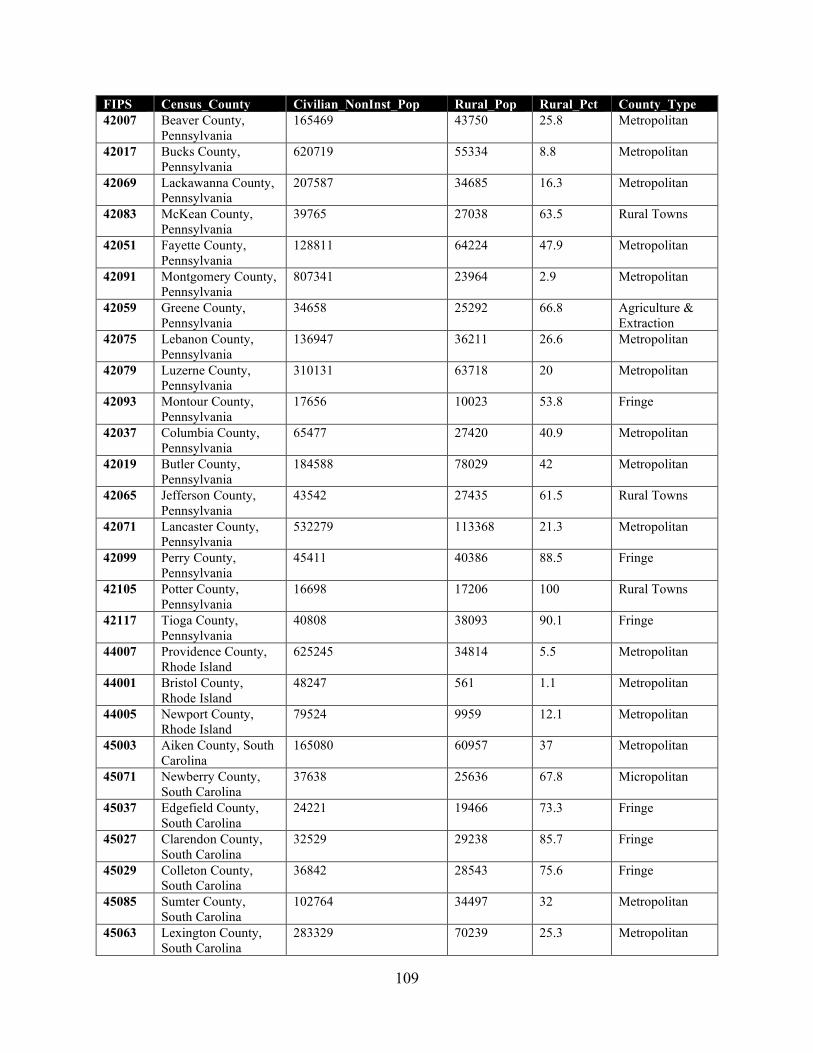
109
FIPS Census_County Civilian_NonInst_Pop Rural_Pop Rural_Pct County_Type 42007 Beaver County,
Pennsylvania 165469 43750 25.8 Metropolitan
42017 Bucks County, Pennsylvania
620719 55334 8.8 Metropolitan
42069 Lackawanna County, Pennsylvania
207587 34685 16.3 Metropolitan
42083 McKean County, Pennsylvania
39765 27038 63.5 Rural Towns
42051 Fayette County, Pennsylvania
128811 64224 47.9 Metropolitan
42091 Montgomery County, Pennsylvania
807341 23964 2.9 Metropolitan
42059 Greene County, Pennsylvania
34658 25292 66.8 Agriculture & Extraction
42075 Lebanon County, Pennsylvania
136947 36211 26.6 Metropolitan
42079 Luzerne County, Pennsylvania
310131 63718 20 Metropolitan
42093 Montour County, Pennsylvania
17656 10023 53.8 Fringe
42037 Columbia County, Pennsylvania
65477 27420 40.9 Metropolitan
42019 Butler County, Pennsylvania
184588 78029 42 Metropolitan
42065 Jefferson County, Pennsylvania
43542 27435 61.5 Rural Towns
42071 Lancaster County, Pennsylvania
532279 113368 21.3 Metropolitan
42099 Perry County, Pennsylvania
45411 40386 88.5 Fringe
42105 Potter County, Pennsylvania
16698 17206 100 Rural Towns
42117 Tioga County, Pennsylvania
40808 38093 90.1 Fringe
44007 Providence County, Rhode Island
625245 34814 5.5 Metropolitan
44001 Bristol County, Rhode Island
48247 561 1.1 Metropolitan
44005 Newport County, Rhode Island
79524 9959 12.1 Metropolitan
45003 Aiken County, South Carolina
165080 60957 37 Metropolitan
45071 Newberry County, South Carolina
37638 25636 67.8 Micropolitan
45037 Edgefield County, South Carolina
24221 19466 73.3 Fringe
45027 Clarendon County, South Carolina
32529 29238 85.7 Fringe
45029 Colleton County, South Carolina
36842 28543 75.6 Fringe
45085 Sumter County, South Carolina
102764 34497 32 Metropolitan
45063 Lexington County, South Carolina
283329 70239 25.3 Metropolitan
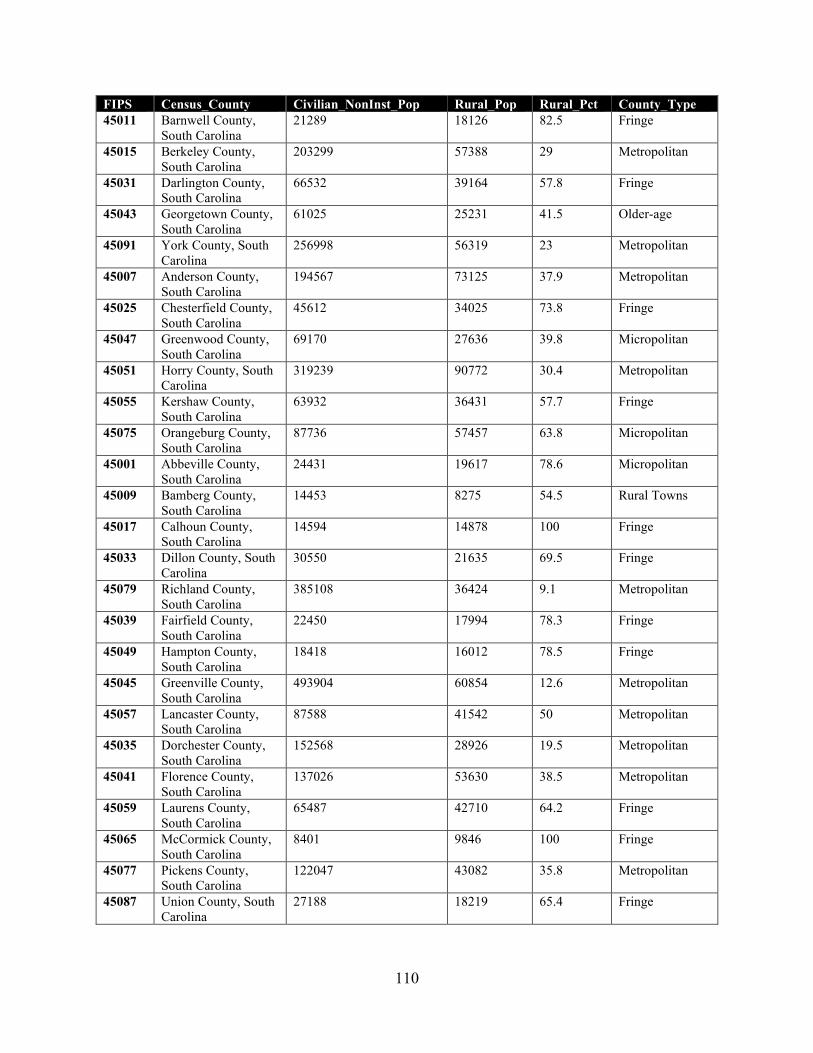
110
FIPS Census_County Civilian_NonInst_Pop Rural_Pop Rural_Pct County_Type 45011 Barnwell County,
South Carolina 21289 18126 82.5 Fringe
45015 Berkeley County, South Carolina
203299 57388 29 Metropolitan
45031 Darlington County, South Carolina
66532 39164 57.8 Fringe
45043 Georgetown County, South Carolina
61025 25231 41.5 Older-age
45091 York County, South Carolina
256998 56319 23 Metropolitan
45007 Anderson County, South Carolina
194567 73125 37.9 Metropolitan
45025 Chesterfield County, South Carolina
45612 34025 73.8 Fringe
45047 Greenwood County, South Carolina
69170 27636 39.8 Micropolitan
45051 Horry County, South Carolina
319239 90772 30.4 Metropolitan
45055 Kershaw County, South Carolina
63932 36431 57.7 Fringe
45075 Orangeburg County, South Carolina
87736 57457 63.8 Micropolitan
45001 Abbeville County, South Carolina
24431 19617 78.6 Micropolitan
45009 Bamberg County, South Carolina
14453 8275 54.5 Rural Towns
45017 Calhoun County, South Carolina
14594 14878 100 Fringe
45033 Dillon County, South Carolina
30550 21635 69.5 Fringe
45079 Richland County, South Carolina
385108 36424 9.1 Metropolitan
45039 Fairfield County, South Carolina
22450 17994 78.3 Fringe
45049 Hampton County, South Carolina
18418 16012 78.5 Fringe
45045 Greenville County, South Carolina
493904 60854 12.6 Metropolitan
45057 Lancaster County, South Carolina
87588 41542 50 Metropolitan
45035 Dorchester County, South Carolina
152568 28926 19.5 Metropolitan
45041 Florence County, South Carolina
137026 53630 38.5 Metropolitan
45059 Laurens County, South Carolina
65487 42710 64.2 Fringe
45065 McCormick County, South Carolina
8401 9846 100 Fringe
45077 Pickens County, South Carolina
122047 43082 35.8 Metropolitan
45087 Union County, South Carolina
27188 18219 65.4 Fringe
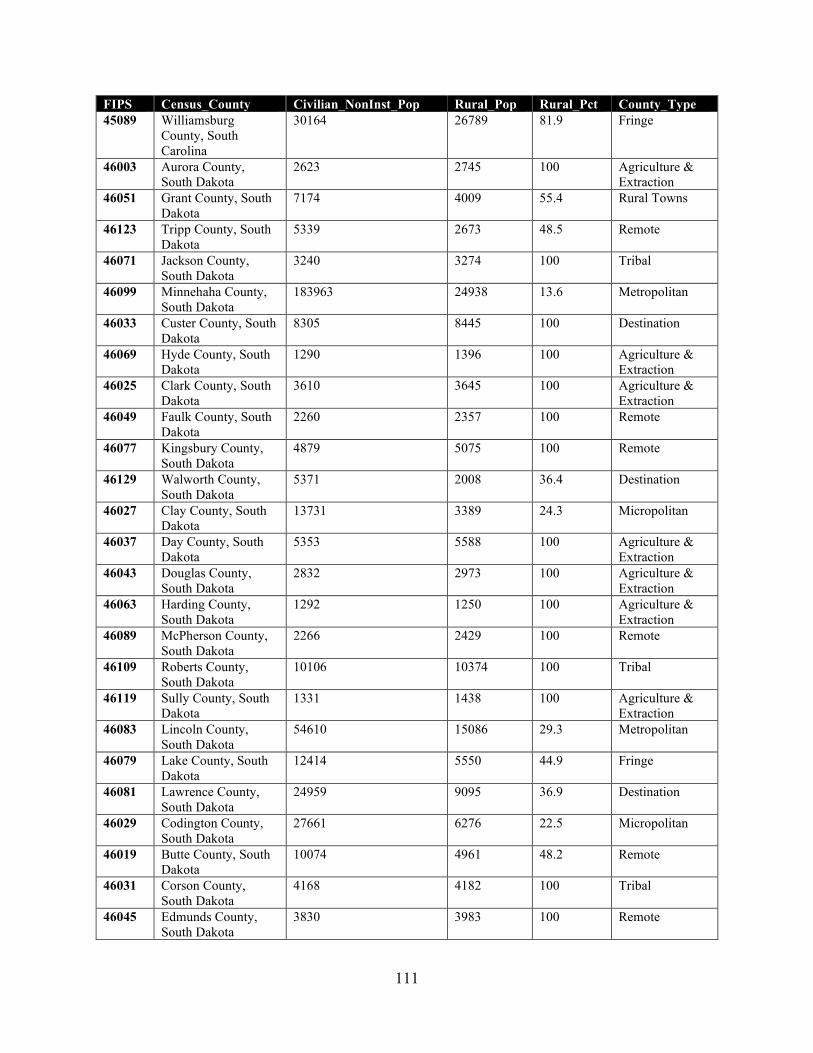
111
FIPS Census_County Civilian_NonInst_Pop Rural_Pop Rural_Pct County_Type 45089 Williamsburg
County, South Carolina
30164 26789 81.9 Fringe
46003 Aurora County, South Dakota
2623 2745 100 Agriculture & Extraction
46051 Grant County, South Dakota
7174 4009 55.4 Rural Towns
46123 Tripp County, South Dakota
5339 2673 48.5 Remote
46071 Jackson County, South Dakota
3240 3274 100 Tribal
46099 Minnehaha County, South Dakota
183963 24938 13.6 Metropolitan
46033 Custer County, South Dakota
8305 8445 100 Destination
46069 Hyde County, South Dakota
1290 1396 100 Agriculture & Extraction
46025 Clark County, South Dakota
3610 3645 100 Agriculture & Extraction
46049 Faulk County, South Dakota
2260 2357 100 Remote
46077 Kingsbury County, South Dakota
4879 5075 100 Remote
46129 Walworth County, South Dakota
5371 2008 36.4 Destination
46027 Clay County, South Dakota
13731 3389 24.3 Micropolitan
46037 Day County, South Dakota
5353 5588 100 Agriculture & Extraction
46043 Douglas County, South Dakota
2832 2973 100 Agriculture & Extraction
46063 Harding County, South Dakota
1292 1250 100 Agriculture & Extraction
46089 McPherson County, South Dakota
2266 2429 100 Remote
46109 Roberts County, South Dakota
10106 10374 100 Tribal
46119 Sully County, South Dakota
1331 1438 100 Agriculture & Extraction
46083 Lincoln County, South Dakota
54610 15086 29.3 Metropolitan
46079 Lake County, South Dakota
12414 5550 44.9 Fringe
46081 Lawrence County, South Dakota
24959 9095 36.9 Destination
46029 Codington County, South Dakota
27661 6276 22.5 Micropolitan
46019 Butte County, South Dakota
10074 4961 48.2 Remote
46031 Corson County, South Dakota
4168 4182 100 Tribal
46045 Edmunds County, South Dakota
3830 3983 100 Remote
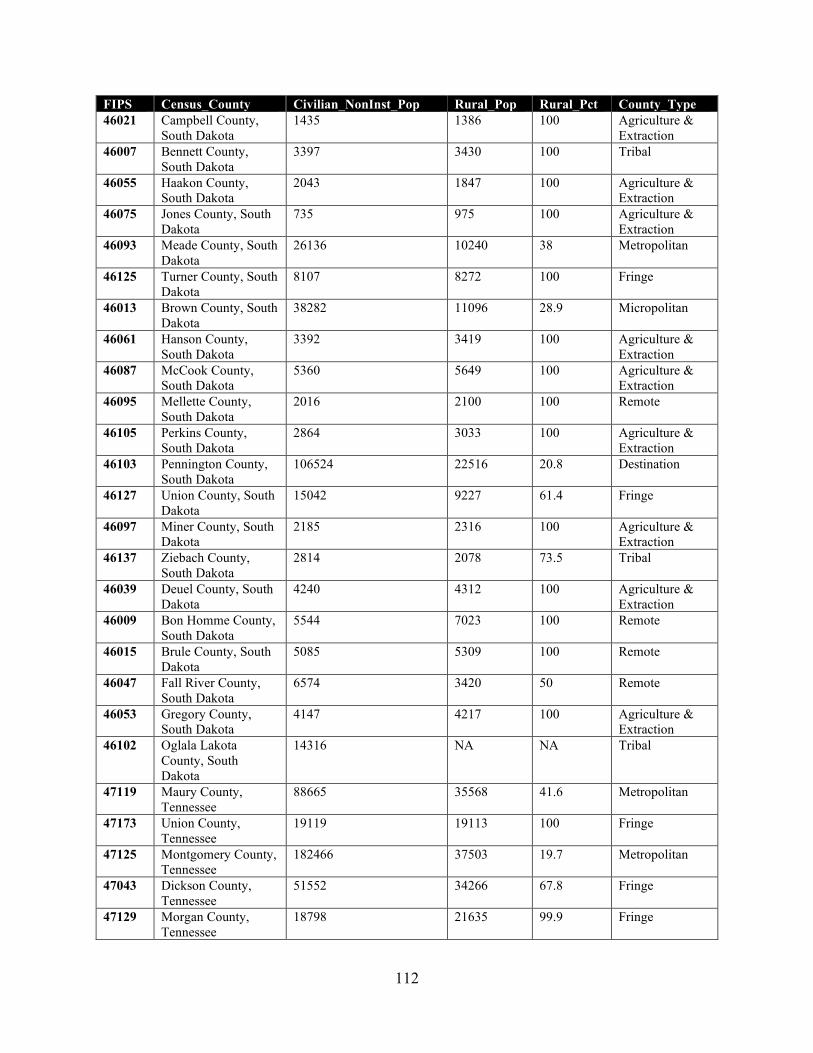
112
FIPS Census_County Civilian_NonInst_Pop Rural_Pop Rural_Pct County_Type 46021 Campbell County,
South Dakota 1435 1386 100 Agriculture &
Extraction 46007 Bennett County,
South Dakota 3397 3430 100 Tribal
46055 Haakon County, South Dakota
2043 1847 100 Agriculture & Extraction
46075 Jones County, South Dakota
735 975 100 Agriculture & Extraction
46093 Meade County, South Dakota
26136 10240 38 Metropolitan
46125 Turner County, South Dakota
8107 8272 100 Fringe
46013 Brown County, South Dakota
38282 11096 28.9 Micropolitan
46061 Hanson County, South Dakota
3392 3419 100 Agriculture & Extraction
46087 McCook County, South Dakota
5360 5649 100 Agriculture & Extraction
46095 Mellette County, South Dakota
2016 2100 100 Remote
46105 Perkins County, South Dakota
2864 3033 100 Agriculture & Extraction
46103 Pennington County, South Dakota
106524 22516 20.8 Destination
46127 Union County, South Dakota
15042 9227 61.4 Fringe
46097 Miner County, South Dakota
2185 2316 100 Agriculture & Extraction
46137 Ziebach County, South Dakota
2814 2078 73.5 Tribal
46039 Deuel County, South Dakota
4240 4312 100 Agriculture & Extraction
46009 Bon Homme County, South Dakota
5544 7023 100 Remote
46015 Brule County, South Dakota
5085 5309 100 Remote
46047 Fall River County, South Dakota
6574 3420 50 Remote
46053 Gregory County, South Dakota
4147 4217 100 Agriculture & Extraction
46102 Oglala Lakota County, South Dakota
14316 NA NA Tribal
47119 Maury County, Tennessee
88665 35568 41.6 Metropolitan
47173 Union County, Tennessee
19119 19113 100 Fringe
47125 Montgomery County, Tennessee
182466 37503 19.7 Metropolitan
47043 Dickson County, Tennessee
51552 34266 67.8 Fringe
47129 Morgan County, Tennessee
18798 21635 99.9 Fringe
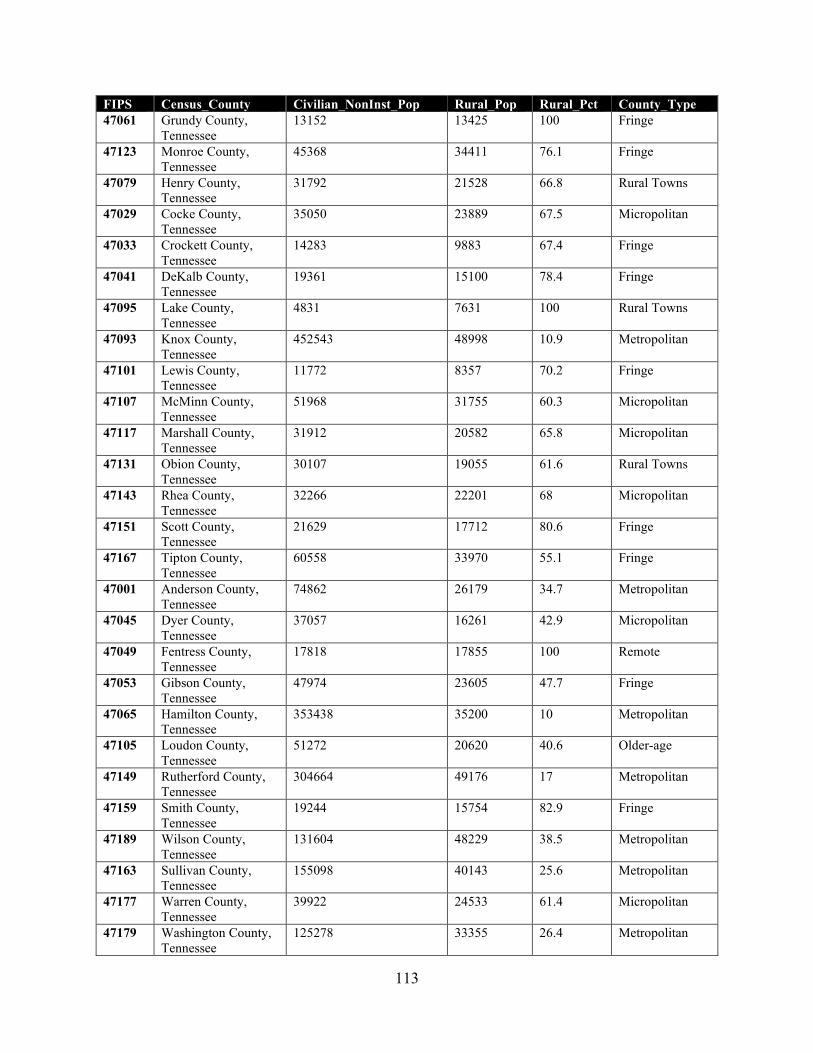
113
FIPS Census_County Civilian_NonInst_Pop Rural_Pop Rural_Pct County_Type 47061 Grundy County,
Tennessee 13152 13425 100 Fringe
47123 Monroe County, Tennessee
45368 34411 76.1 Fringe
47079 Henry County, Tennessee
31792 21528 66.8 Rural Towns
47029 Cocke County, Tennessee
35050 23889 67.5 Micropolitan
47033 Crockett County, Tennessee
14283 9883 67.4 Fringe
47041 DeKalb County, Tennessee
19361 15100 78.4 Fringe
47095 Lake County, Tennessee
4831 7631 100 Rural Towns
47093 Knox County, Tennessee
452543 48998 10.9 Metropolitan
47101 Lewis County, Tennessee
11772 8357 70.2 Fringe
47107 McMinn County, Tennessee
51968 31755 60.3 Micropolitan
47117 Marshall County, Tennessee
31912 20582 65.8 Micropolitan
47131 Obion County, Tennessee
30107 19055 61.6 Rural Towns
47143 Rhea County, Tennessee
32266 22201 68 Micropolitan
47151 Scott County, Tennessee
21629 17712 80.6 Fringe
47167 Tipton County, Tennessee
60558 33970 55.1 Fringe
47001 Anderson County, Tennessee
74862 26179 34.7 Metropolitan
47045 Dyer County, Tennessee
37057 16261 42.9 Micropolitan
47049 Fentress County, Tennessee
17818 17855 100 Remote
47053 Gibson County, Tennessee
47974 23605 47.7 Fringe
47065 Hamilton County, Tennessee
353438 35200 10 Metropolitan
47105 Loudon County, Tennessee
51272 20620 40.6 Older-age
47149 Rutherford County, Tennessee
304664 49176 17 Metropolitan
47159 Smith County, Tennessee
19244 15754 82.9 Fringe
47189 Wilson County, Tennessee
131604 48229 38.5 Metropolitan
47163 Sullivan County, Tennessee
155098 40143 25.6 Metropolitan
47177 Warren County, Tennessee
39922 24533 61.4 Micropolitan
47179 Washington County, Tennessee
125278 33355 26.4 Metropolitan
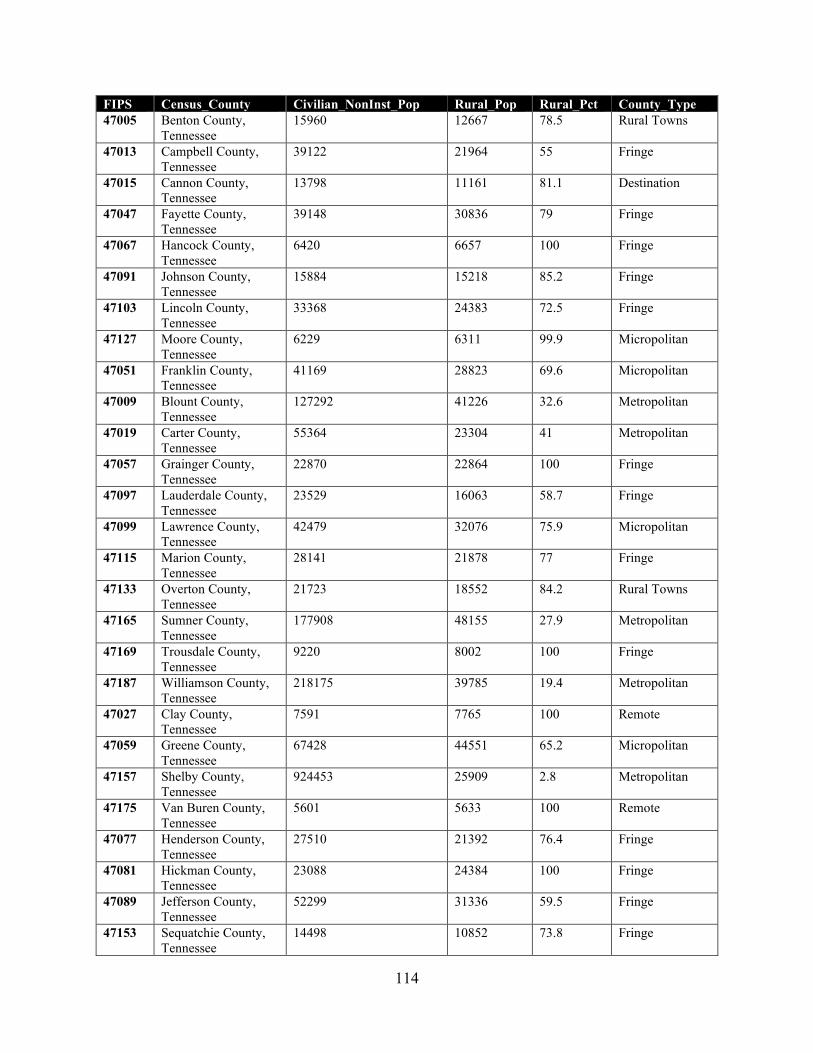
114
FIPS Census_County Civilian_NonInst_Pop Rural_Pop Rural_Pct County_Type 47005 Benton County,
Tennessee 15960 12667 78.5 Rural Towns
47013 Campbell County, Tennessee
39122 21964 55 Fringe
47015 Cannon County, Tennessee
13798 11161 81.1 Destination
47047 Fayette County, Tennessee
39148 30836 79 Fringe
47067 Hancock County, Tennessee
6420 6657 100 Fringe
47091 Johnson County, Tennessee
15884 15218 85.2 Fringe
47103 Lincoln County, Tennessee
33368 24383 72.5 Fringe
47127 Moore County, Tennessee
6229 6311 99.9 Micropolitan
47051 Franklin County, Tennessee
41169 28823 69.6 Micropolitan
47009 Blount County, Tennessee
127292 41226 32.6 Metropolitan
47019 Carter County, Tennessee
55364 23304 41 Metropolitan
47057 Grainger County, Tennessee
22870 22864 100 Fringe
47097 Lauderdale County, Tennessee
23529 16063 58.7 Fringe
47099 Lawrence County, Tennessee
42479 32076 75.9 Micropolitan
47115 Marion County, Tennessee
28141 21878 77 Fringe
47133 Overton County, Tennessee
21723 18552 84.2 Rural Towns
47165 Sumner County, Tennessee
177908 48155 27.9 Metropolitan
47169 Trousdale County, Tennessee
9220 8002 100 Fringe
47187 Williamson County, Tennessee
218175 39785 19.4 Metropolitan
47027 Clay County, Tennessee
7591 7765 100 Remote
47059 Greene County, Tennessee
67428 44551 65.2 Micropolitan
47157 Shelby County, Tennessee
924453 25909 2.8 Metropolitan
47175 Van Buren County, Tennessee
5601 5633 100 Remote
47077 Henderson County, Tennessee
27510 21392 76.4 Fringe
47081 Hickman County, Tennessee
23088 24384 100 Fringe
47089 Jefferson County, Tennessee
52299 31336 59.5 Fringe
47153 Sequatchie County, Tennessee
14498 10852 73.8 Fringe
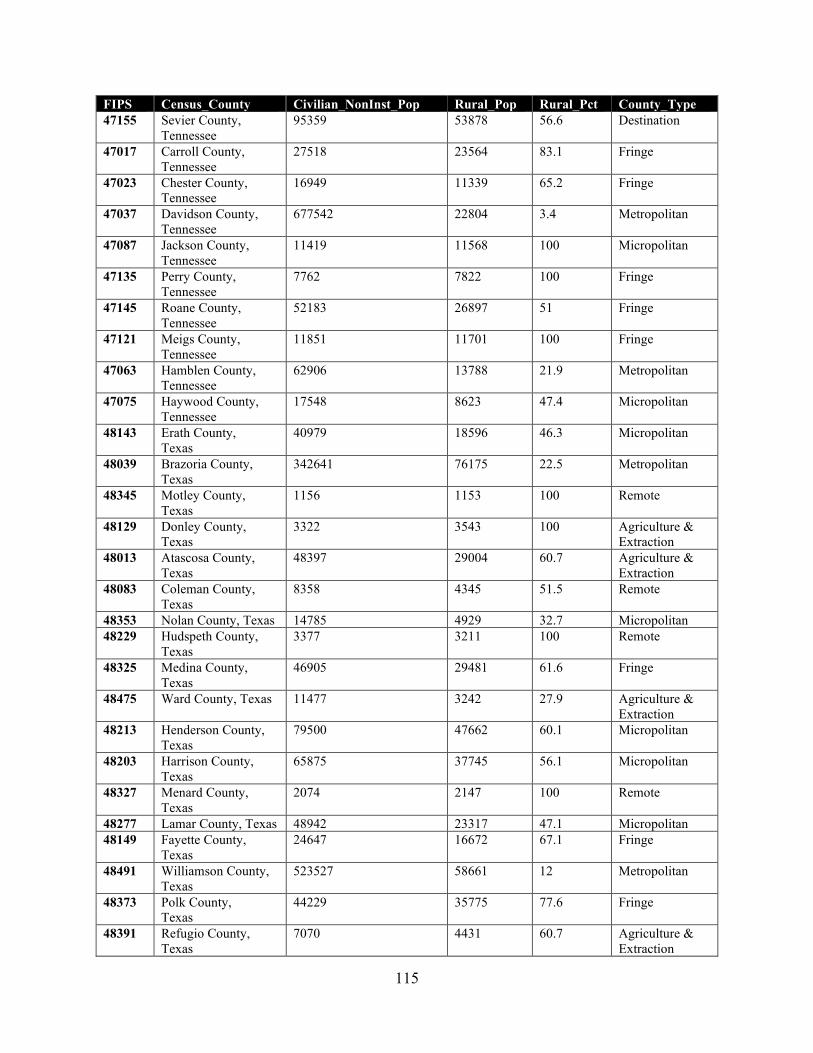
115
FIPS Census_County Civilian_NonInst_Pop Rural_Pop Rural_Pct County_Type 47155 Sevier County,
Tennessee 95359 53878 56.6 Destination
47017 Carroll County, Tennessee
27518 23564 83.1 Fringe
47023 Chester County, Tennessee
16949 11339 65.2 Fringe
47037 Davidson County, Tennessee
677542 22804 3.4 Metropolitan
47087 Jackson County, Tennessee
11419 11568 100 Micropolitan
47135 Perry County, Tennessee
7762 7822 100 Fringe
47145 Roane County, Tennessee
52183 26897 51 Fringe
47121 Meigs County, Tennessee
11851 11701 100 Fringe
47063 Hamblen County, Tennessee
62906 13788 21.9 Metropolitan
47075 Haywood County, Tennessee
17548 8623 47.4 Micropolitan
48143 Erath County, Texas
40979 18596 46.3 Micropolitan
48039 Brazoria County, Texas
342641 76175 22.5 Metropolitan
48345 Motley County, Texas
1156 1153 100 Remote
48129 Donley County, Texas
3322 3543 100 Agriculture & Extraction
48013 Atascosa County, Texas
48397 29004 60.7 Agriculture & Extraction
48083 Coleman County, Texas
8358 4345 51.5 Remote
48353 Nolan County, Texas 14785 4929 32.7 Micropolitan 48229 Hudspeth County,
Texas 3377 3211 100 Remote
48325 Medina County, Texas
46905 29481 61.6 Fringe
48475 Ward County, Texas 11477 3242 27.9 Agriculture & Extraction
48213 Henderson County, Texas
79500 47662 60.1 Micropolitan
48203 Harrison County, Texas
65875 37745 56.1 Micropolitan
48327 Menard County, Texas
2074 2147 100 Remote
48277 Lamar County, Texas 48942 23317 47.1 Micropolitan 48149 Fayette County,
Texas 24647 16672 67.1 Fringe
48491 Williamson County, Texas
523527 58661 12 Metropolitan
48373 Polk County, Texas
44229 35775 77.6 Fringe
48391 Refugio County, Texas
7070 4431 60.7 Agriculture & Extraction
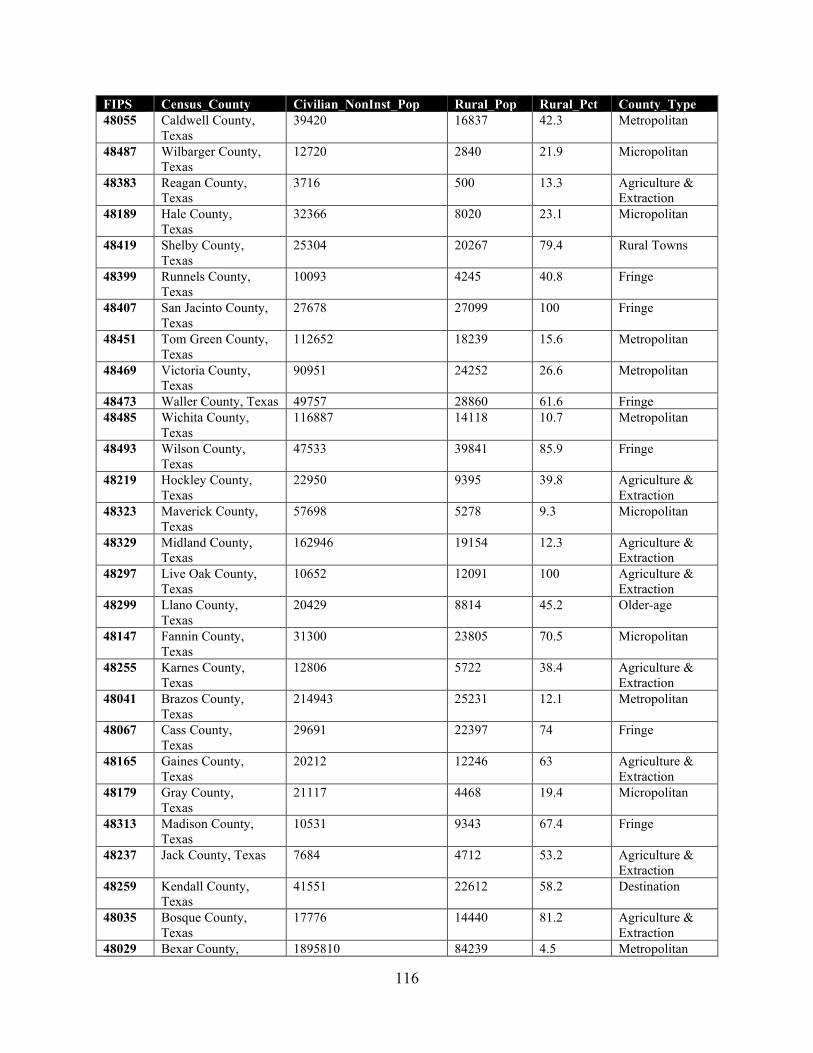
116
FIPS Census_County Civilian_NonInst_Pop Rural_Pop Rural_Pct County_Type 48055 Caldwell County,
Texas 39420 16837 42.3 Metropolitan
48487 Wilbarger County, Texas
12720 2840 21.9 Micropolitan
48383 Reagan County, Texas
3716 500 13.3 Agriculture & Extraction
48189 Hale County, Texas
32366 8020 23.1 Micropolitan
48419 Shelby County, Texas
25304 20267 79.4 Rural Towns
48399 Runnels County, Texas
10093 4245 40.8 Fringe
48407 San Jacinto County, Texas
27678 27099 100 Fringe
48451 Tom Green County, Texas
112652 18239 15.6 Metropolitan
48469 Victoria County, Texas
90951 24252 26.6 Metropolitan
48473 Waller County, Texas 49757 28860 61.6 Fringe 48485 Wichita County,
Texas 116887 14118 10.7 Metropolitan
48493 Wilson County, Texas
47533 39841 85.9 Fringe
48219 Hockley County, Texas
22950 9395 39.8 Agriculture & Extraction
48323 Maverick County, Texas
57698 5278 9.3 Micropolitan
48329 Midland County, Texas
162946 19154 12.3 Agriculture & Extraction
48297 Live Oak County, Texas
10652 12091 100 Agriculture & Extraction
48299 Llano County, Texas
20429 8814 45.2 Older-age
48147 Fannin County, Texas
31300 23805 70.5 Micropolitan
48255 Karnes County, Texas
12806 5722 38.4 Agriculture & Extraction
48041 Brazos County, Texas
214943 25231 12.1 Metropolitan
48067 Cass County, Texas
29691 22397 74 Fringe
48165 Gaines County, Texas
20212 12246 63 Agriculture & Extraction
48179 Gray County, Texas
21117 4468 19.4 Micropolitan
48313 Madison County, Texas
10531 9343 67.4 Fringe
48237 Jack County, Texas 7684 4712 53.2 Agriculture & Extraction
48259 Kendall County, Texas
41551 22612 58.2 Destination
48035 Bosque County, Texas
17776 14440 81.2 Agriculture & Extraction
48029 Bexar County, 1895810 84239 4.5 Metropolitan
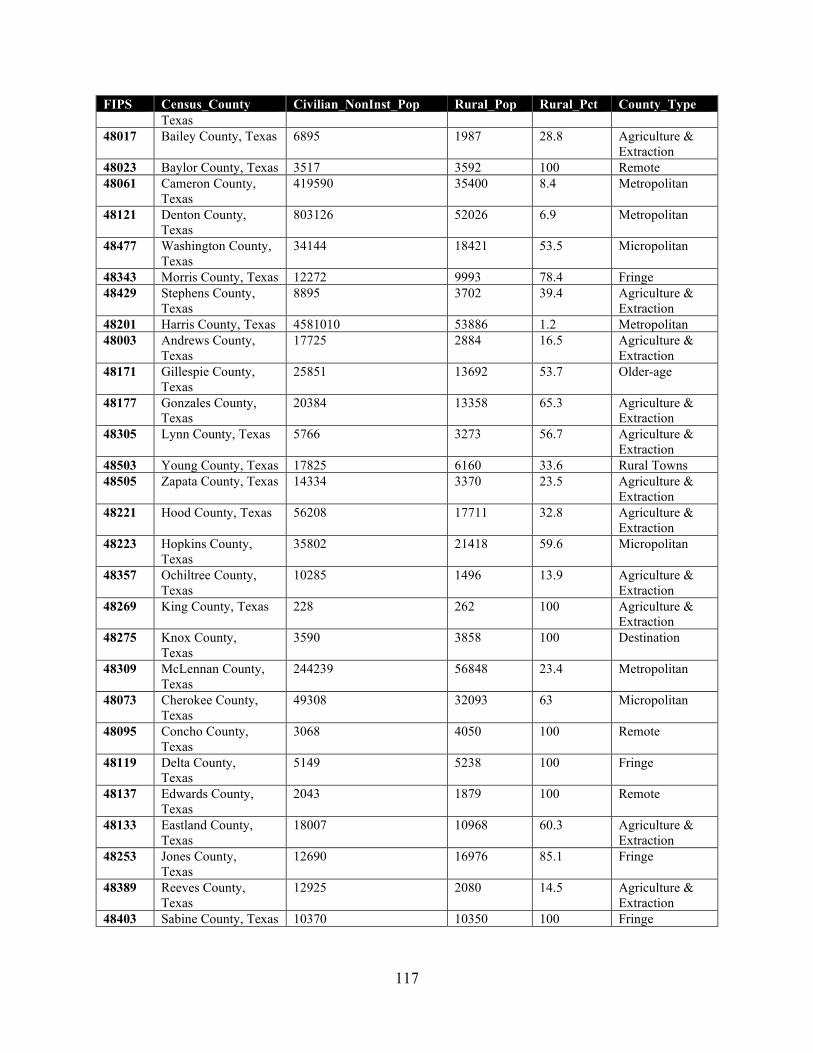
117
FIPS Census_County Civilian_NonInst_Pop Rural_Pop Rural_Pct County_Type Texas
48017 Bailey County, Texas 6895 1987 28.8 Agriculture & Extraction
48023 Baylor County, Texas 3517 3592 100 Remote 48061 Cameron County,
Texas 419590 35400 8.4 Metropolitan
48121 Denton County, Texas
803126 52026 6.9 Metropolitan
48477 Washington County, Texas
34144 18421 53.5 Micropolitan
48343 Morris County, Texas 12272 9993 78.4 Fringe 48429 Stephens County,
Texas 8895 3702 39.4 Agriculture &
Extraction 48201 Harris County, Texas 4581010 53886 1.2 Metropolitan 48003 Andrews County,
Texas 17725 2884 16.5 Agriculture &
Extraction 48171 Gillespie County,
Texas 25851 13692 53.7 Older-age
48177 Gonzales County, Texas
20384 13358 65.3 Agriculture & Extraction
48305 Lynn County, Texas 5766 3273 56.7 Agriculture & Extraction
48503 Young County, Texas 17825 6160 33.6 Rural Towns 48505 Zapata County, Texas 14334 3370 23.5 Agriculture &
Extraction 48221 Hood County, Texas 56208 17711 32.8 Agriculture &
Extraction 48223 Hopkins County,
Texas 35802 21418 59.6 Micropolitan
48357 Ochiltree County, Texas
10285 1496 13.9 Agriculture & Extraction
48269 King County, Texas 228 262 100 Agriculture & Extraction
48275 Knox County, Texas
3590 3858 100 Destination
48309 McLennan County, Texas
244239 56848 23.4 Metropolitan
48073 Cherokee County, Texas
49308 32093 63 Micropolitan
48095 Concho County, Texas
3068 4050 100 Remote
48119 Delta County, Texas
5149 5238 100 Fringe
48137 Edwards County, Texas
2043 1879 100 Remote
48133 Eastland County, Texas
18007 10968 60.3 Agriculture & Extraction
48253 Jones County, Texas
12690 16976 85.1 Fringe
48389 Reeves County, Texas
12925 2080 14.5 Agriculture & Extraction
48403 Sabine County, Texas 10370 10350 100 Fringe
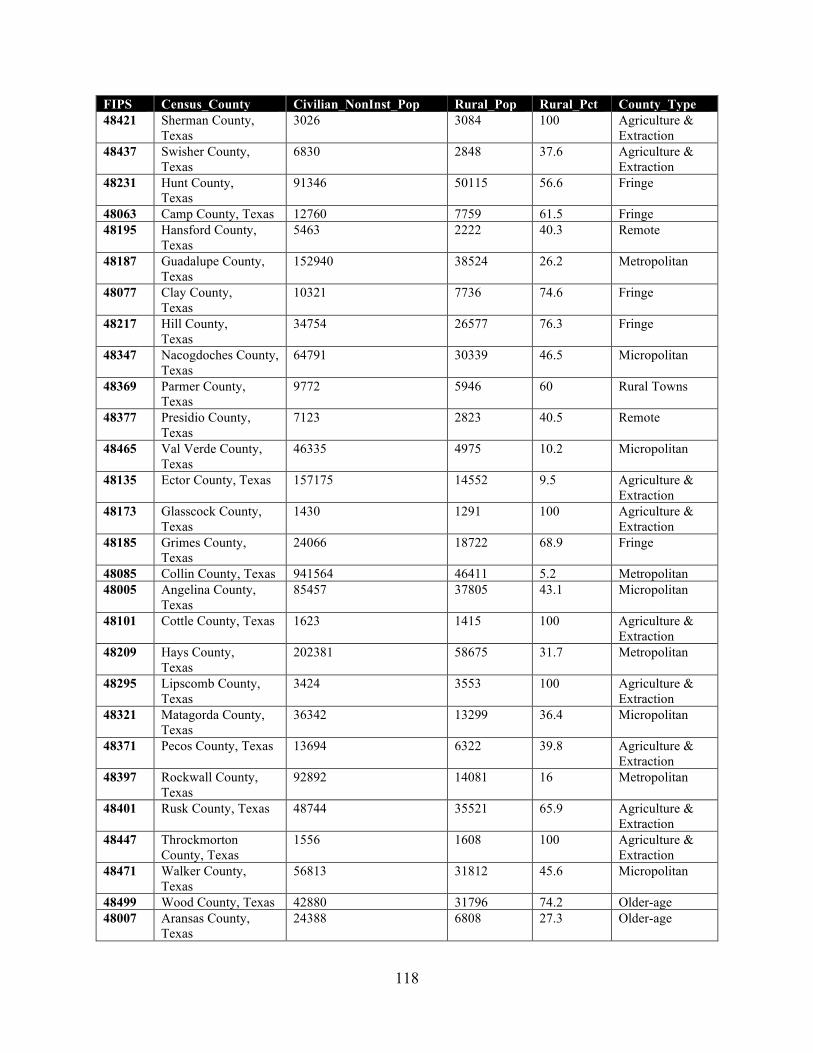
118
FIPS Census_County Civilian_NonInst_Pop Rural_Pop Rural_Pct County_Type 48421 Sherman County,
Texas 3026 3084 100 Agriculture &
Extraction 48437 Swisher County,
Texas 6830 2848 37.6 Agriculture &
Extraction 48231 Hunt County,
Texas 91346 50115 56.6 Fringe
48063 Camp County, Texas 12760 7759 61.5 Fringe 48195 Hansford County,
Texas 5463 2222 40.3 Remote
48187 Guadalupe County, Texas
152940 38524 26.2 Metropolitan
48077 Clay County, Texas
10321 7736 74.6 Fringe
48217 Hill County, Texas
34754 26577 76.3 Fringe
48347 Nacogdoches County, Texas
64791 30339 46.5 Micropolitan
48369 Parmer County, Texas
9772 5946 60 Rural Towns
48377 Presidio County, Texas
7123 2823 40.5 Remote
48465 Val Verde County, Texas
46335 4975 10.2 Micropolitan
48135 Ector County, Texas 157175 14552 9.5 Agriculture & Extraction
48173 Glasscock County, Texas
1430 1291 100 Agriculture & Extraction
48185 Grimes County, Texas
24066 18722 68.9 Fringe
48085 Collin County, Texas 941564 46411 5.2 Metropolitan 48005 Angelina County,
Texas 85457 37805 43.1 Micropolitan
48101 Cottle County, Texas 1623 1415 100 Agriculture & Extraction
48209 Hays County, Texas
202381 58675 31.7 Metropolitan
48295 Lipscomb County, Texas
3424 3553 100 Agriculture & Extraction
48321 Matagorda County, Texas
36342 13299 36.4 Micropolitan
48371 Pecos County, Texas 13694 6322 39.8 Agriculture & Extraction
48397 Rockwall County, Texas
92892 14081 16 Metropolitan
48401 Rusk County, Texas 48744 35521 65.9 Agriculture & Extraction
48447 Throckmorton County, Texas
1556 1608 100 Agriculture & Extraction
48471 Walker County, Texas
56813 31812 45.6 Micropolitan
48499 Wood County, Texas 42880 31796 74.2 Older-age 48007 Aransas County,
Texas 24388 6808 27.3 Older-age
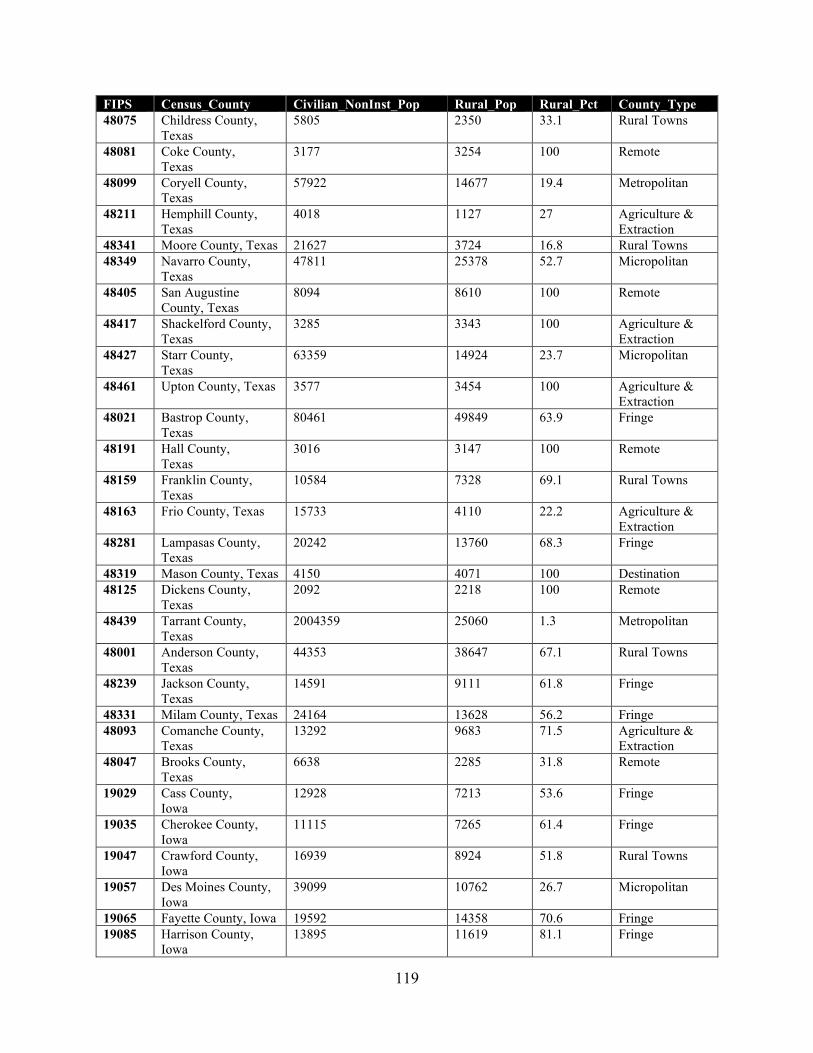
119
FIPS Census_County Civilian_NonInst_Pop Rural_Pop Rural_Pct County_Type 48075 Childress County,
Texas 5805 2350 33.1 Rural Towns
48081 Coke County, Texas
3177 3254 100 Remote
48099 Coryell County, Texas
57922 14677 19.4 Metropolitan
48211 Hemphill County, Texas
4018 1127 27 Agriculture & Extraction
48341 Moore County, Texas 21627 3724 16.8 Rural Towns 48349 Navarro County,
Texas 47811 25378 52.7 Micropolitan
48405 San Augustine County, Texas
8094 8610 100 Remote
48417 Shackelford County, Texas
3285 3343 100 Agriculture & Extraction
48427 Starr County, Texas
63359 14924 23.7 Micropolitan
48461 Upton County, Texas 3577 3454 100 Agriculture & Extraction
48021 Bastrop County, Texas
80461 49849 63.9 Fringe
48191 Hall County, Texas
3016 3147 100 Remote
48159 Franklin County, Texas
10584 7328 69.1 Rural Towns
48163 Frio County, Texas 15733 4110 22.2 Agriculture & Extraction
48281 Lampasas County, Texas
20242 13760 68.3 Fringe
48319 Mason County, Texas 4150 4071 100 Destination 48125 Dickens County,
Texas 2092 2218 100 Remote
48439 Tarrant County, Texas
2004359 25060 1.3 Metropolitan
48001 Anderson County, Texas
44353 38647 67.1 Rural Towns
48239 Jackson County, Texas
14591 9111 61.8 Fringe
48331 Milam County, Texas 24164 13628 56.2 Fringe 48093 Comanche County,
Texas 13292 9683 71.5 Agriculture &
Extraction 48047 Brooks County,
Texas 6638 2285 31.8 Remote
19029 Cass County, Iowa
12928 7213 53.6 Fringe
19035 Cherokee County, Iowa
11115 7265 61.4 Fringe
19047 Crawford County, Iowa
16939 8924 51.8 Rural Towns
19057 Des Moines County, Iowa
39099 10762 26.7 Micropolitan
19065 Fayette County, Iowa 19592 14358 70.6 Fringe 19085 Harrison County,
Iowa 13895 11619 81.1 Fringe
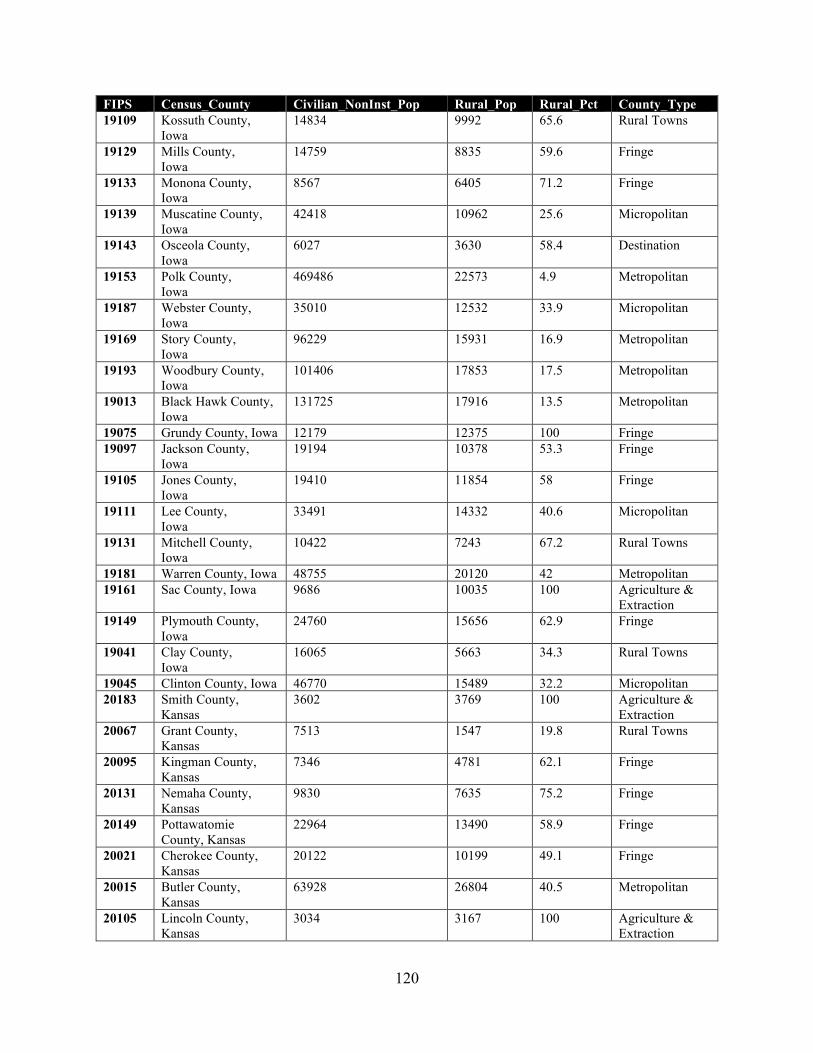
120
FIPS Census_County Civilian_NonInst_Pop Rural_Pop Rural_Pct County_Type 19109 Kossuth County,
Iowa 14834 9992 65.6 Rural Towns
19129 Mills County, Iowa
14759 8835 59.6 Fringe
19133 Monona County, Iowa
8567 6405 71.2 Fringe
19139 Muscatine County, Iowa
42418 10962 25.6 Micropolitan
19143 Osceola County, Iowa
6027 3630 58.4 Destination
19153 Polk County, Iowa
469486 22573 4.9 Metropolitan
19187 Webster County, Iowa
35010 12532 33.9 Micropolitan
19169 Story County, Iowa
96229 15931 16.9 Metropolitan
19193 Woodbury County, Iowa
101406 17853 17.5 Metropolitan
19013 Black Hawk County, Iowa
131725 17916 13.5 Metropolitan
19075 Grundy County, Iowa 12179 12375 100 Fringe 19097 Jackson County,
Iowa 19194 10378 53.3 Fringe
19105 Jones County, Iowa
19410 11854 58 Fringe
19111 Lee County, Iowa
33491 14332 40.6 Micropolitan
19131 Mitchell County, Iowa
10422 7243 67.2 Rural Towns
19181 Warren County, Iowa 48755 20120 42 Metropolitan 19161 Sac County, Iowa 9686 10035 100 Agriculture &
Extraction 19149 Plymouth County,
Iowa 24760 15656 62.9 Fringe
19041 Clay County, Iowa
16065 5663 34.3 Rural Towns
19045 Clinton County, Iowa 46770 15489 32.2 Micropolitan 20183 Smith County,
Kansas 3602 3769 100 Agriculture &
Extraction 20067 Grant County,
Kansas 7513 1547 19.8 Rural Towns
20095 Kingman County, Kansas
7346 4781 62.1 Fringe
20131 Nemaha County, Kansas
9830 7635 75.2 Fringe
20149 Pottawatomie County, Kansas
22964 13490 58.9 Fringe
20021 Cherokee County, Kansas
20122 10199 49.1 Fringe
20015 Butler County, Kansas
63928 26804 40.5 Metropolitan
20105 Lincoln County, Kansas
3034 3167 100 Agriculture & Extraction
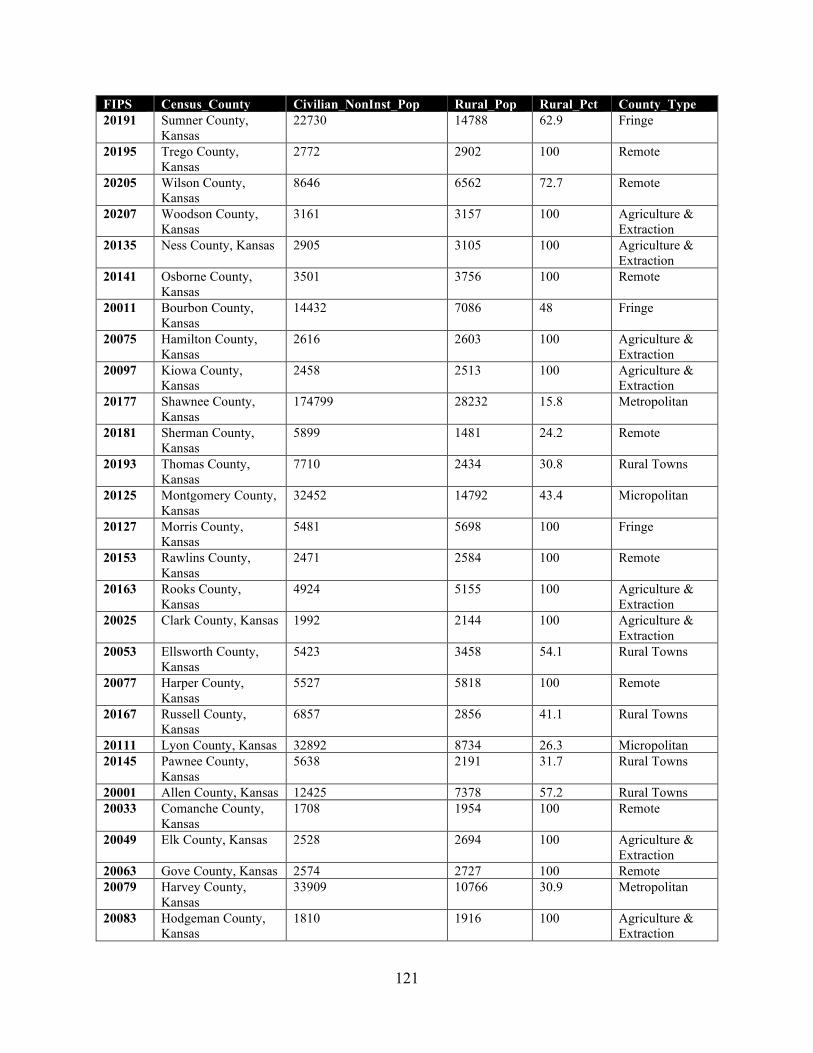
121
FIPS Census_County Civilian_NonInst_Pop Rural_Pop Rural_Pct County_Type 20191 Sumner County,
Kansas 22730 14788 62.9 Fringe
20195 Trego County, Kansas
2772 2902 100 Remote
20205 Wilson County, Kansas
8646 6562 72.7 Remote
20207 Woodson County, Kansas
3161 3157 100 Agriculture & Extraction
20135 Ness County, Kansas 2905 3105 100 Agriculture & Extraction
20141 Osborne County, Kansas
3501 3756 100 Remote
20011 Bourbon County, Kansas
14432 7086 48 Fringe
20075 Hamilton County, Kansas
2616 2603 100 Agriculture & Extraction
20097 Kiowa County, Kansas
2458 2513 100 Agriculture & Extraction
20177 Shawnee County, Kansas
174799 28232 15.8 Metropolitan
20181 Sherman County, Kansas
5899 1481 24.2 Remote
20193 Thomas County, Kansas
7710 2434 30.8 Rural Towns
20125 Montgomery County, Kansas
32452 14792 43.4 Micropolitan
20127 Morris County, Kansas
5481 5698 100 Fringe
20153 Rawlins County, Kansas
2471 2584 100 Remote
20163 Rooks County, Kansas
4924 5155 100 Agriculture & Extraction
20025 Clark County, Kansas 1992 2144 100 Agriculture & Extraction
20053 Ellsworth County, Kansas
5423 3458 54.1 Rural Towns
20077 Harper County, Kansas
5527 5818 100 Remote
20167 Russell County, Kansas
6857 2856 41.1 Rural Towns
20111 Lyon County, Kansas 32892 8734 26.3 Micropolitan 20145 Pawnee County,
Kansas 5638 2191 31.7 Rural Towns
20001 Allen County, Kansas 12425 7378 57.2 Rural Towns 20033 Comanche County,
Kansas 1708 1954 100 Remote
20049 Elk County, Kansas 2528 2694 100 Agriculture & Extraction
20063 Gove County, Kansas 2574 2727 100 Remote 20079 Harvey County,
Kansas 33909 10766 30.9 Metropolitan
20083 Hodgeman County, Kansas
1810 1916 100 Agriculture & Extraction
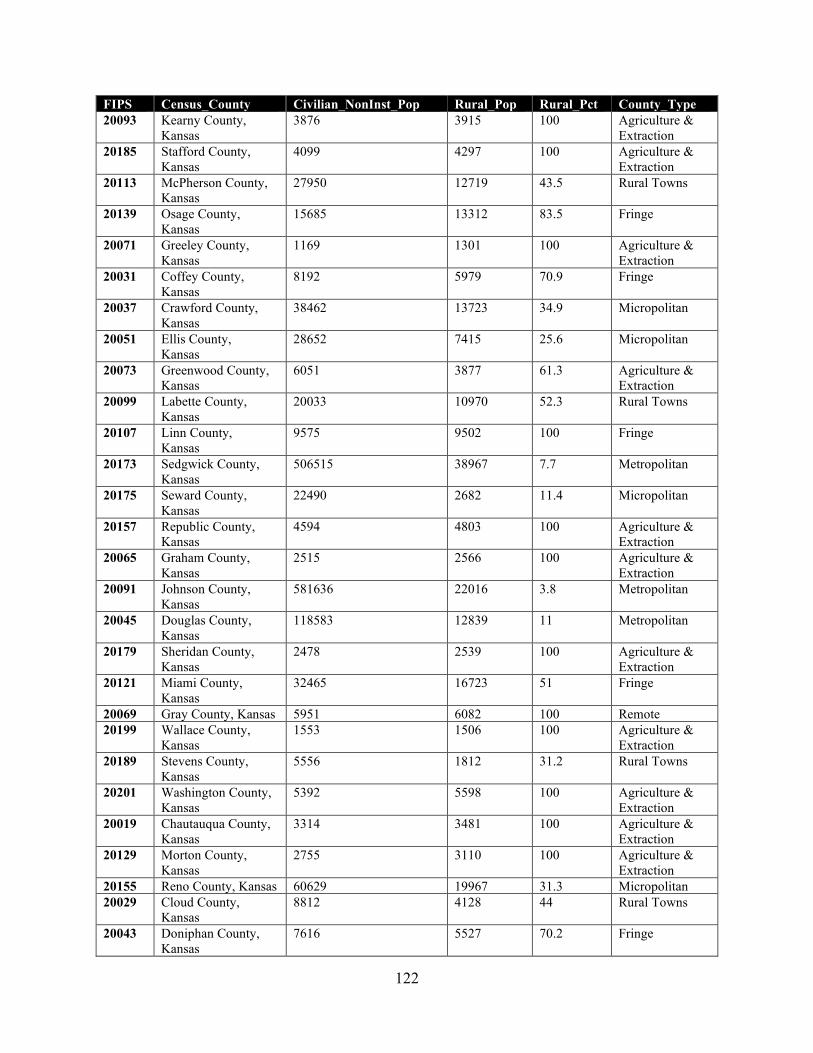
122
FIPS Census_County Civilian_NonInst_Pop Rural_Pop Rural_Pct County_Type 20093 Kearny County,
Kansas 3876 3915 100 Agriculture &
Extraction 20185 Stafford County,
Kansas 4099 4297 100 Agriculture &
Extraction 20113 McPherson County,
Kansas 27950 12719 43.5 Rural Towns
20139 Osage County, Kansas
15685 13312 83.5 Fringe
20071 Greeley County, Kansas
1169 1301 100 Agriculture & Extraction
20031 Coffey County, Kansas
8192 5979 70.9 Fringe
20037 Crawford County, Kansas
38462 13723 34.9 Micropolitan
20051 Ellis County, Kansas
28652 7415 25.6 Micropolitan
20073 Greenwood County, Kansas
6051 3877 61.3 Agriculture & Extraction
20099 Labette County, Kansas
20033 10970 52.3 Rural Towns
20107 Linn County, Kansas
9575 9502 100 Fringe
20173 Sedgwick County, Kansas
506515 38967 7.7 Metropolitan
20175 Seward County, Kansas
22490 2682 11.4 Micropolitan
20157 Republic County, Kansas
4594 4803 100 Agriculture & Extraction
20065 Graham County, Kansas
2515 2566 100 Agriculture & Extraction
20091 Johnson County, Kansas
581636 22016 3.8 Metropolitan
20045 Douglas County, Kansas
118583 12839 11 Metropolitan
20179 Sheridan County, Kansas
2478 2539 100 Agriculture & Extraction
20121 Miami County, Kansas
32465 16723 51 Fringe
20069 Gray County, Kansas 5951 6082 100 Remote 20199 Wallace County,
Kansas 1553 1506 100 Agriculture &
Extraction 20189 Stevens County,
Kansas 5556 1812 31.2 Rural Towns
20201 Washington County, Kansas
5392 5598 100 Agriculture & Extraction
20019 Chautauqua County, Kansas
3314 3481 100 Agriculture & Extraction
20129 Morton County, Kansas
2755 3110 100 Agriculture & Extraction
20155 Reno County, Kansas 60629 19967 31.3 Micropolitan 20029 Cloud County,
Kansas 8812 4128 44 Rural Towns
20043 Doniphan County, Kansas
7616 5527 70.2 Fringe
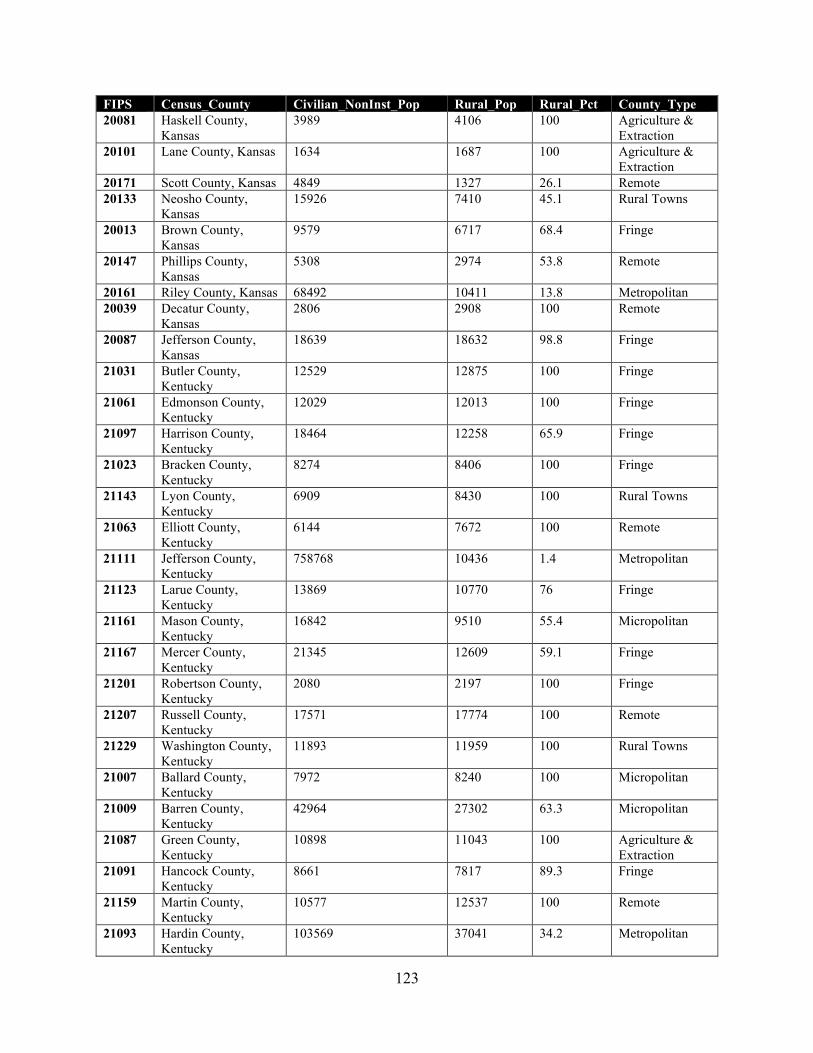
123
FIPS Census_County Civilian_NonInst_Pop Rural_Pop Rural_Pct County_Type 20081 Haskell County,
Kansas 3989 4106 100 Agriculture &
Extraction 20101 Lane County, Kansas 1634 1687 100 Agriculture &
Extraction 20171 Scott County, Kansas 4849 1327 26.1 Remote 20133 Neosho County,
Kansas 15926 7410 45.1 Rural Towns
20013 Brown County, Kansas
9579 6717 68.4 Fringe
20147 Phillips County, Kansas
5308 2974 53.8 Remote
20161 Riley County, Kansas 68492 10411 13.8 Metropolitan 20039 Decatur County,
Kansas 2806 2908 100 Remote
20087 Jefferson County, Kansas
18639 18632 98.8 Fringe
21031 Butler County, Kentucky
12529 12875 100 Fringe
21061 Edmonson County, Kentucky
12029 12013 100 Fringe
21097 Harrison County, Kentucky
18464 12258 65.9 Fringe
21023 Bracken County, Kentucky
8274 8406 100 Fringe
21143 Lyon County, Kentucky
6909 8430 100 Rural Towns
21063 Elliott County, Kentucky
6144 7672 100 Remote
21111 Jefferson County, Kentucky
758768 10436 1.4 Metropolitan
21123 Larue County, Kentucky
13869 10770 76 Fringe
21161 Mason County, Kentucky
16842 9510 55.4 Micropolitan
21167 Mercer County, Kentucky
21345 12609 59.1 Fringe
21201 Robertson County, Kentucky
2080 2197 100 Fringe
21207 Russell County, Kentucky
17571 17774 100 Remote
21229 Washington County, Kentucky
11893 11959 100 Rural Towns
21007 Ballard County, Kentucky
7972 8240 100 Micropolitan
21009 Barren County, Kentucky
42964 27302 63.3 Micropolitan
21087 Green County, Kentucky
10898 11043 100 Agriculture & Extraction
21091 Hancock County, Kentucky
8661 7817 89.3 Fringe
21159 Martin County, Kentucky
10577 12537 100 Remote
21093 Hardin County, Kentucky
103569 37041 34.2 Metropolitan
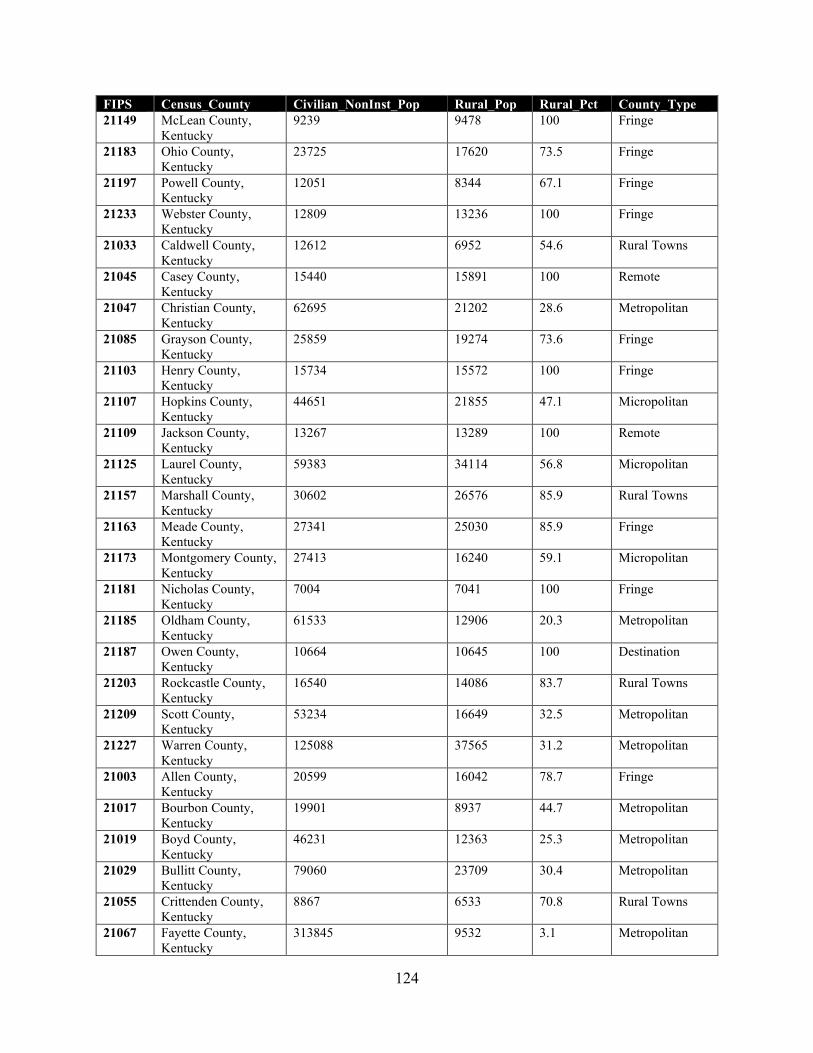
124
FIPS Census_County Civilian_NonInst_Pop Rural_Pop Rural_Pct County_Type 21149 McLean County,
Kentucky 9239 9478 100 Fringe
21183 Ohio County, Kentucky
23725 17620 73.5 Fringe
21197 Powell County, Kentucky
12051 8344 67.1 Fringe
21233 Webster County, Kentucky
12809 13236 100 Fringe
21033 Caldwell County, Kentucky
12612 6952 54.6 Rural Towns
21045 Casey County, Kentucky
15440 15891 100 Remote
21047 Christian County, Kentucky
62695 21202 28.6 Metropolitan
21085 Grayson County, Kentucky
25859 19274 73.6 Fringe
21103 Henry County, Kentucky
15734 15572 100 Fringe
21107 Hopkins County, Kentucky
44651 21855 47.1 Micropolitan
21109 Jackson County, Kentucky
13267 13289 100 Remote
21125 Laurel County, Kentucky
59383 34114 56.8 Micropolitan
21157 Marshall County, Kentucky
30602 26576 85.9 Rural Towns
21163 Meade County, Kentucky
27341 25030 85.9 Fringe
21173 Montgomery County, Kentucky
27413 16240 59.1 Micropolitan
21181 Nicholas County, Kentucky
7004 7041 100 Fringe
21185 Oldham County, Kentucky
61533 12906 20.3 Metropolitan
21187 Owen County, Kentucky
10664 10645 100 Destination
21203 Rockcastle County, Kentucky
16540 14086 83.7 Rural Towns
21209 Scott County, Kentucky
53234 16649 32.5 Metropolitan
21227 Warren County, Kentucky
125088 37565 31.2 Metropolitan
21003 Allen County, Kentucky
20599 16042 78.7 Fringe
21017 Bourbon County, Kentucky
19901 8937 44.7 Metropolitan
21019 Boyd County, Kentucky
46231 12363 25.3 Metropolitan
21029 Bullitt County, Kentucky
79060 23709 30.4 Metropolitan
21055 Crittenden County, Kentucky
8867 6533 70.8 Rural Towns
21067 Fayette County, Kentucky
313845 9532 3.1 Metropolitan
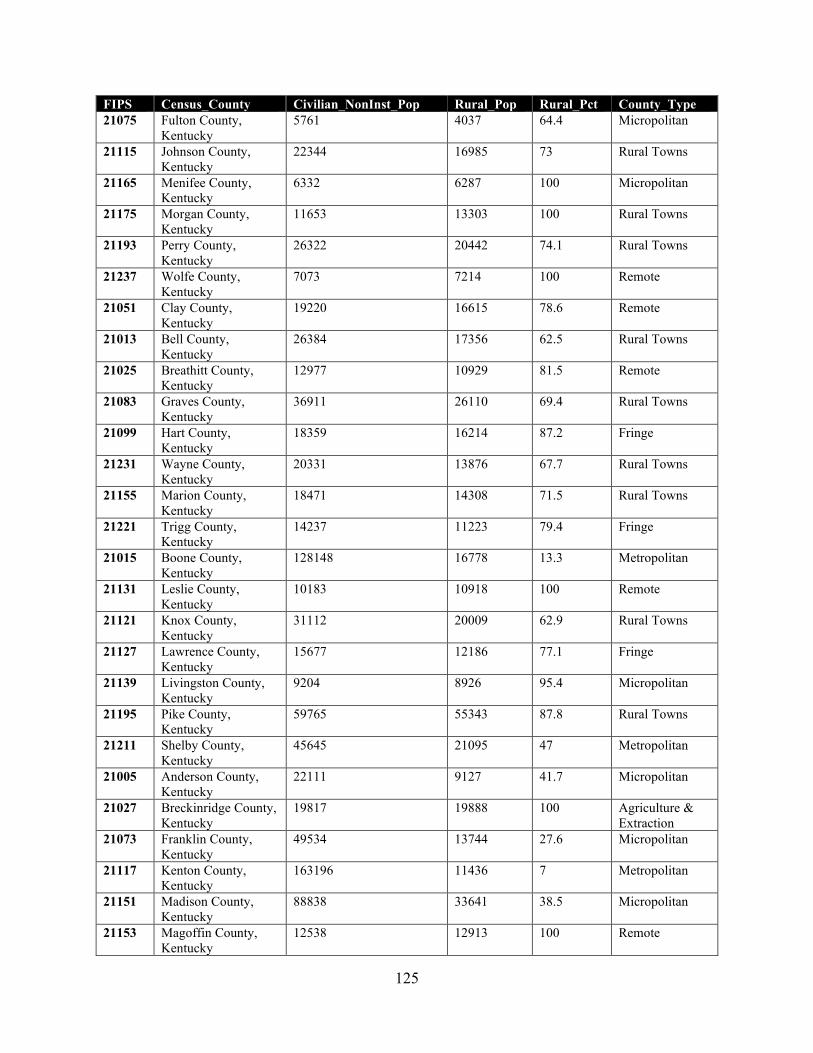
125
FIPS Census_County Civilian_NonInst_Pop Rural_Pop Rural_Pct County_Type 21075 Fulton County,
Kentucky 5761 4037 64.4 Micropolitan
21115 Johnson County, Kentucky
22344 16985 73 Rural Towns
21165 Menifee County, Kentucky
6332 6287 100 Micropolitan
21175 Morgan County, Kentucky
11653 13303 100 Rural Towns
21193 Perry County, Kentucky
26322 20442 74.1 Rural Towns
21237 Wolfe County, Kentucky
7073 7214 100 Remote
21051 Clay County, Kentucky
19220 16615 78.6 Remote
21013 Bell County, Kentucky
26384 17356 62.5 Rural Towns
21025 Breathitt County, Kentucky
12977 10929 81.5 Remote
21083 Graves County, Kentucky
36911 26110 69.4 Rural Towns
21099 Hart County, Kentucky
18359 16214 87.2 Fringe
21231 Wayne County, Kentucky
20331 13876 67.7 Rural Towns
21155 Marion County, Kentucky
18471 14308 71.5 Rural Towns
21221 Trigg County, Kentucky
14237 11223 79.4 Fringe
21015 Boone County, Kentucky
128148 16778 13.3 Metropolitan
21131 Leslie County, Kentucky
10183 10918 100 Remote
21121 Knox County, Kentucky
31112 20009 62.9 Rural Towns
21127 Lawrence County, Kentucky
15677 12186 77.1 Fringe
21139 Livingston County, Kentucky
9204 8926 95.4 Micropolitan
21195 Pike County, Kentucky
59765 55343 87.8 Rural Towns
21211 Shelby County, Kentucky
45645 21095 47 Metropolitan
21005 Anderson County, Kentucky
22111 9127 41.7 Micropolitan
21027 Breckinridge County, Kentucky
19817 19888 100 Agriculture & Extraction
21073 Franklin County, Kentucky
49534 13744 27.6 Micropolitan
21117 Kenton County, Kentucky
163196 11436 7 Metropolitan
21151 Madison County, Kentucky
88838 33641 38.5 Micropolitan
21153 Magoffin County, Kentucky
12538 12913 100 Remote
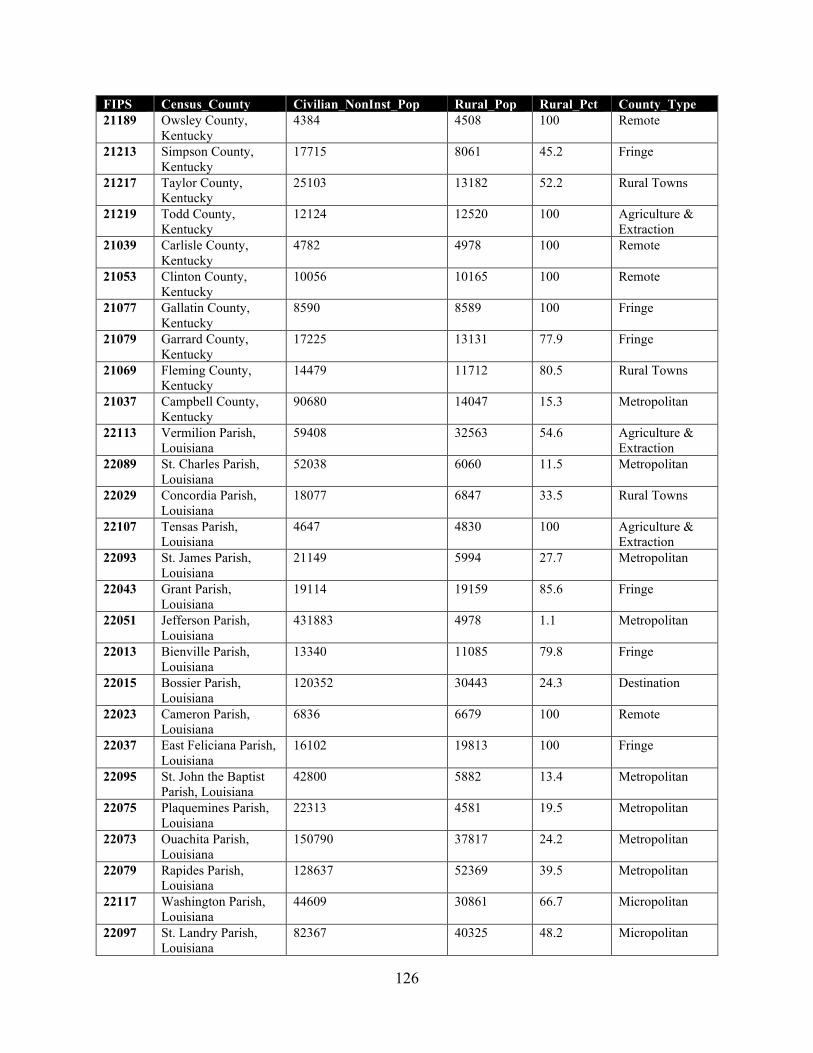
126
FIPS Census_County Civilian_NonInst_Pop Rural_Pop Rural_Pct County_Type 21189 Owsley County,
Kentucky 4384 4508 100 Remote
21213 Simpson County, Kentucky
17715 8061 45.2 Fringe
21217 Taylor County, Kentucky
25103 13182 52.2 Rural Towns
21219 Todd County, Kentucky
12124 12520 100 Agriculture & Extraction
21039 Carlisle County, Kentucky
4782 4978 100 Remote
21053 Clinton County, Kentucky
10056 10165 100 Remote
21077 Gallatin County, Kentucky
8590 8589 100 Fringe
21079 Garrard County, Kentucky
17225 13131 77.9 Fringe
21069 Fleming County, Kentucky
14479 11712 80.5 Rural Towns
21037 Campbell County, Kentucky
90680 14047 15.3 Metropolitan
22113 Vermilion Parish, Louisiana
59408 32563 54.6 Agriculture & Extraction
22089 St. Charles Parish, Louisiana
52038 6060 11.5 Metropolitan
22029 Concordia Parish, Louisiana
18077 6847 33.5 Rural Towns
22107 Tensas Parish, Louisiana
4647 4830 100 Agriculture & Extraction
22093 St. James Parish, Louisiana
21149 5994 27.7 Metropolitan
22043 Grant Parish, Louisiana
19114 19159 85.6 Fringe
22051 Jefferson Parish, Louisiana
431883 4978 1.1 Metropolitan
22013 Bienville Parish, Louisiana
13340 11085 79.8 Fringe
22015 Bossier Parish, Louisiana
120352 30443 24.3 Destination
22023 Cameron Parish, Louisiana
6836 6679 100 Remote
22037 East Feliciana Parish, Louisiana
16102 19813 100 Fringe
22095 St. John the Baptist Parish, Louisiana
42800 5882 13.4 Metropolitan
22075 Plaquemines Parish, Louisiana
22313 4581 19.5 Metropolitan
22073 Ouachita Parish, Louisiana
150790 37817 24.2 Metropolitan
22079 Rapides Parish, Louisiana
128637 52369 39.5 Metropolitan
22117 Washington Parish, Louisiana
44609 30861 66.7 Micropolitan
22097 St. Landry Parish, Louisiana
82367 40325 48.2 Micropolitan
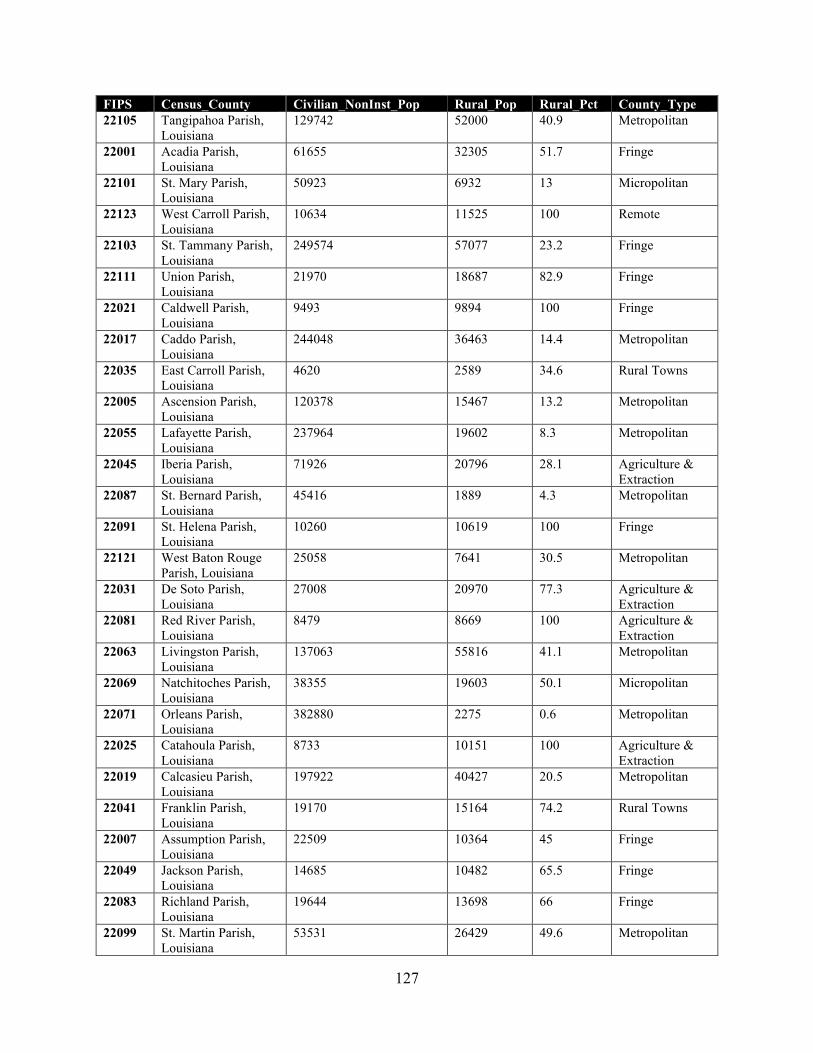
127
FIPS Census_County Civilian_NonInst_Pop Rural_Pop Rural_Pct County_Type 22105 Tangipahoa Parish,
Louisiana 129742 52000 40.9 Metropolitan
22001 Acadia Parish, Louisiana
61655 32305 51.7 Fringe
22101 St. Mary Parish, Louisiana
50923 6932 13 Micropolitan
22123 West Carroll Parish, Louisiana
10634 11525 100 Remote
22103 St. Tammany Parish, Louisiana
249574 57077 23.2 Fringe
22111 Union Parish, Louisiana
21970 18687 82.9 Fringe
22021 Caldwell Parish, Louisiana
9493 9894 100 Fringe
22017 Caddo Parish, Louisiana
244048 36463 14.4 Metropolitan
22035 East Carroll Parish, Louisiana
4620 2589 34.6 Rural Towns
22005 Ascension Parish, Louisiana
120378 15467 13.2 Metropolitan
22055 Lafayette Parish, Louisiana
237964 19602 8.3 Metropolitan
22045 Iberia Parish, Louisiana
71926 20796 28.1 Agriculture & Extraction
22087 St. Bernard Parish, Louisiana
45416 1889 4.3 Metropolitan
22091 St. Helena Parish, Louisiana
10260 10619 100 Fringe
22121 West Baton Rouge Parish, Louisiana
25058 7641 30.5 Metropolitan
22031 De Soto Parish, Louisiana
27008 20970 77.3 Agriculture & Extraction
22081 Red River Parish, Louisiana
8479 8669 100 Agriculture & Extraction
22063 Livingston Parish, Louisiana
137063 55816 41.1 Metropolitan
22069 Natchitoches Parish, Louisiana
38355 19603 50.1 Micropolitan
22071 Orleans Parish, Louisiana
382880 2275 0.6 Metropolitan
22025 Catahoula Parish, Louisiana
8733 10151 100 Agriculture & Extraction
22019 Calcasieu Parish, Louisiana
197922 40427 20.5 Metropolitan
22041 Franklin Parish, Louisiana
19170 15164 74.2 Rural Towns
22007 Assumption Parish, Louisiana
22509 10364 45 Fringe
22049 Jackson Parish, Louisiana
14685 10482 65.5 Fringe
22083 Richland Parish, Louisiana
19644 13698 66 Fringe
22099 St. Martin Parish, Louisiana
53531 26429 49.6 Metropolitan
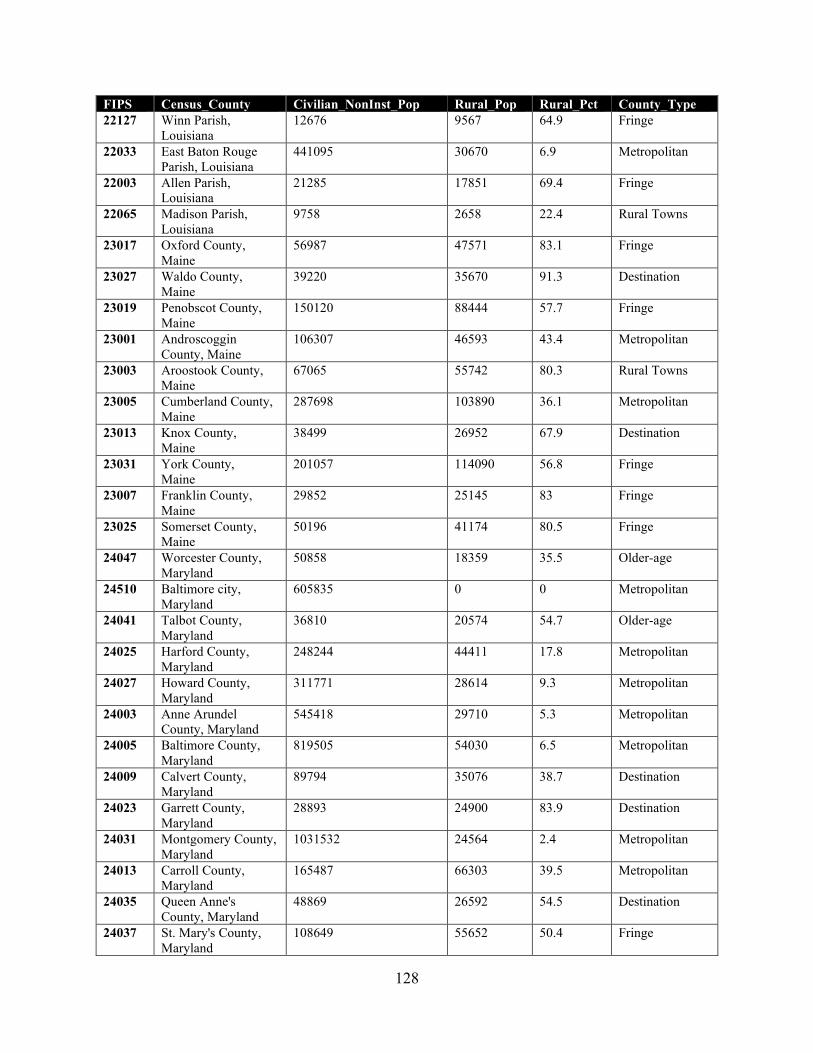
128
FIPS Census_County Civilian_NonInst_Pop Rural_Pop Rural_Pct County_Type 22127 Winn Parish,
Louisiana 12676 9567 64.9 Fringe
22033 East Baton Rouge Parish, Louisiana
441095 30670 6.9 Metropolitan
22003 Allen Parish, Louisiana
21285 17851 69.4 Fringe
22065 Madison Parish, Louisiana
9758 2658 22.4 Rural Towns
23017 Oxford County, Maine
56987 47571 83.1 Fringe
23027 Waldo County, Maine
39220 35670 91.3 Destination
23019 Penobscot County, Maine
150120 88444 57.7 Fringe
23001 Androscoggin County, Maine
106307 46593 43.4 Metropolitan
23003 Aroostook County, Maine
67065 55742 80.3 Rural Towns
23005 Cumberland County, Maine
287698 103890 36.1 Metropolitan
23013 Knox County, Maine
38499 26952 67.9 Destination
23031 York County, Maine
201057 114090 56.8 Fringe
23007 Franklin County, Maine
29852 25145 83 Fringe
23025 Somerset County, Maine
50196 41174 80.5 Fringe
24047 Worcester County, Maryland
50858 18359 35.5 Older-age
24510 Baltimore city, Maryland
605835 0 0 Metropolitan
24041 Talbot County, Maryland
36810 20574 54.7 Older-age
24025 Harford County, Maryland
248244 44411 17.8 Metropolitan
24027 Howard County, Maryland
311771 28614 9.3 Metropolitan
24003 Anne Arundel County, Maryland
545418 29710 5.3 Metropolitan
24005 Baltimore County, Maryland
819505 54030 6.5 Metropolitan
24009 Calvert County, Maryland
89794 35076 38.7 Destination
24023 Garrett County, Maryland
28893 24900 83.9 Destination
24031 Montgomery County, Maryland
1031532 24564 2.4 Metropolitan
24013 Carroll County, Maryland
165487 66303 39.5 Metropolitan
24035 Queen Anne's County, Maryland
48869 26592 54.5 Destination
24037 St. Mary's County, Maryland
108649 55652 50.4 Fringe
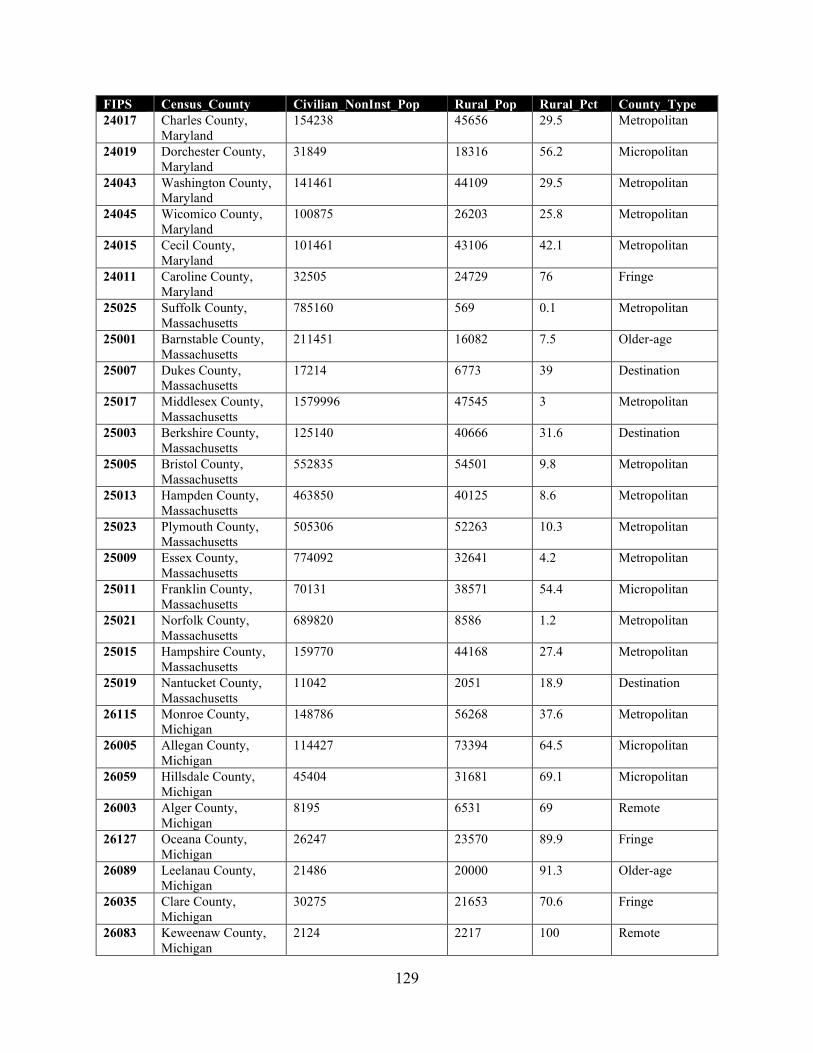
129
FIPS Census_County Civilian_NonInst_Pop Rural_Pop Rural_Pct County_Type 24017 Charles County,
Maryland 154238 45656 29.5 Metropolitan
24019 Dorchester County, Maryland
31849 18316 56.2 Micropolitan
24043 Washington County, Maryland
141461 44109 29.5 Metropolitan
24045 Wicomico County, Maryland
100875 26203 25.8 Metropolitan
24015 Cecil County, Maryland
101461 43106 42.1 Metropolitan
24011 Caroline County, Maryland
32505 24729 76 Fringe
25025 Suffolk County, Massachusetts
785160 569 0.1 Metropolitan
25001 Barnstable County, Massachusetts
211451 16082 7.5 Older-age
25007 Dukes County, Massachusetts
17214 6773 39 Destination
25017 Middlesex County, Massachusetts
1579996 47545 3 Metropolitan
25003 Berkshire County, Massachusetts
125140 40666 31.6 Destination
25005 Bristol County, Massachusetts
552835 54501 9.8 Metropolitan
25013 Hampden County, Massachusetts
463850 40125 8.6 Metropolitan
25023 Plymouth County, Massachusetts
505306 52263 10.3 Metropolitan
25009 Essex County, Massachusetts
774092 32641 4.2 Metropolitan
25011 Franklin County, Massachusetts
70131 38571 54.4 Micropolitan
25021 Norfolk County, Massachusetts
689820 8586 1.2 Metropolitan
25015 Hampshire County, Massachusetts
159770 44168 27.4 Metropolitan
25019 Nantucket County, Massachusetts
11042 2051 18.9 Destination
26115 Monroe County, Michigan
148786 56268 37.6 Metropolitan
26005 Allegan County, Michigan
114427 73394 64.5 Micropolitan
26059 Hillsdale County, Michigan
45404 31681 69.1 Micropolitan
26003 Alger County, Michigan
8195 6531 69 Remote
26127 Oceana County, Michigan
26247 23570 89.9 Fringe
26089 Leelanau County, Michigan
21486 20000 91.3 Older-age
26035 Clare County, Michigan
30275 21653 70.6 Fringe
26083 Keweenaw County, Michigan
2124 2217 100 Remote
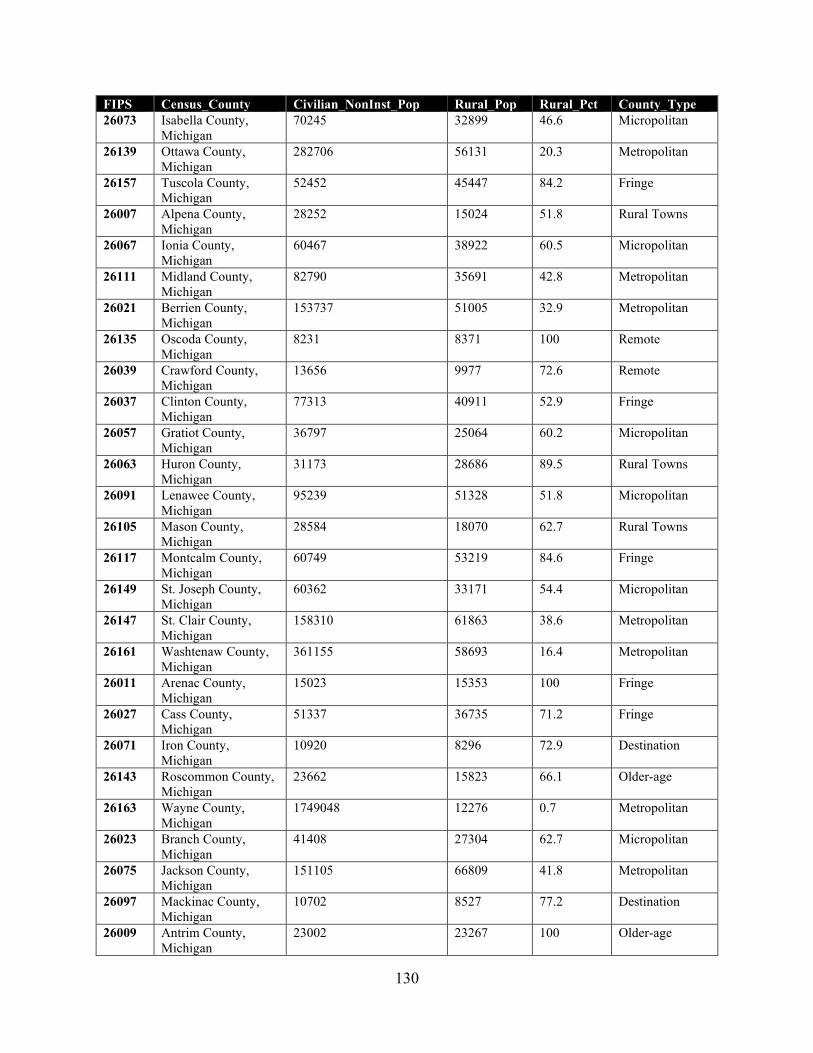
130
FIPS Census_County Civilian_NonInst_Pop Rural_Pop Rural_Pct County_Type 26073 Isabella County,
Michigan 70245 32899 46.6 Micropolitan
26139 Ottawa County, Michigan
282706 56131 20.3 Metropolitan
26157 Tuscola County, Michigan
52452 45447 84.2 Fringe
26007 Alpena County, Michigan
28252 15024 51.8 Rural Towns
26067 Ionia County, Michigan
60467 38922 60.5 Micropolitan
26111 Midland County, Michigan
82790 35691 42.8 Metropolitan
26021 Berrien County, Michigan
153737 51005 32.9 Metropolitan
26135 Oscoda County, Michigan
8231 8371 100 Remote
26039 Crawford County, Michigan
13656 9977 72.6 Remote
26037 Clinton County, Michigan
77313 40911 52.9 Fringe
26057 Gratiot County, Michigan
36797 25064 60.2 Micropolitan
26063 Huron County, Michigan
31173 28686 89.5 Rural Towns
26091 Lenawee County, Michigan
95239 51328 51.8 Micropolitan
26105 Mason County, Michigan
28584 18070 62.7 Rural Towns
26117 Montcalm County, Michigan
60749 53219 84.6 Fringe
26149 St. Joseph County, Michigan
60362 33171 54.4 Micropolitan
26147 St. Clair County, Michigan
158310 61863 38.6 Metropolitan
26161 Washtenaw County, Michigan
361155 58693 16.4 Metropolitan
26011 Arenac County, Michigan
15023 15353 100 Fringe
26027 Cass County, Michigan
51337 36735 71.2 Fringe
26071 Iron County, Michigan
10920 8296 72.9 Destination
26143 Roscommon County, Michigan
23662 15823 66.1 Older-age
26163 Wayne County, Michigan
1749048 12276 0.7 Metropolitan
26023 Branch County, Michigan
41408 27304 62.7 Micropolitan
26075 Jackson County, Michigan
151105 66809 41.8 Metropolitan
26097 Mackinac County, Michigan
10702 8527 77.2 Destination
26009 Antrim County, Michigan
23002 23267 100 Older-age
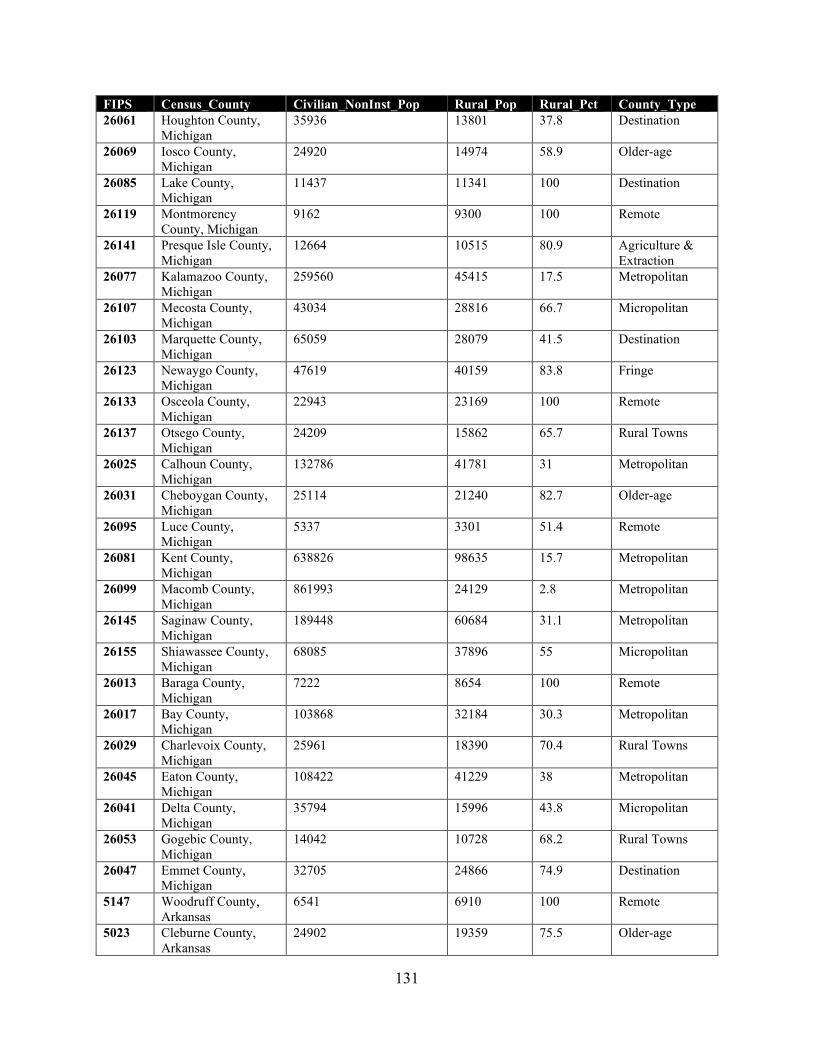
131
FIPS Census_County Civilian_NonInst_Pop Rural_Pop Rural_Pct County_Type 26061 Houghton County,
Michigan 35936 13801 37.8 Destination
26069 Iosco County, Michigan
24920 14974 58.9 Older-age
26085 Lake County, Michigan
11437 11341 100 Destination
26119 Montmorency County, Michigan
9162 9300 100 Remote
26141 Presque Isle County, Michigan
12664 10515 80.9 Agriculture & Extraction
26077 Kalamazoo County, Michigan
259560 45415 17.5 Metropolitan
26107 Mecosta County, Michigan
43034 28816 66.7 Micropolitan
26103 Marquette County, Michigan
65059 28079 41.5 Destination
26123 Newaygo County, Michigan
47619 40159 83.8 Fringe
26133 Osceola County, Michigan
22943 23169 100 Remote
26137 Otsego County, Michigan
24209 15862 65.7 Rural Towns
26025 Calhoun County, Michigan
132786 41781 31 Metropolitan
26031 Cheboygan County, Michigan
25114 21240 82.7 Older-age
26095 Luce County, Michigan
5337 3301 51.4 Remote
26081 Kent County, Michigan
638826 98635 15.7 Metropolitan
26099 Macomb County, Michigan
861993 24129 2.8 Metropolitan
26145 Saginaw County, Michigan
189448 60684 31.1 Metropolitan
26155 Shiawassee County, Michigan
68085 37896 55 Micropolitan
26013 Baraga County, Michigan
7222 8654 100 Remote
26017 Bay County, Michigan
103868 32184 30.3 Metropolitan
26029 Charlevoix County, Michigan
25961 18390 70.4 Rural Towns
26045 Eaton County, Michigan
108422 41229 38 Metropolitan
26041 Delta County, Michigan
35794 15996 43.8 Micropolitan
26053 Gogebic County, Michigan
14042 10728 68.2 Rural Towns
26047 Emmet County, Michigan
32705 24866 74.9 Destination
5147 Woodruff County, Arkansas
6541 6910 100 Remote
5023 Cleburne County, Arkansas
24902 19359 75.5 Older-age
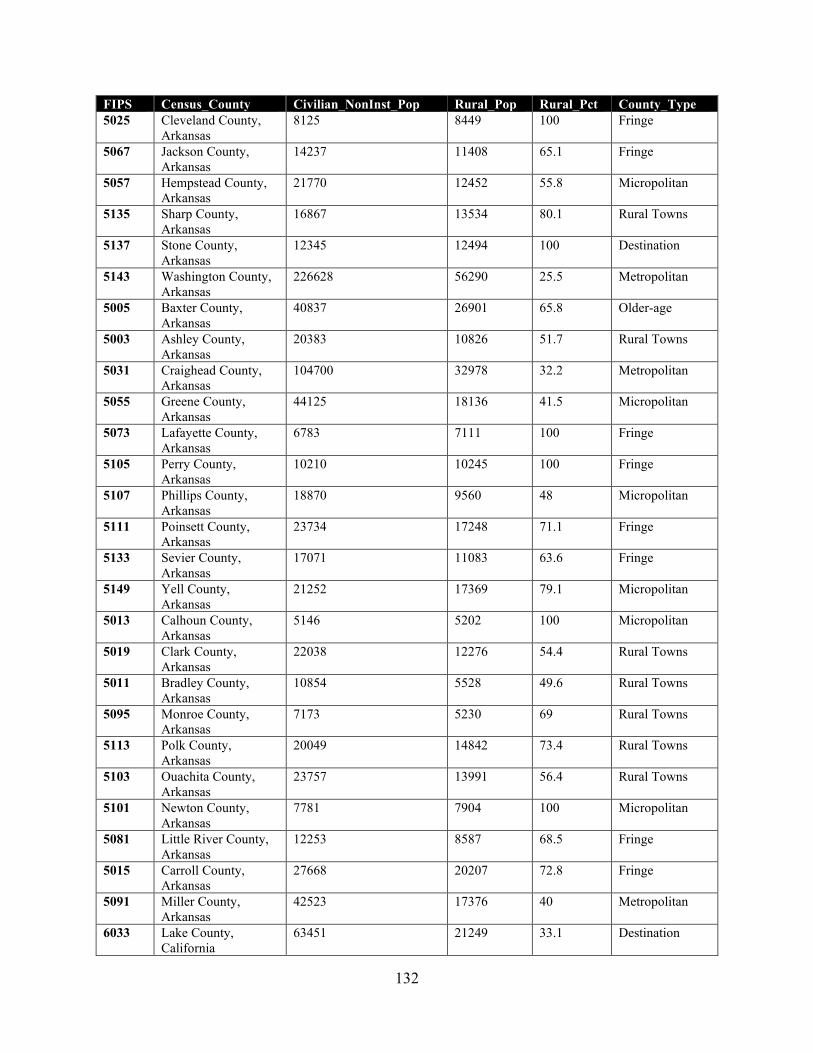
132
FIPS Census_County Civilian_NonInst_Pop Rural_Pop Rural_Pct County_Type 5025 Cleveland County,
Arkansas 8125 8449 100 Fringe
5067 Jackson County, Arkansas
14237 11408 65.1 Fringe
5057 Hempstead County, Arkansas
21770 12452 55.8 Micropolitan
5135 Sharp County, Arkansas
16867 13534 80.1 Rural Towns
5137 Stone County, Arkansas
12345 12494 100 Destination
5143 Washington County, Arkansas
226628 56290 25.5 Metropolitan
5005 Baxter County, Arkansas
40837 26901 65.8 Older-age
5003 Ashley County, Arkansas
20383 10826 51.7 Rural Towns
5031 Craighead County, Arkansas
104700 32978 32.2 Metropolitan
5055 Greene County, Arkansas
44125 18136 41.5 Micropolitan
5073 Lafayette County, Arkansas
6783 7111 100 Fringe
5105 Perry County, Arkansas
10210 10245 100 Fringe
5107 Phillips County, Arkansas
18870 9560 48 Micropolitan
5111 Poinsett County, Arkansas
23734 17248 71.1 Fringe
5133 Sevier County, Arkansas
17071 11083 63.6 Fringe
5149 Yell County, Arkansas
21252 17369 79.1 Micropolitan
5013 Calhoun County, Arkansas
5146 5202 100 Micropolitan
5019 Clark County, Arkansas
22038 12276 54.4 Rural Towns
5011 Bradley County, Arkansas
10854 5528 49.6 Rural Towns
5095 Monroe County, Arkansas
7173 5230 69 Rural Towns
5113 Polk County, Arkansas
20049 14842 73.4 Rural Towns
5103 Ouachita County, Arkansas
23757 13991 56.4 Rural Towns
5101 Newton County, Arkansas
7781 7904 100 Micropolitan
5081 Little River County, Arkansas
12253 8587 68.5 Fringe
5015 Carroll County, Arkansas
27668 20207 72.8 Fringe
5091 Miller County, Arkansas
42523 17376 40 Metropolitan
6033 Lake County, California
63451 21249 33.1 Destination
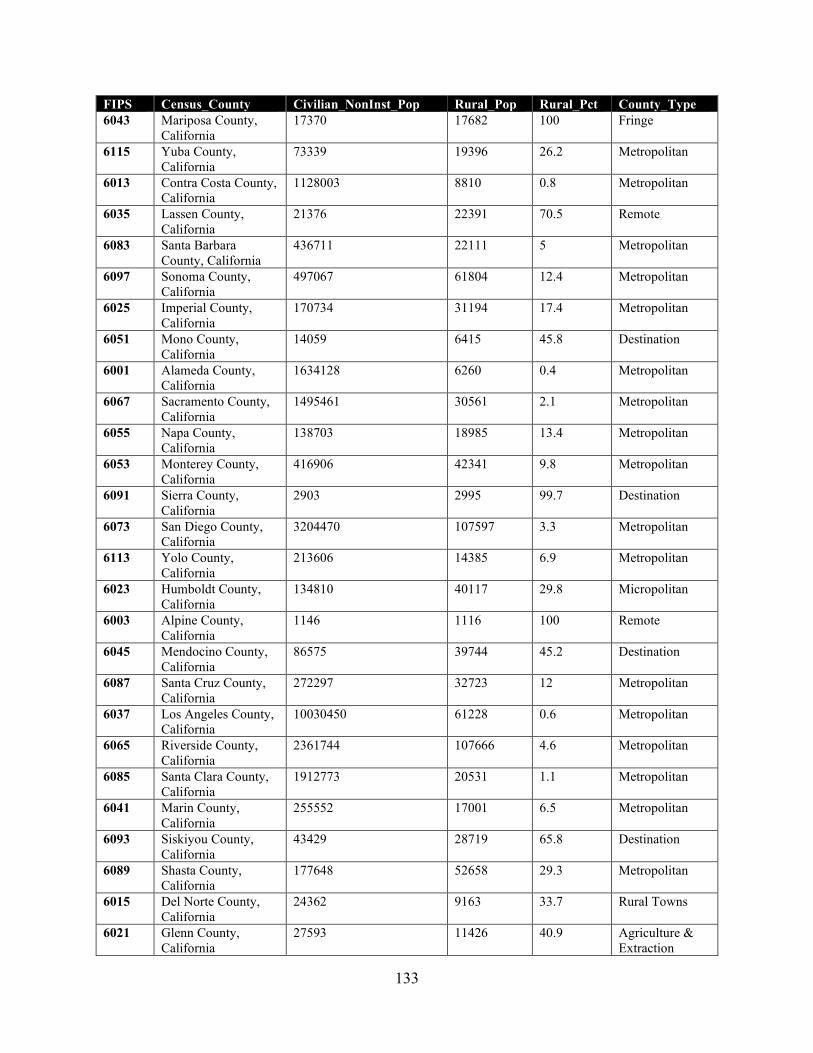
133
FIPS Census_County Civilian_NonInst_Pop Rural_Pop Rural_Pct County_Type 6043 Mariposa County,
California 17370 17682 100 Fringe
6115 Yuba County, California
73339 19396 26.2 Metropolitan
6013 Contra Costa County, California
1128003 8810 0.8 Metropolitan
6035 Lassen County, California
21376 22391 70.5 Remote
6083 Santa Barbara County, California
436711 22111 5 Metropolitan
6097 Sonoma County, California
497067 61804 12.4 Metropolitan
6025 Imperial County, California
170734 31194 17.4 Metropolitan
6051 Mono County, California
14059 6415 45.8 Destination
6001 Alameda County, California
1634128 6260 0.4 Metropolitan
6067 Sacramento County, California
1495461 30561 2.1 Metropolitan
6055 Napa County, California
138703 18985 13.4 Metropolitan
6053 Monterey County, California
416906 42341 9.8 Metropolitan
6091 Sierra County, California
2903 2995 99.7 Destination
6073 San Diego County, California
3204470 107597 3.3 Metropolitan
6113 Yolo County, California
213606 14385 6.9 Metropolitan
6023 Humboldt County, California
134810 40117 29.8 Micropolitan
6003 Alpine County, California
1146 1116 100 Remote
6045 Mendocino County, California
86575 39744 45.2 Destination
6087 Santa Cruz County, California
272297 32723 12 Metropolitan
6037 Los Angeles County, California
10030450 61228 0.6 Metropolitan
6065 Riverside County, California
2361744 107666 4.6 Metropolitan
6085 Santa Clara County, California
1912773 20531 1.1 Metropolitan
6041 Marin County, California
255552 17001 6.5 Metropolitan
6093 Siskiyou County, California
43429 28719 65.8 Destination
6089 Shasta County, California
177648 52658 29.3 Metropolitan
6015 Del Norte County, California
24362 9163 33.7 Rural Towns
6021 Glenn County, California
27593 11426 40.9 Agriculture & Extraction
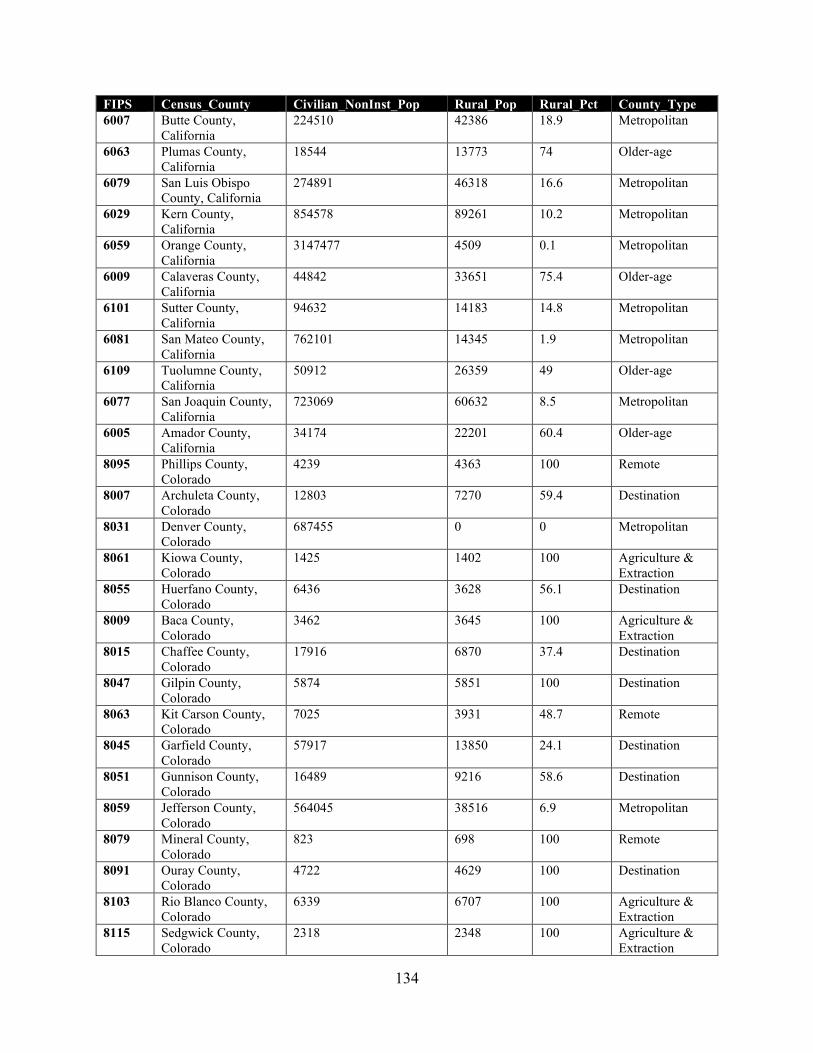
134
FIPS Census_County Civilian_NonInst_Pop Rural_Pop Rural_Pct County_Type 6007 Butte County,
California 224510 42386 18.9 Metropolitan
6063 Plumas County, California
18544 13773 74 Older-age
6079 San Luis Obispo County, California
274891 46318 16.6 Metropolitan
6029 Kern County, California
854578 89261 10.2 Metropolitan
6059 Orange County, California
3147477 4509 0.1 Metropolitan
6009 Calaveras County, California
44842 33651 75.4 Older-age
6101 Sutter County, California
94632 14183 14.8 Metropolitan
6081 San Mateo County, California
762101 14345 1.9 Metropolitan
6109 Tuolumne County, California
50912 26359 49 Older-age
6077 San Joaquin County, California
723069 60632 8.5 Metropolitan
6005 Amador County, California
34174 22201 60.4 Older-age
8095 Phillips County, Colorado
4239 4363 100 Remote
8007 Archuleta County, Colorado
12803 7270 59.4 Destination
8031 Denver County, Colorado
687455 0 0 Metropolitan
8061 Kiowa County, Colorado
1425 1402 100 Agriculture & Extraction
8055 Huerfano County, Colorado
6436 3628 56.1 Destination
8009 Baca County, Colorado
3462 3645 100 Agriculture & Extraction
8015 Chaffee County, Colorado
17916 6870 37.4 Destination
8047 Gilpin County, Colorado
5874 5851 100 Destination
8063 Kit Carson County, Colorado
7025 3931 48.7 Remote
8045 Garfield County, Colorado
57917 13850 24.1 Destination
8051 Gunnison County, Colorado
16489 9216 58.6 Destination
8059 Jefferson County, Colorado
564045 38516 6.9 Metropolitan
8079 Mineral County, Colorado
823 698 100 Remote
8091 Ouray County, Colorado
4722 4629 100 Destination
8103 Rio Blanco County, Colorado
6339 6707 100 Agriculture & Extraction
8115 Sedgwick County, Colorado
2318 2348 100 Agriculture & Extraction

135
FIPS Census_County Civilian_NonInst_Pop Rural_Pop Rural_Pct County_Type 8021 Conejos County,
Colorado 8104 8265 100 Agriculture &
Extraction 8023 Costilla County,
Colorado 3687 3568 100 Agriculture &
Extraction 8001 Adams County,
Colorado 493596 17404 3.6 Metropolitan
8037 Eagle County, Colorado
54259 10576 20 Destination
8065 Lake County, Colorado
7533 2286 31.1 Destination
8081 Moffat County, Colorado
12930 3537 27.4 Agriculture & Extraction
8097 Pitkin County, Colorado
17877 7791 44.2 Destination
8017 Cheyenne County, Colorado
1998 1871 100 Agriculture & Extraction
8025 Crowley County, Colorado
4431 5360 100 Agriculture & Extraction
8033 Dolores County, Colorado
1841 1978 100 Remote
8057 Jackson County, Colorado
1291 1396 100 Destination
8069 Larimer County, Colorado
335713 37794 11.7 Metropolitan
8083 Montezuma County, Colorado
25738 17314 67.2 Fringe
8113 San Miguel County, Colorado
7942 7840 100 Destination
8013 Boulder County, Colorado
318941 27928 8.9 Metropolitan
8071 Las Animas County, Colorado
13606 5732 40.8 Remote
8125 Yuma County, Colorado
9927 6622 64.9 Agriculture & Extraction
8107 Routt County, Colorado
24723 10782 45.2 Destination
8117 Summit County, Colorado
30351 5739 19.5 Destination
8019 Clear Creek County, Colorado
9275 9187 100 Destination
8029 Delta County, Colorado
29216 18869 63.2 Agriculture & Extraction
8101 Pueblo County, Colorado
161283 22911 14.2 Metropolitan
8087 Morgan County, Colorado
27900 9220 32.5 Micropolitan
8093 Park County, Colorado
17281 16345 100 Destination
8077 Mesa County, Colorado
148901 18793 12.7 Metropolitan
8099 Prowers County, Colorado
11913 4559 37.9 Rural Towns
8041 El Paso County, Colorado
655933 59281 8.9 Metropolitan
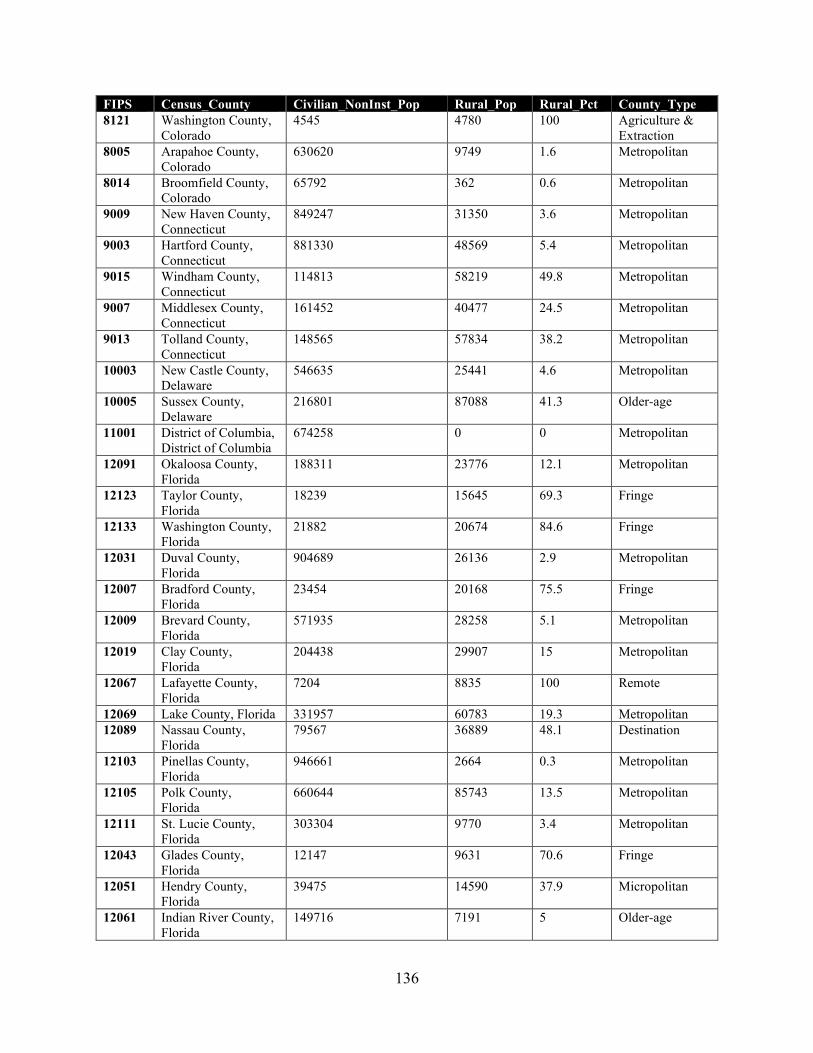
136
FIPS Census_County Civilian_NonInst_Pop Rural_Pop Rural_Pct County_Type 8121 Washington County,
Colorado 4545 4780 100 Agriculture &
Extraction 8005 Arapahoe County,
Colorado 630620 9749 1.6 Metropolitan
8014 Broomfield County, Colorado
65792 362 0.6 Metropolitan
9009 New Haven County, Connecticut
849247 31350 3.6 Metropolitan
9003 Hartford County, Connecticut
881330 48569 5.4 Metropolitan
9015 Windham County, Connecticut
114813 58219 49.8 Metropolitan
9007 Middlesex County, Connecticut
161452 40477 24.5 Metropolitan
9013 Tolland County, Connecticut
148565 57834 38.2 Metropolitan
10003 New Castle County, Delaware
546635 25441 4.6 Metropolitan
10005 Sussex County, Delaware
216801 87088 41.3 Older-age
11001 District of Columbia, District of Columbia
674258 0 0 Metropolitan
12091 Okaloosa County, Florida
188311 23776 12.1 Metropolitan
12123 Taylor County, Florida
18239 15645 69.3 Fringe
12133 Washington County, Florida
21882 20674 84.6 Fringe
12031 Duval County, Florida
904689 26136 2.9 Metropolitan
12007 Bradford County, Florida
23454 20168 75.5 Fringe
12009 Brevard County, Florida
571935 28258 5.1 Metropolitan
12019 Clay County, Florida
204438 29907 15 Metropolitan
12067 Lafayette County, Florida
7204 8835 100 Remote
12069 Lake County, Florida 331957 60783 19.3 Metropolitan 12089 Nassau County,
Florida 79567 36889 48.1 Destination
12103 Pinellas County, Florida
946661 2664 0.3 Metropolitan
12105 Polk County, Florida
660644 85743 13.5 Metropolitan
12111 St. Lucie County, Florida
303304 9770 3.4 Metropolitan
12043 Glades County, Florida
12147 9631 70.6 Fringe
12051 Hendry County, Florida
39475 14590 37.9 Micropolitan
12061 Indian River County, Florida
149716 7191 5 Older-age
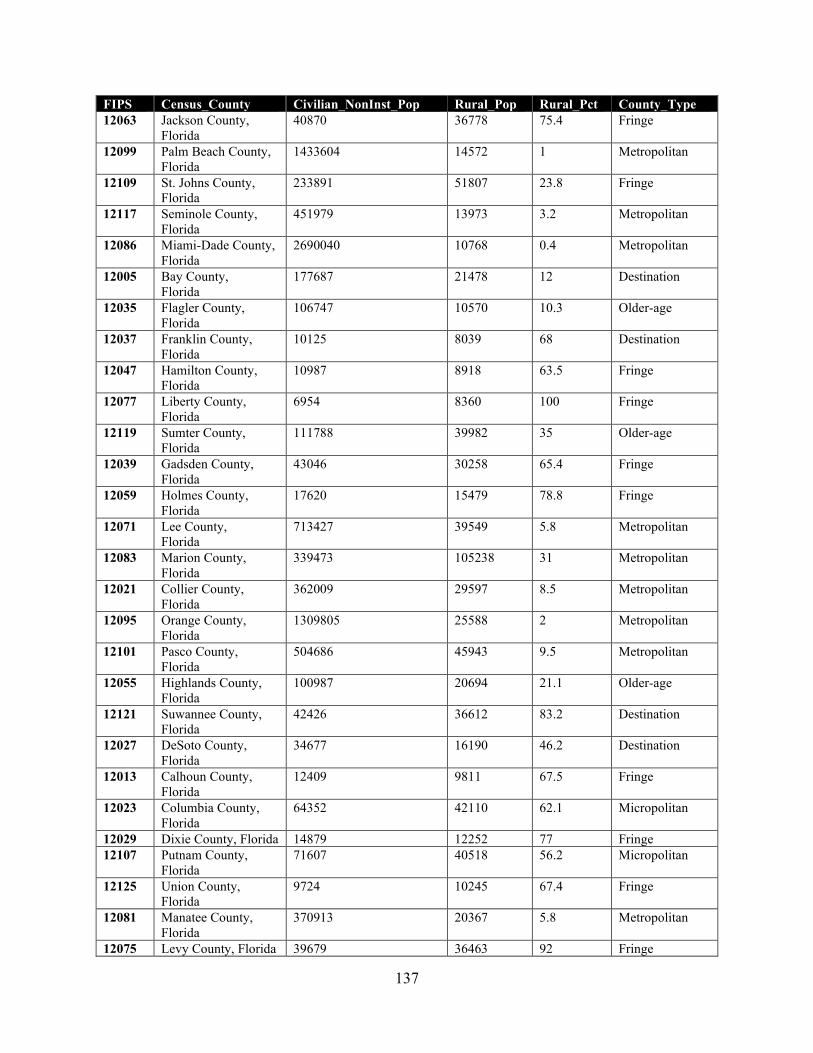
137
FIPS Census_County Civilian_NonInst_Pop Rural_Pop Rural_Pct County_Type 12063 Jackson County,
Florida 40870 36778 75.4 Fringe
12099 Palm Beach County, Florida
1433604 14572 1 Metropolitan
12109 St. Johns County, Florida
233891 51807 23.8 Fringe
12117 Seminole County, Florida
451979 13973 3.2 Metropolitan
12086 Miami-Dade County, Florida
2690040 10768 0.4 Metropolitan
12005 Bay County, Florida
177687 21478 12 Destination
12035 Flagler County, Florida
106747 10570 10.3 Older-age
12037 Franklin County, Florida
10125 8039 68 Destination
12047 Hamilton County, Florida
10987 8918 63.5 Fringe
12077 Liberty County, Florida
6954 8360 100 Fringe
12119 Sumter County, Florida
111788 39982 35 Older-age
12039 Gadsden County, Florida
43046 30258 65.4 Fringe
12059 Holmes County, Florida
17620 15479 78.8 Fringe
12071 Lee County, Florida
713427 39549 5.8 Metropolitan
12083 Marion County, Florida
339473 105238 31 Metropolitan
12021 Collier County, Florida
362009 29597 8.5 Metropolitan
12095 Orange County, Florida
1309805 25588 2 Metropolitan
12101 Pasco County, Florida
504686 45943 9.5 Metropolitan
12055 Highlands County, Florida
100987 20694 21.1 Older-age
12121 Suwannee County, Florida
42426 36612 83.2 Destination
12027 DeSoto County, Florida
34677 16190 46.2 Destination
12013 Calhoun County, Florida
12409 9811 67.5 Fringe
12023 Columbia County, Florida
64352 42110 62.1 Micropolitan
12029 Dixie County, Florida 14879 12252 77 Fringe 12107 Putnam County,
Florida 71607 40518 56.2 Micropolitan
12125 Union County, Florida
9724 10245 67.4 Fringe
12081 Manatee County, Florida
370913 20367 5.8 Metropolitan
12075 Levy County, Florida 39679 36463 92 Fringe
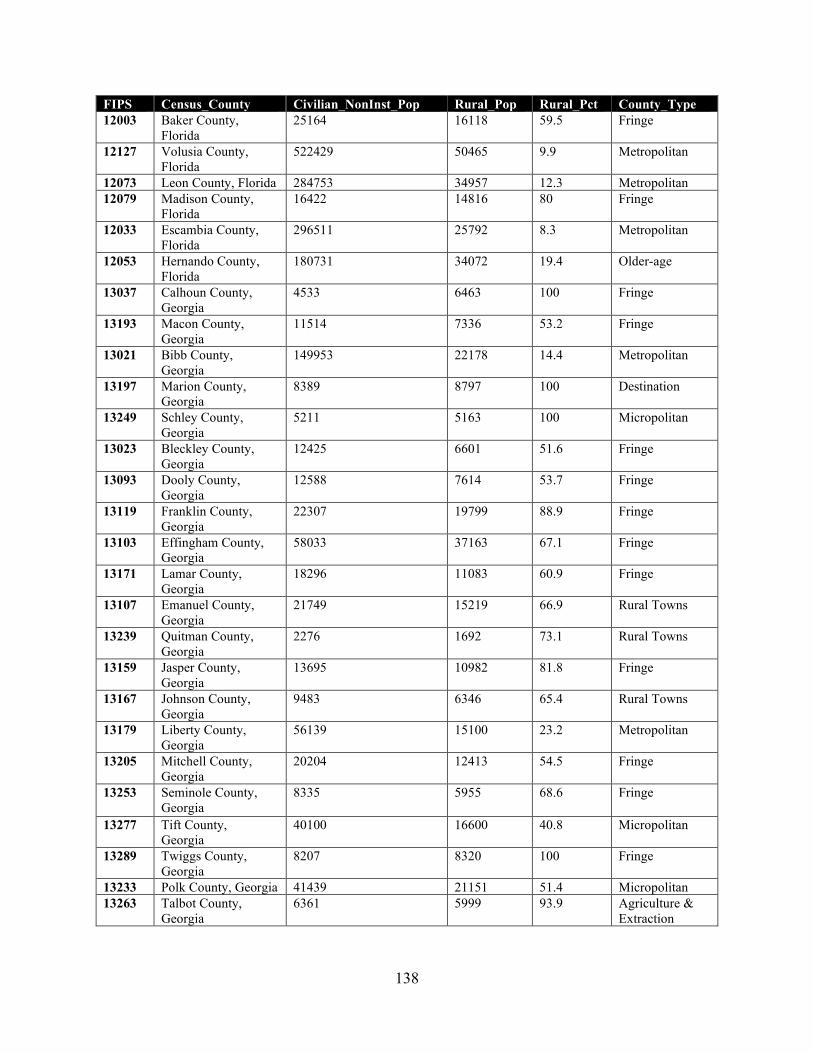
138
FIPS Census_County Civilian_NonInst_Pop Rural_Pop Rural_Pct County_Type 12003 Baker County,
Florida 25164 16118 59.5 Fringe
12127 Volusia County, Florida
522429 50465 9.9 Metropolitan
12073 Leon County, Florida 284753 34957 12.3 Metropolitan 12079 Madison County,
Florida 16422 14816 80 Fringe
12033 Escambia County, Florida
296511 25792 8.3 Metropolitan
12053 Hernando County, Florida
180731 34072 19.4 Older-age
13037 Calhoun County, Georgia
4533 6463 100 Fringe
13193 Macon County, Georgia
11514 7336 53.2 Fringe
13021 Bibb County, Georgia
149953 22178 14.4 Metropolitan
13197 Marion County, Georgia
8389 8797 100 Destination
13249 Schley County, Georgia
5211 5163 100 Micropolitan
13023 Bleckley County, Georgia
12425 6601 51.6 Fringe
13093 Dooly County, Georgia
12588 7614 53.7 Fringe
13119 Franklin County, Georgia
22307 19799 88.9 Fringe
13103 Effingham County, Georgia
58033 37163 67.1 Fringe
13171 Lamar County, Georgia
18296 11083 60.9 Fringe
13107 Emanuel County, Georgia
21749 15219 66.9 Rural Towns
13239 Quitman County, Georgia
2276 1692 73.1 Rural Towns
13159 Jasper County, Georgia
13695 10982 81.8 Fringe
13167 Johnson County, Georgia
9483 6346 65.4 Rural Towns
13179 Liberty County, Georgia
56139 15100 23.2 Metropolitan
13205 Mitchell County, Georgia
20204 12413 54.5 Fringe
13253 Seminole County, Georgia
8335 5955 68.6 Fringe
13277 Tift County, Georgia
40100 16600 40.8 Micropolitan
13289 Twiggs County, Georgia
8207 8320 100 Fringe
13233 Polk County, Georgia 41439 21151 51.4 Micropolitan 13263 Talbot County,
Georgia 6361 5999 93.9 Agriculture &
Extraction
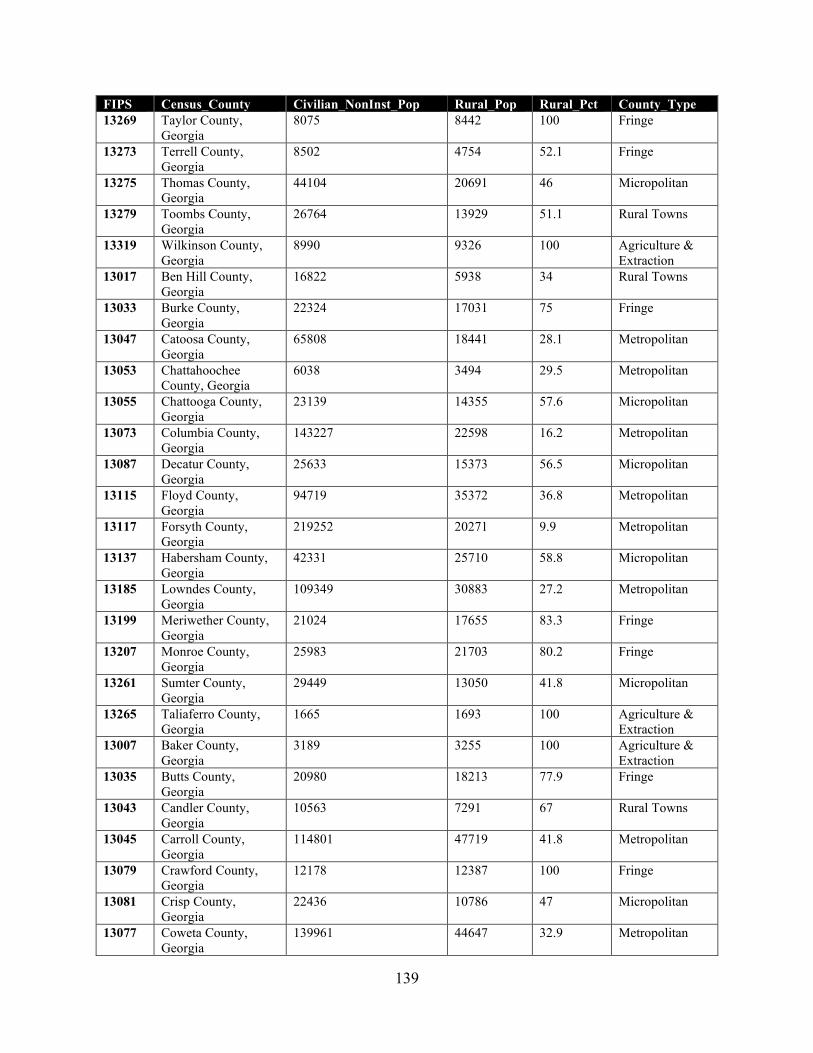
139
FIPS Census_County Civilian_NonInst_Pop Rural_Pop Rural_Pct County_Type 13269 Taylor County,
Georgia 8075 8442 100 Fringe
13273 Terrell County, Georgia
8502 4754 52.1 Fringe
13275 Thomas County, Georgia
44104 20691 46 Micropolitan
13279 Toombs County, Georgia
26764 13929 51.1 Rural Towns
13319 Wilkinson County, Georgia
8990 9326 100 Agriculture & Extraction
13017 Ben Hill County, Georgia
16822 5938 34 Rural Towns
13033 Burke County, Georgia
22324 17031 75 Fringe
13047 Catoosa County, Georgia
65808 18441 28.1 Metropolitan
13053 Chattahoochee County, Georgia
6038 3494 29.5 Metropolitan
13055 Chattooga County, Georgia
23139 14355 57.6 Micropolitan
13073 Columbia County, Georgia
143227 22598 16.2 Metropolitan
13087 Decatur County, Georgia
25633 15373 56.5 Micropolitan
13115 Floyd County, Georgia
94719 35372 36.8 Metropolitan
13117 Forsyth County, Georgia
219252 20271 9.9 Metropolitan
13137 Habersham County, Georgia
42331 25710 58.8 Micropolitan
13185 Lowndes County, Georgia
109349 30883 27.2 Metropolitan
13199 Meriwether County, Georgia
21024 17655 83.3 Fringe
13207 Monroe County, Georgia
25983 21703 80.2 Fringe
13261 Sumter County, Georgia
29449 13050 41.8 Micropolitan
13265 Taliaferro County, Georgia
1665 1693 100 Agriculture & Extraction
13007 Baker County, Georgia
3189 3255 100 Agriculture & Extraction
13035 Butts County, Georgia
20980 18213 77.9 Fringe
13043 Candler County, Georgia
10563 7291 67 Rural Towns
13045 Carroll County, Georgia
114801 47719 41.8 Metropolitan
13079 Crawford County, Georgia
12178 12387 100 Fringe
13081 Crisp County, Georgia
22436 10786 47 Micropolitan
13077 Coweta County, Georgia
139961 44647 32.9 Metropolitan
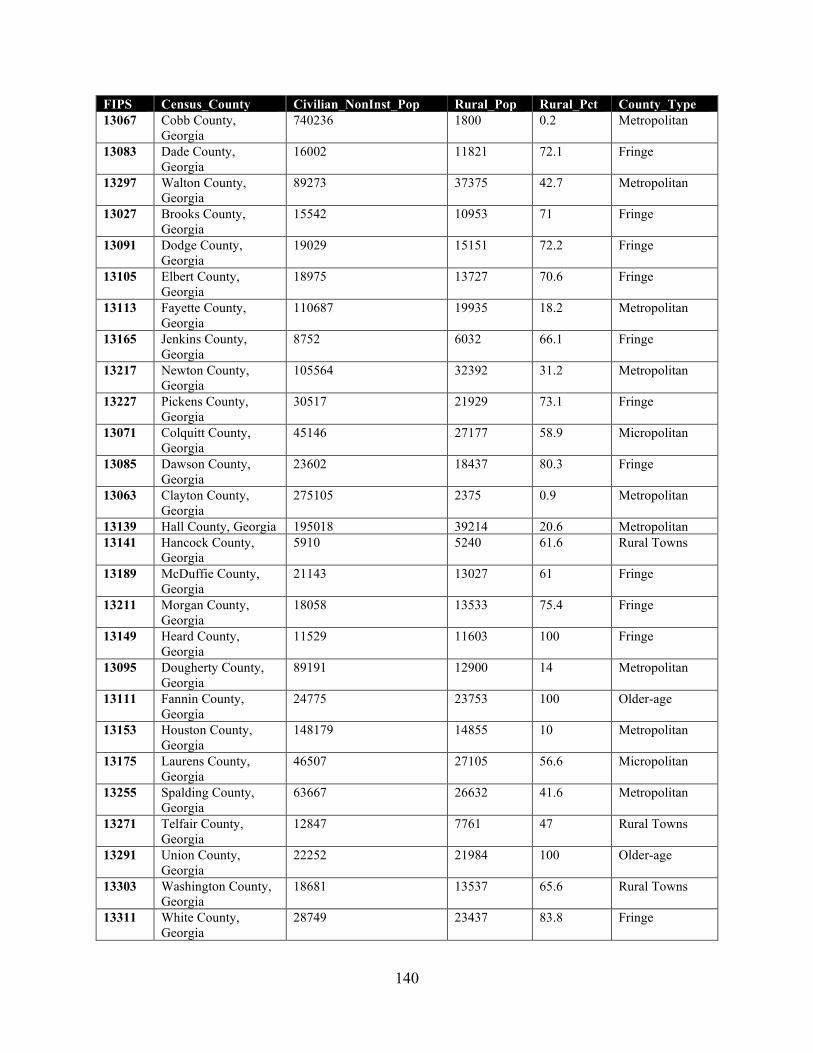
140
FIPS Census_County Civilian_NonInst_Pop Rural_Pop Rural_Pct County_Type 13067 Cobb County,
Georgia 740236 1800 0.2 Metropolitan
13083 Dade County, Georgia
16002 11821 72.1 Fringe
13297 Walton County, Georgia
89273 37375 42.7 Metropolitan
13027 Brooks County, Georgia
15542 10953 71 Fringe
13091 Dodge County, Georgia
19029 15151 72.2 Fringe
13105 Elbert County, Georgia
18975 13727 70.6 Fringe
13113 Fayette County, Georgia
110687 19935 18.2 Metropolitan
13165 Jenkins County, Georgia
8752 6032 66.1 Fringe
13217 Newton County, Georgia
105564 32392 31.2 Metropolitan
13227 Pickens County, Georgia
30517 21929 73.1 Fringe
13071 Colquitt County, Georgia
45146 27177 58.9 Micropolitan
13085 Dawson County, Georgia
23602 18437 80.3 Fringe
13063 Clayton County, Georgia
275105 2375 0.9 Metropolitan
13139 Hall County, Georgia 195018 39214 20.6 Metropolitan 13141 Hancock County,
Georgia 5910 5240 61.6 Rural Towns
13189 McDuffie County, Georgia
21143 13027 61 Fringe
13211 Morgan County, Georgia
18058 13533 75.4 Fringe
13149 Heard County, Georgia
11529 11603 100 Fringe
13095 Dougherty County, Georgia
89191 12900 14 Metropolitan
13111 Fannin County, Georgia
24775 23753 100 Older-age
13153 Houston County, Georgia
148179 14855 10 Metropolitan
13175 Laurens County, Georgia
46507 27105 56.6 Micropolitan
13255 Spalding County, Georgia
63667 26632 41.6 Metropolitan
13271 Telfair County, Georgia
12847 7761 47 Rural Towns
13291 Union County, Georgia
22252 21984 100 Older-age
13303 Washington County, Georgia
18681 13537 65.6 Rural Towns
13311 White County, Georgia
28749 23437 83.8 Fringe
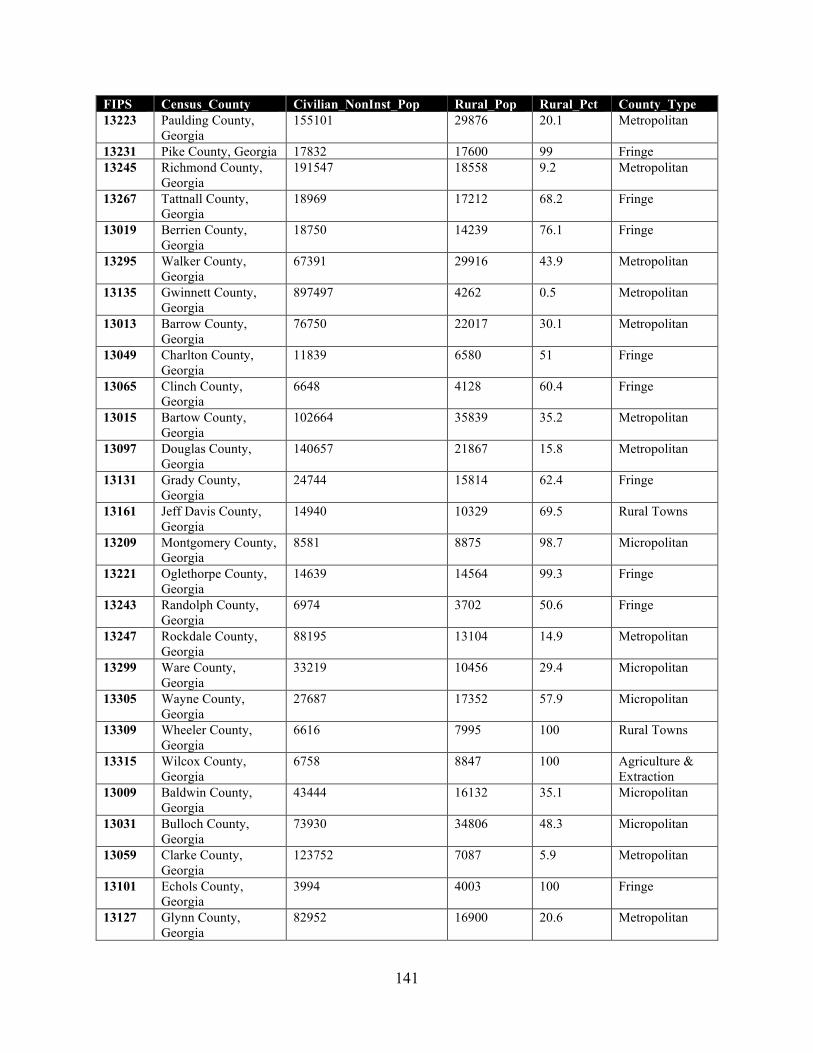
141
FIPS Census_County Civilian_NonInst_Pop Rural_Pop Rural_Pct County_Type 13223 Paulding County,
Georgia 155101 29876 20.1 Metropolitan
13231 Pike County, Georgia 17832 17600 99 Fringe 13245 Richmond County,
Georgia 191547 18558 9.2 Metropolitan
13267 Tattnall County, Georgia
18969 17212 68.2 Fringe
13019 Berrien County, Georgia
18750 14239 76.1 Fringe
13295 Walker County, Georgia
67391 29916 43.9 Metropolitan
13135 Gwinnett County, Georgia
897497 4262 0.5 Metropolitan
13013 Barrow County, Georgia
76750 22017 30.1 Metropolitan
13049 Charlton County, Georgia
11839 6580 51 Fringe
13065 Clinch County, Georgia
6648 4128 60.4 Fringe
13015 Bartow County, Georgia
102664 35839 35.2 Metropolitan
13097 Douglas County, Georgia
140657 21867 15.8 Metropolitan
13131 Grady County, Georgia
24744 15814 62.4 Fringe
13161 Jeff Davis County, Georgia
14940 10329 69.5 Rural Towns
13209 Montgomery County, Georgia
8581 8875 98.7 Micropolitan
13221 Oglethorpe County, Georgia
14639 14564 99.3 Fringe
13243 Randolph County, Georgia
6974 3702 50.6 Fringe
13247 Rockdale County, Georgia
88195 13104 14.9 Metropolitan
13299 Ware County, Georgia
33219 10456 29.4 Micropolitan
13305 Wayne County, Georgia
27687 17352 57.9 Micropolitan
13309 Wheeler County, Georgia
6616 7995 100 Rural Towns
13315 Wilcox County, Georgia
6758 8847 100 Agriculture & Extraction
13009 Baldwin County, Georgia
43444 16132 35.1 Micropolitan
13031 Bulloch County, Georgia
73930 34806 48.3 Micropolitan
13059 Clarke County, Georgia
123752 7087 5.9 Metropolitan
13101 Echols County, Georgia
3994 4003 100 Fringe
13127 Glynn County, Georgia
82952 16900 20.6 Metropolitan
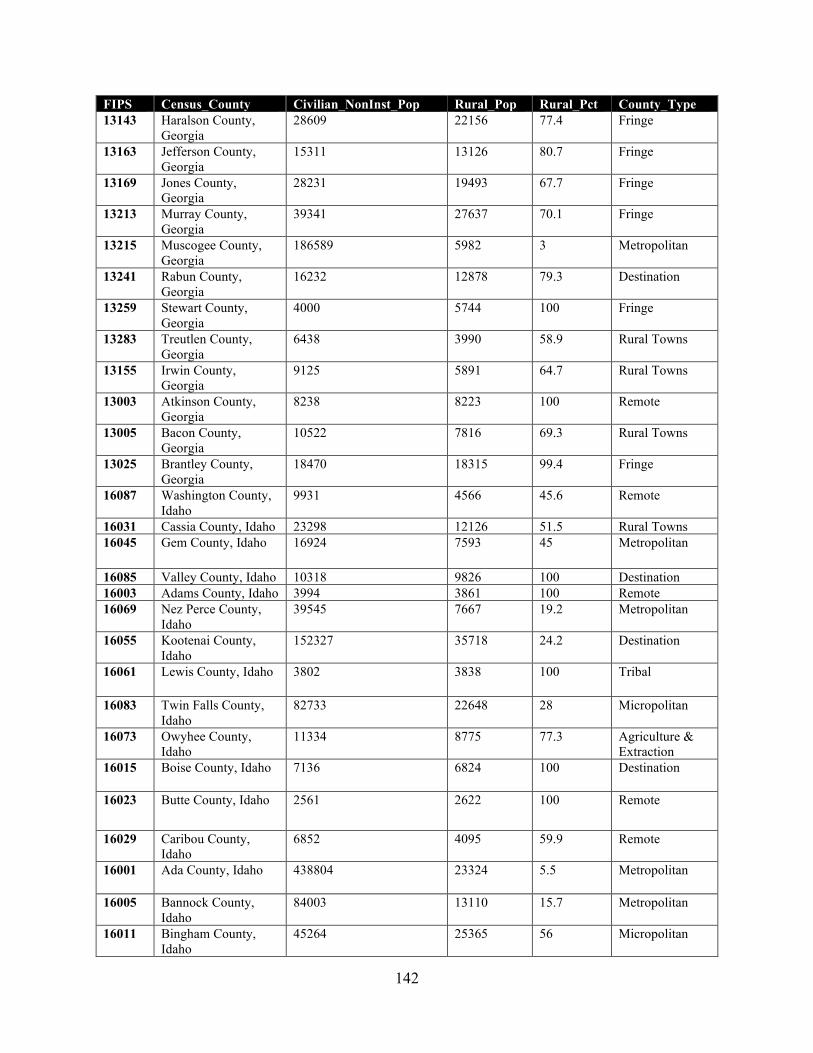
142
FIPS Census_County Civilian_NonInst_Pop Rural_Pop Rural_Pct County_Type 13143 Haralson County,
Georgia 28609 22156 77.4 Fringe
13163 Jefferson County, Georgia
15311 13126 80.7 Fringe
13169 Jones County, Georgia
28231 19493 67.7 Fringe
13213 Murray County, Georgia
39341 27637 70.1 Fringe
13215 Muscogee County, Georgia
186589 5982 3 Metropolitan
13241 Rabun County, Georgia
16232 12878 79.3 Destination
13259 Stewart County, Georgia
4000 5744 100 Fringe
13283 Treutlen County, Georgia
6438 3990 58.9 Rural Towns
13155 Irwin County, Georgia
9125 5891 64.7 Rural Towns
13003 Atkinson County, Georgia
8238 8223 100 Remote
13005 Bacon County, Georgia
10522 7816 69.3 Rural Towns
13025 Brantley County, Georgia
18470 18315 99.4 Fringe
16087 Washington County, Idaho
9931 4566 45.6 Remote
16031 Cassia County, Idaho 23298 12126 51.5 Rural Towns 16045 Gem County, Idaho 16924 7593 45 Metropolitan
16085 Valley County, Idaho 10318 9826 100 Destination 16003 Adams County, Idaho 3994 3861 100 Remote 16069 Nez Perce County,
Idaho 39545 7667 19.2 Metropolitan
16055 Kootenai County, Idaho
152327 35718 24.2 Destination
16061 Lewis County, Idaho 3802 3838 100 Tribal
16083 Twin Falls County, Idaho
82733 22648 28 Micropolitan
16073 Owyhee County, Idaho
11334 8775 77.3 Agriculture & Extraction
16015 Boise County, Idaho 7136 6824 100 Destination
16023 Butte County, Idaho 2561 2622 100 Remote
16029 Caribou County, Idaho
6852 4095 59.9 Remote
16001 Ada County, Idaho 438804 23324 5.5 Metropolitan
16005 Bannock County, Idaho
84003 13110 15.7 Metropolitan
16011 Bingham County, Idaho
45264 25365 56 Micropolitan
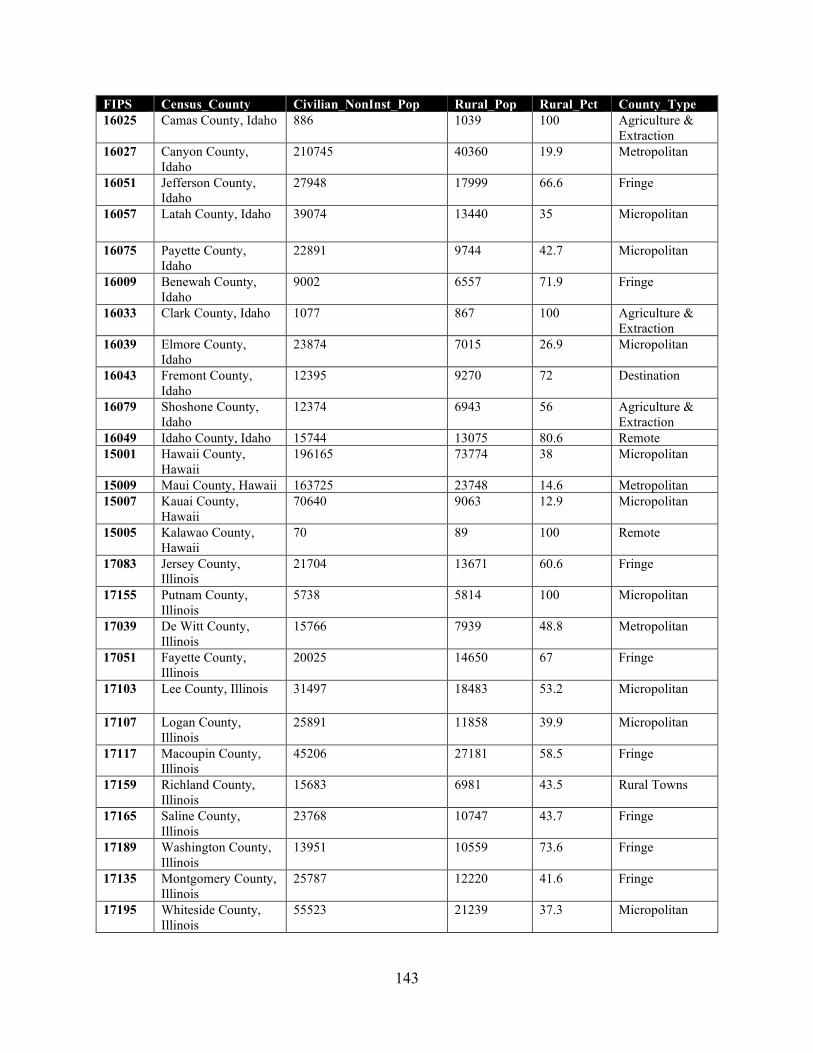
143
FIPS Census_County Civilian_NonInst_Pop Rural_Pop Rural_Pct County_Type 16025 Camas County, Idaho 886 1039 100 Agriculture &
Extraction 16027 Canyon County,
Idaho 210745 40360 19.9 Metropolitan
16051 Jefferson County, Idaho
27948 17999 66.6 Fringe
16057 Latah County, Idaho 39074 13440 35 Micropolitan
16075 Payette County, Idaho
22891 9744 42.7 Micropolitan
16009 Benewah County, Idaho
9002 6557 71.9 Fringe
16033 Clark County, Idaho 1077 867 100 Agriculture & Extraction
16039 Elmore County, Idaho
23874 7015 26.9 Micropolitan
16043 Fremont County, Idaho
12395 9270 72 Destination
16079 Shoshone County, Idaho
12374 6943 56 Agriculture & Extraction
16049 Idaho County, Idaho 15744 13075 80.6 Remote 15001 Hawaii County,
Hawaii 196165 73774 38 Micropolitan
15009 Maui County, Hawaii 163725 23748 14.6 Metropolitan 15007 Kauai County,
Hawaii 70640 9063 12.9 Micropolitan
15005 Kalawao County, Hawaii
70 89 100 Remote
17083 Jersey County, Illinois
21704 13671 60.6 Fringe
17155 Putnam County, Illinois
5738 5814 100 Micropolitan
17039 De Witt County, Illinois
15766 7939 48.8 Metropolitan
17051 Fayette County, Illinois
20025 14650 67 Fringe
17103 Lee County, Illinois 31497 18483 53.2 Micropolitan
17107 Logan County, Illinois
25891 11858 39.9 Micropolitan
17117 Macoupin County, Illinois
45206 27181 58.5 Fringe
17159 Richland County, Illinois
15683 6981 43.5 Rural Towns
17165 Saline County, Illinois
23768 10747 43.7 Fringe
17189 Washington County, Illinois
13951 10559 73.6 Fringe
17135 Montgomery County, Illinois
25787 12220 41.6 Fringe
17195 Whiteside County, Illinois
55523 21239 37.3 Micropolitan
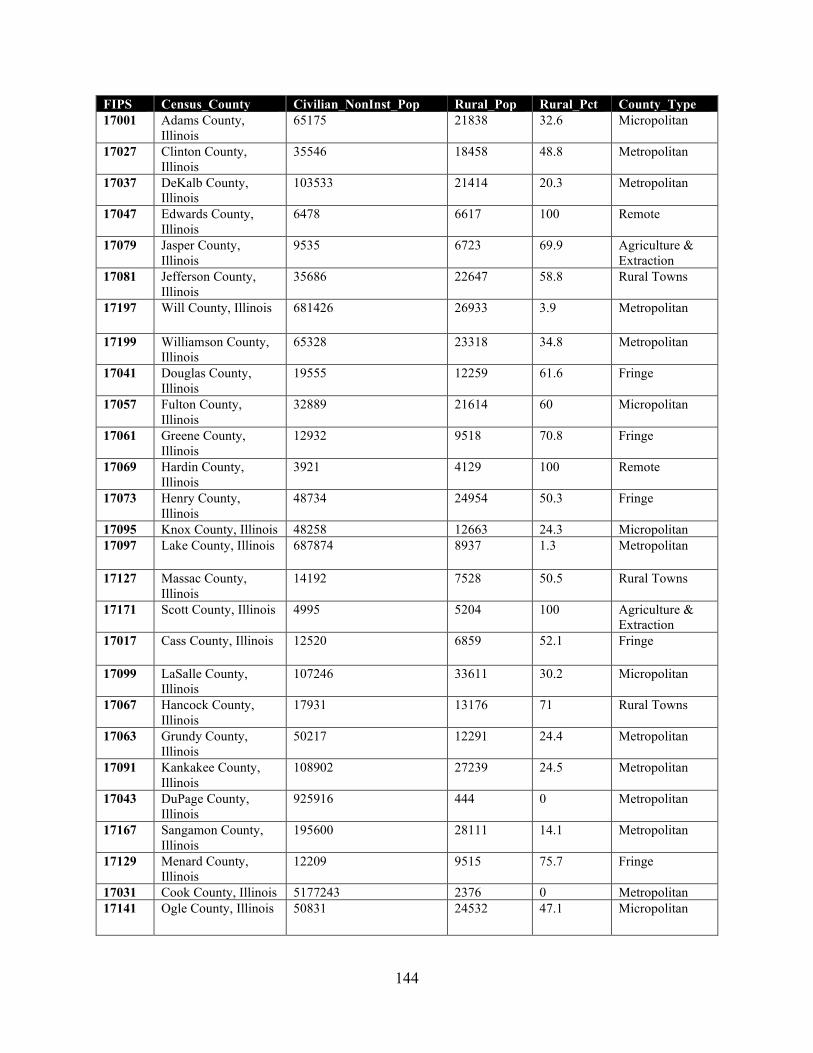
144
FIPS Census_County Civilian_NonInst_Pop Rural_Pop Rural_Pct County_Type 17001 Adams County,
Illinois 65175 21838 32.6 Micropolitan
17027 Clinton County, Illinois
35546 18458 48.8 Metropolitan
17037 DeKalb County, Illinois
103533 21414 20.3 Metropolitan
17047 Edwards County, Illinois
6478 6617 100 Remote
17079 Jasper County, Illinois
9535 6723 69.9 Agriculture & Extraction
17081 Jefferson County, Illinois
35686 22647 58.8 Rural Towns
17197 Will County, Illinois 681426 26933 3.9 Metropolitan
17199 Williamson County, Illinois
65328 23318 34.8 Metropolitan
17041 Douglas County, Illinois
19555 12259 61.6 Fringe
17057 Fulton County, Illinois
32889 21614 60 Micropolitan
17061 Greene County, Illinois
12932 9518 70.8 Fringe
17069 Hardin County, Illinois
3921 4129 100 Remote
17073 Henry County, Illinois
48734 24954 50.3 Fringe
17095 Knox County, Illinois 48258 12663 24.3 Micropolitan 17097 Lake County, Illinois 687874 8937 1.3 Metropolitan
17127 Massac County, Illinois
14192 7528 50.5 Rural Towns
17171 Scott County, Illinois 4995 5204 100 Agriculture & Extraction
17017 Cass County, Illinois 12520 6859 52.1 Fringe
17099 LaSalle County, Illinois
107246 33611 30.2 Micropolitan
17067 Hancock County, Illinois
17931 13176 71 Rural Towns
17063 Grundy County, Illinois
50217 12291 24.4 Metropolitan
17091 Kankakee County, Illinois
108902 27239 24.5 Metropolitan
17043 DuPage County, Illinois
925916 444 0 Metropolitan
17167 Sangamon County, Illinois
195600 28111 14.1 Metropolitan
17129 Menard County, Illinois
12209 9515 75.7 Fringe
17031 Cook County, Illinois 5177243 2376 0 Metropolitan 17141 Ogle County, Illinois 50831 24532 47.1 Micropolitan
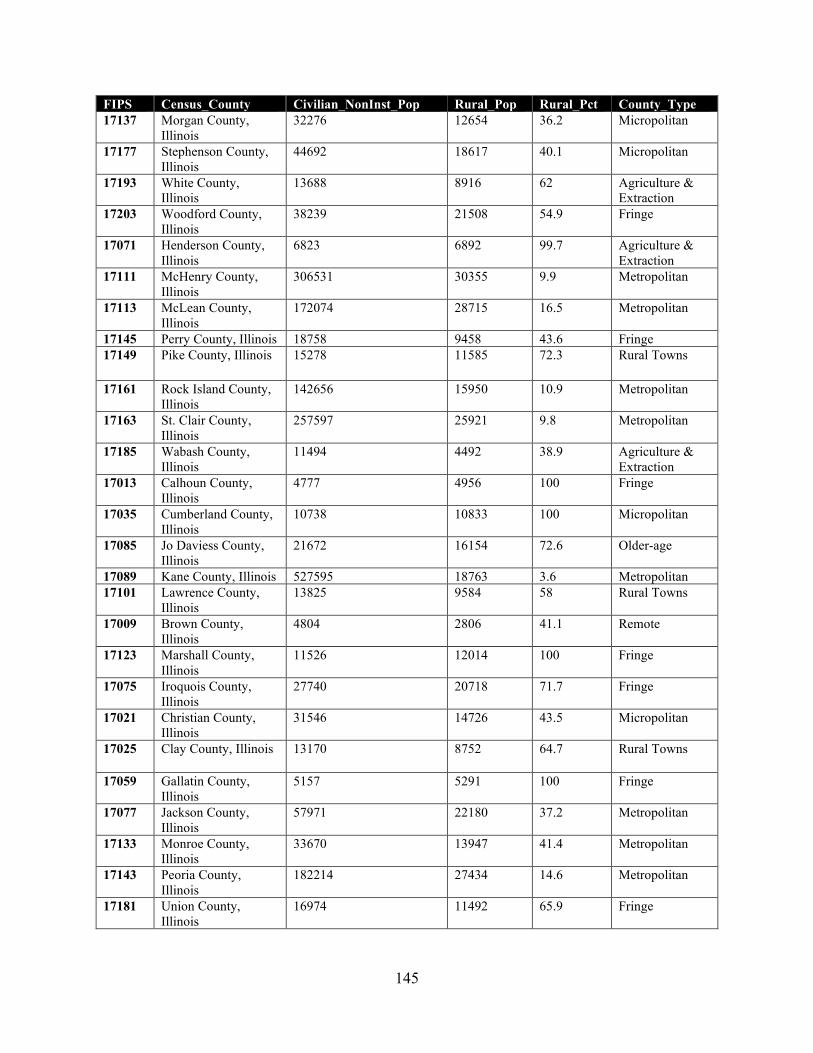
145
FIPS Census_County Civilian_NonInst_Pop Rural_Pop Rural_Pct County_Type 17137 Morgan County,
Illinois 32276 12654 36.2 Micropolitan
17177 Stephenson County, Illinois
44692 18617 40.1 Micropolitan
17193 White County, Illinois
13688 8916 62 Agriculture & Extraction
17203 Woodford County, Illinois
38239 21508 54.9 Fringe
17071 Henderson County, Illinois
6823 6892 99.7 Agriculture & Extraction
17111 McHenry County, Illinois
306531 30355 9.9 Metropolitan
17113 McLean County, Illinois
172074 28715 16.5 Metropolitan
17145 Perry County, Illinois 18758 9458 43.6 Fringe 17149 Pike County, Illinois 15278 11585 72.3 Rural Towns
17161 Rock Island County, Illinois
142656 15950 10.9 Metropolitan
17163 St. Clair County, Illinois
257597 25921 9.8 Metropolitan
17185 Wabash County, Illinois
11494 4492 38.9 Agriculture & Extraction
17013 Calhoun County, Illinois
4777 4956 100 Fringe
17035 Cumberland County, Illinois
10738 10833 100 Micropolitan
17085 Jo Daviess County, Illinois
21672 16154 72.6 Older-age
17089 Kane County, Illinois 527595 18763 3.6 Metropolitan 17101 Lawrence County,
Illinois 13825 9584 58 Rural Towns
17009 Brown County, Illinois
4804 2806 41.1 Remote
17123 Marshall County, Illinois
11526 12014 100 Fringe
17075 Iroquois County, Illinois
27740 20718 71.7 Fringe
17021 Christian County, Illinois
31546 14726 43.5 Micropolitan
17025 Clay County, Illinois 13170 8752 64.7 Rural Towns
17059 Gallatin County, Illinois
5157 5291 100 Fringe
17077 Jackson County, Illinois
57971 22180 37.2 Metropolitan
17133 Monroe County, Illinois
33670 13947 41.4 Metropolitan
17143 Peoria County, Illinois
182214 27434 14.6 Metropolitan
17181 Union County, Illinois
16974 11492 65.9 Fringe
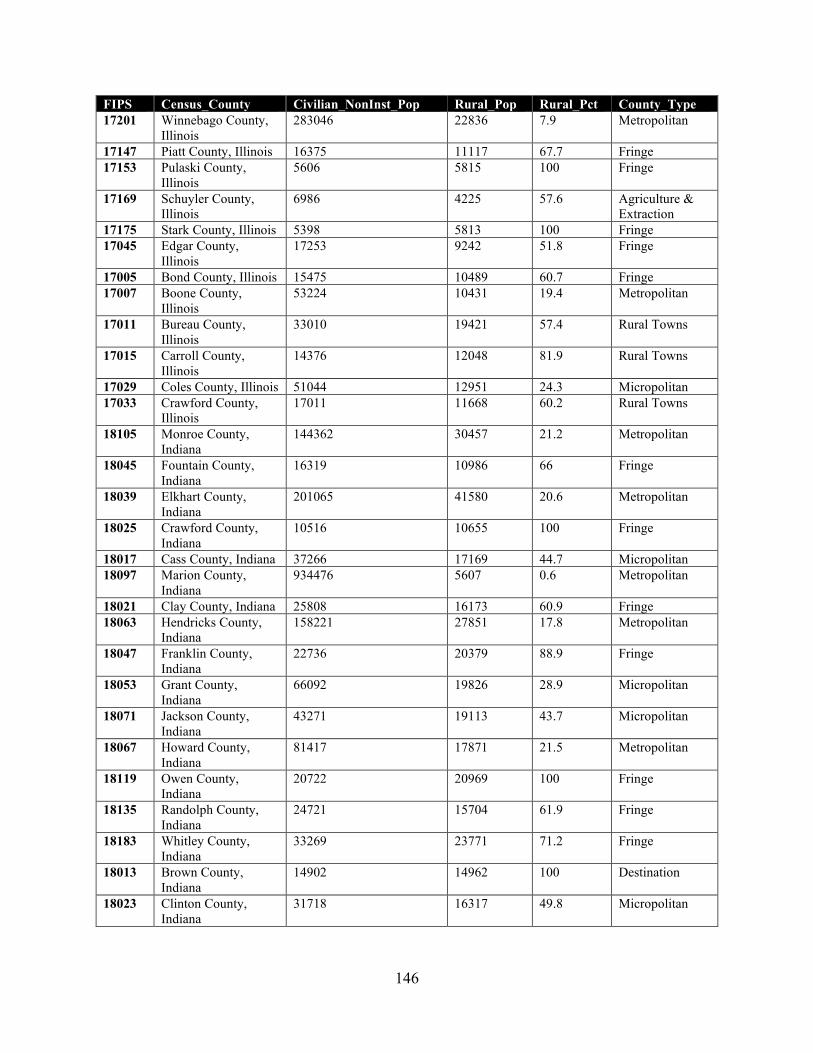
146
FIPS Census_County Civilian_NonInst_Pop Rural_Pop Rural_Pct County_Type 17201 Winnebago County,
Illinois 283046 22836 7.9 Metropolitan
17147 Piatt County, Illinois 16375 11117 67.7 Fringe 17153 Pulaski County,
Illinois 5606 5815 100 Fringe
17169 Schuyler County, Illinois
6986 4225 57.6 Agriculture & Extraction
17175 Stark County, Illinois 5398 5813 100 Fringe 17045 Edgar County,
Illinois 17253 9242 51.8 Fringe
17005 Bond County, Illinois 15475 10489 60.7 Fringe 17007 Boone County,
Illinois 53224 10431 19.4 Metropolitan
17011 Bureau County, Illinois
33010 19421 57.4 Rural Towns
17015 Carroll County, Illinois
14376 12048 81.9 Rural Towns
17029 Coles County, Illinois 51044 12951 24.3 Micropolitan 17033 Crawford County,
Illinois 17011 11668 60.2 Rural Towns
18105 Monroe County, Indiana
144362 30457 21.2 Metropolitan
18045 Fountain County, Indiana
16319 10986 66 Fringe
18039 Elkhart County, Indiana
201065 41580 20.6 Metropolitan
18025 Crawford County, Indiana
10516 10655 100 Fringe
18017 Cass County, Indiana 37266 17169 44.7 Micropolitan 18097 Marion County,
Indiana 934476 5607 0.6 Metropolitan
18021 Clay County, Indiana 25808 16173 60.9 Fringe 18063 Hendricks County,
Indiana 158221 27851 17.8 Metropolitan
18047 Franklin County, Indiana
22736 20379 88.9 Fringe
18053 Grant County, Indiana
66092 19826 28.9 Micropolitan
18071 Jackson County, Indiana
43271 19113 43.7 Micropolitan
18067 Howard County, Indiana
81417 17871 21.5 Metropolitan
18119 Owen County, Indiana
20722 20969 100 Fringe
18135 Randolph County, Indiana
24721 15704 61.9 Fringe
18183 Whitley County, Indiana
33269 23771 71.2 Fringe
18013 Brown County, Indiana
14902 14962 100 Destination
18023 Clinton County, Indiana
31718 16317 49.8 Micropolitan
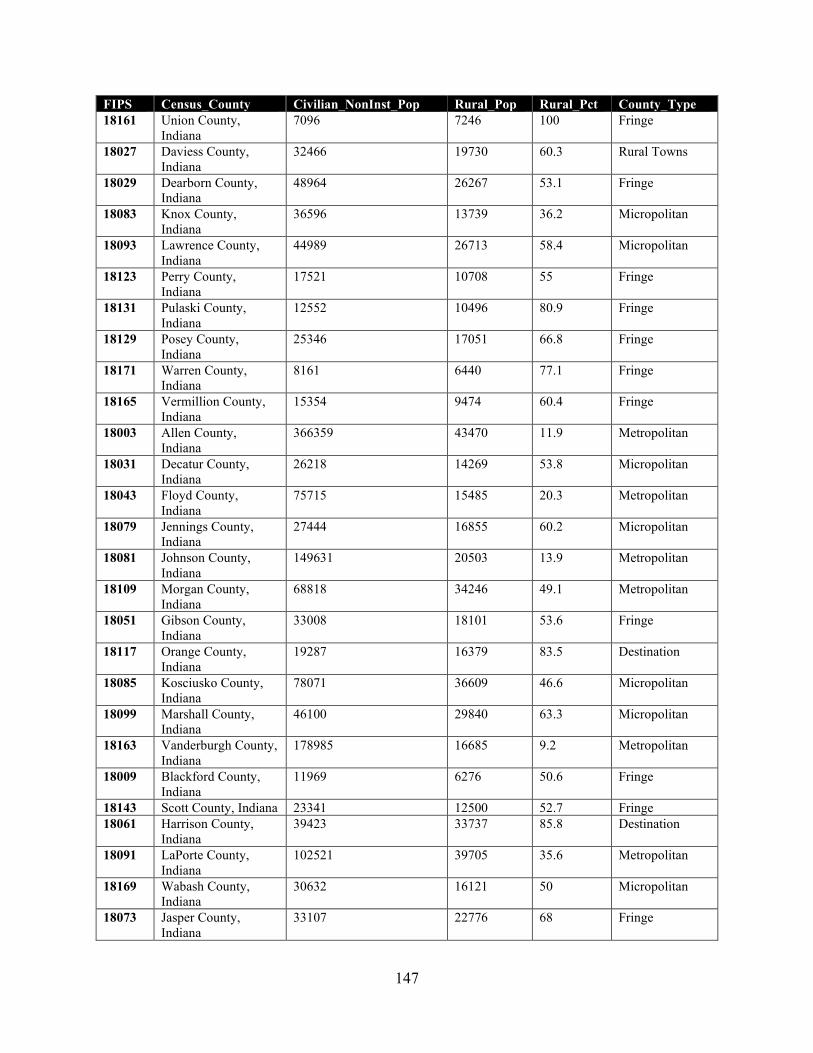
147
FIPS Census_County Civilian_NonInst_Pop Rural_Pop Rural_Pct County_Type 18161 Union County,
Indiana 7096 7246 100 Fringe
18027 Daviess County, Indiana
32466 19730 60.3 Rural Towns
18029 Dearborn County, Indiana
48964 26267 53.1 Fringe
18083 Knox County, Indiana
36596 13739 36.2 Micropolitan
18093 Lawrence County, Indiana
44989 26713 58.4 Micropolitan
18123 Perry County, Indiana
17521 10708 55 Fringe
18131 Pulaski County, Indiana
12552 10496 80.9 Fringe
18129 Posey County, Indiana
25346 17051 66.8 Fringe
18171 Warren County, Indiana
8161 6440 77.1 Fringe
18165 Vermillion County, Indiana
15354 9474 60.4 Fringe
18003 Allen County, Indiana
366359 43470 11.9 Metropolitan
18031 Decatur County, Indiana
26218 14269 53.8 Micropolitan
18043 Floyd County, Indiana
75715 15485 20.3 Metropolitan
18079 Jennings County, Indiana
27444 16855 60.2 Micropolitan
18081 Johnson County, Indiana
149631 20503 13.9 Metropolitan
18109 Morgan County, Indiana
68818 34246 49.1 Metropolitan
18051 Gibson County, Indiana
33008 18101 53.6 Fringe
18117 Orange County, Indiana
19287 16379 83.5 Destination
18085 Kosciusko County, Indiana
78071 36609 46.6 Micropolitan
18099 Marshall County, Indiana
46100 29840 63.3 Micropolitan
18163 Vanderburgh County, Indiana
178985 16685 9.2 Metropolitan
18009 Blackford County, Indiana
11969 6276 50.6 Fringe
18143 Scott County, Indiana 23341 12500 52.7 Fringe 18061 Harrison County,
Indiana 39423 33737 85.8 Destination
18091 LaPorte County, Indiana
102521 39705 35.6 Metropolitan
18169 Wabash County, Indiana
30632 16121 50 Micropolitan
18073 Jasper County, Indiana
33107 22776 68 Fringe
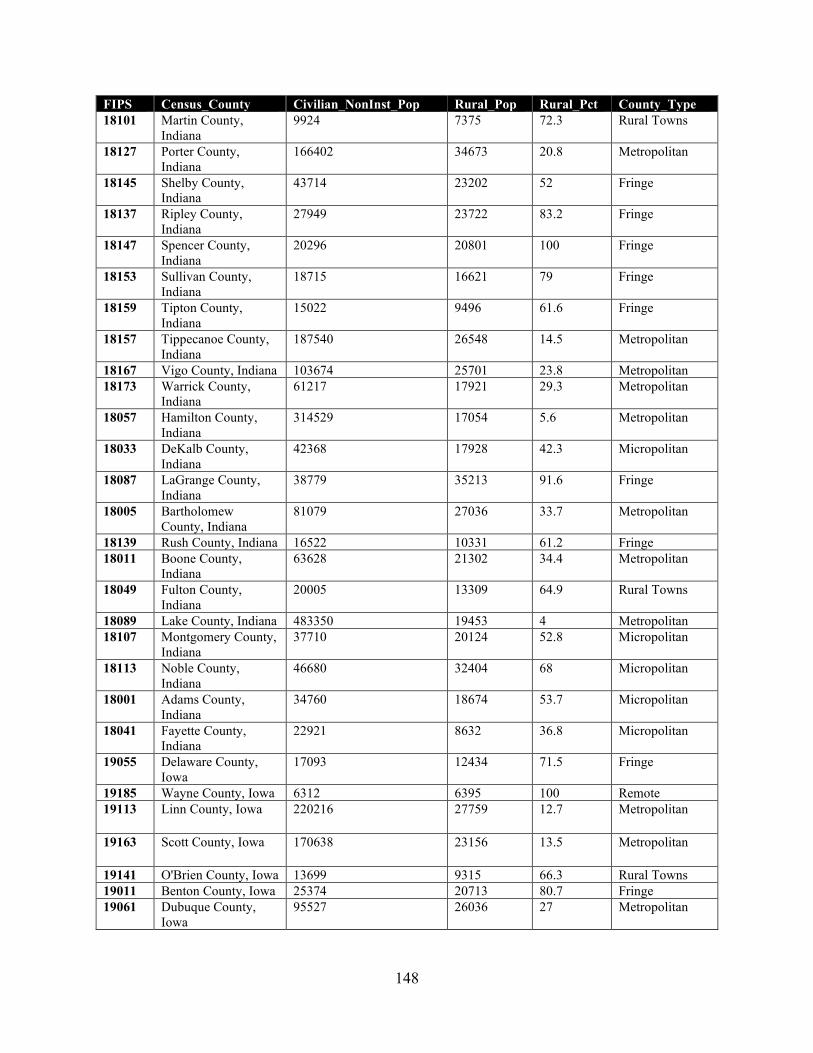
148
FIPS Census_County Civilian_NonInst_Pop Rural_Pop Rural_Pct County_Type 18101 Martin County,
Indiana 9924 7375 72.3 Rural Towns
18127 Porter County, Indiana
166402 34673 20.8 Metropolitan
18145 Shelby County, Indiana
43714 23202 52 Fringe
18137 Ripley County, Indiana
27949 23722 83.2 Fringe
18147 Spencer County, Indiana
20296 20801 100 Fringe
18153 Sullivan County, Indiana
18715 16621 79 Fringe
18159 Tipton County, Indiana
15022 9496 61.6 Fringe
18157 Tippecanoe County, Indiana
187540 26548 14.5 Metropolitan
18167 Vigo County, Indiana 103674 25701 23.8 Metropolitan 18173 Warrick County,
Indiana 61217 17921 29.3 Metropolitan
18057 Hamilton County, Indiana
314529 17054 5.6 Metropolitan
18033 DeKalb County, Indiana
42368 17928 42.3 Micropolitan
18087 LaGrange County, Indiana
38779 35213 91.6 Fringe
18005 Bartholomew County, Indiana
81079 27036 33.7 Metropolitan
18139 Rush County, Indiana 16522 10331 61.2 Fringe 18011 Boone County,
Indiana 63628 21302 34.4 Metropolitan
18049 Fulton County, Indiana
20005 13309 64.9 Rural Towns
18089 Lake County, Indiana 483350 19453 4 Metropolitan 18107 Montgomery County,
Indiana 37710 20124 52.8 Micropolitan
18113 Noble County, Indiana
46680 32404 68 Micropolitan
18001 Adams County, Indiana
34760 18674 53.7 Micropolitan
18041 Fayette County, Indiana
22921 8632 36.8 Micropolitan
19055 Delaware County, Iowa
17093 12434 71.5 Fringe
19185 Wayne County, Iowa 6312 6395 100 Remote 19113 Linn County, Iowa 220216 27759 12.7 Metropolitan
19163 Scott County, Iowa 170638 23156 13.5 Metropolitan
19141 O'Brien County, Iowa 13699 9315 66.3 Rural Towns 19011 Benton County, Iowa 25374 20713 80.7 Fringe 19061 Dubuque County,
Iowa 95527 26036 27 Metropolitan
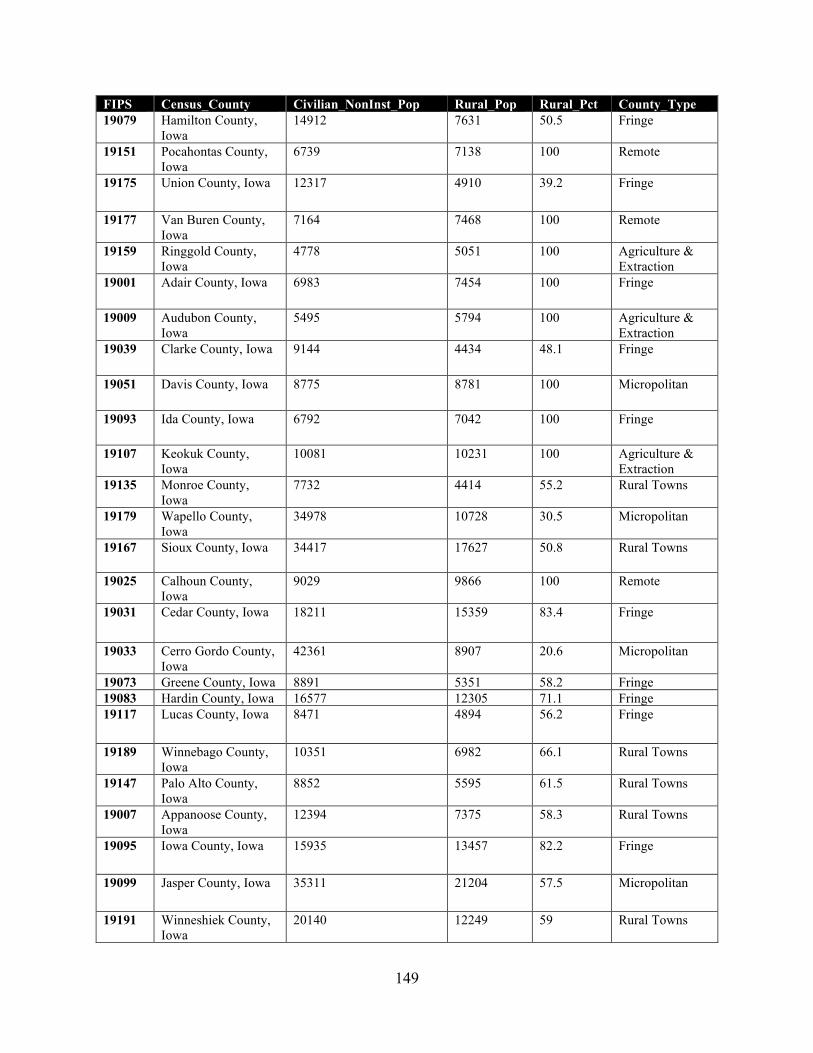
149
FIPS Census_County Civilian_NonInst_Pop Rural_Pop Rural_Pct County_Type 19079 Hamilton County,
Iowa 14912 7631 50.5 Fringe
19151 Pocahontas County, Iowa
6739 7138 100 Remote
19175 Union County, Iowa 12317 4910 39.2 Fringe
19177 Van Buren County, Iowa
7164 7468 100 Remote
19159 Ringgold County, Iowa
4778 5051 100 Agriculture & Extraction
19001 Adair County, Iowa 6983 7454 100 Fringe
19009 Audubon County, Iowa
5495 5794 100 Agriculture & Extraction
19039 Clarke County, Iowa 9144 4434 48.1 Fringe
19051 Davis County, Iowa 8775 8781 100 Micropolitan
19093 Ida County, Iowa 6792 7042 100 Fringe
19107 Keokuk County, Iowa
10081 10231 100 Agriculture & Extraction
19135 Monroe County, Iowa
7732 4414 55.2 Rural Towns
19179 Wapello County, Iowa
34978 10728 30.5 Micropolitan
19167 Sioux County, Iowa 34417 17627 50.8 Rural Towns
19025 Calhoun County, Iowa
9029 9866 100 Remote
19031 Cedar County, Iowa 18211 15359 83.4 Fringe
19033 Cerro Gordo County, Iowa
42361 8907 20.6 Micropolitan
19073 Greene County, Iowa 8891 5351 58.2 Fringe 19083 Hardin County, Iowa 16577 12305 71.1 Fringe 19117 Lucas County, Iowa 8471 4894 56.2 Fringe
19189 Winnebago County, Iowa
10351 6982 66.1 Rural Towns
19147 Palo Alto County, Iowa
8852 5595 61.5 Rural Towns
19007 Appanoose County, Iowa
12394 7375 58.3 Rural Towns
19095 Iowa County, Iowa 15935 13457 82.2 Fringe
19099 Jasper County, Iowa 35311 21204 57.5 Micropolitan
19191 Winneshiek County, Iowa
20140 12249 59 Rural Towns
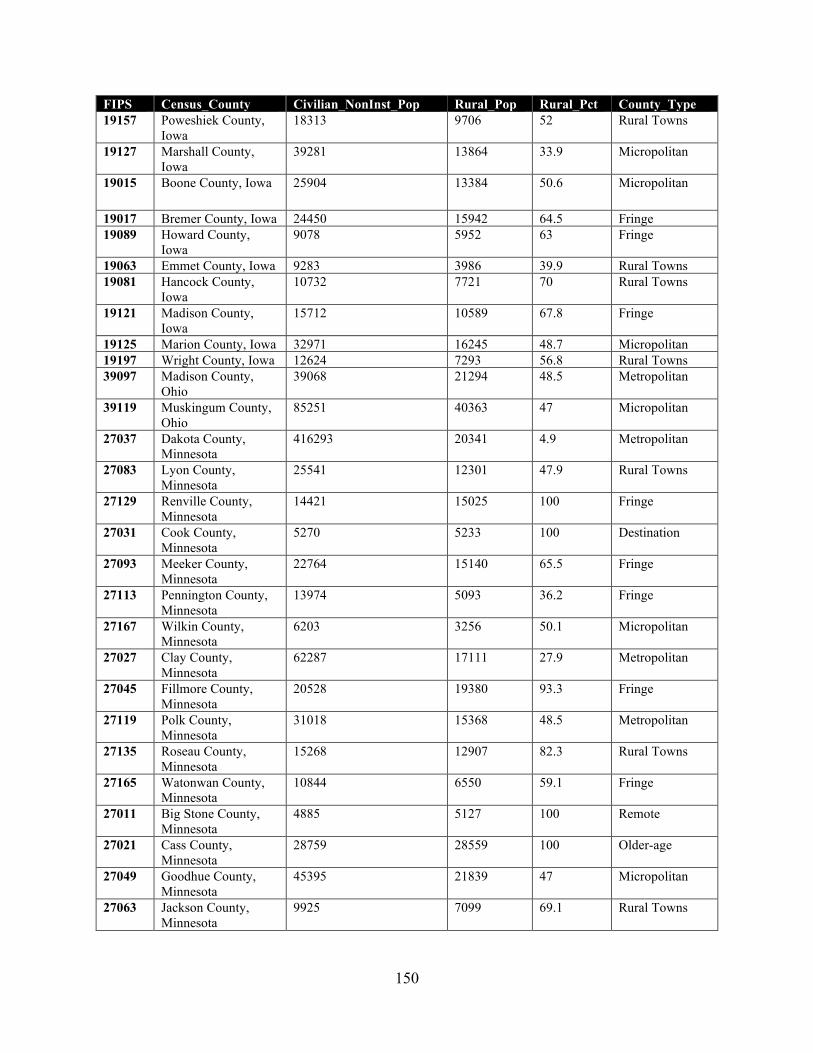
150
FIPS Census_County Civilian_NonInst_Pop Rural_Pop Rural_Pct County_Type 19157 Poweshiek County,
Iowa 18313 9706 52 Rural Towns
19127 Marshall County, Iowa
39281 13864 33.9 Micropolitan
19015 Boone County, Iowa 25904 13384 50.6 Micropolitan
19017 Bremer County, Iowa 24450 15942 64.5 Fringe 19089 Howard County,
Iowa 9078 5952 63 Fringe
19063 Emmet County, Iowa 9283 3986 39.9 Rural Towns 19081 Hancock County,
Iowa 10732 7721 70 Rural Towns
19121 Madison County, Iowa
15712 10589 67.8 Fringe
19125 Marion County, Iowa 32971 16245 48.7 Micropolitan 19197 Wright County, Iowa 12624 7293 56.8 Rural Towns 39097 Madison County,
Ohio 39068 21294 48.5 Metropolitan
39119 Muskingum County, Ohio
85251 40363 47 Micropolitan
27037 Dakota County, Minnesota
416293 20341 4.9 Metropolitan
27083 Lyon County, Minnesota
25541 12301 47.9 Rural Towns
27129 Renville County, Minnesota
14421 15025 100 Fringe
27031 Cook County, Minnesota
5270 5233 100 Destination
27093 Meeker County, Minnesota
22764 15140 65.5 Fringe
27113 Pennington County, Minnesota
13974 5093 36.2 Fringe
27167 Wilkin County, Minnesota
6203 3256 50.1 Micropolitan
27027 Clay County, Minnesota
62287 17111 27.9 Metropolitan
27045 Fillmore County, Minnesota
20528 19380 93.3 Fringe
27119 Polk County, Minnesota
31018 15368 48.5 Metropolitan
27135 Roseau County, Minnesota
15268 12907 82.3 Rural Towns
27165 Watonwan County, Minnesota
10844 6550 59.1 Fringe
27011 Big Stone County, Minnesota
4885 5127 100 Remote
27021 Cass County, Minnesota
28759 28559 100 Older-age
27049 Goodhue County, Minnesota
45395 21839 47 Micropolitan
27063 Jackson County, Minnesota
9925 7099 69.1 Rural Towns
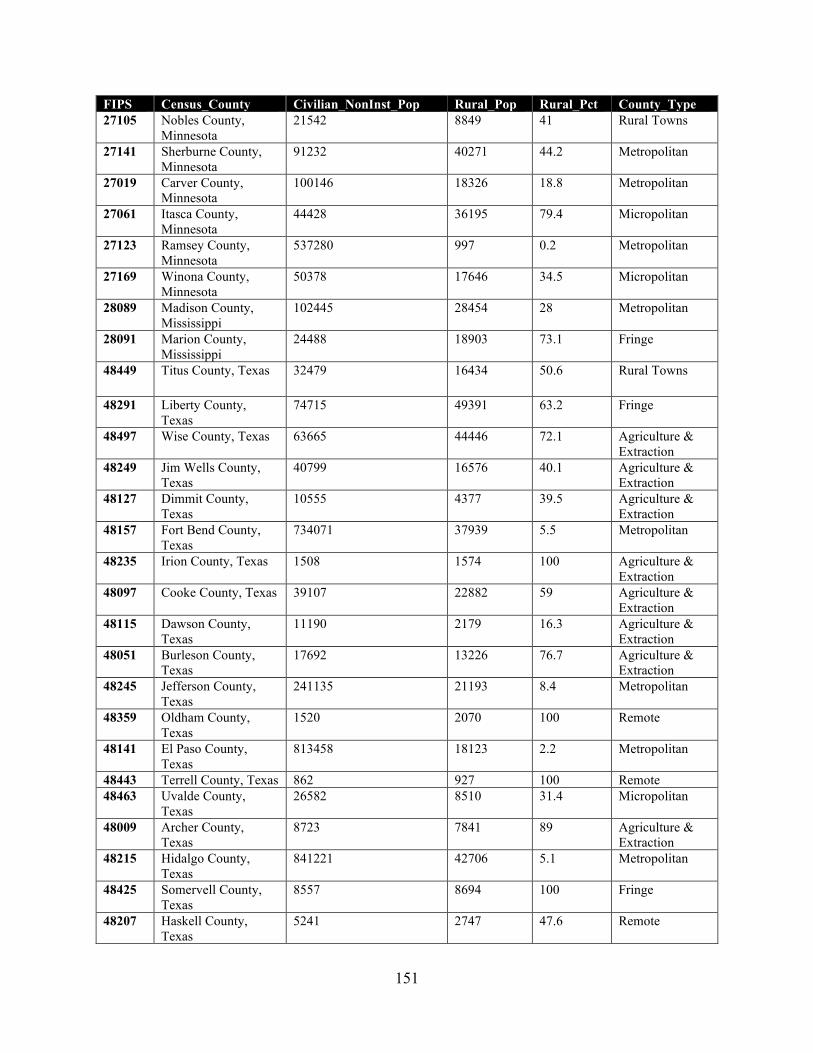
151
FIPS Census_County Civilian_NonInst_Pop Rural_Pop Rural_Pct County_Type 27105 Nobles County,
Minnesota 21542 8849 41 Rural Towns
27141 Sherburne County, Minnesota
91232 40271 44.2 Metropolitan
27019 Carver County, Minnesota
100146 18326 18.8 Metropolitan
27061 Itasca County, Minnesota
44428 36195 79.4 Micropolitan
27123 Ramsey County, Minnesota
537280 997 0.2 Metropolitan
27169 Winona County, Minnesota
50378 17646 34.5 Micropolitan
28089 Madison County, Mississippi
102445 28454 28 Metropolitan
28091 Marion County, Mississippi
24488 18903 73.1 Fringe
48449 Titus County, Texas 32479 16434 50.6 Rural Towns
48291 Liberty County, Texas
74715 49391 63.2 Fringe
48497 Wise County, Texas 63665 44446 72.1 Agriculture & Extraction
48249 Jim Wells County, Texas
40799 16576 40.1 Agriculture & Extraction
48127 Dimmit County, Texas
10555 4377 39.5 Agriculture & Extraction
48157 Fort Bend County, Texas
734071 37939 5.5 Metropolitan
48235 Irion County, Texas 1508 1574 100 Agriculture & Extraction
48097 Cooke County, Texas 39107 22882 59 Agriculture & Extraction
48115 Dawson County, Texas
11190 2179 16.3 Agriculture & Extraction
48051 Burleson County, Texas
17692 13226 76.7 Agriculture & Extraction
48245 Jefferson County, Texas
241135 21193 8.4 Metropolitan
48359 Oldham County, Texas
1520 2070 100 Remote
48141 El Paso County, Texas
813458 18123 2.2 Metropolitan
48443 Terrell County, Texas 862 927 100 Remote 48463 Uvalde County,
Texas 26582 8510 31.4 Micropolitan
48009 Archer County, Texas
8723 7841 89 Agriculture & Extraction
48215 Hidalgo County, Texas
841221 42706 5.1 Metropolitan
48425 Somervell County, Texas
8557 8694 100 Fringe
48207 Haskell County, Texas
5241 2747 47.6 Remote
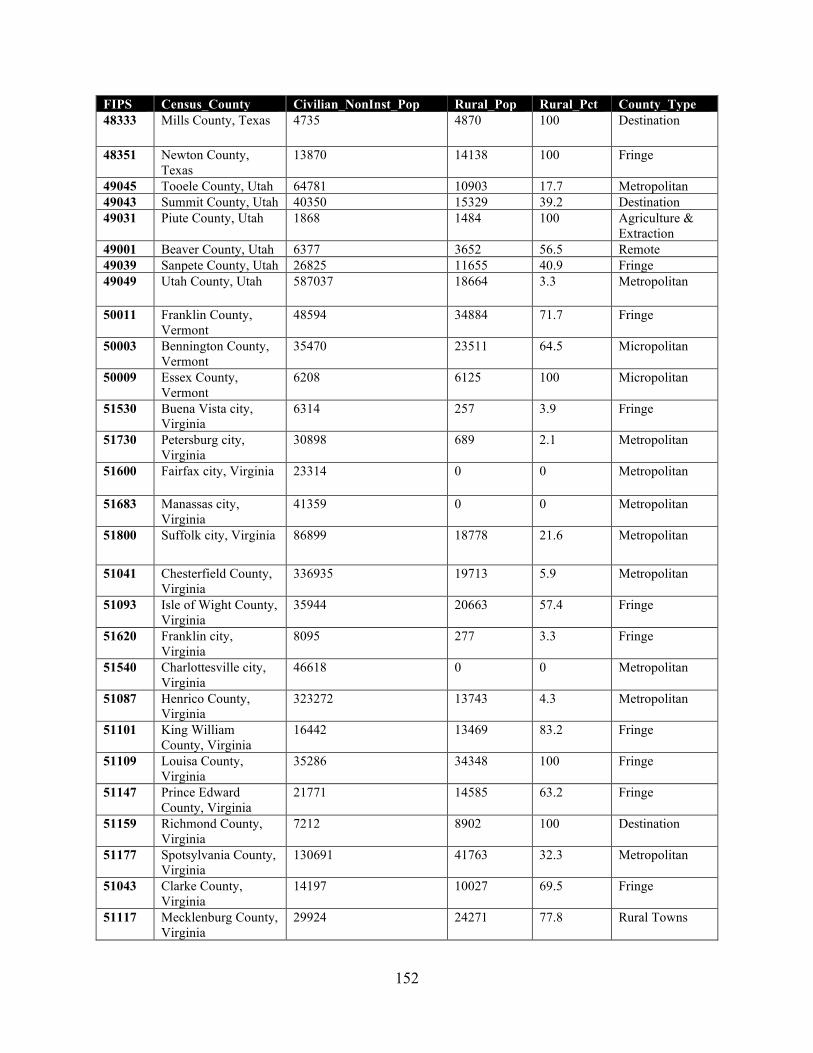
152
FIPS Census_County Civilian_NonInst_Pop Rural_Pop Rural_Pct County_Type 48333 Mills County, Texas 4735 4870 100 Destination
48351 Newton County, Texas
13870 14138 100 Fringe
49045 Tooele County, Utah 64781 10903 17.7 Metropolitan 49043 Summit County, Utah 40350 15329 39.2 Destination 49031 Piute County, Utah 1868 1484 100 Agriculture &
Extraction 49001 Beaver County, Utah 6377 3652 56.5 Remote 49039 Sanpete County, Utah 26825 11655 40.9 Fringe 49049 Utah County, Utah 587037 18664 3.3 Metropolitan
50011 Franklin County, Vermont
48594 34884 71.7 Fringe
50003 Bennington County, Vermont
35470 23511 64.5 Micropolitan
50009 Essex County, Vermont
6208 6125 100 Micropolitan
51530 Buena Vista city, Virginia
6314 257 3.9 Fringe
51730 Petersburg city, Virginia
30898 689 2.1 Metropolitan
51600 Fairfax city, Virginia 23314 0 0 Metropolitan
51683 Manassas city, Virginia
41359 0 0 Metropolitan
51800 Suffolk city, Virginia 86899 18778 21.6 Metropolitan
51041 Chesterfield County, Virginia
336935 19713 5.9 Metropolitan
51093 Isle of Wight County, Virginia
35944 20663 57.4 Fringe
51620 Franklin city, Virginia
8095 277 3.3 Fringe
51540 Charlottesville city, Virginia
46618 0 0 Metropolitan
51087 Henrico County, Virginia
323272 13743 4.3 Metropolitan
51101 King William County, Virginia
16442 13469 83.2 Fringe
51109 Louisa County, Virginia
35286 34348 100 Fringe
51147 Prince Edward County, Virginia
21771 14585 63.2 Fringe
51159 Richmond County, Virginia
7212 8902 100 Destination
51177 Spotsylvania County, Virginia
130691 41763 32.3 Metropolitan
51043 Clarke County, Virginia
14197 10027 69.5 Fringe
51117 Mecklenburg County, Virginia
29924 24271 77.8 Rural Towns
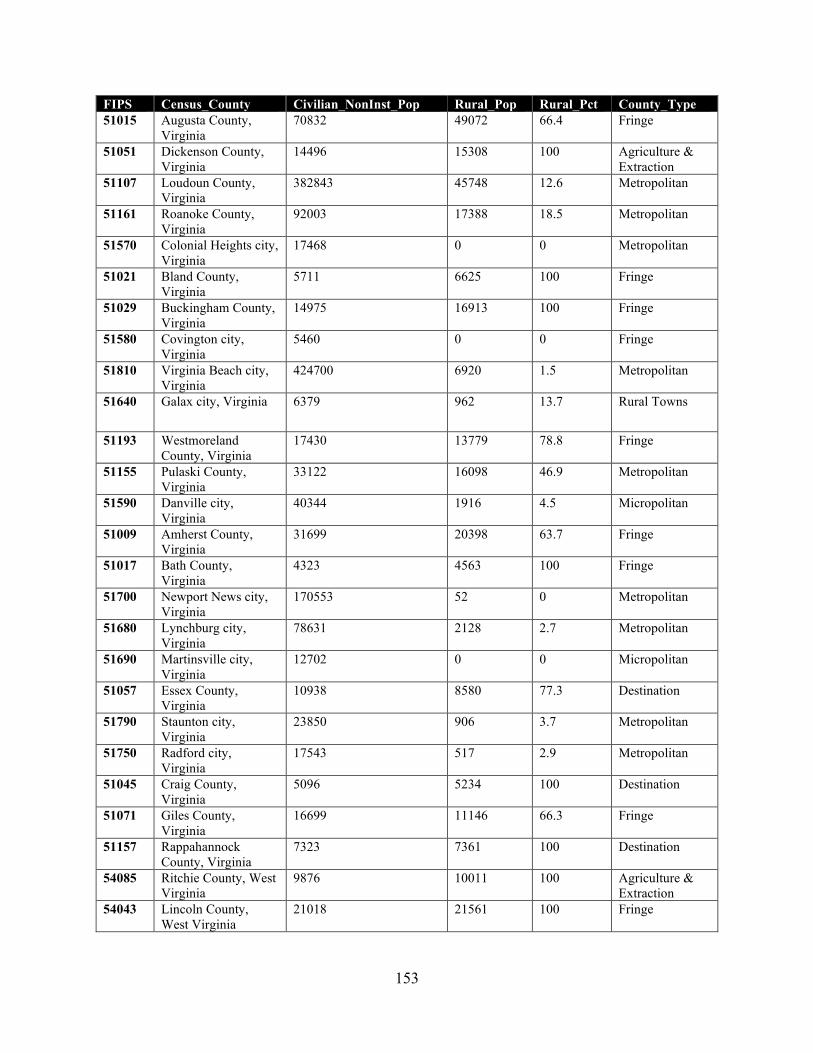
153
FIPS Census_County Civilian_NonInst_Pop Rural_Pop Rural_Pct County_Type 51015 Augusta County,
Virginia 70832 49072 66.4 Fringe
51051 Dickenson County, Virginia
14496 15308 100 Agriculture & Extraction
51107 Loudoun County, Virginia
382843 45748 12.6 Metropolitan
51161 Roanoke County, Virginia
92003 17388 18.5 Metropolitan
51570 Colonial Heights city, Virginia
17468 0 0 Metropolitan
51021 Bland County, Virginia
5711 6625 100 Fringe
51029 Buckingham County, Virginia
14975 16913 100 Fringe
51580 Covington city, Virginia
5460 0 0 Fringe
51810 Virginia Beach city, Virginia
424700 6920 1.5 Metropolitan
51640 Galax city, Virginia 6379 962 13.7 Rural Towns
51193 Westmoreland County, Virginia
17430 13779 78.8 Fringe
51155 Pulaski County, Virginia
33122 16098 46.9 Metropolitan
51590 Danville city, Virginia
40344 1916 4.5 Micropolitan
51009 Amherst County, Virginia
31699 20398 63.7 Fringe
51017 Bath County, Virginia
4323 4563 100 Fringe
51700 Newport News city, Virginia
170553 52 0 Metropolitan
51680 Lynchburg city, Virginia
78631 2128 2.7 Metropolitan
51690 Martinsville city, Virginia
12702 0 0 Micropolitan
51057 Essex County, Virginia
10938 8580 77.3 Destination
51790 Staunton city, Virginia
23850 906 3.7 Metropolitan
51750 Radford city, Virginia
17543 517 2.9 Metropolitan
51045 Craig County, Virginia
5096 5234 100 Destination
51071 Giles County, Virginia
16699 11146 66.3 Fringe
51157 Rappahannock County, Virginia
7323 7361 100 Destination
54085 Ritchie County, West Virginia
9876 10011 100 Agriculture & Extraction
54043 Lincoln County, West Virginia
21018 21561 100 Fringe
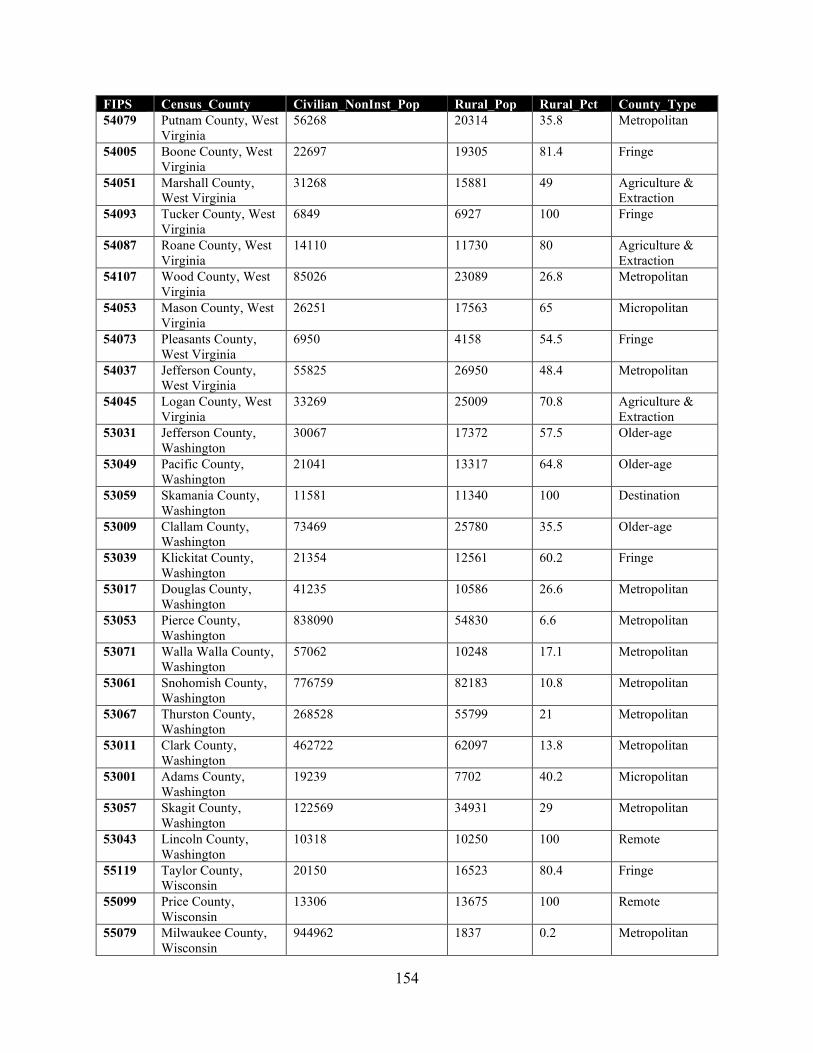
154
FIPS Census_County Civilian_NonInst_Pop Rural_Pop Rural_Pct County_Type 54079 Putnam County, West
Virginia 56268 20314 35.8 Metropolitan
54005 Boone County, West Virginia
22697 19305 81.4 Fringe
54051 Marshall County, West Virginia
31268 15881 49 Agriculture & Extraction
54093 Tucker County, West Virginia
6849 6927 100 Fringe
54087 Roane County, West Virginia
14110 11730 80 Agriculture & Extraction
54107 Wood County, West Virginia
85026 23089 26.8 Metropolitan
54053 Mason County, West Virginia
26251 17563 65 Micropolitan
54073 Pleasants County, West Virginia
6950 4158 54.5 Fringe
54037 Jefferson County, West Virginia
55825 26950 48.4 Metropolitan
54045 Logan County, West Virginia
33269 25009 70.8 Agriculture & Extraction
53031 Jefferson County, Washington
30067 17372 57.5 Older-age
53049 Pacific County, Washington
21041 13317 64.8 Older-age
53059 Skamania County, Washington
11581 11340 100 Destination
53009 Clallam County, Washington
73469 25780 35.5 Older-age
53039 Klickitat County, Washington
21354 12561 60.2 Fringe
53017 Douglas County, Washington
41235 10586 26.6 Metropolitan
53053 Pierce County, Washington
838090 54830 6.6 Metropolitan
53071 Walla Walla County, Washington
57062 10248 17.1 Metropolitan
53061 Snohomish County, Washington
776759 82183 10.8 Metropolitan
53067 Thurston County, Washington
268528 55799 21 Metropolitan
53011 Clark County, Washington
462722 62097 13.8 Metropolitan
53001 Adams County, Washington
19239 7702 40.2 Micropolitan
53057 Skagit County, Washington
122569 34931 29 Metropolitan
53043 Lincoln County, Washington
10318 10250 100 Remote
55119 Taylor County, Wisconsin
20150 16523 80.4 Fringe
55099 Price County, Wisconsin
13306 13675 100 Remote
55079 Milwaukee County, Wisconsin
944962 1837 0.2 Metropolitan
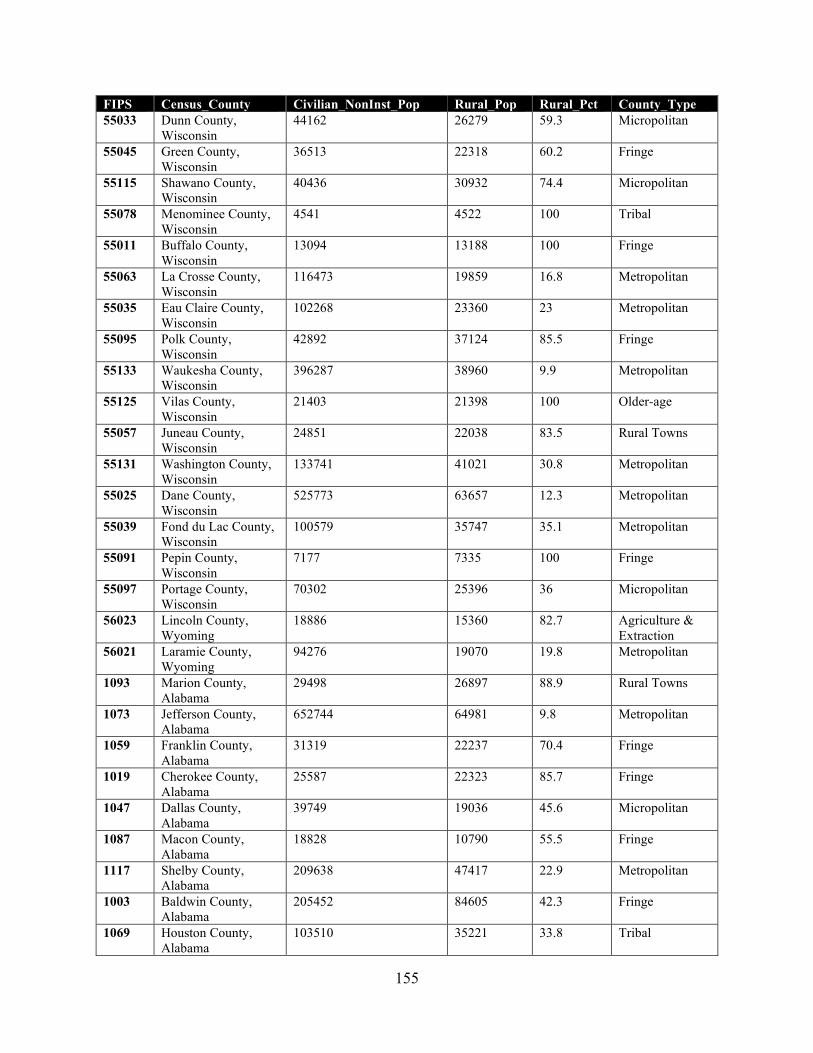
155
FIPS Census_County Civilian_NonInst_Pop Rural_Pop Rural_Pct County_Type 55033 Dunn County,
Wisconsin 44162 26279 59.3 Micropolitan
55045 Green County, Wisconsin
36513 22318 60.2 Fringe
55115 Shawano County, Wisconsin
40436 30932 74.4 Micropolitan
55078 Menominee County, Wisconsin
4541 4522 100 Tribal
55011 Buffalo County, Wisconsin
13094 13188 100 Fringe
55063 La Crosse County, Wisconsin
116473 19859 16.8 Metropolitan
55035 Eau Claire County, Wisconsin
102268 23360 23 Metropolitan
55095 Polk County, Wisconsin
42892 37124 85.5 Fringe
55133 Waukesha County, Wisconsin
396287 38960 9.9 Metropolitan
55125 Vilas County, Wisconsin
21403 21398 100 Older-age
55057 Juneau County, Wisconsin
24851 22038 83.5 Rural Towns
55131 Washington County, Wisconsin
133741 41021 30.8 Metropolitan
55025 Dane County, Wisconsin
525773 63657 12.3 Metropolitan
55039 Fond du Lac County, Wisconsin
100579 35747 35.1 Metropolitan
55091 Pepin County, Wisconsin
7177 7335 100 Fringe
55097 Portage County, Wisconsin
70302 25396 36 Micropolitan
56023 Lincoln County, Wyoming
18886 15360 82.7 Agriculture & Extraction
56021 Laramie County, Wyoming
94276 19070 19.8 Metropolitan
1093 Marion County, Alabama
29498 26897 88.9 Rural Towns
1073 Jefferson County, Alabama
652744 64981 9.8 Metropolitan
1059 Franklin County, Alabama
31319 22237 70.4 Fringe
1019 Cherokee County, Alabama
25587 22323 85.7 Fringe
1047 Dallas County, Alabama
39749 19036 45.6 Micropolitan
1087 Macon County, Alabama
18828 10790 55.5 Fringe
1117 Shelby County, Alabama
209638 47417 22.9 Metropolitan
1003 Baldwin County, Alabama
205452 84605 42.3 Fringe
1069 Houston County, Alabama
103510 35221 33.8 Tribal
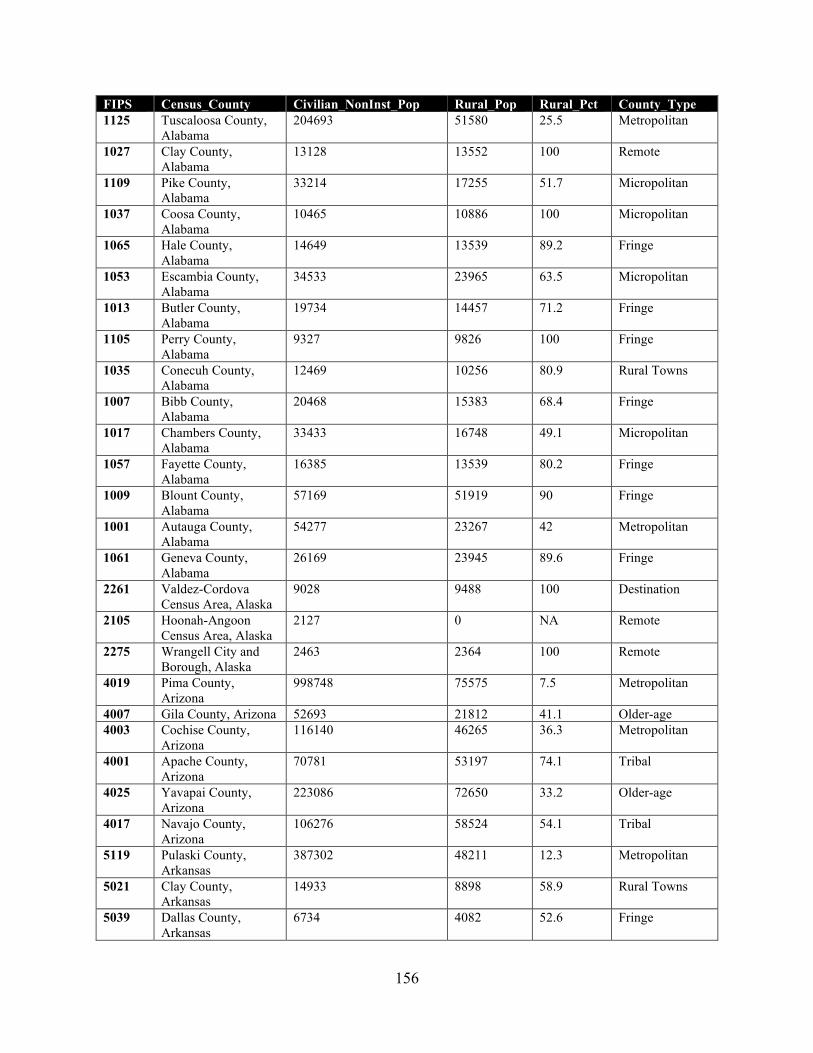
156
FIPS Census_County Civilian_NonInst_Pop Rural_Pop Rural_Pct County_Type 1125 Tuscaloosa County,
Alabama 204693 51580 25.5 Metropolitan
1027 Clay County, Alabama
13128 13552 100 Remote
1109 Pike County, Alabama
33214 17255 51.7 Micropolitan
1037 Coosa County, Alabama
10465 10886 100 Micropolitan
1065 Hale County, Alabama
14649 13539 89.2 Fringe
1053 Escambia County, Alabama
34533 23965 63.5 Micropolitan
1013 Butler County, Alabama
19734 14457 71.2 Fringe
1105 Perry County, Alabama
9327 9826 100 Fringe
1035 Conecuh County, Alabama
12469 10256 80.9 Rural Towns
1007 Bibb County, Alabama
20468 15383 68.4 Fringe
1017 Chambers County, Alabama
33433 16748 49.1 Micropolitan
1057 Fayette County, Alabama
16385 13539 80.2 Fringe
1009 Blount County, Alabama
57169 51919 90 Fringe
1001 Autauga County, Alabama
54277 23267 42 Metropolitan
1061 Geneva County, Alabama
26169 23945 89.6 Fringe
2261 Valdez-Cordova Census Area, Alaska
9028 9488 100 Destination
2105 Hoonah-Angoon Census Area, Alaska
2127 0 NA Remote
2275 Wrangell City and Borough, Alaska
2463 2364 100 Remote
4019 Pima County, Arizona
998748 75575 7.5 Metropolitan
4007 Gila County, Arizona 52693 21812 41.1 Older-age 4003 Cochise County,
Arizona 116140 46265 36.3 Metropolitan
4001 Apache County, Arizona
70781 53197 74.1 Tribal
4025 Yavapai County, Arizona
223086 72650 33.2 Older-age
4017 Navajo County, Arizona
106276 58524 54.1 Tribal
5119 Pulaski County, Arkansas
387302 48211 12.3 Metropolitan
5021 Clay County, Arkansas
14933 8898 58.9 Rural Towns
5039 Dallas County, Arkansas
6734 4082 52.6 Fringe
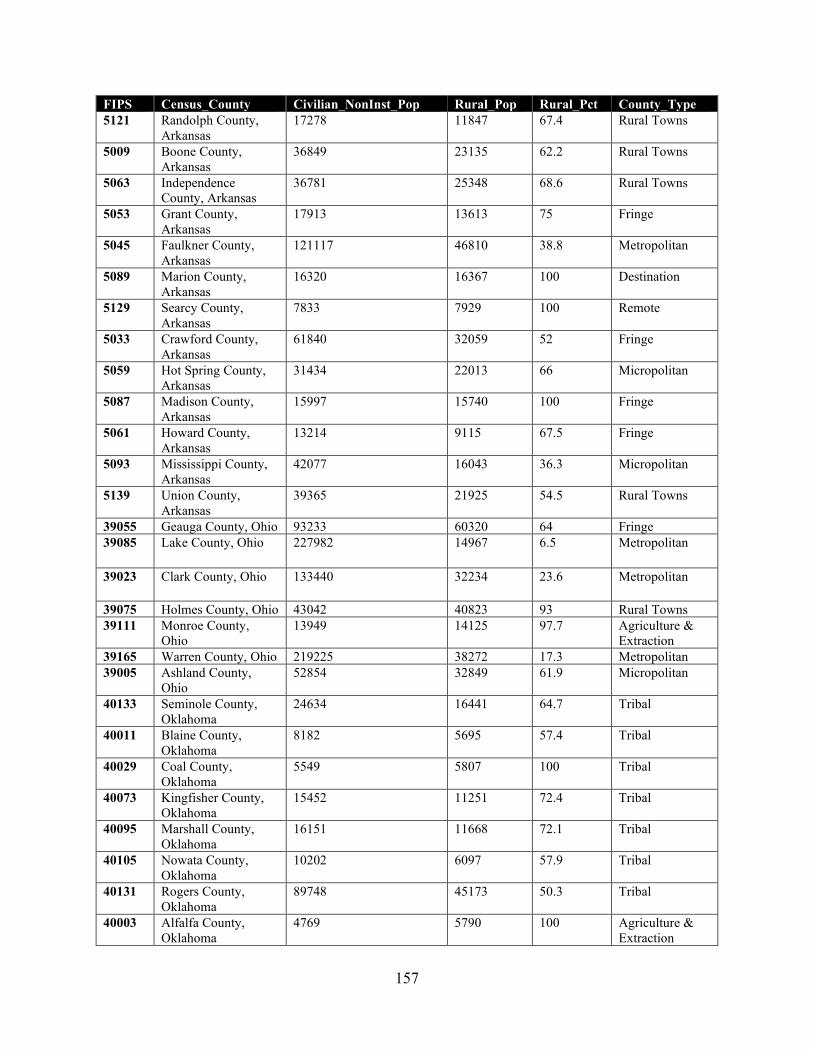
157
FIPS Census_County Civilian_NonInst_Pop Rural_Pop Rural_Pct County_Type 5121 Randolph County,
Arkansas 17278 11847 67.4 Rural Towns
5009 Boone County, Arkansas
36849 23135 62.2 Rural Towns
5063 Independence County, Arkansas
36781 25348 68.6 Rural Towns
5053 Grant County, Arkansas
17913 13613 75 Fringe
5045 Faulkner County, Arkansas
121117 46810 38.8 Metropolitan
5089 Marion County, Arkansas
16320 16367 100 Destination
5129 Searcy County, Arkansas
7833 7929 100 Remote
5033 Crawford County, Arkansas
61840 32059 52 Fringe
5059 Hot Spring County, Arkansas
31434 22013 66 Micropolitan
5087 Madison County, Arkansas
15997 15740 100 Fringe
5061 Howard County, Arkansas
13214 9115 67.5 Fringe
5093 Mississippi County, Arkansas
42077 16043 36.3 Micropolitan
5139 Union County, Arkansas
39365 21925 54.5 Rural Towns
39055 Geauga County, Ohio 93233 60320 64 Fringe 39085 Lake County, Ohio 227982 14967 6.5 Metropolitan
39023 Clark County, Ohio 133440 32234 23.6 Metropolitan
39075 Holmes County, Ohio 43042 40823 93 Rural Towns 39111 Monroe County,
Ohio 13949 14125 97.7 Agriculture &
Extraction 39165 Warren County, Ohio 219225 38272 17.3 Metropolitan 39005 Ashland County,
Ohio 52854 32849 61.9 Micropolitan
40133 Seminole County, Oklahoma
24634 16441 64.7 Tribal
40011 Blaine County, Oklahoma
8182 5695 57.4 Tribal
40029 Coal County, Oklahoma
5549 5807 100 Tribal
40073 Kingfisher County, Oklahoma
15452 11251 72.4 Tribal
40095 Marshall County, Oklahoma
16151 11668 72.1 Tribal
40105 Nowata County, Oklahoma
10202 6097 57.9 Tribal
40131 Rogers County, Oklahoma
89748 45173 50.3 Tribal
40003 Alfalfa County, Oklahoma
4769 5790 100 Agriculture & Extraction
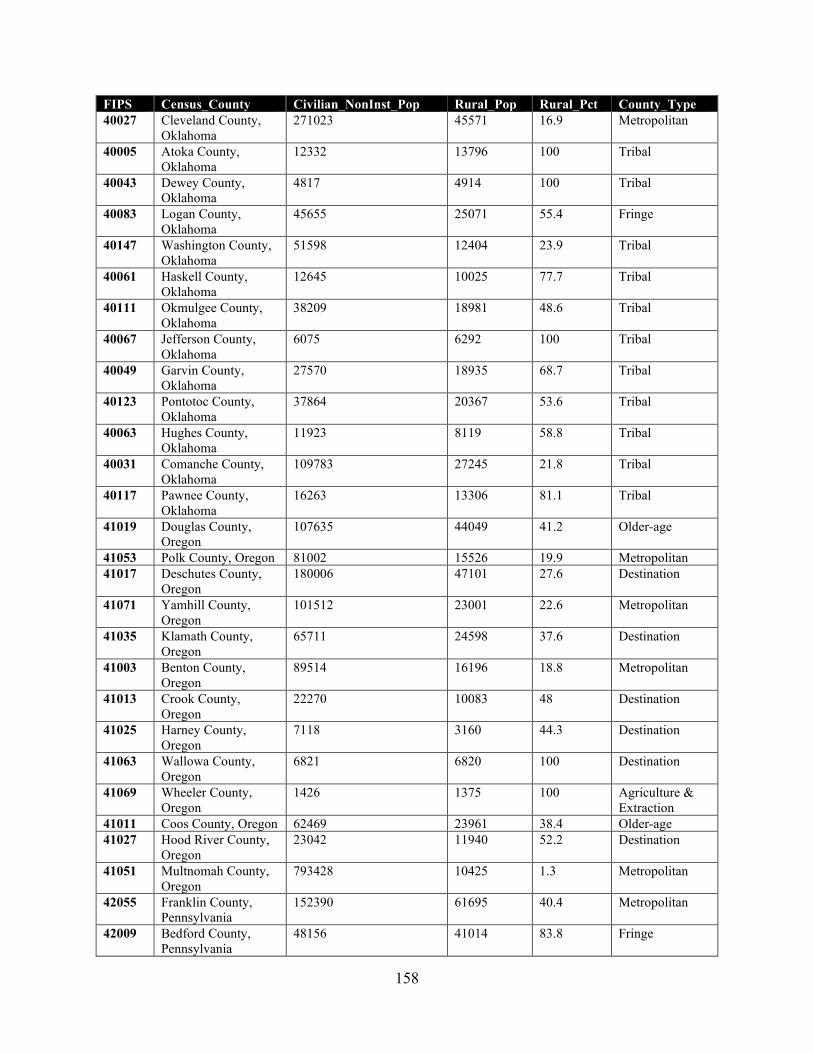
158
FIPS Census_County Civilian_NonInst_Pop Rural_Pop Rural_Pct County_Type 40027 Cleveland County,
Oklahoma 271023 45571 16.9 Metropolitan
40005 Atoka County, Oklahoma
12332 13796 100 Tribal
40043 Dewey County, Oklahoma
4817 4914 100 Tribal
40083 Logan County, Oklahoma
45655 25071 55.4 Fringe
40147 Washington County, Oklahoma
51598 12404 23.9 Tribal
40061 Haskell County, Oklahoma
12645 10025 77.7 Tribal
40111 Okmulgee County, Oklahoma
38209 18981 48.6 Tribal
40067 Jefferson County, Oklahoma
6075 6292 100 Tribal
40049 Garvin County, Oklahoma
27570 18935 68.7 Tribal
40123 Pontotoc County, Oklahoma
37864 20367 53.6 Tribal
40063 Hughes County, Oklahoma
11923 8119 58.8 Tribal
40031 Comanche County, Oklahoma
109783 27245 21.8 Tribal
40117 Pawnee County, Oklahoma
16263 13306 81.1 Tribal
41019 Douglas County, Oregon
107635 44049 41.2 Older-age
41053 Polk County, Oregon 81002 15526 19.9 Metropolitan 41017 Deschutes County,
Oregon 180006 47101 27.6 Destination
41071 Yamhill County, Oregon
101512 23001 22.6 Metropolitan
41035 Klamath County, Oregon
65711 24598 37.6 Destination
41003 Benton County, Oregon
89514 16196 18.8 Metropolitan
41013 Crook County, Oregon
22270 10083 48 Destination
41025 Harney County, Oregon
7118 3160 44.3 Destination
41063 Wallowa County, Oregon
6821 6820 100 Destination
41069 Wheeler County, Oregon
1426 1375 100 Agriculture & Extraction
41011 Coos County, Oregon 62469 23961 38.4 Older-age 41027 Hood River County,
Oregon 23042 11940 52.2 Destination
41051 Multnomah County, Oregon
793428 10425 1.3 Metropolitan
42055 Franklin County, Pennsylvania
152390 61695 40.4 Metropolitan
42009 Bedford County, Pennsylvania
48156 41014 83.8 Fringe
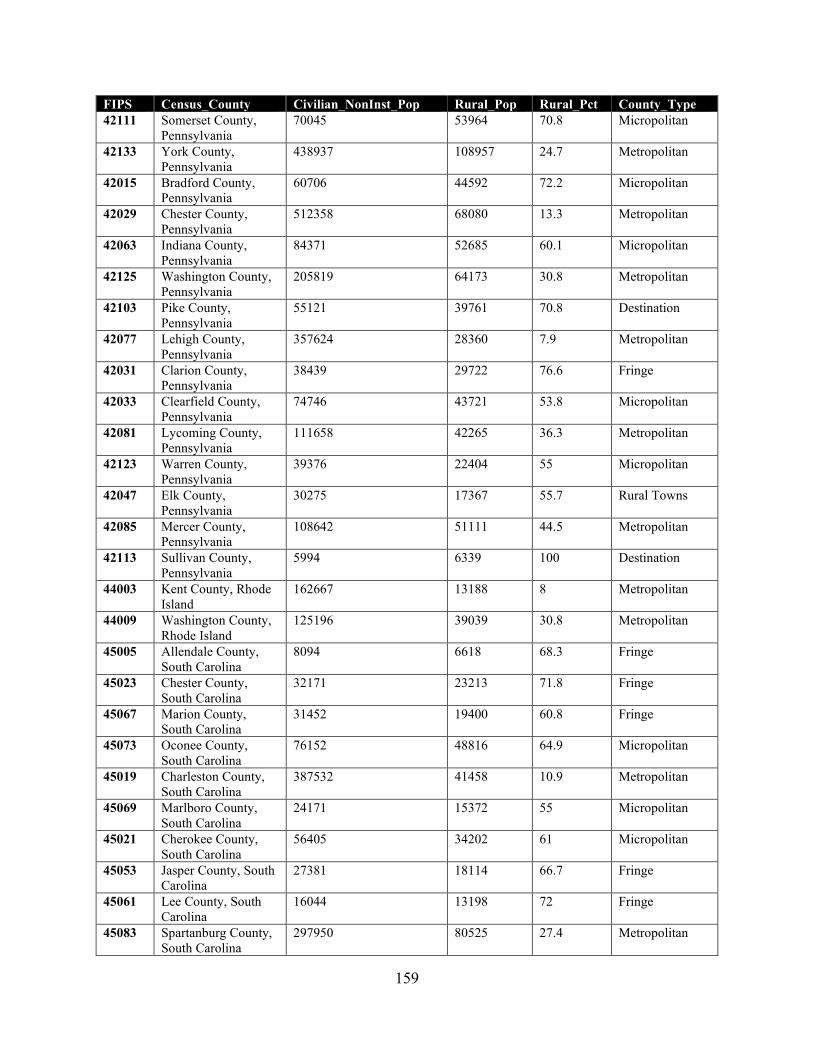
159
FIPS Census_County Civilian_NonInst_Pop Rural_Pop Rural_Pct County_Type 42111 Somerset County,
Pennsylvania 70045 53964 70.8 Micropolitan
42133 York County, Pennsylvania
438937 108957 24.7 Metropolitan
42015 Bradford County, Pennsylvania
60706 44592 72.2 Micropolitan
42029 Chester County, Pennsylvania
512358 68080 13.3 Metropolitan
42063 Indiana County, Pennsylvania
84371 52685 60.1 Micropolitan
42125 Washington County, Pennsylvania
205819 64173 30.8 Metropolitan
42103 Pike County, Pennsylvania
55121 39761 70.8 Destination
42077 Lehigh County, Pennsylvania
357624 28360 7.9 Metropolitan
42031 Clarion County, Pennsylvania
38439 29722 76.6 Fringe
42033 Clearfield County, Pennsylvania
74746 43721 53.8 Micropolitan
42081 Lycoming County, Pennsylvania
111658 42265 36.3 Metropolitan
42123 Warren County, Pennsylvania
39376 22404 55 Micropolitan
42047 Elk County, Pennsylvania
30275 17367 55.7 Rural Towns
42085 Mercer County, Pennsylvania
108642 51111 44.5 Metropolitan
42113 Sullivan County, Pennsylvania
5994 6339 100 Destination
44003 Kent County, Rhode Island
162667 13188 8 Metropolitan
44009 Washington County, Rhode Island
125196 39039 30.8 Metropolitan
45005 Allendale County, South Carolina
8094 6618 68.3 Fringe
45023 Chester County, South Carolina
32171 23213 71.8 Fringe
45067 Marion County, South Carolina
31452 19400 60.8 Fringe
45073 Oconee County, South Carolina
76152 48816 64.9 Micropolitan
45019 Charleston County, South Carolina
387532 41458 10.9 Metropolitan
45069 Marlboro County, South Carolina
24171 15372 55 Micropolitan
45021 Cherokee County, South Carolina
56405 34202 61 Micropolitan
45053 Jasper County, South Carolina
27381 18114 66.7 Fringe
45061 Lee County, South Carolina
16044 13198 72 Fringe
45083 Spartanburg County, South Carolina
297950 80525 27.4 Metropolitan
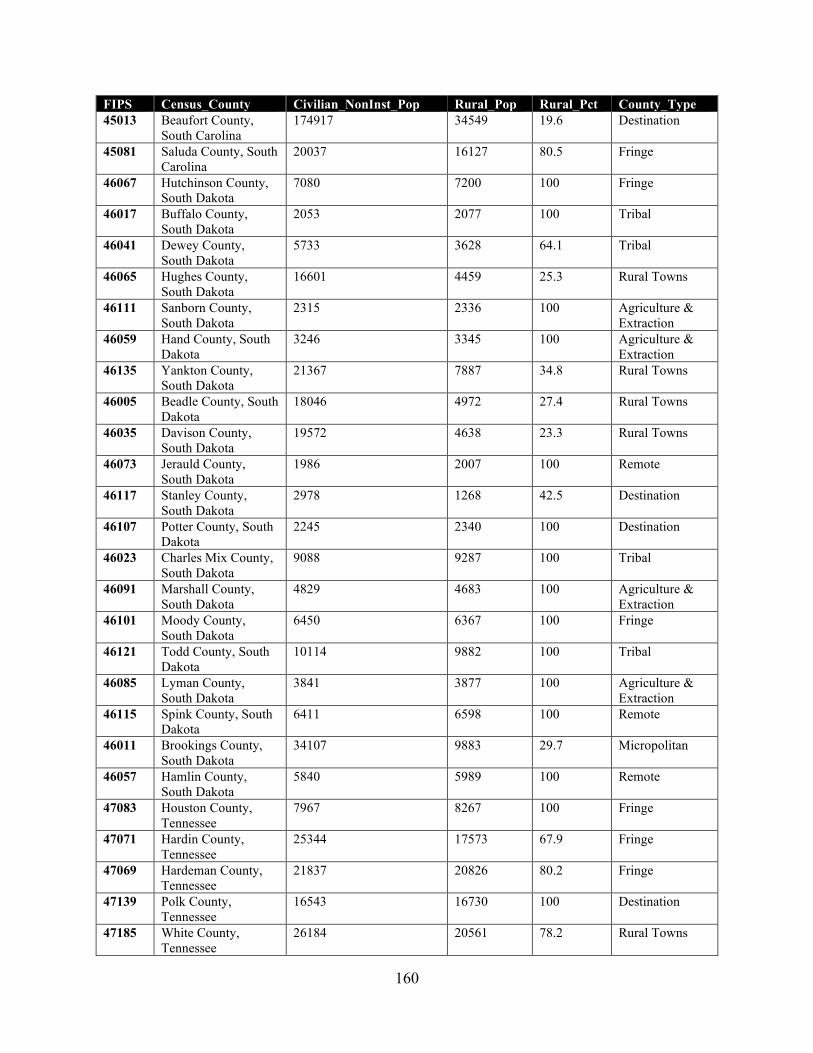
160
FIPS Census_County Civilian_NonInst_Pop Rural_Pop Rural_Pct County_Type 45013 Beaufort County,
South Carolina 174917 34549 19.6 Destination
45081 Saluda County, South Carolina
20037 16127 80.5 Fringe
46067 Hutchinson County, South Dakota
7080 7200 100 Fringe
46017 Buffalo County, South Dakota
2053 2077 100 Tribal
46041 Dewey County, South Dakota
5733 3628 64.1 Tribal
46065 Hughes County, South Dakota
16601 4459 25.3 Rural Towns
46111 Sanborn County, South Dakota
2315 2336 100 Agriculture & Extraction
46059 Hand County, South Dakota
3246 3345 100 Agriculture & Extraction
46135 Yankton County, South Dakota
21367 7887 34.8 Rural Towns
46005 Beadle County, South Dakota
18046 4972 27.4 Rural Towns
46035 Davison County, South Dakota
19572 4638 23.3 Rural Towns
46073 Jerauld County, South Dakota
1986 2007 100 Remote
46117 Stanley County, South Dakota
2978 1268 42.5 Destination
46107 Potter County, South Dakota
2245 2340 100 Destination
46023 Charles Mix County, South Dakota
9088 9287 100 Tribal
46091 Marshall County, South Dakota
4829 4683 100 Agriculture & Extraction
46101 Moody County, South Dakota
6450 6367 100 Fringe
46121 Todd County, South Dakota
10114 9882 100 Tribal
46085 Lyman County, South Dakota
3841 3877 100 Agriculture & Extraction
46115 Spink County, South Dakota
6411 6598 100 Remote
46011 Brookings County, South Dakota
34107 9883 29.7 Micropolitan
46057 Hamlin County, South Dakota
5840 5989 100 Remote
47083 Houston County, Tennessee
7967 8267 100 Fringe
47071 Hardin County, Tennessee
25344 17573 67.9 Fringe
47069 Hardeman County, Tennessee
21837 20826 80.2 Fringe
47139 Polk County, Tennessee
16543 16730 100 Destination
47185 White County, Tennessee
26184 20561 78.2 Rural Towns
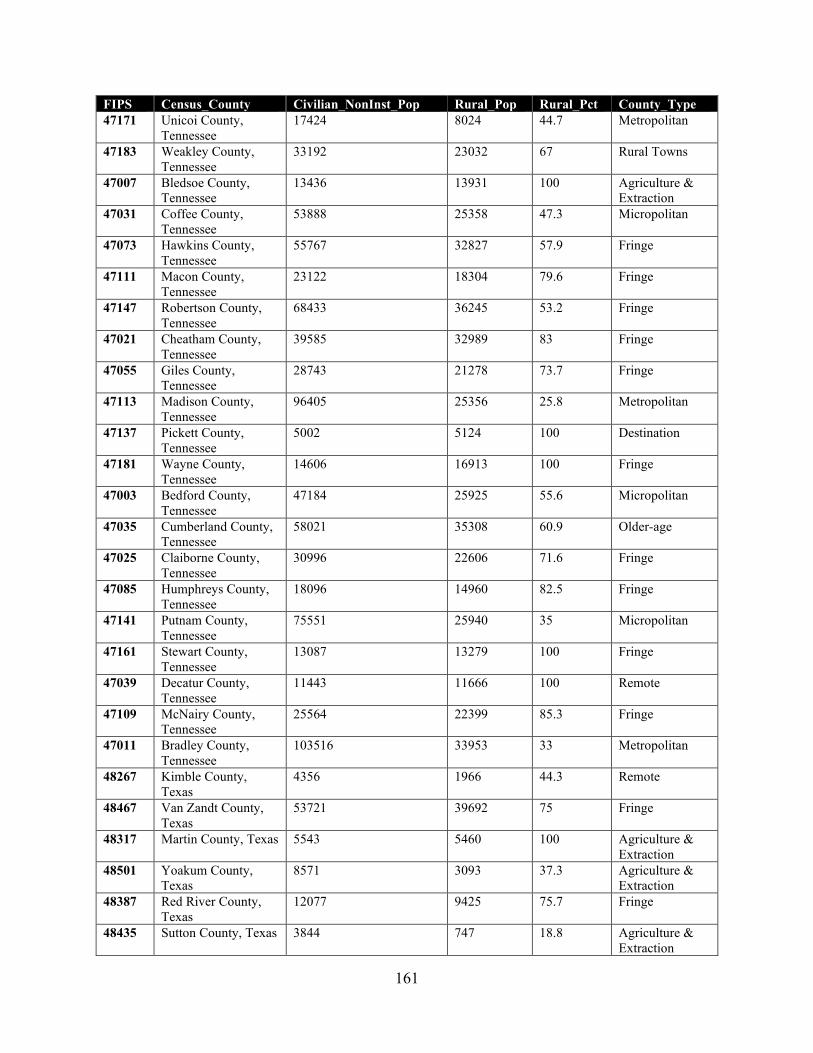
161
FIPS Census_County Civilian_NonInst_Pop Rural_Pop Rural_Pct County_Type 47171 Unicoi County,
Tennessee 17424 8024 44.7 Metropolitan
47183 Weakley County, Tennessee
33192 23032 67 Rural Towns
47007 Bledsoe County, Tennessee
13436 13931 100 Agriculture & Extraction
47031 Coffee County, Tennessee
53888 25358 47.3 Micropolitan
47073 Hawkins County, Tennessee
55767 32827 57.9 Fringe
47111 Macon County, Tennessee
23122 18304 79.6 Fringe
47147 Robertson County, Tennessee
68433 36245 53.2 Fringe
47021 Cheatham County, Tennessee
39585 32989 83 Fringe
47055 Giles County, Tennessee
28743 21278 73.7 Fringe
47113 Madison County, Tennessee
96405 25356 25.8 Metropolitan
47137 Pickett County, Tennessee
5002 5124 100 Destination
47181 Wayne County, Tennessee
14606 16913 100 Fringe
47003 Bedford County, Tennessee
47184 25925 55.6 Micropolitan
47035 Cumberland County, Tennessee
58021 35308 60.9 Older-age
47025 Claiborne County, Tennessee
30996 22606 71.6 Fringe
47085 Humphreys County, Tennessee
18096 14960 82.5 Fringe
47141 Putnam County, Tennessee
75551 25940 35 Micropolitan
47161 Stewart County, Tennessee
13087 13279 100 Fringe
47039 Decatur County, Tennessee
11443 11666 100 Remote
47109 McNairy County, Tennessee
25564 22399 85.3 Fringe
47011 Bradley County, Tennessee
103516 33953 33 Metropolitan
48267 Kimble County, Texas
4356 1966 44.3 Remote
48467 Van Zandt County, Texas
53721 39692 75 Fringe
48317 Martin County, Texas 5543 5460 100 Agriculture & Extraction
48501 Yoakum County, Texas
8571 3093 37.3 Agriculture & Extraction
48387 Red River County, Texas
12077 9425 75.7 Fringe
48435 Sutton County, Texas 3844 747 18.8 Agriculture & Extraction
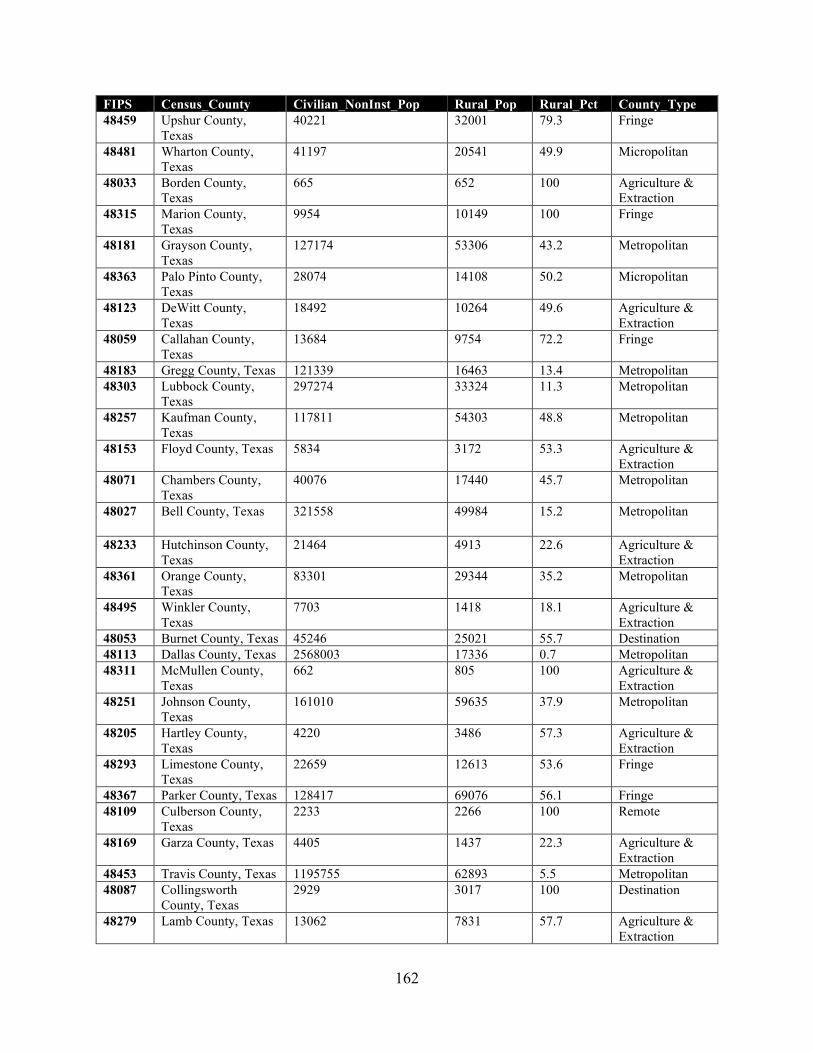
162
FIPS Census_County Civilian_NonInst_Pop Rural_Pop Rural_Pct County_Type 48459 Upshur County,
Texas 40221 32001 79.3 Fringe
48481 Wharton County, Texas
41197 20541 49.9 Micropolitan
48033 Borden County, Texas
665 652 100 Agriculture & Extraction
48315 Marion County, Texas
9954 10149 100 Fringe
48181 Grayson County, Texas
127174 53306 43.2 Metropolitan
48363 Palo Pinto County, Texas
28074 14108 50.2 Micropolitan
48123 DeWitt County, Texas
18492 10264 49.6 Agriculture & Extraction
48059 Callahan County, Texas
13684 9754 72.2 Fringe
48183 Gregg County, Texas 121339 16463 13.4 Metropolitan 48303 Lubbock County,
Texas 297274 33324 11.3 Metropolitan
48257 Kaufman County, Texas
117811 54303 48.8 Metropolitan
48153 Floyd County, Texas 5834 3172 53.3 Agriculture & Extraction
48071 Chambers County, Texas
40076 17440 45.7 Metropolitan
48027 Bell County, Texas 321558 49984 15.2 Metropolitan
48233 Hutchinson County, Texas
21464 4913 22.6 Agriculture & Extraction
48361 Orange County, Texas
83301 29344 35.2 Metropolitan
48495 Winkler County, Texas
7703 1418 18.1 Agriculture & Extraction
48053 Burnet County, Texas 45246 25021 55.7 Destination 48113 Dallas County, Texas 2568003 17336 0.7 Metropolitan 48311 McMullen County,
Texas 662 805 100 Agriculture &
Extraction 48251 Johnson County,
Texas 161010 59635 37.9 Metropolitan
48205 Hartley County, Texas
4220 3486 57.3 Agriculture & Extraction
48293 Limestone County, Texas
22659 12613 53.6 Fringe
48367 Parker County, Texas 128417 69076 56.1 Fringe 48109 Culberson County,
Texas 2233 2266 100 Remote
48169 Garza County, Texas 4405 1437 22.3 Agriculture & Extraction
48453 Travis County, Texas 1195755 62893 5.5 Metropolitan 48087 Collingsworth
County, Texas 2929 3017 100 Destination
48279 Lamb County, Texas 13062 7831 57.7 Agriculture & Extraction
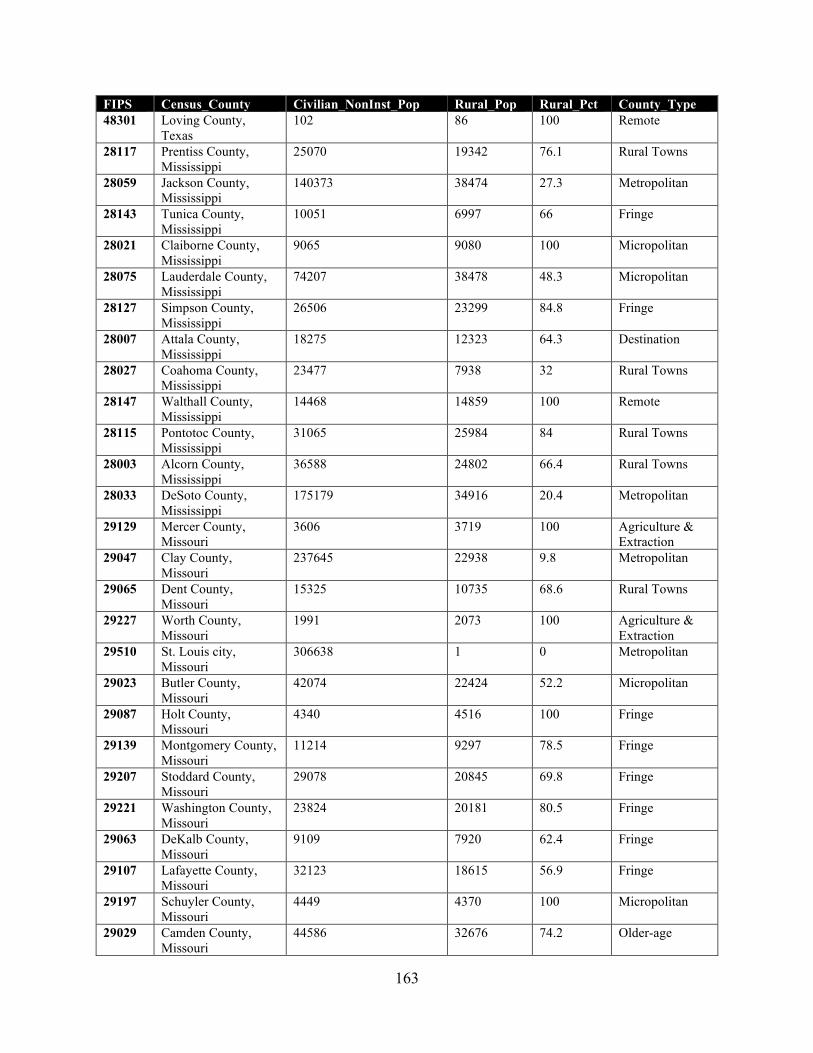
163
FIPS Census_County Civilian_NonInst_Pop Rural_Pop Rural_Pct County_Type 48301 Loving County,
Texas 102 86 100 Remote
28117 Prentiss County, Mississippi
25070 19342 76.1 Rural Towns
28059 Jackson County, Mississippi
140373 38474 27.3 Metropolitan
28143 Tunica County, Mississippi
10051 6997 66 Fringe
28021 Claiborne County, Mississippi
9065 9080 100 Micropolitan
28075 Lauderdale County, Mississippi
74207 38478 48.3 Micropolitan
28127 Simpson County, Mississippi
26506 23299 84.8 Fringe
28007 Attala County, Mississippi
18275 12323 64.3 Destination
28027 Coahoma County, Mississippi
23477 7938 32 Rural Towns
28147 Walthall County, Mississippi
14468 14859 100 Remote
28115 Pontotoc County, Mississippi
31065 25984 84 Rural Towns
28003 Alcorn County, Mississippi
36588 24802 66.4 Rural Towns
28033 DeSoto County, Mississippi
175179 34916 20.4 Metropolitan
29129 Mercer County, Missouri
3606 3719 100 Agriculture & Extraction
29047 Clay County, Missouri
237645 22938 9.8 Metropolitan
29065 Dent County, Missouri
15325 10735 68.6 Rural Towns
29227 Worth County, Missouri
1991 2073 100 Agriculture & Extraction
29510 St. Louis city, Missouri
306638 1 0 Metropolitan
29023 Butler County, Missouri
42074 22424 52.2 Micropolitan
29087 Holt County, Missouri
4340 4516 100 Fringe
29139 Montgomery County, Missouri
11214 9297 78.5 Fringe
29207 Stoddard County, Missouri
29078 20845 69.8 Fringe
29221 Washington County, Missouri
23824 20181 80.5 Fringe
29063 DeKalb County, Missouri
9109 7920 62.4 Fringe
29107 Lafayette County, Missouri
32123 18615 56.9 Fringe
29197 Schuyler County, Missouri
4449 4370 100 Micropolitan
29029 Camden County, Missouri
44586 32676 74.2 Older-age
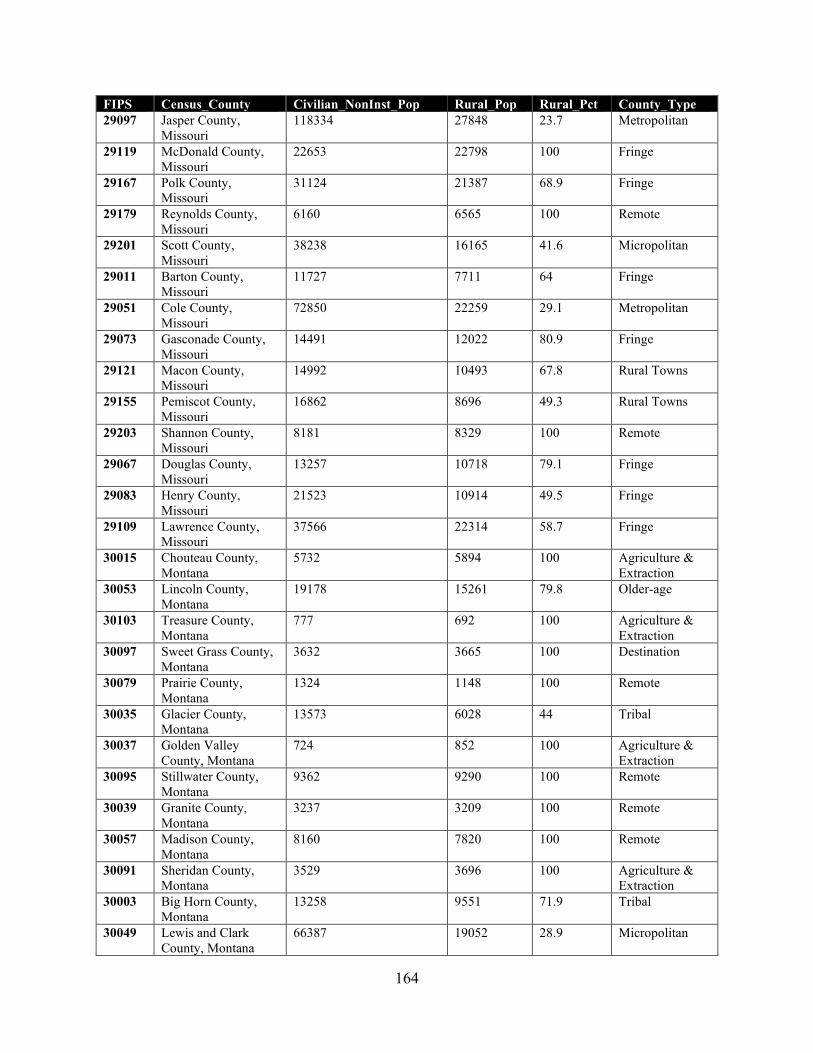
164
FIPS Census_County Civilian_NonInst_Pop Rural_Pop Rural_Pct County_Type 29097 Jasper County,
Missouri 118334 27848 23.7 Metropolitan
29119 McDonald County, Missouri
22653 22798 100 Fringe
29167 Polk County, Missouri
31124 21387 68.9 Fringe
29179 Reynolds County, Missouri
6160 6565 100 Remote
29201 Scott County, Missouri
38238 16165 41.6 Micropolitan
29011 Barton County, Missouri
11727 7711 64 Fringe
29051 Cole County, Missouri
72850 22259 29.1 Metropolitan
29073 Gasconade County, Missouri
14491 12022 80.9 Fringe
29121 Macon County, Missouri
14992 10493 67.8 Rural Towns
29155 Pemiscot County, Missouri
16862 8696 49.3 Rural Towns
29203 Shannon County, Missouri
8181 8329 100 Remote
29067 Douglas County, Missouri
13257 10718 79.1 Fringe
29083 Henry County, Missouri
21523 10914 49.5 Fringe
29109 Lawrence County, Missouri
37566 22314 58.7 Fringe
30015 Chouteau County, Montana
5732 5894 100 Agriculture & Extraction
30053 Lincoln County, Montana
19178 15261 79.8 Older-age
30103 Treasure County, Montana
777 692 100 Agriculture & Extraction
30097 Sweet Grass County, Montana
3632 3665 100 Destination
30079 Prairie County, Montana
1324 1148 100 Remote
30035 Glacier County, Montana
13573 6028 44 Tribal
30037 Golden Valley County, Montana
724 852 100 Agriculture & Extraction
30095 Stillwater County, Montana
9362 9290 100 Remote
30039 Granite County, Montana
3237 3209 100 Remote
30057 Madison County, Montana
8160 7820 100 Remote
30091 Sheridan County, Montana
3529 3696 100 Agriculture & Extraction
30003 Big Horn County, Montana
13258 9551 71.9 Tribal
30049 Lewis and Clark County, Montana
66387 19052 28.9 Micropolitan
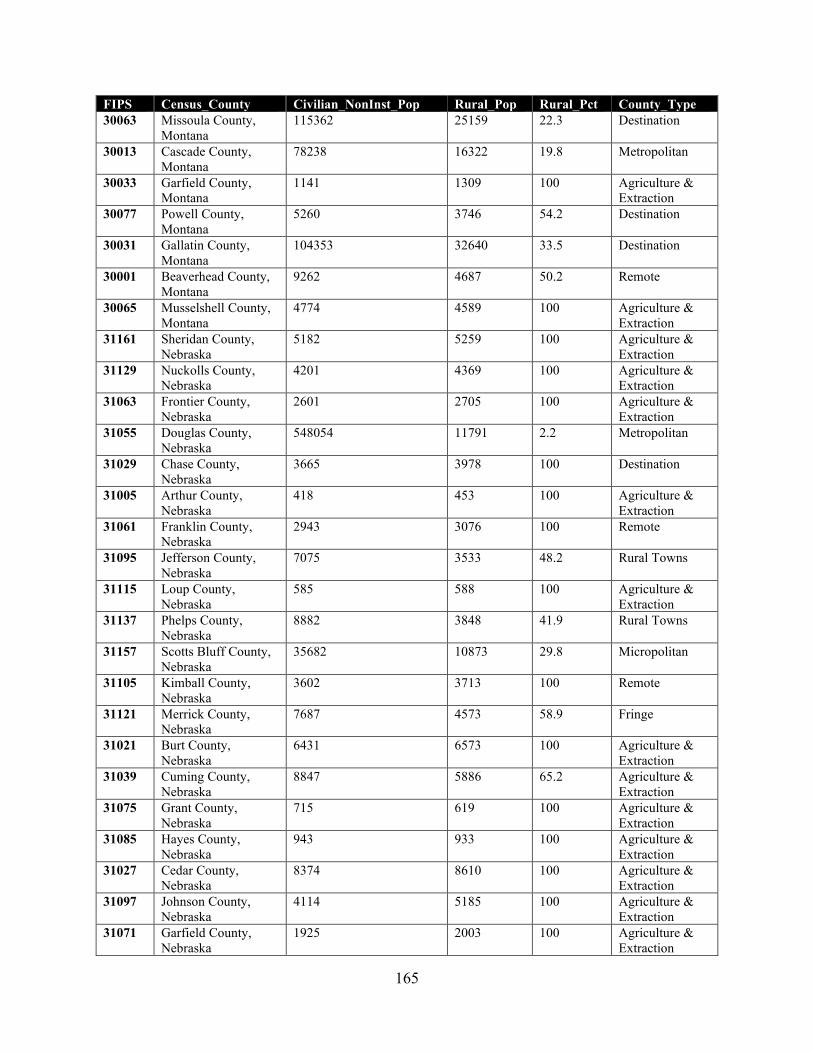
165
FIPS Census_County Civilian_NonInst_Pop Rural_Pop Rural_Pct County_Type 30063 Missoula County,
Montana 115362 25159 22.3 Destination
30013 Cascade County, Montana
78238 16322 19.8 Metropolitan
30033 Garfield County, Montana
1141 1309 100 Agriculture & Extraction
30077 Powell County, Montana
5260 3746 54.2 Destination
30031 Gallatin County, Montana
104353 32640 33.5 Destination
30001 Beaverhead County, Montana
9262 4687 50.2 Remote
30065 Musselshell County, Montana
4774 4589 100 Agriculture & Extraction
31161 Sheridan County, Nebraska
5182 5259 100 Agriculture & Extraction
31129 Nuckolls County, Nebraska
4201 4369 100 Agriculture & Extraction
31063 Frontier County, Nebraska
2601 2705 100 Agriculture & Extraction
31055 Douglas County, Nebraska
548054 11791 2.2 Metropolitan
31029 Chase County, Nebraska
3665 3978 100 Destination
31005 Arthur County, Nebraska
418 453 100 Agriculture & Extraction
31061 Franklin County, Nebraska
2943 3076 100 Remote
31095 Jefferson County, Nebraska
7075 3533 48.2 Rural Towns
31115 Loup County, Nebraska
585 588 100 Agriculture & Extraction
31137 Phelps County, Nebraska
8882 3848 41.9 Rural Towns
31157 Scotts Bluff County, Nebraska
35682 10873 29.8 Micropolitan
31105 Kimball County, Nebraska
3602 3713 100 Remote
31121 Merrick County, Nebraska
7687 4573 58.9 Fringe
31021 Burt County, Nebraska
6431 6573 100 Agriculture & Extraction
31039 Cuming County, Nebraska
8847 5886 65.2 Agriculture & Extraction
31075 Grant County, Nebraska
715 619 100 Agriculture & Extraction
31085 Hayes County, Nebraska
943 933 100 Agriculture & Extraction
31027 Cedar County, Nebraska
8374 8610 100 Agriculture & Extraction
31097 Johnson County, Nebraska
4114 5185 100 Agriculture & Extraction
31071 Garfield County, Nebraska
1925 2003 100 Agriculture & Extraction
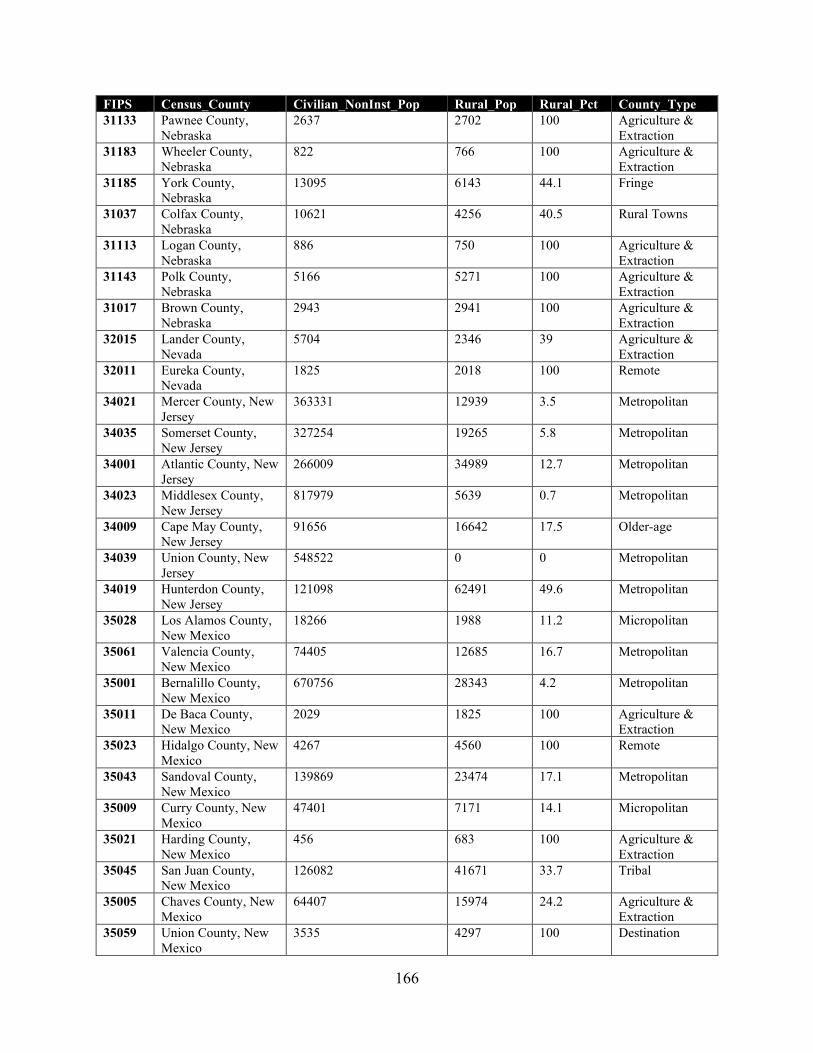
166
FIPS Census_County Civilian_NonInst_Pop Rural_Pop Rural_Pct County_Type 31133 Pawnee County,
Nebraska 2637 2702 100 Agriculture &
Extraction 31183 Wheeler County,
Nebraska 822 766 100 Agriculture &
Extraction 31185 York County,
Nebraska 13095 6143 44.1 Fringe
31037 Colfax County, Nebraska
10621 4256 40.5 Rural Towns
31113 Logan County, Nebraska
886 750 100 Agriculture & Extraction
31143 Polk County, Nebraska
5166 5271 100 Agriculture & Extraction
31017 Brown County, Nebraska
2943 2941 100 Agriculture & Extraction
32015 Lander County, Nevada
5704 2346 39 Agriculture & Extraction
32011 Eureka County, Nevada
1825 2018 100 Remote
34021 Mercer County, New Jersey
363331 12939 3.5 Metropolitan
34035 Somerset County, New Jersey
327254 19265 5.8 Metropolitan
34001 Atlantic County, New Jersey
266009 34989 12.7 Metropolitan
34023 Middlesex County, New Jersey
817979 5639 0.7 Metropolitan
34009 Cape May County, New Jersey
91656 16642 17.5 Older-age
34039 Union County, New Jersey
548522 0 0 Metropolitan
34019 Hunterdon County, New Jersey
121098 62491 49.6 Metropolitan
35028 Los Alamos County, New Mexico
18266 1988 11.2 Micropolitan
35061 Valencia County, New Mexico
74405 12685 16.7 Metropolitan
35001 Bernalillo County, New Mexico
670756 28343 4.2 Metropolitan
35011 De Baca County, New Mexico
2029 1825 100 Agriculture & Extraction
35023 Hidalgo County, New Mexico
4267 4560 100 Remote
35043 Sandoval County, New Mexico
139869 23474 17.1 Metropolitan
35009 Curry County, New Mexico
47401 7171 14.1 Micropolitan
35021 Harding County, New Mexico
456 683 100 Agriculture & Extraction
35045 San Juan County, New Mexico
126082 41671 33.7 Tribal
35005 Chaves County, New Mexico
64407 15974 24.2 Agriculture & Extraction
35059 Union County, New Mexico
3535 4297 100 Destination
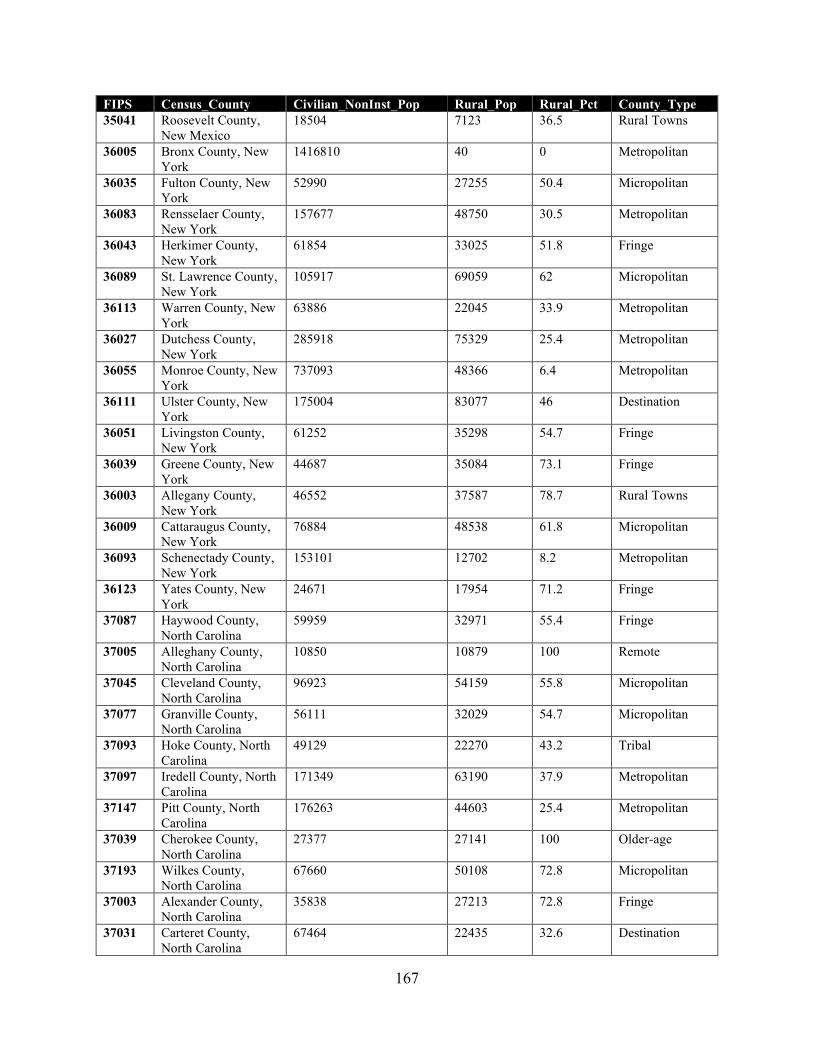
167
FIPS Census_County Civilian_NonInst_Pop Rural_Pop Rural_Pct County_Type 35041 Roosevelt County,
New Mexico 18504 7123 36.5 Rural Towns
36005 Bronx County, New York
1416810 40 0 Metropolitan
36035 Fulton County, New York
52990 27255 50.4 Micropolitan
36083 Rensselaer County, New York
157677 48750 30.5 Metropolitan
36043 Herkimer County, New York
61854 33025 51.8 Fringe
36089 St. Lawrence County, New York
105917 69059 62 Micropolitan
36113 Warren County, New York
63886 22045 33.9 Metropolitan
36027 Dutchess County, New York
285918 75329 25.4 Metropolitan
36055 Monroe County, New York
737093 48366 6.4 Metropolitan
36111 Ulster County, New York
175004 83077 46 Destination
36051 Livingston County, New York
61252 35298 54.7 Fringe
36039 Greene County, New York
44687 35084 73.1 Fringe
36003 Allegany County, New York
46552 37587 78.7 Rural Towns
36009 Cattaraugus County, New York
76884 48538 61.8 Micropolitan
36093 Schenectady County, New York
153101 12702 8.2 Metropolitan
36123 Yates County, New York
24671 17954 71.2 Fringe
37087 Haywood County, North Carolina
59959 32971 55.4 Fringe
37005 Alleghany County, North Carolina
10850 10879 100 Remote
37045 Cleveland County, North Carolina
96923 54159 55.8 Micropolitan
37077 Granville County, North Carolina
56111 32029 54.7 Micropolitan
37093 Hoke County, North Carolina
49129 22270 43.2 Tribal
37097 Iredell County, North Carolina
171349 63190 37.9 Metropolitan
37147 Pitt County, North Carolina
176263 44603 25.4 Metropolitan
37039 Cherokee County, North Carolina
27377 27141 100 Older-age
37193 Wilkes County, North Carolina
67660 50108 72.8 Micropolitan
37003 Alexander County, North Carolina
35838 27213 72.8 Fringe
37031 Carteret County, North Carolina
67464 22435 32.6 Destination
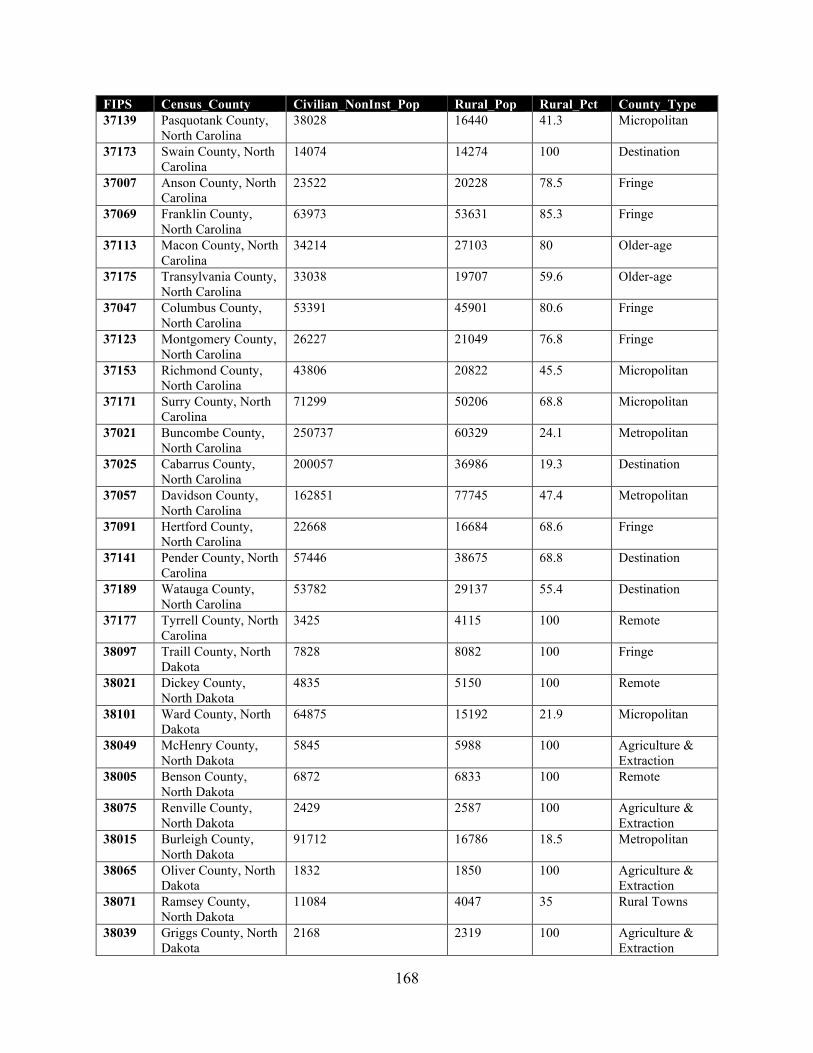
168
FIPS Census_County Civilian_NonInst_Pop Rural_Pop Rural_Pct County_Type 37139 Pasquotank County,
North Carolina 38028 16440 41.3 Micropolitan
37173 Swain County, North Carolina
14074 14274 100 Destination
37007 Anson County, North Carolina
23522 20228 78.5 Fringe
37069 Franklin County, North Carolina
63973 53631 85.3 Fringe
37113 Macon County, North Carolina
34214 27103 80 Older-age
37175 Transylvania County, North Carolina
33038 19707 59.6 Older-age
37047 Columbus County, North Carolina
53391 45901 80.6 Fringe
37123 Montgomery County, North Carolina
26227 21049 76.8 Fringe
37153 Richmond County, North Carolina
43806 20822 45.5 Micropolitan
37171 Surry County, North Carolina
71299 50206 68.8 Micropolitan
37021 Buncombe County, North Carolina
250737 60329 24.1 Metropolitan
37025 Cabarrus County, North Carolina
200057 36986 19.3 Destination
37057 Davidson County, North Carolina
162851 77745 47.4 Metropolitan
37091 Hertford County, North Carolina
22668 16684 68.6 Fringe
37141 Pender County, North Carolina
57446 38675 68.8 Destination
37189 Watauga County, North Carolina
53782 29137 55.4 Destination
37177 Tyrrell County, North Carolina
3425 4115 100 Remote
38097 Traill County, North Dakota
7828 8082 100 Fringe
38021 Dickey County, North Dakota
4835 5150 100 Remote
38101 Ward County, North Dakota
64875 15192 21.9 Micropolitan
38049 McHenry County, North Dakota
5845 5988 100 Agriculture & Extraction
38005 Benson County, North Dakota
6872 6833 100 Remote
38075 Renville County, North Dakota
2429 2587 100 Agriculture & Extraction
38015 Burleigh County, North Dakota
91712 16786 18.5 Metropolitan
38065 Oliver County, North Dakota
1832 1850 100 Agriculture & Extraction
38071 Ramsey County, North Dakota
11084 4047 35 Rural Towns
38039 Griggs County, North Dakota
2168 2319 100 Agriculture & Extraction
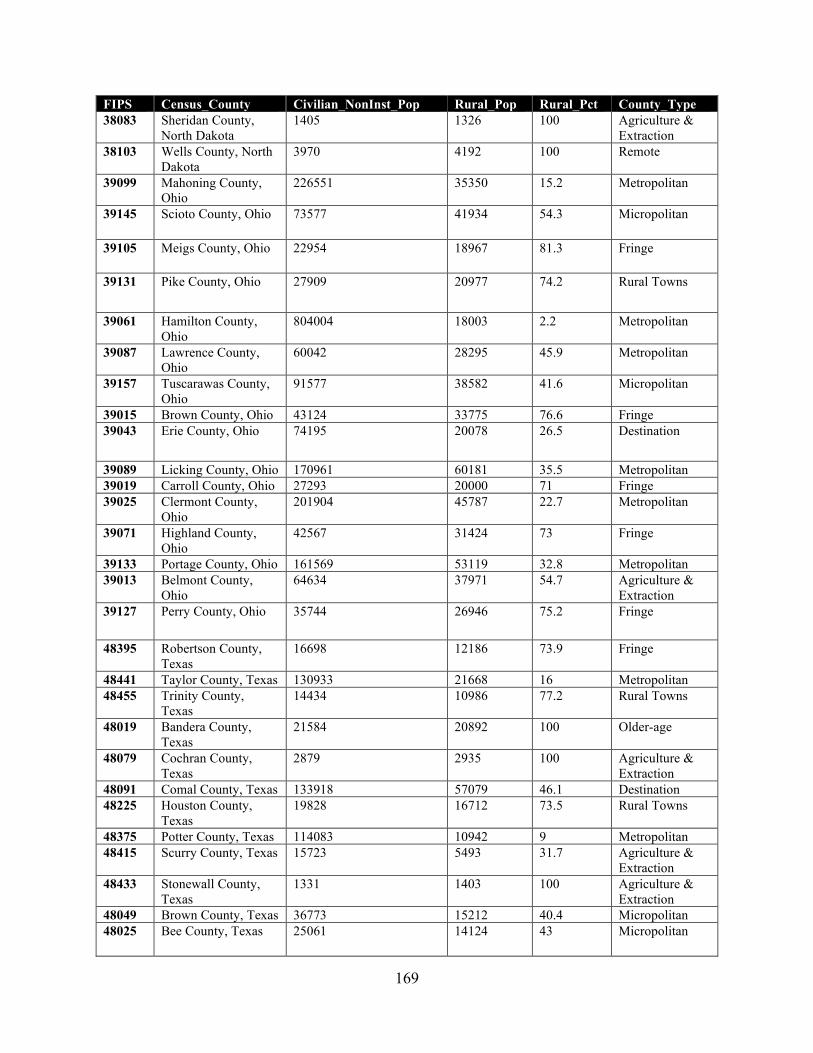
169
FIPS Census_County Civilian_NonInst_Pop Rural_Pop Rural_Pct County_Type 38083 Sheridan County,
North Dakota 1405 1326 100 Agriculture &
Extraction 38103 Wells County, North
Dakota 3970 4192 100 Remote
39099 Mahoning County, Ohio
226551 35350 15.2 Metropolitan
39145 Scioto County, Ohio 73577 41934 54.3 Micropolitan
39105 Meigs County, Ohio 22954 18967 81.3 Fringe
39131 Pike County, Ohio 27909 20977 74.2 Rural Towns
39061 Hamilton County, Ohio
804004 18003 2.2 Metropolitan
39087 Lawrence County, Ohio
60042 28295 45.9 Metropolitan
39157 Tuscarawas County, Ohio
91577 38582 41.6 Micropolitan
39015 Brown County, Ohio 43124 33775 76.6 Fringe 39043 Erie County, Ohio 74195 20078 26.5 Destination
39089 Licking County, Ohio 170961 60181 35.5 Metropolitan 39019 Carroll County, Ohio 27293 20000 71 Fringe 39025 Clermont County,
Ohio 201904 45787 22.7 Metropolitan
39071 Highland County, Ohio
42567 31424 73 Fringe
39133 Portage County, Ohio 161569 53119 32.8 Metropolitan 39013 Belmont County,
Ohio 64634 37971 54.7 Agriculture &
Extraction 39127 Perry County, Ohio 35744 26946 75.2 Fringe
48395 Robertson County, Texas
16698 12186 73.9 Fringe
48441 Taylor County, Texas 130933 21668 16 Metropolitan 48455 Trinity County,
Texas 14434 10986 77.2 Rural Towns
48019 Bandera County, Texas
21584 20892 100 Older-age
48079 Cochran County, Texas
2879 2935 100 Agriculture & Extraction
48091 Comal County, Texas 133918 57079 46.1 Destination 48225 Houston County,
Texas 19828 16712 73.5 Rural Towns
48375 Potter County, Texas 114083 10942 9 Metropolitan 48415 Scurry County, Texas 15723 5493 31.7 Agriculture &
Extraction 48433 Stonewall County,
Texas 1331 1403 100 Agriculture &
Extraction 48049 Brown County, Texas 36773 15212 40.4 Micropolitan 48025 Bee County, Texas 25061 14124 43 Micropolitan
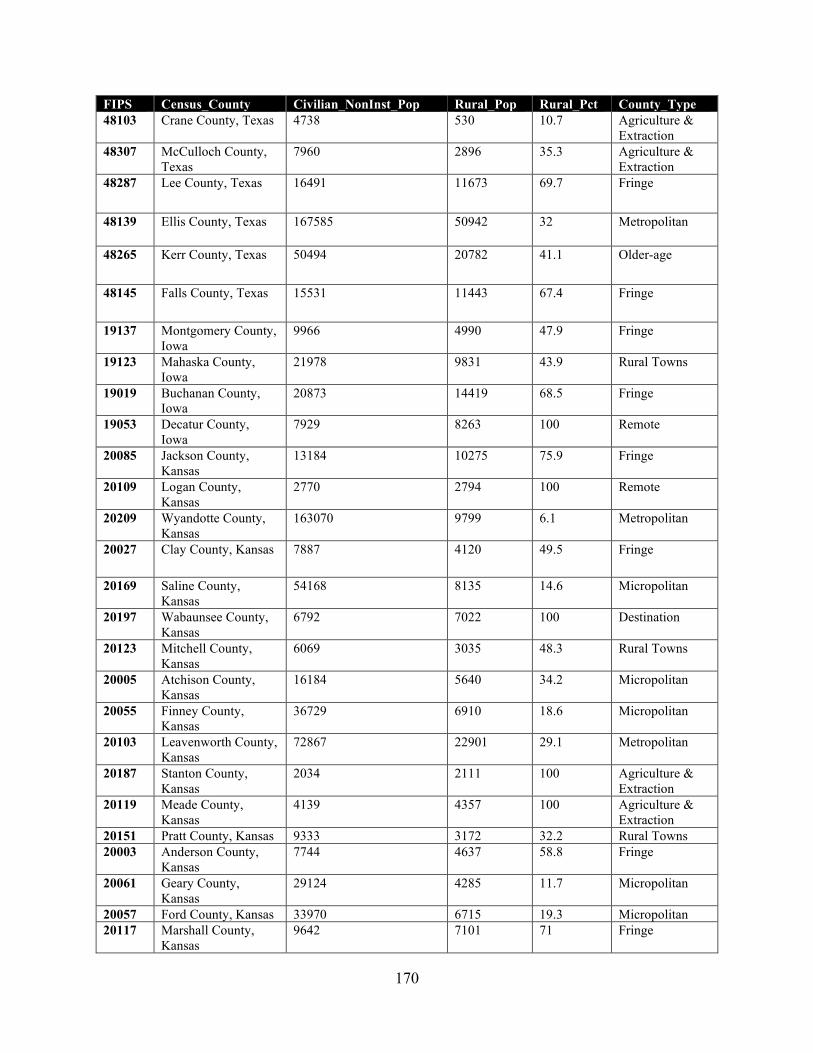
170
FIPS Census_County Civilian_NonInst_Pop Rural_Pop Rural_Pct County_Type 48103 Crane County, Texas 4738 530 10.7 Agriculture &
Extraction 48307 McCulloch County,
Texas 7960 2896 35.3 Agriculture &
Extraction 48287 Lee County, Texas 16491 11673 69.7 Fringe
48139 Ellis County, Texas 167585 50942 32 Metropolitan
48265 Kerr County, Texas 50494 20782 41.1 Older-age
48145 Falls County, Texas 15531 11443 67.4 Fringe
19137 Montgomery County, Iowa
9966 4990 47.9 Fringe
19123 Mahaska County, Iowa
21978 9831 43.9 Rural Towns
19019 Buchanan County, Iowa
20873 14419 68.5 Fringe
19053 Decatur County, Iowa
7929 8263 100 Remote
20085 Jackson County, Kansas
13184 10275 75.9 Fringe
20109 Logan County, Kansas
2770 2794 100 Remote
20209 Wyandotte County, Kansas
163070 9799 6.1 Metropolitan
20027 Clay County, Kansas 7887 4120 49.5 Fringe
20169 Saline County, Kansas
54168 8135 14.6 Micropolitan
20197 Wabaunsee County, Kansas
6792 7022 100 Destination
20123 Mitchell County, Kansas
6069 3035 48.3 Rural Towns
20005 Atchison County, Kansas
16184 5640 34.2 Micropolitan
20055 Finney County, Kansas
36729 6910 18.6 Micropolitan
20103 Leavenworth County, Kansas
72867 22901 29.1 Metropolitan
20187 Stanton County, Kansas
2034 2111 100 Agriculture & Extraction
20119 Meade County, Kansas
4139 4357 100 Agriculture & Extraction
20151 Pratt County, Kansas 9333 3172 32.2 Rural Towns 20003 Anderson County,
Kansas 7744 4637 58.8 Fringe
20061 Geary County, Kansas
29124 4285 11.7 Micropolitan
20057 Ford County, Kansas 33970 6715 19.3 Micropolitan 20117 Marshall County,
Kansas 9642 7101 71 Fringe
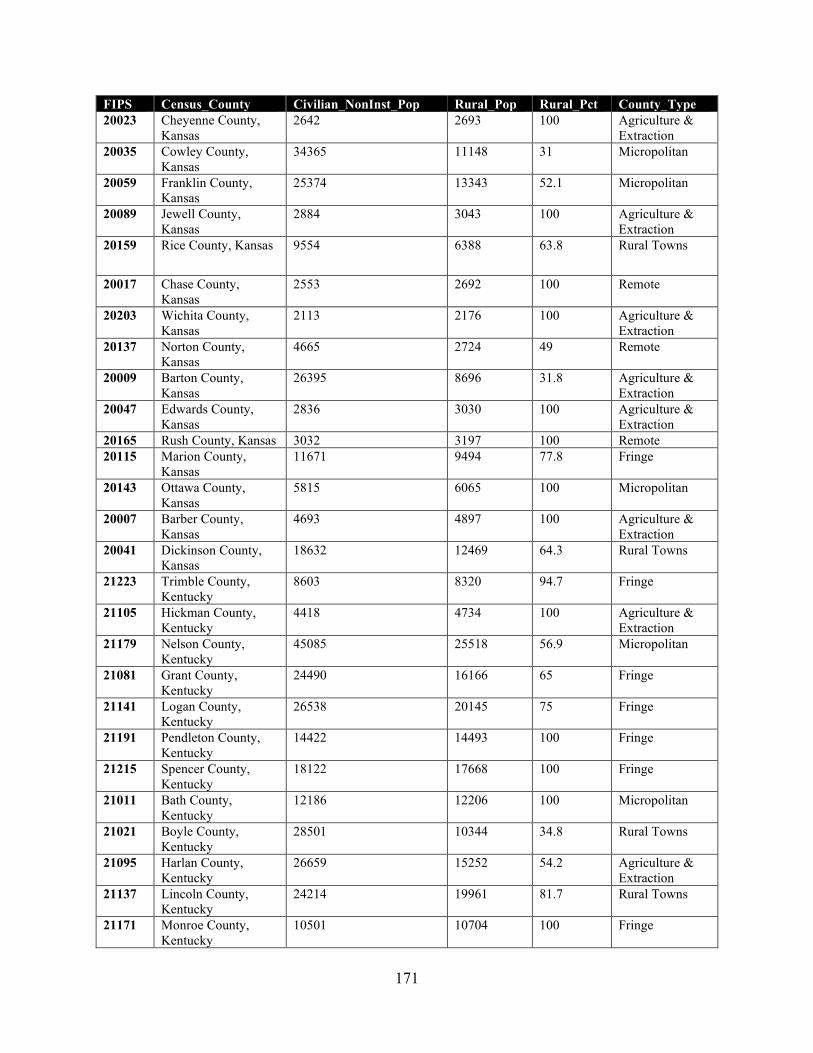
171
FIPS Census_County Civilian_NonInst_Pop Rural_Pop Rural_Pct County_Type 20023 Cheyenne County,
Kansas 2642 2693 100 Agriculture &
Extraction 20035 Cowley County,
Kansas 34365 11148 31 Micropolitan
20059 Franklin County, Kansas
25374 13343 52.1 Micropolitan
20089 Jewell County, Kansas
2884 3043 100 Agriculture & Extraction
20159 Rice County, Kansas 9554 6388 63.8 Rural Towns
20017 Chase County, Kansas
2553 2692 100 Remote
20203 Wichita County, Kansas
2113 2176 100 Agriculture & Extraction
20137 Norton County, Kansas
4665 2724 49 Remote
20009 Barton County, Kansas
26395 8696 31.8 Agriculture & Extraction
20047 Edwards County, Kansas
2836 3030 100 Agriculture & Extraction
20165 Rush County, Kansas 3032 3197 100 Remote 20115 Marion County,
Kansas 11671 9494 77.8 Fringe
20143 Ottawa County, Kansas
5815 6065 100 Micropolitan
20007 Barber County, Kansas
4693 4897 100 Agriculture & Extraction
20041 Dickinson County, Kansas
18632 12469 64.3 Rural Towns
21223 Trimble County, Kentucky
8603 8320 94.7 Fringe
21105 Hickman County, Kentucky
4418 4734 100 Agriculture & Extraction
21179 Nelson County, Kentucky
45085 25518 56.9 Micropolitan
21081 Grant County, Kentucky
24490 16166 65 Fringe
21141 Logan County, Kentucky
26538 20145 75 Fringe
21191 Pendleton County, Kentucky
14422 14493 100 Fringe
21215 Spencer County, Kentucky
18122 17668 100 Fringe
21011 Bath County, Kentucky
12186 12206 100 Micropolitan
21021 Boyle County, Kentucky
28501 10344 34.8 Rural Towns
21095 Harlan County, Kentucky
26659 15252 54.2 Agriculture & Extraction
21137 Lincoln County, Kentucky
24214 19961 81.7 Rural Towns
21171 Monroe County, Kentucky
10501 10704 100 Fringe
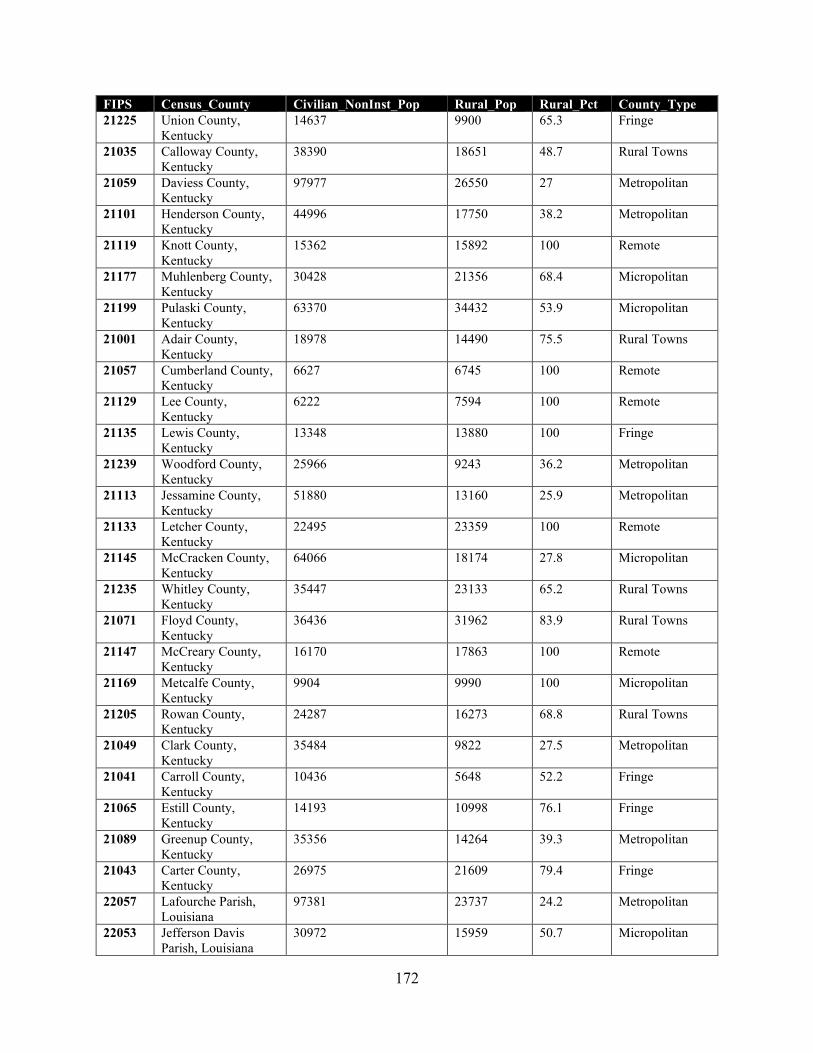
172
FIPS Census_County Civilian_NonInst_Pop Rural_Pop Rural_Pct County_Type 21225 Union County,
Kentucky 14637 9900 65.3 Fringe
21035 Calloway County, Kentucky
38390 18651 48.7 Rural Towns
21059 Daviess County, Kentucky
97977 26550 27 Metropolitan
21101 Henderson County, Kentucky
44996 17750 38.2 Metropolitan
21119 Knott County, Kentucky
15362 15892 100 Remote
21177 Muhlenberg County, Kentucky
30428 21356 68.4 Micropolitan
21199 Pulaski County, Kentucky
63370 34432 53.9 Micropolitan
21001 Adair County, Kentucky
18978 14490 75.5 Rural Towns
21057 Cumberland County, Kentucky
6627 6745 100 Remote
21129 Lee County, Kentucky
6222 7594 100 Remote
21135 Lewis County, Kentucky
13348 13880 100 Fringe
21239 Woodford County, Kentucky
25966 9243 36.2 Metropolitan
21113 Jessamine County, Kentucky
51880 13160 25.9 Metropolitan
21133 Letcher County, Kentucky
22495 23359 100 Remote
21145 McCracken County, Kentucky
64066 18174 27.8 Micropolitan
21235 Whitley County, Kentucky
35447 23133 65.2 Rural Towns
21071 Floyd County, Kentucky
36436 31962 83.9 Rural Towns
21147 McCreary County, Kentucky
16170 17863 100 Remote
21169 Metcalfe County, Kentucky
9904 9990 100 Micropolitan
21205 Rowan County, Kentucky
24287 16273 68.8 Rural Towns
21049 Clark County, Kentucky
35484 9822 27.5 Metropolitan
21041 Carroll County, Kentucky
10436 5648 52.2 Fringe
21065 Estill County, Kentucky
14193 10998 76.1 Fringe
21089 Greenup County, Kentucky
35356 14264 39.3 Metropolitan
21043 Carter County, Kentucky
26975 21609 79.4 Fringe
22057 Lafourche Parish, Louisiana
97381 23737 24.2 Metropolitan
22053 Jefferson Davis Parish, Louisiana
30972 15959 50.7 Micropolitan
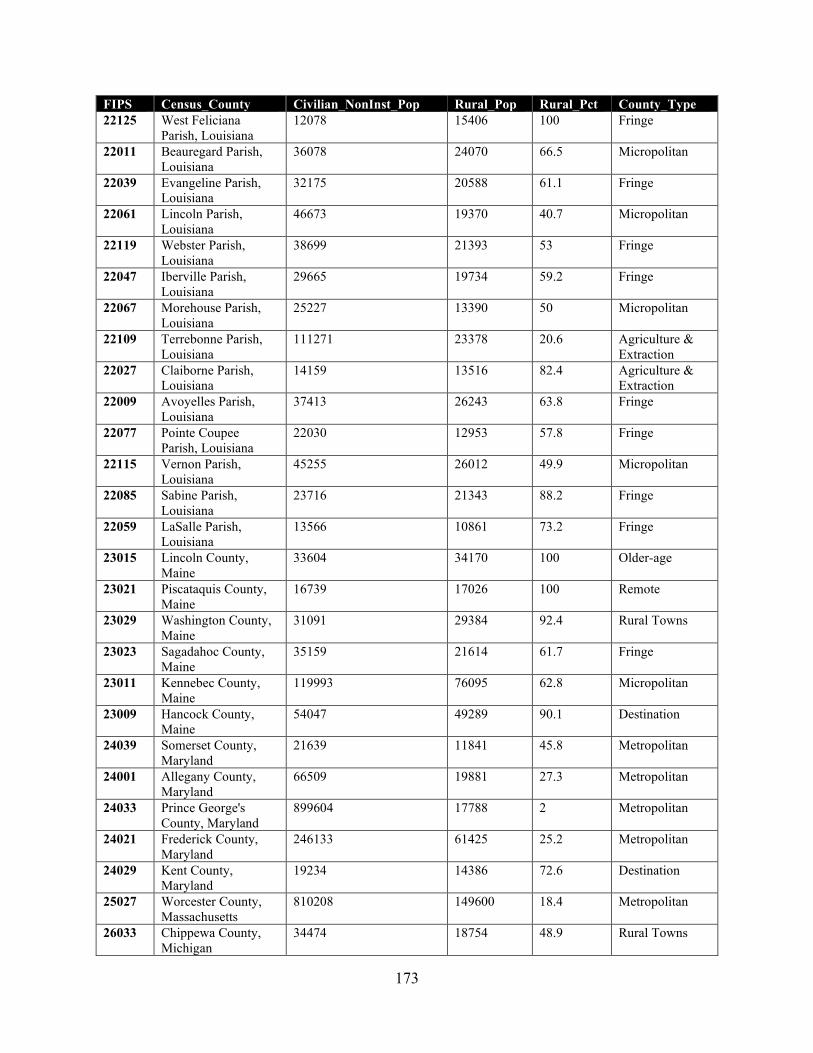
173
FIPS Census_County Civilian_NonInst_Pop Rural_Pop Rural_Pct County_Type 22125 West Feliciana
Parish, Louisiana 12078 15406 100 Fringe
22011 Beauregard Parish, Louisiana
36078 24070 66.5 Micropolitan
22039 Evangeline Parish, Louisiana
32175 20588 61.1 Fringe
22061 Lincoln Parish, Louisiana
46673 19370 40.7 Micropolitan
22119 Webster Parish, Louisiana
38699 21393 53 Fringe
22047 Iberville Parish, Louisiana
29665 19734 59.2 Fringe
22067 Morehouse Parish, Louisiana
25227 13390 50 Micropolitan
22109 Terrebonne Parish, Louisiana
111271 23378 20.6 Agriculture & Extraction
22027 Claiborne Parish, Louisiana
14159 13516 82.4 Agriculture & Extraction
22009 Avoyelles Parish, Louisiana
37413 26243 63.8 Fringe
22077 Pointe Coupee Parish, Louisiana
22030 12953 57.8 Fringe
22115 Vernon Parish, Louisiana
45255 26012 49.9 Micropolitan
22085 Sabine Parish, Louisiana
23716 21343 88.2 Fringe
22059 LaSalle Parish, Louisiana
13566 10861 73.2 Fringe
23015 Lincoln County, Maine
33604 34170 100 Older-age
23021 Piscataquis County, Maine
16739 17026 100 Remote
23029 Washington County, Maine
31091 29384 92.4 Rural Towns
23023 Sagadahoc County, Maine
35159 21614 61.7 Fringe
23011 Kennebec County, Maine
119993 76095 62.8 Micropolitan
23009 Hancock County, Maine
54047 49289 90.1 Destination
24039 Somerset County, Maryland
21639 11841 45.8 Metropolitan
24001 Allegany County, Maryland
66509 19881 27.3 Metropolitan
24033 Prince George's County, Maryland
899604 17788 2 Metropolitan
24021 Frederick County, Maryland
246133 61425 25.2 Metropolitan
24029 Kent County, Maryland
19234 14386 72.6 Destination
25027 Worcester County, Massachusetts
810208 149600 18.4 Metropolitan
26033 Chippewa County, Michigan
34474 18754 48.9 Rural Towns
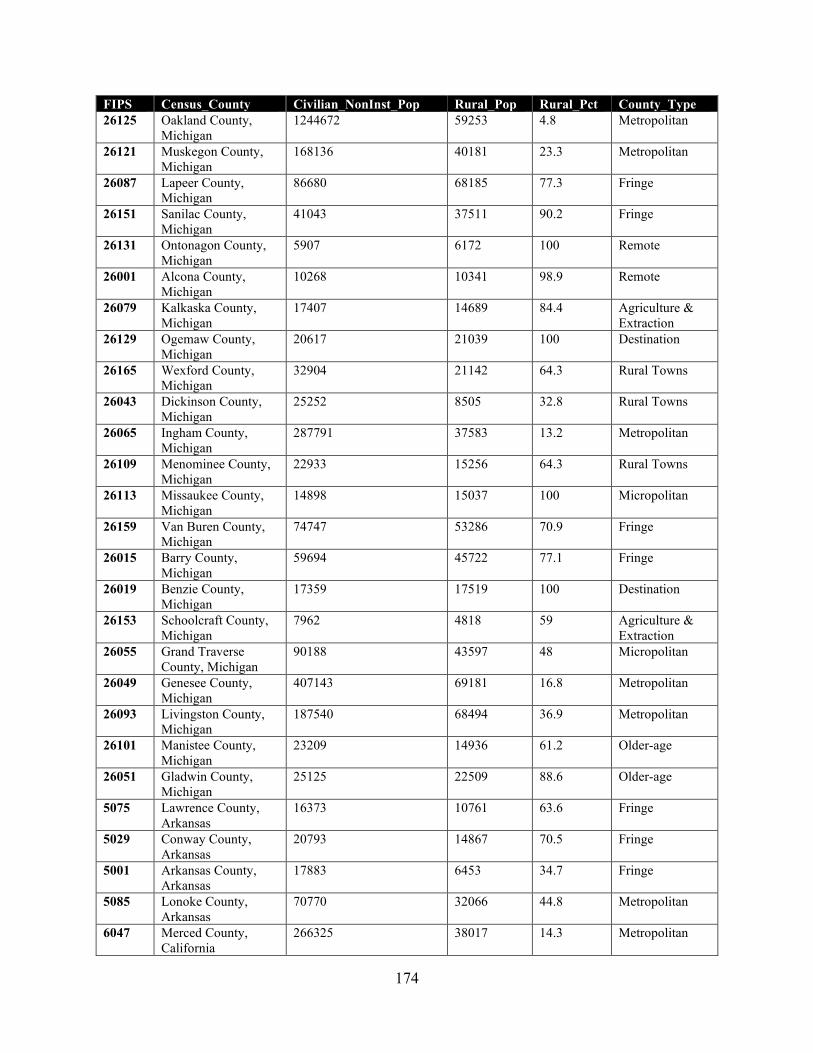
174
FIPS Census_County Civilian_NonInst_Pop Rural_Pop Rural_Pct County_Type 26125 Oakland County,
Michigan 1244672 59253 4.8 Metropolitan
26121 Muskegon County, Michigan
168136 40181 23.3 Metropolitan
26087 Lapeer County, Michigan
86680 68185 77.3 Fringe
26151 Sanilac County, Michigan
41043 37511 90.2 Fringe
26131 Ontonagon County, Michigan
5907 6172 100 Remote
26001 Alcona County, Michigan
10268 10341 98.9 Remote
26079 Kalkaska County, Michigan
17407 14689 84.4 Agriculture & Extraction
26129 Ogemaw County, Michigan
20617 21039 100 Destination
26165 Wexford County, Michigan
32904 21142 64.3 Rural Towns
26043 Dickinson County, Michigan
25252 8505 32.8 Rural Towns
26065 Ingham County, Michigan
287791 37583 13.2 Metropolitan
26109 Menominee County, Michigan
22933 15256 64.3 Rural Towns
26113 Missaukee County, Michigan
14898 15037 100 Micropolitan
26159 Van Buren County, Michigan
74747 53286 70.9 Fringe
26015 Barry County, Michigan
59694 45722 77.1 Fringe
26019 Benzie County, Michigan
17359 17519 100 Destination
26153 Schoolcraft County, Michigan
7962 4818 59 Agriculture & Extraction
26055 Grand Traverse County, Michigan
90188 43597 48 Micropolitan
26049 Genesee County, Michigan
407143 69181 16.8 Metropolitan
26093 Livingston County, Michigan
187540 68494 36.9 Metropolitan
26101 Manistee County, Michigan
23209 14936 61.2 Older-age
26051 Gladwin County, Michigan
25125 22509 88.6 Older-age
5075 Lawrence County, Arkansas
16373 10761 63.6 Fringe
5029 Conway County, Arkansas
20793 14867 70.5 Fringe
5001 Arkansas County, Arkansas
17883 6453 34.7 Fringe
5085 Lonoke County, Arkansas
70770 32066 44.8 Metropolitan
6047 Merced County, California
266325 38017 14.3 Metropolitan
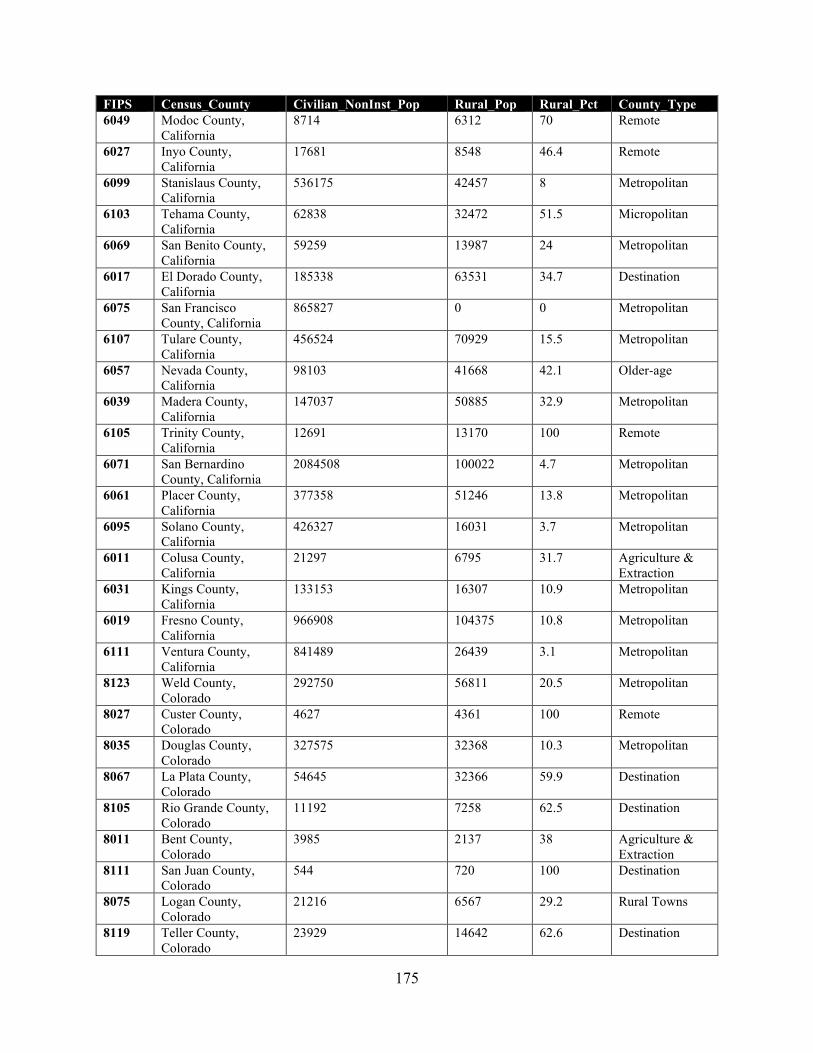
175
FIPS Census_County Civilian_NonInst_Pop Rural_Pop Rural_Pct County_Type 6049 Modoc County,
California 8714 6312 70 Remote
6027 Inyo County, California
17681 8548 46.4 Remote
6099 Stanislaus County, California
536175 42457 8 Metropolitan
6103 Tehama County, California
62838 32472 51.5 Micropolitan
6069 San Benito County, California
59259 13987 24 Metropolitan
6017 El Dorado County, California
185338 63531 34.7 Destination
6075 San Francisco County, California
865827 0 0 Metropolitan
6107 Tulare County, California
456524 70929 15.5 Metropolitan
6057 Nevada County, California
98103 41668 42.1 Older-age
6039 Madera County, California
147037 50885 32.9 Metropolitan
6105 Trinity County, California
12691 13170 100 Remote
6071 San Bernardino County, California
2084508 100022 4.7 Metropolitan
6061 Placer County, California
377358 51246 13.8 Metropolitan
6095 Solano County, California
426327 16031 3.7 Metropolitan
6011 Colusa County, California
21297 6795 31.7 Agriculture & Extraction
6031 Kings County, California
133153 16307 10.9 Metropolitan
6019 Fresno County, California
966908 104375 10.8 Metropolitan
6111 Ventura County, California
841489 26439 3.1 Metropolitan
8123 Weld County, Colorado
292750 56811 20.5 Metropolitan
8027 Custer County, Colorado
4627 4361 100 Remote
8035 Douglas County, Colorado
327575 32368 10.3 Metropolitan
8067 La Plata County, Colorado
54645 32366 59.9 Destination
8105 Rio Grande County, Colorado
11192 7258 62.5 Destination
8011 Bent County, Colorado
3985 2137 38 Agriculture & Extraction
8111 San Juan County, Colorado
544 720 100 Destination
8075 Logan County, Colorado
21216 6567 29.2 Rural Towns
8119 Teller County, Colorado
23929 14642 62.6 Destination
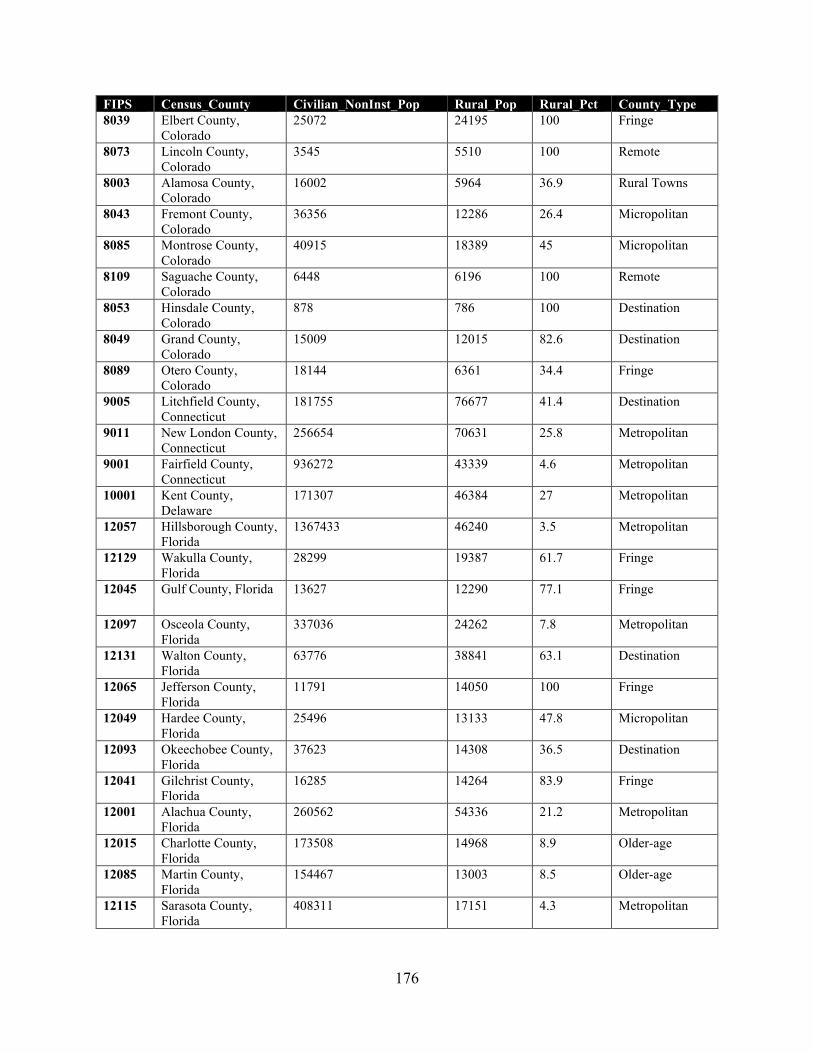
176
FIPS Census_County Civilian_NonInst_Pop Rural_Pop Rural_Pct County_Type 8039 Elbert County,
Colorado 25072 24195 100 Fringe
8073 Lincoln County, Colorado
3545 5510 100 Remote
8003 Alamosa County, Colorado
16002 5964 36.9 Rural Towns
8043 Fremont County, Colorado
36356 12286 26.4 Micropolitan
8085 Montrose County, Colorado
40915 18389 45 Micropolitan
8109 Saguache County, Colorado
6448 6196 100 Remote
8053 Hinsdale County, Colorado
878 786 100 Destination
8049 Grand County, Colorado
15009 12015 82.6 Destination
8089 Otero County, Colorado
18144 6361 34.4 Fringe
9005 Litchfield County, Connecticut
181755 76677 41.4 Destination
9011 New London County, Connecticut
256654 70631 25.8 Metropolitan
9001 Fairfield County, Connecticut
936272 43339 4.6 Metropolitan
10001 Kent County, Delaware
171307 46384 27 Metropolitan
12057 Hillsborough County, Florida
1367433 46240 3.5 Metropolitan
12129 Wakulla County, Florida
28299 19387 61.7 Fringe
12045 Gulf County, Florida 13627 12290 77.1 Fringe
12097 Osceola County, Florida
337036 24262 7.8 Metropolitan
12131 Walton County, Florida
63776 38841 63.1 Destination
12065 Jefferson County, Florida
11791 14050 100 Fringe
12049 Hardee County, Florida
25496 13133 47.8 Micropolitan
12093 Okeechobee County, Florida
37623 14308 36.5 Destination
12041 Gilchrist County, Florida
16285 14264 83.9 Fringe
12001 Alachua County, Florida
260562 54336 21.2 Metropolitan
12015 Charlotte County, Florida
173508 14968 8.9 Older-age
12085 Martin County, Florida
154467 13003 8.5 Older-age
12115 Sarasota County, Florida
408311 17151 4.3 Metropolitan
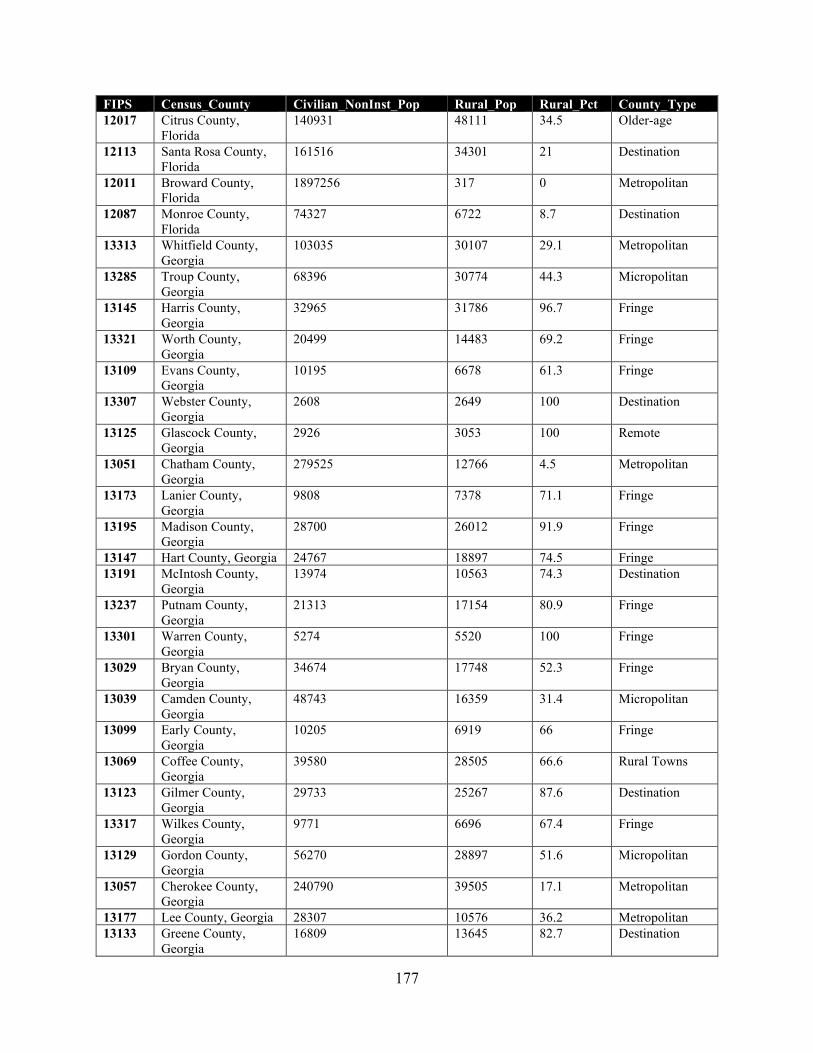
177
FIPS Census_County Civilian_NonInst_Pop Rural_Pop Rural_Pct County_Type 12017 Citrus County,
Florida 140931 48111 34.5 Older-age
12113 Santa Rosa County, Florida
161516 34301 21 Destination
12011 Broward County, Florida
1897256 317 0 Metropolitan
12087 Monroe County, Florida
74327 6722 8.7 Destination
13313 Whitfield County, Georgia
103035 30107 29.1 Metropolitan
13285 Troup County, Georgia
68396 30774 44.3 Micropolitan
13145 Harris County, Georgia
32965 31786 96.7 Fringe
13321 Worth County, Georgia
20499 14483 69.2 Fringe
13109 Evans County, Georgia
10195 6678 61.3 Fringe
13307 Webster County, Georgia
2608 2649 100 Destination
13125 Glascock County, Georgia
2926 3053 100 Remote
13051 Chatham County, Georgia
279525 12766 4.5 Metropolitan
13173 Lanier County, Georgia
9808 7378 71.1 Fringe
13195 Madison County, Georgia
28700 26012 91.9 Fringe
13147 Hart County, Georgia 24767 18897 74.5 Fringe 13191 McIntosh County,
Georgia 13974 10563 74.3 Destination
13237 Putnam County, Georgia
21313 17154 80.9 Fringe
13301 Warren County, Georgia
5274 5520 100 Fringe
13029 Bryan County, Georgia
34674 17748 52.3 Fringe
13039 Camden County, Georgia
48743 16359 31.4 Micropolitan
13099 Early County, Georgia
10205 6919 66 Fringe
13069 Coffee County, Georgia
39580 28505 66.6 Rural Towns
13123 Gilmer County, Georgia
29733 25267 87.6 Destination
13317 Wilkes County, Georgia
9771 6696 67.4 Fringe
13129 Gordon County, Georgia
56270 28897 51.6 Micropolitan
13057 Cherokee County, Georgia
240790 39505 17.1 Metropolitan
13177 Lee County, Georgia 28307 10576 36.2 Metropolitan 13133 Greene County,
Georgia 16809 13645 82.7 Destination
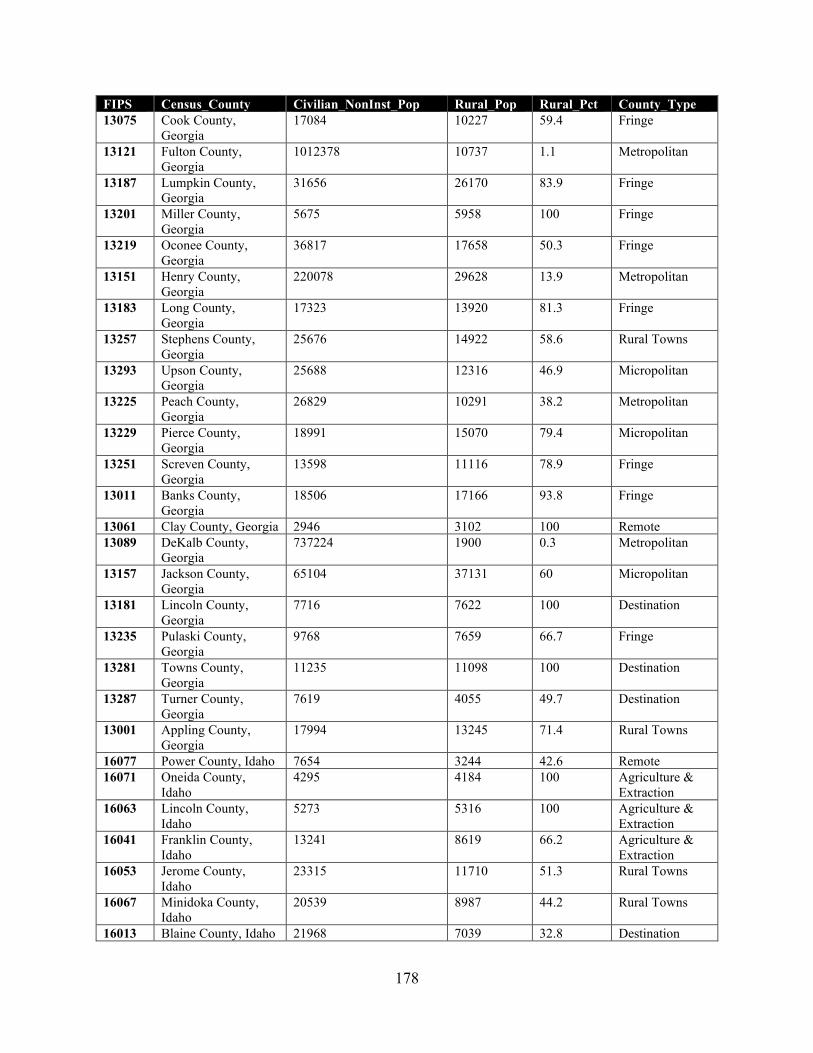
178
FIPS Census_County Civilian_NonInst_Pop Rural_Pop Rural_Pct County_Type 13075 Cook County,
Georgia 17084 10227 59.4 Fringe
13121 Fulton County, Georgia
1012378 10737 1.1 Metropolitan
13187 Lumpkin County, Georgia
31656 26170 83.9 Fringe
13201 Miller County, Georgia
5675 5958 100 Fringe
13219 Oconee County, Georgia
36817 17658 50.3 Fringe
13151 Henry County, Georgia
220078 29628 13.9 Metropolitan
13183 Long County, Georgia
17323 13920 81.3 Fringe
13257 Stephens County, Georgia
25676 14922 58.6 Rural Towns
13293 Upson County, Georgia
25688 12316 46.9 Micropolitan
13225 Peach County, Georgia
26829 10291 38.2 Metropolitan
13229 Pierce County, Georgia
18991 15070 79.4 Micropolitan
13251 Screven County, Georgia
13598 11116 78.9 Fringe
13011 Banks County, Georgia
18506 17166 93.8 Fringe
13061 Clay County, Georgia 2946 3102 100 Remote 13089 DeKalb County,
Georgia 737224 1900 0.3 Metropolitan
13157 Jackson County, Georgia
65104 37131 60 Micropolitan
13181 Lincoln County, Georgia
7716 7622 100 Destination
13235 Pulaski County, Georgia
9768 7659 66.7 Fringe
13281 Towns County, Georgia
11235 11098 100 Destination
13287 Turner County, Georgia
7619 4055 49.7 Destination
13001 Appling County, Georgia
17994 13245 71.4 Rural Towns
16077 Power County, Idaho 7654 3244 42.6 Remote 16071 Oneida County,
Idaho 4295 4184 100 Agriculture &
Extraction 16063 Lincoln County,
Idaho 5273 5316 100 Agriculture &
Extraction 16041 Franklin County,
Idaho 13241 8619 66.2 Agriculture &
Extraction 16053 Jerome County,
Idaho 23315 11710 51.3 Rural Towns
16067 Minidoka County, Idaho
20539 8987 44.2 Rural Towns
16013 Blaine County, Idaho 21968 7039 32.8 Destination
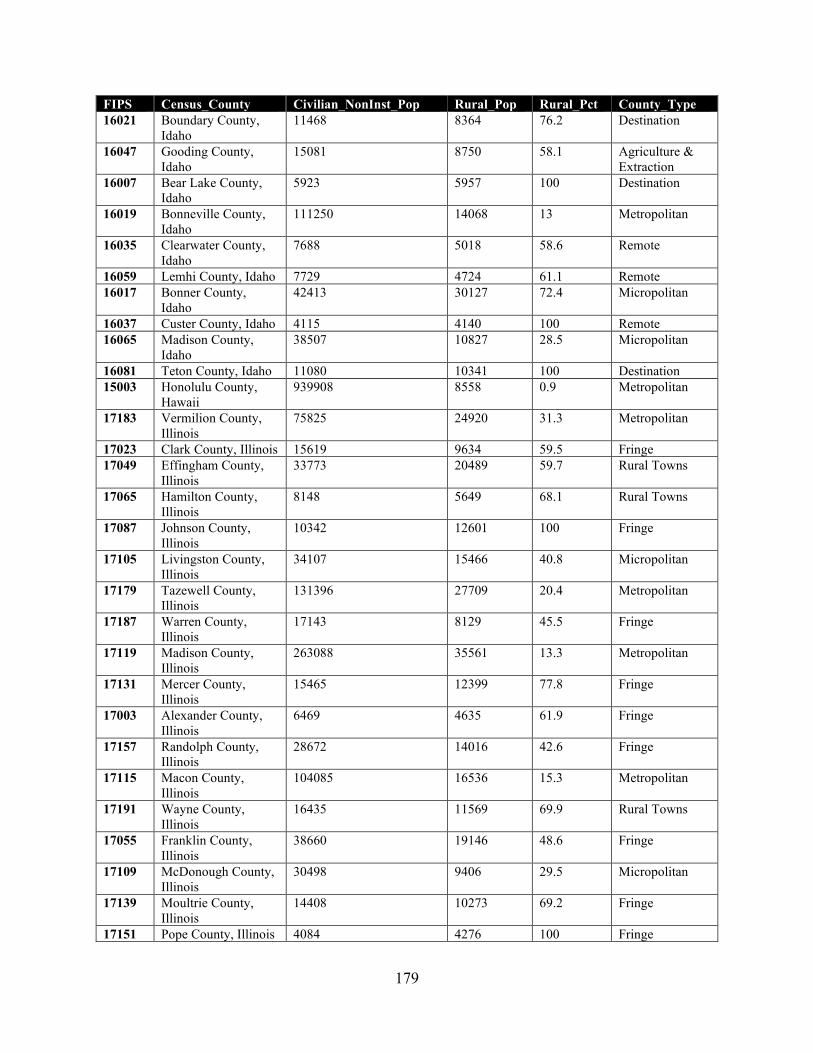
179
FIPS Census_County Civilian_NonInst_Pop Rural_Pop Rural_Pct County_Type 16021 Boundary County,
Idaho 11468 8364 76.2 Destination
16047 Gooding County, Idaho
15081 8750 58.1 Agriculture & Extraction
16007 Bear Lake County, Idaho
5923 5957 100 Destination
16019 Bonneville County, Idaho
111250 14068 13 Metropolitan
16035 Clearwater County, Idaho
7688 5018 58.6 Remote
16059 Lemhi County, Idaho 7729 4724 61.1 Remote 16017 Bonner County,
Idaho 42413 30127 72.4 Micropolitan
16037 Custer County, Idaho 4115 4140 100 Remote 16065 Madison County,
Idaho 38507 10827 28.5 Micropolitan
16081 Teton County, Idaho 11080 10341 100 Destination 15003 Honolulu County,
Hawaii 939908 8558 0.9 Metropolitan
17183 Vermilion County, Illinois
75825 24920 31.3 Metropolitan
17023 Clark County, Illinois 15619 9634 59.5 Fringe 17049 Effingham County,
Illinois 33773 20489 59.7 Rural Towns
17065 Hamilton County, Illinois
8148 5649 68.1 Rural Towns
17087 Johnson County, Illinois
10342 12601 100 Fringe
17105 Livingston County, Illinois
34107 15466 40.8 Micropolitan
17179 Tazewell County, Illinois
131396 27709 20.4 Metropolitan
17187 Warren County, Illinois
17143 8129 45.5 Fringe
17119 Madison County, Illinois
263088 35561 13.3 Metropolitan
17131 Mercer County, Illinois
15465 12399 77.8 Fringe
17003 Alexander County, Illinois
6469 4635 61.9 Fringe
17157 Randolph County, Illinois
28672 14016 42.6 Fringe
17115 Macon County, Illinois
104085 16536 15.3 Metropolitan
17191 Wayne County, Illinois
16435 11569 69.9 Rural Towns
17055 Franklin County, Illinois
38660 19146 48.6 Fringe
17109 McDonough County, Illinois
30498 9406 29.5 Micropolitan
17139 Moultrie County, Illinois
14408 10273 69.2 Fringe
17151 Pope County, Illinois 4084 4276 100 Fringe
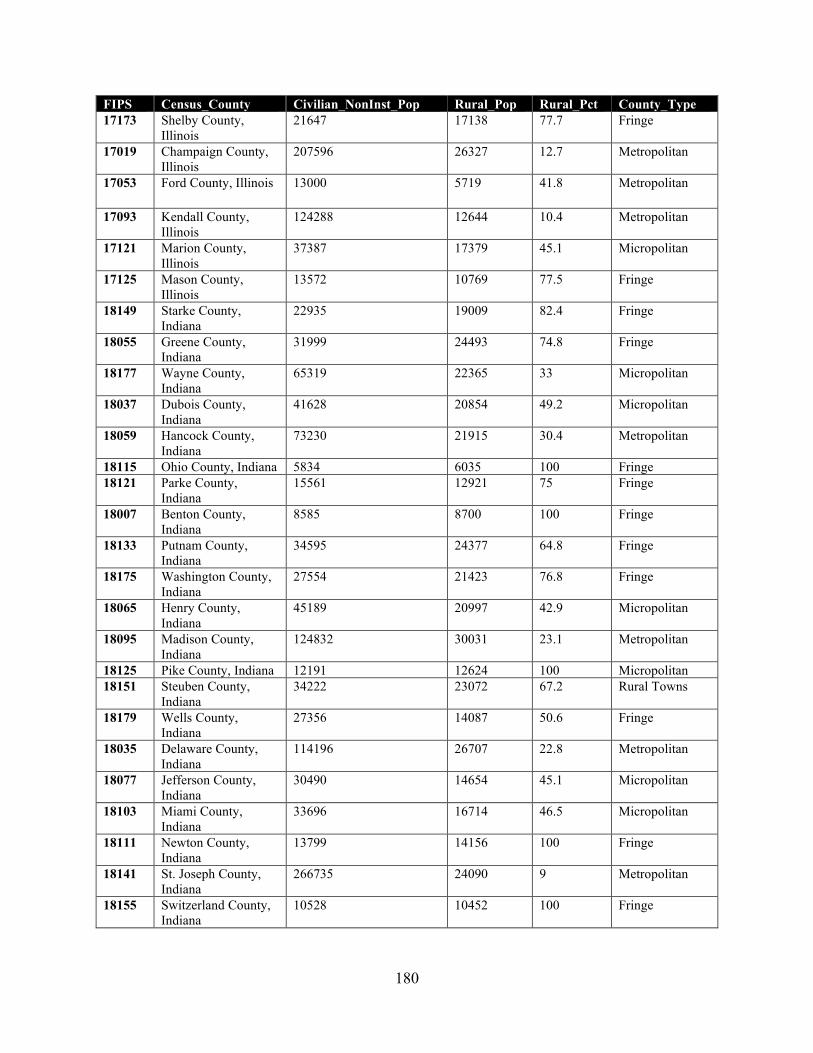
180
FIPS Census_County Civilian_NonInst_Pop Rural_Pop Rural_Pct County_Type 17173 Shelby County,
Illinois 21647 17138 77.7 Fringe
17019 Champaign County, Illinois
207596 26327 12.7 Metropolitan
17053 Ford County, Illinois 13000 5719 41.8 Metropolitan
17093 Kendall County, Illinois
124288 12644 10.4 Metropolitan
17121 Marion County, Illinois
37387 17379 45.1 Micropolitan
17125 Mason County, Illinois
13572 10769 77.5 Fringe
18149 Starke County, Indiana
22935 19009 82.4 Fringe
18055 Greene County, Indiana
31999 24493 74.8 Fringe
18177 Wayne County, Indiana
65319 22365 33 Micropolitan
18037 Dubois County, Indiana
41628 20854 49.2 Micropolitan
18059 Hancock County, Indiana
73230 21915 30.4 Metropolitan
18115 Ohio County, Indiana 5834 6035 100 Fringe 18121 Parke County,
Indiana 15561 12921 75 Fringe
18007 Benton County, Indiana
8585 8700 100 Fringe
18133 Putnam County, Indiana
34595 24377 64.8 Fringe
18175 Washington County, Indiana
27554 21423 76.8 Fringe
18065 Henry County, Indiana
45189 20997 42.9 Micropolitan
18095 Madison County, Indiana
124832 30031 23.1 Metropolitan
18125 Pike County, Indiana 12191 12624 100 Micropolitan 18151 Steuben County,
Indiana 34222 23072 67.2 Rural Towns
18179 Wells County, Indiana
27356 14087 50.6 Fringe
18035 Delaware County, Indiana
114196 26707 22.8 Metropolitan
18077 Jefferson County, Indiana
30490 14654 45.1 Micropolitan
18103 Miami County, Indiana
33696 16714 46.5 Micropolitan
18111 Newton County, Indiana
13799 14156 100 Fringe
18141 St. Joseph County, Indiana
266735 24090 9 Metropolitan
18155 Switzerland County, Indiana
10528 10452 100 Fringe
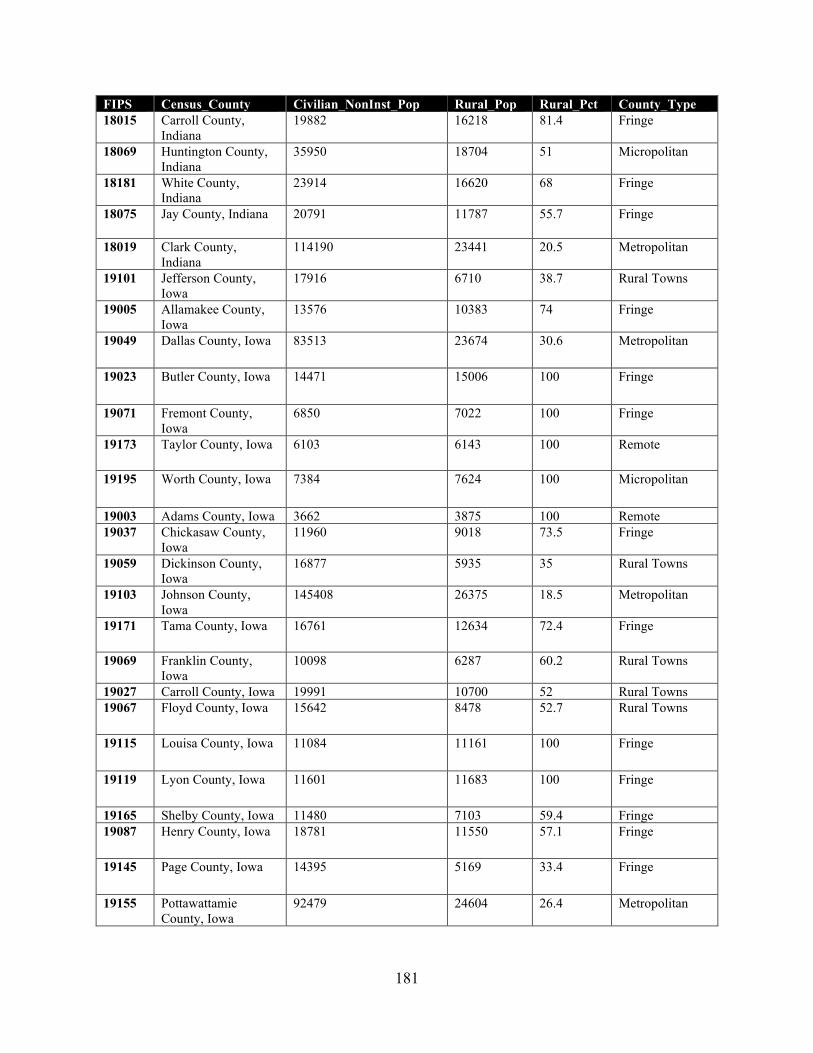
181
FIPS Census_County Civilian_NonInst_Pop Rural_Pop Rural_Pct County_Type 18015 Carroll County,
Indiana 19882 16218 81.4 Fringe
18069 Huntington County, Indiana
35950 18704 51 Micropolitan
18181 White County, Indiana
23914 16620 68 Fringe
18075 Jay County, Indiana 20791 11787 55.7 Fringe
18019 Clark County, Indiana
114190 23441 20.5 Metropolitan
19101 Jefferson County, Iowa
17916 6710 38.7 Rural Towns
19005 Allamakee County, Iowa
13576 10383 74 Fringe
19049 Dallas County, Iowa 83513 23674 30.6 Metropolitan
19023 Butler County, Iowa 14471 15006 100 Fringe
19071 Fremont County, Iowa
6850 7022 100 Fringe
19173 Taylor County, Iowa 6103 6143 100 Remote
19195 Worth County, Iowa 7384 7624 100 Micropolitan
19003 Adams County, Iowa 3662 3875 100 Remote 19037 Chickasaw County,
Iowa 11960 9018 73.5 Fringe
19059 Dickinson County, Iowa
16877 5935 35 Rural Towns
19103 Johnson County, Iowa
145408 26375 18.5 Metropolitan
19171 Tama County, Iowa 16761 12634 72.4 Fringe
19069 Franklin County, Iowa
10098 6287 60.2 Rural Towns
19027 Carroll County, Iowa 19991 10700 52 Rural Towns 19067 Floyd County, Iowa 15642 8478 52.7 Rural Towns
19115 Louisa County, Iowa 11084 11161 100 Fringe
19119 Lyon County, Iowa 11601 11683 100 Fringe
19165 Shelby County, Iowa 11480 7103 59.4 Fringe 19087 Henry County, Iowa 18781 11550 57.1 Fringe
19145 Page County, Iowa 14395 5169 33.4 Fringe
19155 Pottawattamie County, Iowa
92479 24604 26.4 Metropolitan
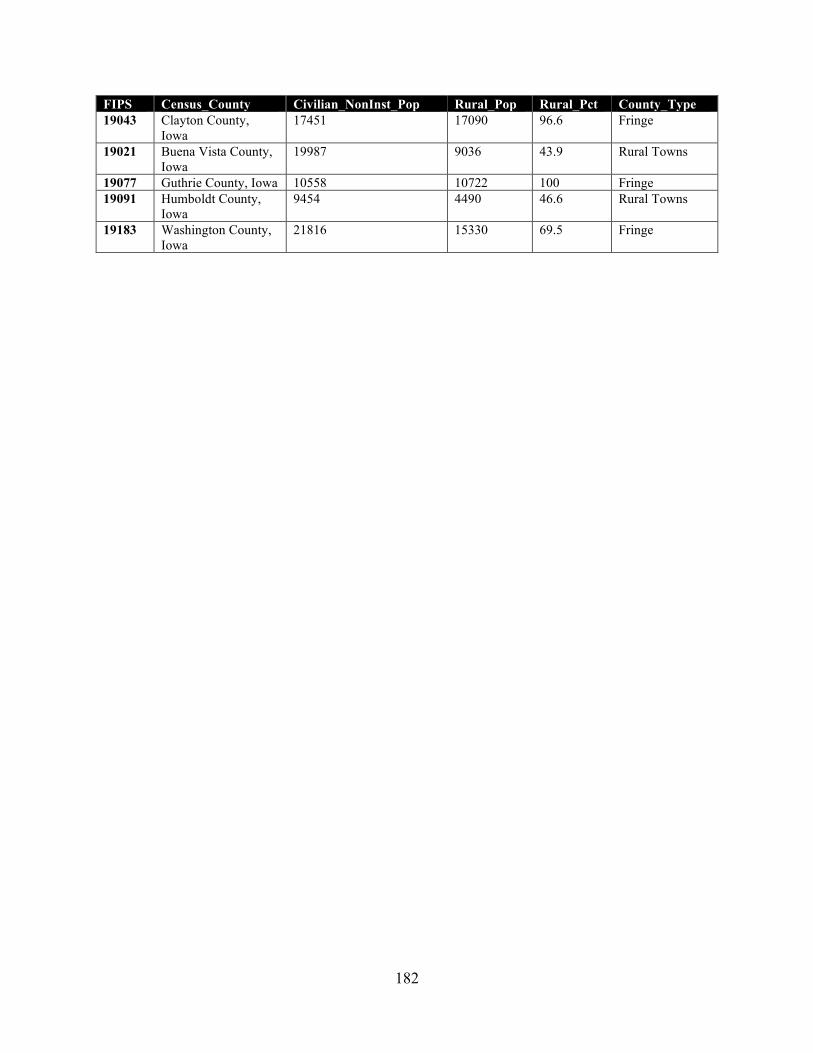
182
FIPS Census_County Civilian_NonInst_Pop Rural_Pop Rural_Pct County_Type 19043 Clayton County,
Iowa 17451 17090 96.6 Fringe
19021 Buena Vista County, Iowa
19987 9036 43.9 Rural Towns
19077 Guthrie County, Iowa 10558 10722 100 Fringe 19091 Humboldt County,
Iowa 9454 4490 46.6 Rural Towns
19183 Washington County, Iowa
21816 15330 69.5 Fringe
183
APPENDIX C. ADDITIONAL UNMET NEEDS EXPLORED
Several needs were explored but not selected for strategy development. Each of these needs and the reasons for not selecting them are described below.
• Access to jobs: Long travel times between households and employers can present a barrier to getting jobs, especially for those who lack access to a vehicle (Vogel, Fixing a ride, fixing a life on the Iron Range 2012). Though job access has been identified as a need in the research literature, an analysis of this need revealed minimal differences between rural county types and Metropolitan counties in terms of the number of jobs people are able to access using available transportation.
• Transit availability: Transit provides a mobility option for rural residents who lack access to a vehicle. Though the presence of individual rural transit systems is well documented, transit availability was not analyzed comprehensively because no high-quality, county-level dataset could be identified (Mattson 2017).
• Road closures: Road closures caused by extreme weather events and other causes can cut off access to entire rural communities (Combos 2020). Though this need is well-documented, it was not analyzed comprehensively because no high-quality, county-level dataset could be identified.
• Transportation affordability: Housing and transportation costs are typically the two largest household expenses (Center for Neighborhood Technology 2020). An analysis showed that transportation costs represent a greater share of household income in the rural county types than in Metropolitan counties. However, this need was not selected for strategy development because there are limited technology-enabled solutions.
• Intercity connectivity: An analysis of intercity transit hub locations (i.e., bus stations, airports) showed that certain rural county types have much lower connectivity than Metropolitan counties. However, this need was not selected for strategy development because there are limited technology-enabled solutions.
• Road quality: Poor road quality can negatively impact safety and the ability to accommodate freight vehicles. An analysis of road quality data revealed that rural county types have higher-quality roads than Metropolitan counties. For this reason, this need was excluded from strategy development.
• Heavy truck trips: Heavy truck trips associated with activities that take place in rural communities (e.g., farming, resource extraction) can negatively impact safety and road quality. Though this suggests an unmet need in rural areas, it was not analyzed comprehensively because no high-quality, county-level dataset could be identified.
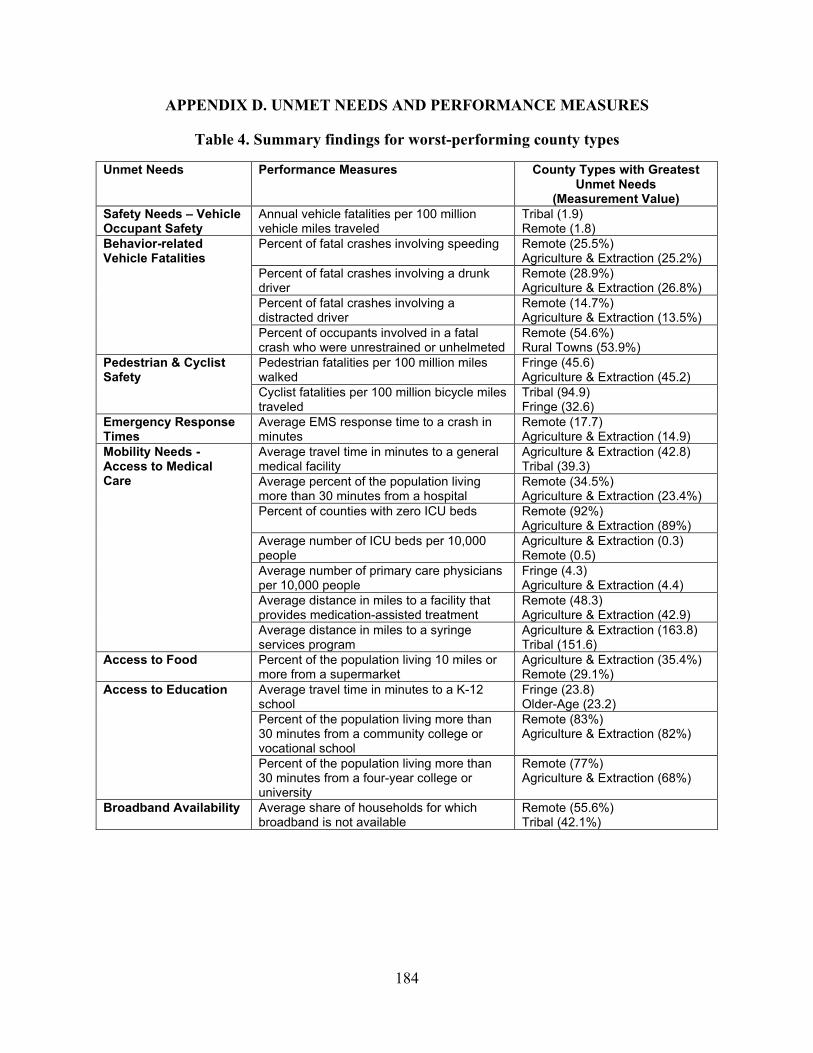
184
APPENDIX D. UNMET NEEDS AND PERFORMANCE MEASURES
Table 4. Summary findings for worst-performing county types
Unmet Needs Performance Measures County Types with Greatest Unmet Needs
(Measurement Value) Safety Needs – Vehicle Occupant Safety
Annual vehicle fatalities per 100 million vehicle miles traveled
Tribal (1.9) Remote (1.8)
Behavior-related Vehicle Fatalities
Percent of fatal crashes involving speeding Remote (25.5%) Agriculture & Extraction (25.2%)
Percent of fatal crashes involving a drunk driver
Remote (28.9%) Agriculture & Extraction (26.8%)
Percent of fatal crashes involving a distracted driver
Remote (14.7%) Agriculture & Extraction (13.5%)
Percent of occupants involved in a fatal crash who were unrestrained or unhelmeted
Remote (54.6%) Rural Towns (53.9%)
Pedestrian & Cyclist Safety
Pedestrian fatalities per 100 million miles walked
Fringe (45.6) Agriculture & Extraction (45.2)
Cyclist fatalities per 100 million bicycle miles traveled
Tribal (94.9) Fringe (32.6)
Emergency Response Times
Average EMS response time to a crash in minutes
Remote (17.7) Agriculture & Extraction (14.9)
Mobility Needs - Access to Medical Care
Average travel time in minutes to a general medical facility
Agriculture & Extraction (42.8) Tribal (39.3)
Average percent of the population living more than 30 minutes from a hospital
Remote (34.5%) Agriculture & Extraction (23.4%)
Percent of counties with zero ICU beds Remote (92%) Agriculture & Extraction (89%)
Average number of ICU beds per 10,000 people
Agriculture & Extraction (0.3) Remote (0.5)
Average number of primary care physicians per 10,000 people
Fringe (4.3) Agriculture & Extraction (4.4)
Average distance in miles to a facility that provides medication-assisted treatment
Remote (48.3) Agriculture & Extraction (42.9)
Average distance in miles to a syringe services program
Agriculture & Extraction (163.8) Tribal (151.6)
Access to Food Percent of the population living 10 miles or more from a supermarket
Agriculture & Extraction (35.4%) Remote (29.1%)
Access to Education Average travel time in minutes to a K-12 school
Fringe (23.8) Older-Age (23.2)
Percent of the population living more than 30 minutes from a community college or vocational school
Remote (83%) Agriculture & Extraction (82%)
Percent of the population living more than 30 minutes from a four-year college or university
Remote (77%) Agriculture & Extraction (68%)
Broadband Availability Average share of households for which broadband is not available
Remote (55.6%) Tribal (42.1%)
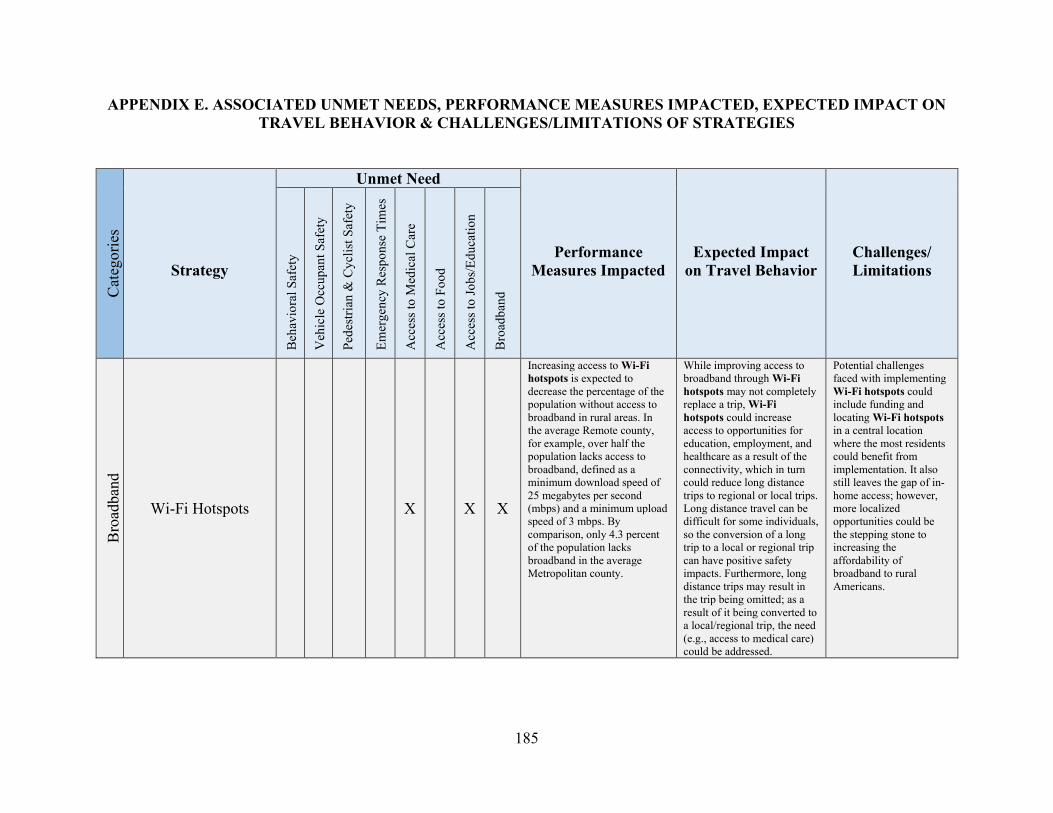
185
APPENDIX E. ASSOCIATED UNMET NEEDS, PERFORMANCE MEASURES IMPACTED, EXPECTED IMPACT ON TRAVEL BEHAVIOR & CHALLENGES/LIMITATIONS OF STRATEGIES
Cat
egor
ies
Strategy
Unmet Need
Performance Measures Impacted
Expected Impact on Travel Behavior
Challenges/ Limitations
Beh
avio
ral S
afet
y
Veh
icle
Occ
upan
t Saf
ety
Pede
stria
n &
Cyc
list S
afet
y
Emer
genc
y R
espo
nse
Tim
es
Acc
ess t
o M
edic
al C
are
Acc
ess t
o Fo
od
Acc
ess t
o Jo
bs/E
duca
tion
Bro
adba
nd
Bro
adba
nd
Wi-Fi Hotspots X X X
Increasing access to Wi-Fi hotspots is expected to decrease the percentage of the population without access to broadband in rural areas. In the average Remote county, for example, over half the population lacks access to broadband, defined as a minimum download speed of 25 megabytes per second (mbps) and a minimum upload speed of 3 mbps. By comparison, only 4.3 percent of the population lacks broadband in the average Metropolitan county.
While improving access to broadband through Wi-Fi hotspots may not completely replace a trip, Wi-Fi hotspots could increase access to opportunities for education, employment, and healthcare as a result of the connectivity, which in turn could reduce long distance trips to regional or local trips. Long distance travel can be difficult for some individuals, so the conversion of a long trip to a local or regional trip can have positive safety impacts. Furthermore, long distance trips may result in the trip being omitted; as a result of it being converted to a local/regional trip, the need (e.g., access to medical care) could be addressed.
Potential challenges faced with implementing Wi-Fi hotspots could include funding and locating Wi-Fi hotspots in a central location where the most residents could benefit from implementation. It also still leaves the gap of in-home access; however, more localized opportunities could be the stepping stone to increasing the affordability of broadband to rural Americans.
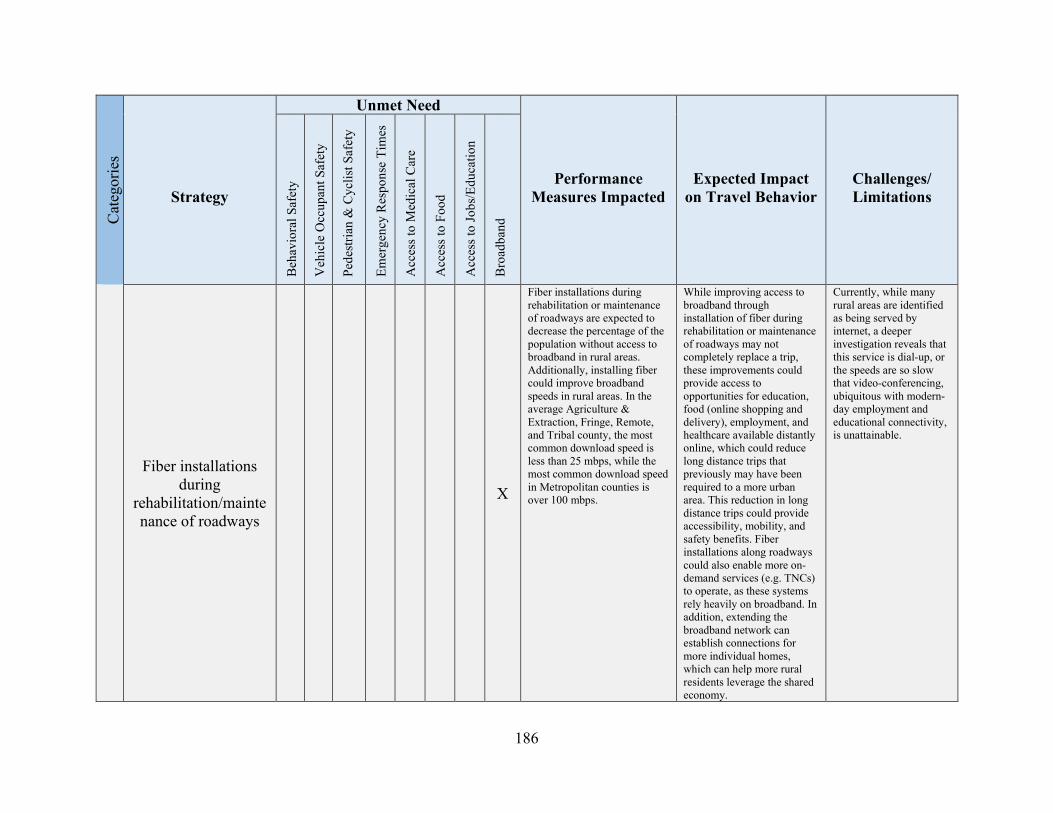
186
Cat
egor
ies
Strategy
Unmet Need
Performance Measures Impacted
Expected Impact on Travel Behavior
Challenges/ Limitations
Beh
avio
ral S
afet
y
Veh
icle
Occ
upan
t Saf
ety
Pede
stria
n &
Cyc
list S
afet
y
Emer
genc
y R
espo
nse
Tim
es
Acc
ess t
o M
edic
al C
are
Acc
ess t
o Fo
od
Acc
ess t
o Jo
bs/E
duca
tion
Bro
adba
nd
Fiber installations during
rehabilitation/maintenance of roadways
X
Fiber installations during rehabilitation or maintenance of roadways are expected to decrease the percentage of the population without access to broadband in rural areas. Additionally, installing fiber could improve broadband speeds in rural areas. In the average Agriculture & Extraction, Fringe, Remote, and Tribal county, the most common download speed is less than 25 mbps, while the most common download speed in Metropolitan counties is over 100 mbps.
While improving access to broadband through installation of fiber during rehabilitation or maintenance of roadways may not completely replace a trip, these improvements could provide access to opportunities for education, food (online shopping and delivery), employment, and healthcare available distantly online, which could reduce long distance trips that previously may have been required to a more urban area. This reduction in long distance trips could provide accessibility, mobility, and safety benefits. Fiber installations along roadways could also enable more on-demand services (e.g. TNCs) to operate, as these systems rely heavily on broadband. In addition, extending the broadband network can establish connections for more individual homes, which can help more rural residents leverage the shared economy.
Currently, while many rural areas are identified as being served by internet, a deeper investigation reveals that this service is dial-up, or the speeds are so slow that video-conferencing, ubiquitous with modern-day employment and educational connectivity, is unattainable.
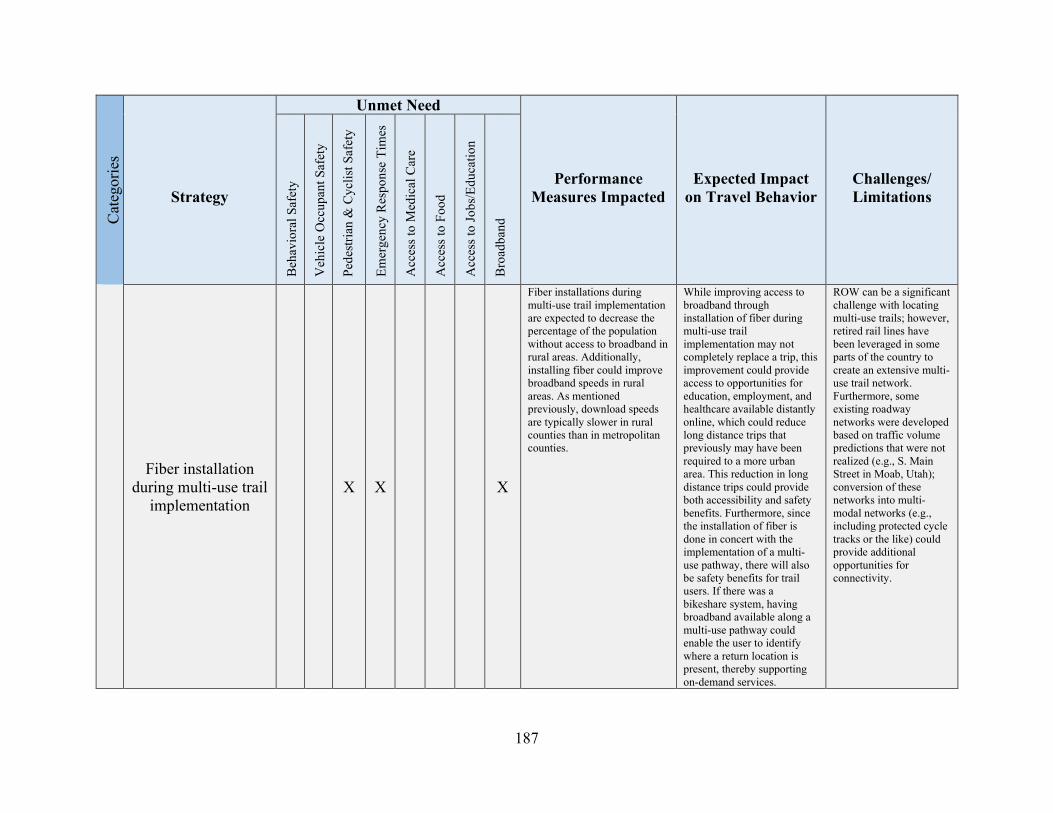
187
Cat
egor
ies
Strategy
Unmet Need
Performance Measures Impacted
Expected Impact on Travel Behavior
Challenges/ Limitations
Beh
avio
ral S
afet
y
Veh
icle
Occ
upan
t Saf
ety
Pede
stria
n &
Cyc
list S
afet
y
Emer
genc
y R
espo
nse
Tim
es
Acc
ess t
o M
edic
al C
are
Acc
ess t
o Fo
od
Acc
ess t
o Jo
bs/E
duca
tion
Bro
adba
nd
Fiber installation during multi-use trail
implementation X X X
Fiber installations during multi-use trail implementation are expected to decrease the percentage of the population without access to broadband in rural areas. Additionally, installing fiber could improve broadband speeds in rural areas. As mentioned previously, download speeds are typically slower in rural counties than in metropolitan counties.
While improving access to broadband through installation of fiber during multi-use trail implementation may not completely replace a trip, this improvement could provide access to opportunities for education, employment, and healthcare available distantly online, which could reduce long distance trips that previously may have been required to a more urban area. This reduction in long distance trips could provide both accessibility and safety benefits. Furthermore, since the installation of fiber is done in concert with the implementation of a multi-use pathway, there will also be safety benefits for trail users. If there was a bikeshare system, having broadband available along a multi-use pathway could enable the user to identify where a return location is present, thereby supporting on-demand services.
ROW can be a significant challenge with locating multi-use trails; however, retired rail lines have been leveraged in some parts of the country to create an extensive multi-use trail network. Furthermore, some existing roadway networks were developed based on traffic volume predictions that were not realized (e.g., S. Main Street in Moab, Utah); conversion of these networks into multi-modal networks (e.g., including protected cycle tracks or the like) could provide additional opportunities for connectivity.
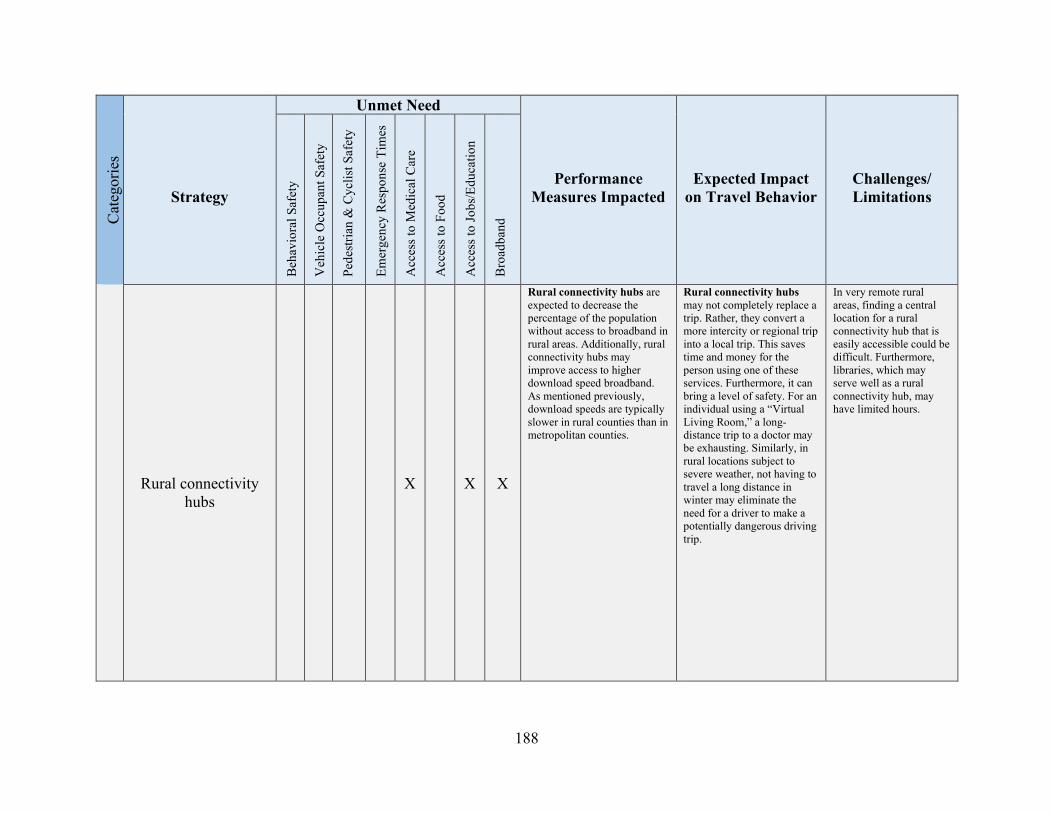
188
Cat
egor
ies
Strategy
Unmet Need
Performance Measures Impacted
Expected Impact on Travel Behavior
Challenges/ Limitations
Beh
avio
ral S
afet
y
Veh
icle
Occ
upan
t Saf
ety
Pede
stria
n &
Cyc
list S
afet
y
Emer
genc
y R
espo
nse
Tim
es
Acc
ess t
o M
edic
al C
are
Acc
ess t
o Fo
od
Acc
ess t
o Jo
bs/E
duca
tion
Bro
adba
nd
Rural connectivity
hubs X X X
Rural connectivity hubs are expected to decrease the percentage of the population without access to broadband in rural areas. Additionally, rural connectivity hubs may improve access to higher download speed broadband. As mentioned previously, download speeds are typically slower in rural counties than in metropolitan counties.
Rural connectivity hubs may not completely replace a trip. Rather, they convert a more intercity or regional trip into a local trip. This saves time and money for the person using one of these services. Furthermore, it can bring a level of safety. For an individual using a “Virtual Living Room,” a long-distance trip to a doctor may be exhausting. Similarly, in rural locations subject to severe weather, not having to travel a long distance in winter may eliminate the need for a driver to make a potentially dangerous driving trip.
In very remote rural areas, finding a central location for a rural connectivity hub that is easily accessible could be difficult. Furthermore, libraries, which may serve well as a rural connectivity hub, may have limited hours.
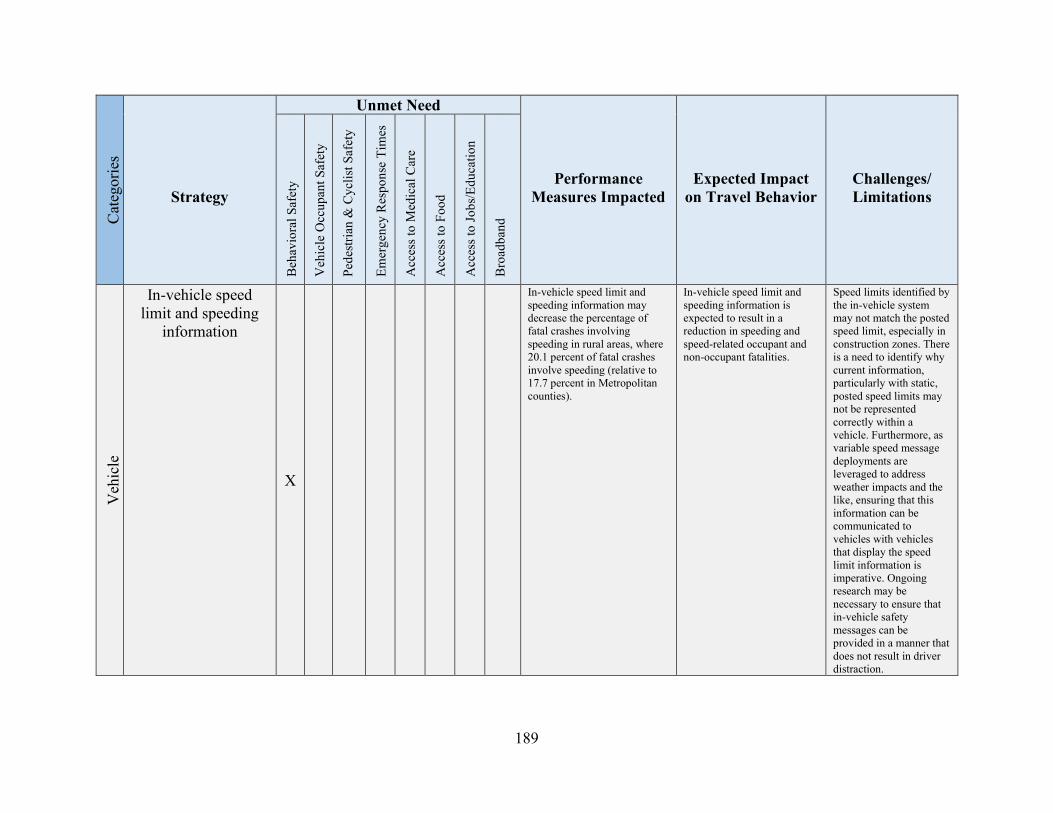
189
Cat
egor
ies
Strategy
Unmet Need
Performance Measures Impacted
Expected Impact on Travel Behavior
Challenges/ Limitations
Beh
avio
ral S
afet
y
Veh
icle
Occ
upan
t Saf
ety
Pede
stria
n &
Cyc
list S
afet
y
Emer
genc
y R
espo
nse
Tim
es
Acc
ess t
o M
edic
al C
are
Acc
ess t
o Fo
od
Acc
ess t
o Jo
bs/E
duca
tion
Bro
adba
nd
Veh
icle
In-vehicle speed limit and speeding
information
X
In-vehicle speed limit and speeding information may decrease the percentage of fatal crashes involving speeding in rural areas, where 20.1 percent of fatal crashes involve speeding (relative to 17.7 percent in Metropolitan counties).
In-vehicle speed limit and speeding information is expected to result in a reduction in speeding and speed-related occupant and non-occupant fatalities.
Speed limits identified by the in-vehicle system may not match the posted speed limit, especially in construction zones. There is a need to identify why current information, particularly with static, posted speed limits may not be represented correctly within a vehicle. Furthermore, as variable speed message deployments are leveraged to address weather impacts and the like, ensuring that this information can be communicated to vehicles with vehicles that display the speed limit information is imperative. Ongoing research may be necessary to ensure that in-vehicle safety messages can be provided in a manner that does not result in driver distraction.
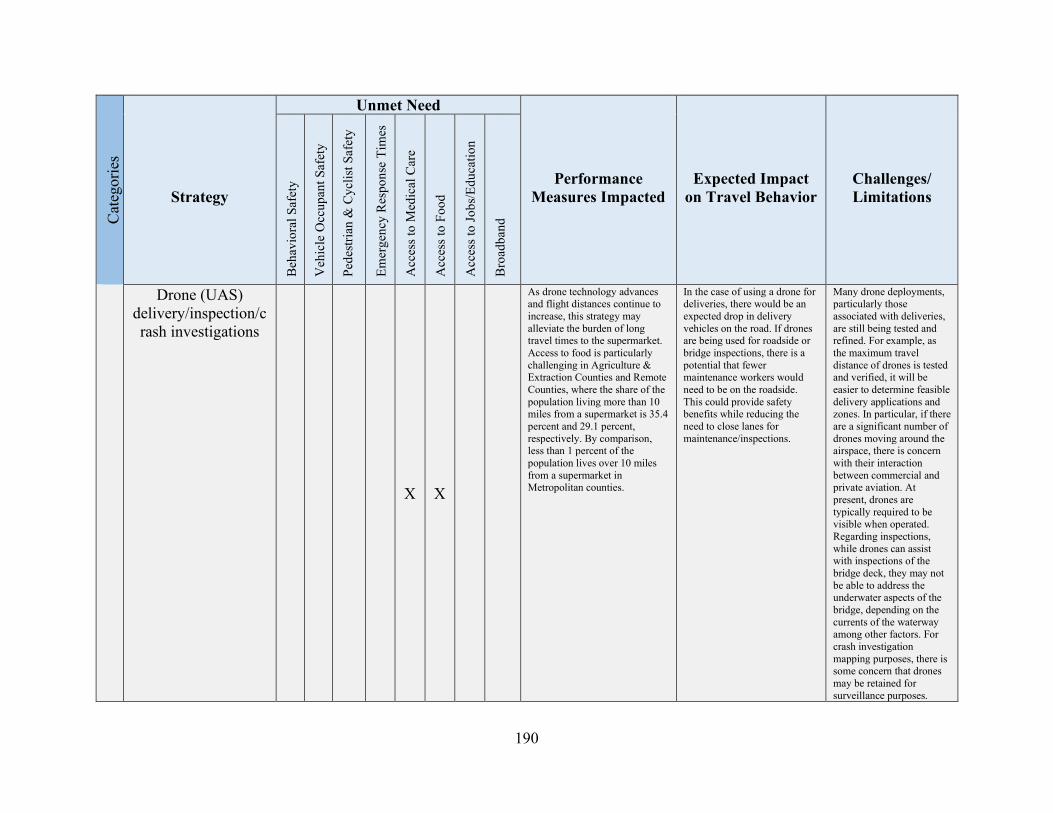
190
Cat
egor
ies
Strategy
Unmet Need
Performance Measures Impacted
Expected Impact on Travel Behavior
Challenges/ Limitations
Beh
avio
ral S
afet
y
Veh
icle
Occ
upan
t Saf
ety
Pede
stria
n &
Cyc
list S
afet
y
Emer
genc
y R
espo
nse
Tim
es
Acc
ess t
o M
edic
al C
are
Acc
ess t
o Fo
od
Acc
ess t
o Jo
bs/E
duca
tion
Bro
adba
nd
Drone (UAS) delivery/inspection/crash investigations
X X
As drone technology advances and flight distances continue to increase, this strategy may alleviate the burden of long travel times to the supermarket. Access to food is particularly challenging in Agriculture & Extraction Counties and Remote Counties, where the share of the population living more than 10 miles from a supermarket is 35.4 percent and 29.1 percent, respectively. By comparison, less than 1 percent of the population lives over 10 miles from a supermarket in Metropolitan counties.
In the case of using a drone for deliveries, there would be an expected drop in delivery vehicles on the road. If drones are being used for roadside or bridge inspections, there is a potential that fewer maintenance workers would need to be on the roadside. This could provide safety benefits while reducing the need to close lanes for maintenance/inspections.
Many drone deployments, particularly those associated with deliveries, are still being tested and refined. For example, as the maximum travel distance of drones is tested and verified, it will be easier to determine feasible delivery applications and zones. In particular, if there are a significant number of drones moving around the airspace, there is concern with their interaction between commercial and private aviation. At present, drones are typically required to be visible when operated. Regarding inspections, while drones can assist with inspections of the bridge deck, they may not be able to address the underwater aspects of the bridge, depending on the currents of the waterway among other factors. For crash investigation mapping purposes, there is some concern that drones may be retained for surveillance purposes.
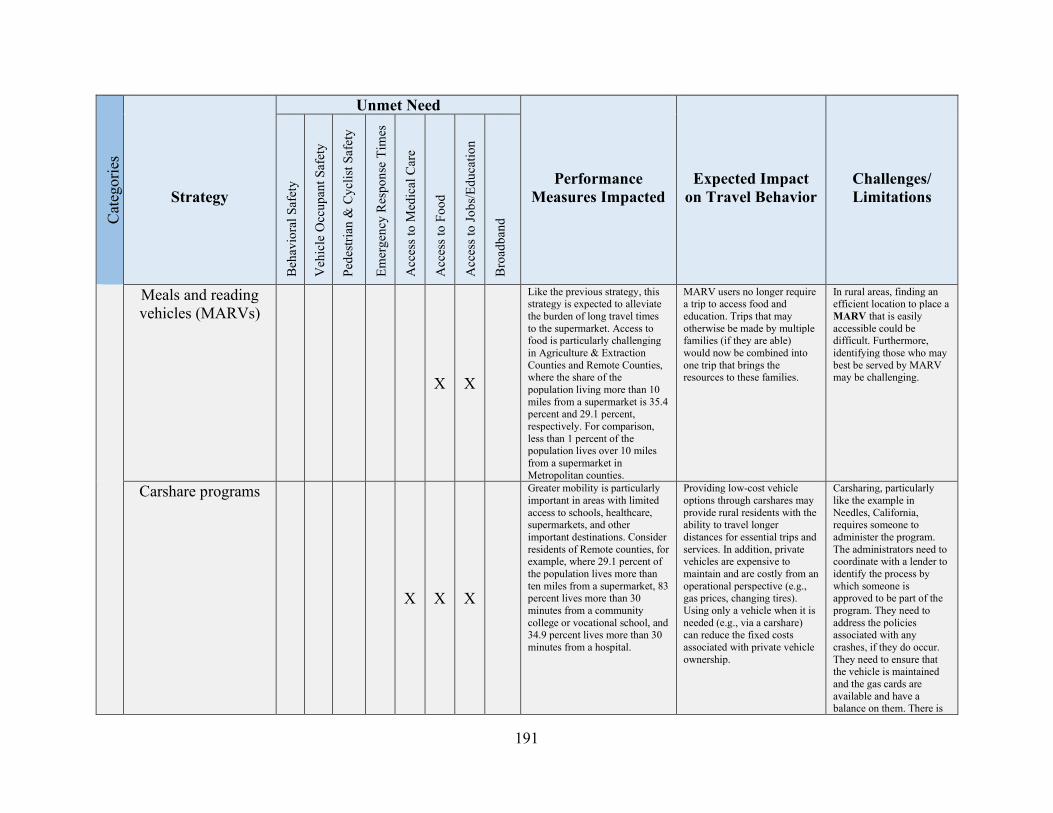
191
Cat
egor
ies
Strategy
Unmet Need
Performance Measures Impacted
Expected Impact on Travel Behavior
Challenges/ Limitations
Beh
avio
ral S
afet
y
Veh
icle
Occ
upan
t Saf
ety
Pede
stria
n &
Cyc
list S
afet
y
Emer
genc
y R
espo
nse
Tim
es
Acc
ess t
o M
edic
al C
are
Acc
ess t
o Fo
od
Acc
ess t
o Jo
bs/E
duca
tion
Bro
adba
nd
Meals and reading vehicles (MARVs)
X X
Like the previous strategy, this strategy is expected to alleviate the burden of long travel times to the supermarket. Access to food is particularly challenging in Agriculture & Extraction Counties and Remote Counties, where the share of the population living more than 10 miles from a supermarket is 35.4 percent and 29.1 percent, respectively. For comparison, less than 1 percent of the population lives over 10 miles from a supermarket in Metropolitan counties.
MARV users no longer require a trip to access food and education. Trips that may otherwise be made by multiple families (if they are able) would now be combined into one trip that brings the resources to these families.
In rural areas, finding an efficient location to place a MARV that is easily accessible could be difficult. Furthermore, identifying those who may best be served by MARV may be challenging.
Carshare programs
X X X
Greater mobility is particularly important in areas with limited access to schools, healthcare, supermarkets, and other important destinations. Consider residents of Remote counties, for example, where 29.1 percent of the population lives more than ten miles from a supermarket, 83 percent lives more than 30 minutes from a community college or vocational school, and 34.9 percent lives more than 30 minutes from a hospital.
Providing low-cost vehicle options through carshares may provide rural residents with the ability to travel longer distances for essential trips and services. In addition, private vehicles are expensive to maintain and are costly from an operational perspective (e.g., gas prices, changing tires). Using only a vehicle when it is needed (e.g., via a carshare) can reduce the fixed costs associated with private vehicle ownership.
Carsharing, particularly like the example in Needles, California, requires someone to administer the program. The administrators need to coordinate with a lender to identify the process by which someone is approved to be part of the program. They need to address the policies associated with any crashes, if they do occur. They need to ensure that the vehicle is maintained and the gas cards are available and have a balance on them. There is
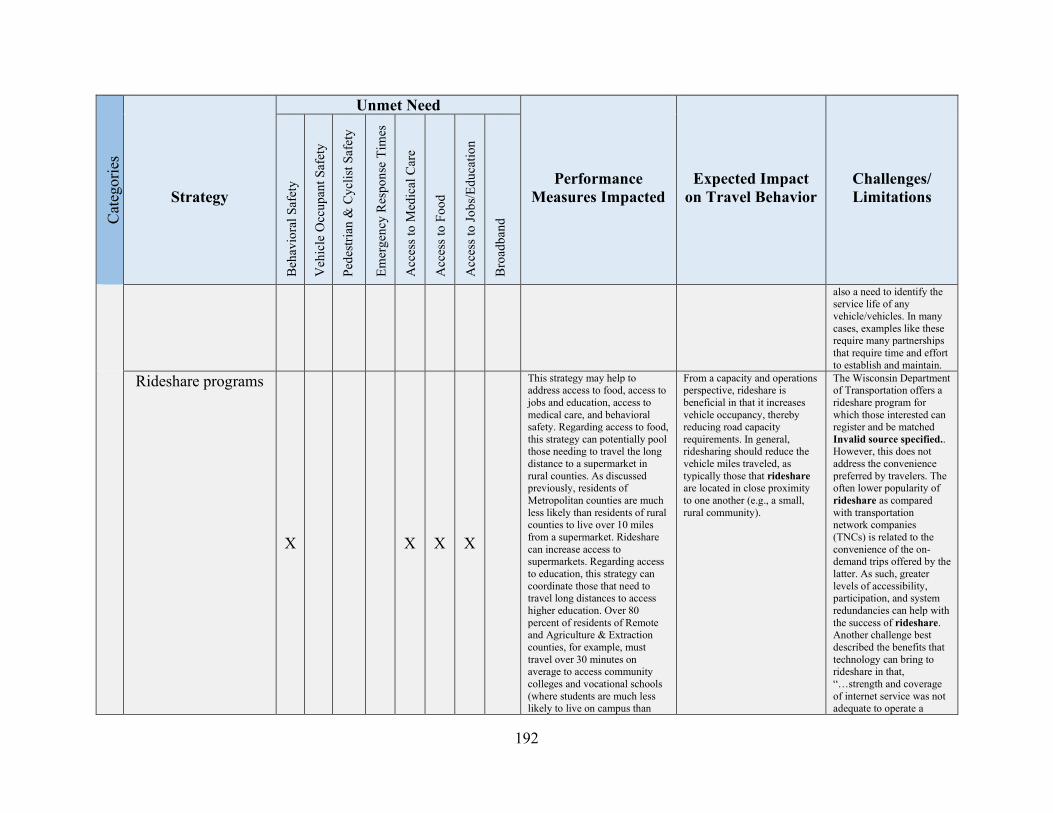
192
Cat
egor
ies
Strategy
Unmet Need
Performance Measures Impacted
Expected Impact on Travel Behavior
Challenges/ Limitations
Beh
avio
ral S
afet
y
Veh
icle
Occ
upan
t Saf
ety
Pede
stria
n &
Cyc
list S
afet
y
Emer
genc
y R
espo
nse
Tim
es
Acc
ess t
o M
edic
al C
are
Acc
ess t
o Fo
od
Acc
ess t
o Jo
bs/E
duca
tion
Bro
adba
nd
also a need to identify the service life of any vehicle/vehicles. In many cases, examples like these require many partnerships that require time and effort to establish and maintain.
Rideshare programs
X X X X
This strategy may help to address access to food, access to jobs and education, access to medical care, and behavioral safety. Regarding access to food, this strategy can potentially pool those needing to travel the long distance to a supermarket in rural counties. As discussed previously, residents of Metropolitan counties are much less likely than residents of rural counties to live over 10 miles from a supermarket. Rideshare can increase access to supermarkets. Regarding access to education, this strategy can coordinate those that need to travel long distances to access higher education. Over 80 percent of residents of Remote and Agriculture & Extraction counties, for example, must travel over 30 minutes on average to access community colleges and vocational schools (where students are much less likely to live on campus than
From a capacity and operations perspective, rideshare is beneficial in that it increases vehicle occupancy, thereby reducing road capacity requirements. In general, ridesharing should reduce the vehicle miles traveled, as typically those that rideshare are located in close proximity to one another (e.g., a small, rural community).
The Wisconsin Department of Transportation offers a rideshare program for which those interested can register and be matched Invalid source specified.. However, this does not address the convenience preferred by travelers. The often lower popularity of rideshare as compared with transportation network companies (TNCs) is related to the convenience of the on-demand trips offered by the latter. As such, greater levels of accessibility, participation, and system redundancies can help with the success of rideshare. Another challenge best described the benefits that technology can bring to rideshare in that, “…strength and coverage of internet service was not adequate to operate a
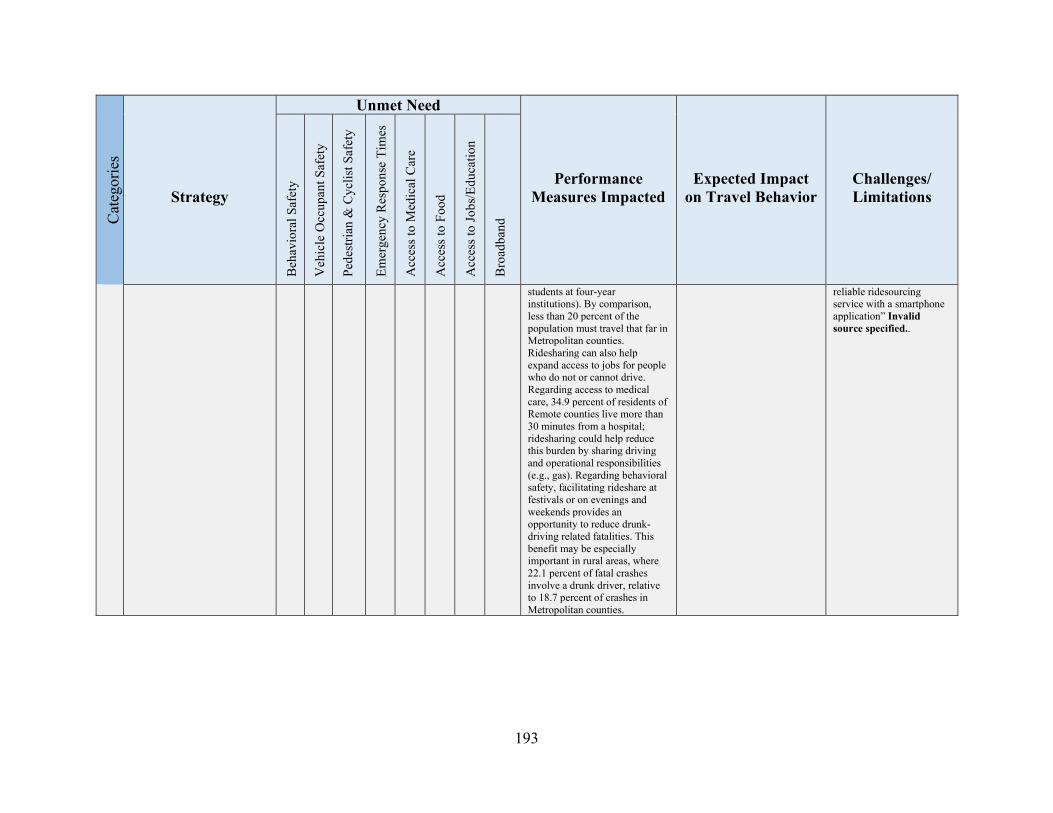
193
Cat
egor
ies
Strategy
Unmet Need
Performance Measures Impacted
Expected Impact on Travel Behavior
Challenges/ Limitations
Beh
avio
ral S
afet
y
Veh
icle
Occ
upan
t Saf
ety
Pede
stria
n &
Cyc
list S
afet
y
Emer
genc
y R
espo
nse
Tim
es
Acc
ess t
o M
edic
al C
are
Acc
ess t
o Fo
od
Acc
ess t
o Jo
bs/E
duca
tion
Bro
adba
nd
students at four-year institutions). By comparison, less than 20 percent of the population must travel that far in Metropolitan counties. Ridesharing can also help expand access to jobs for people who do not or cannot drive. Regarding access to medical care, 34.9 percent of residents of Remote counties live more than 30 minutes from a hospital; ridesharing could help reduce this burden by sharing driving and operational responsibilities (e.g., gas). Regarding behavioral safety, facilitating rideshare at festivals or on evenings and weekends provides an opportunity to reduce drunk-driving related fatalities. This benefit may be especially important in rural areas, where 22.1 percent of fatal crashes involve a drunk driver, relative to 18.7 percent of crashes in Metropolitan counties.
reliable ridesourcing service with a smartphone application” Invalid source specified..
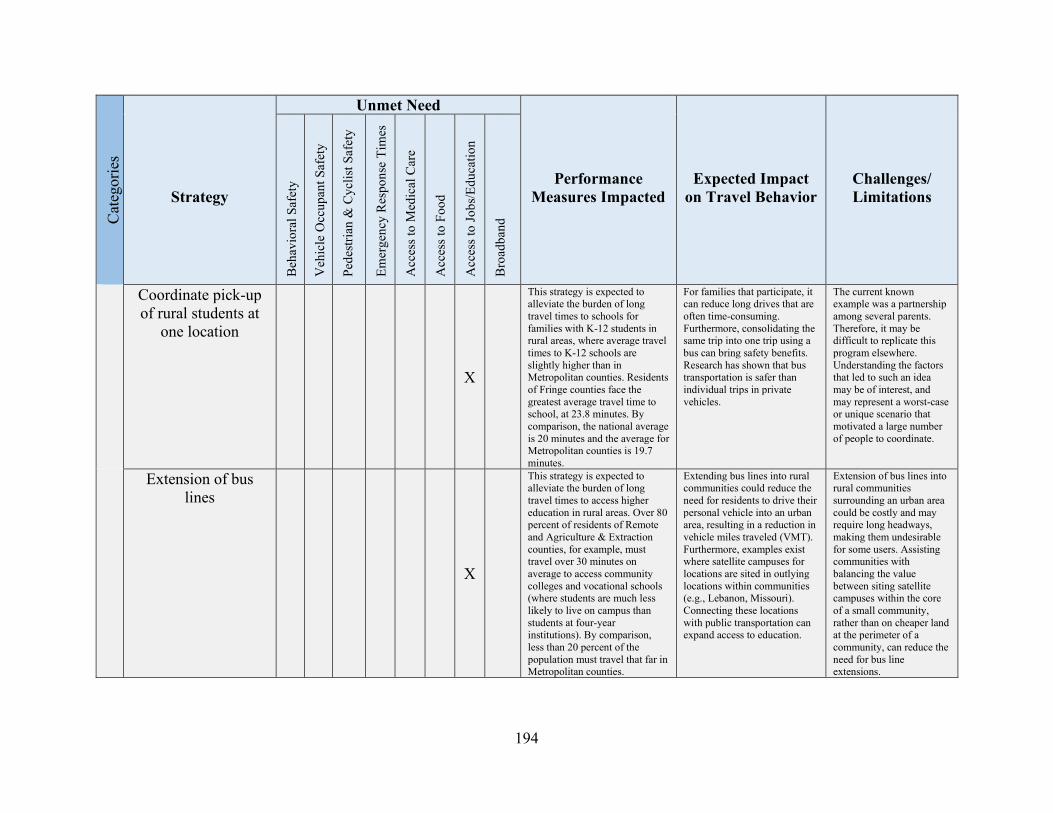
194
Cat
egor
ies
Strategy
Unmet Need
Performance Measures Impacted
Expected Impact on Travel Behavior
Challenges/ Limitations
Beh
avio
ral S
afet
y
Veh
icle
Occ
upan
t Saf
ety
Pede
stria
n &
Cyc
list S
afet
y
Emer
genc
y R
espo
nse
Tim
es
Acc
ess t
o M
edic
al C
are
Acc
ess t
o Fo
od
Acc
ess t
o Jo
bs/E
duca
tion
Bro
adba
nd
Coordinate pick-up of rural students at
one location
X
This strategy is expected to alleviate the burden of long travel times to schools for families with K-12 students in rural areas, where average travel times to K-12 schools are slightly higher than in Metropolitan counties. Residents of Fringe counties face the greatest average travel time to school, at 23.8 minutes. By comparison, the national average is 20 minutes and the average for Metropolitan counties is 19.7 minutes.
For families that participate, it can reduce long drives that are often time-consuming. Furthermore, consolidating the same trip into one trip using a bus can bring safety benefits. Research has shown that bus transportation is safer than individual trips in private vehicles.
The current known example was a partnership among several parents. Therefore, it may be difficult to replicate this program elsewhere. Understanding the factors that led to such an idea may be of interest, and may represent a worst-case or unique scenario that motivated a large number of people to coordinate.
Extension of bus lines
X
This strategy is expected to alleviate the burden of long travel times to access higher education in rural areas. Over 80 percent of residents of Remote and Agriculture & Extraction counties, for example, must travel over 30 minutes on average to access community colleges and vocational schools (where students are much less likely to live on campus than students at four-year institutions). By comparison, less than 20 percent of the population must travel that far in Metropolitan counties.
Extending bus lines into rural communities could reduce the need for residents to drive their personal vehicle into an urban area, resulting in a reduction in vehicle miles traveled (VMT). Furthermore, examples exist where satellite campuses for locations are sited in outlying locations within communities (e.g., Lebanon, Missouri). Connecting these locations with public transportation can expand access to education.
Extension of bus lines into rural communities surrounding an urban area could be costly and may require long headways, making them undesirable for some users. Assisting communities with balancing the value between siting satellite campuses within the core of a small community, rather than on cheaper land at the perimeter of a community, can reduce the need for bus line extensions.
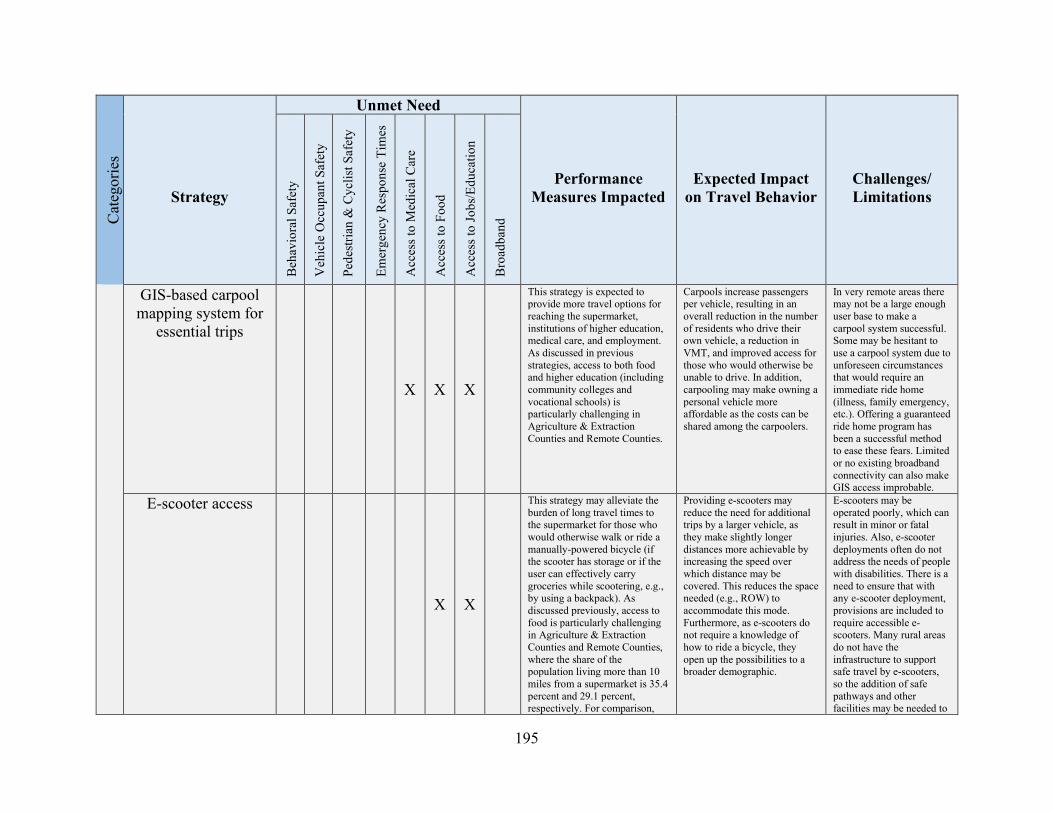
195
Cat
egor
ies
Strategy
Unmet Need
Performance Measures Impacted
Expected Impact on Travel Behavior
Challenges/ Limitations
Beh
avio
ral S
afet
y
Veh
icle
Occ
upan
t Saf
ety
Pede
stria
n &
Cyc
list S
afet
y
Emer
genc
y R
espo
nse
Tim
es
Acc
ess t
o M
edic
al C
are
Acc
ess t
o Fo
od
Acc
ess t
o Jo
bs/E
duca
tion
Bro
adba
nd
GIS-based carpool mapping system for
essential trips
X X X
This strategy is expected to provide more travel options for reaching the supermarket, institutions of higher education, medical care, and employment. As discussed in previous strategies, access to both food and higher education (including community colleges and vocational schools) is particularly challenging in Agriculture & Extraction Counties and Remote Counties.
Carpools increase passengers per vehicle, resulting in an overall reduction in the number of residents who drive their own vehicle, a reduction in VMT, and improved access for those who would otherwise be unable to drive. In addition, carpooling may make owning a personal vehicle more affordable as the costs can be shared among the carpoolers.
In very remote areas there may not be a large enough user base to make a carpool system successful. Some may be hesitant to use a carpool system due to unforeseen circumstances that would require an immediate ride home (illness, family emergency, etc.). Offering a guaranteed ride home program has been a successful method to ease these fears. Limited or no existing broadband connectivity can also make GIS access improbable.
E-scooter access
X X
This strategy may alleviate the burden of long travel times to the supermarket for those who would otherwise walk or ride a manually-powered bicycle (if the scooter has storage or if the user can effectively carry groceries while scootering, e.g., by using a backpack). As discussed previously, access to food is particularly challenging in Agriculture & Extraction Counties and Remote Counties, where the share of the population living more than 10 miles from a supermarket is 35.4 percent and 29.1 percent, respectively. For comparison,
Providing e-scooters may reduce the need for additional trips by a larger vehicle, as they make slightly longer distances more achievable by increasing the speed over which distance may be covered. This reduces the space needed (e.g., ROW) to accommodate this mode. Furthermore, as e-scooters do not require a knowledge of how to ride a bicycle, they open up the possibilities to a broader demographic.
E-scooters may be operated poorly, which can result in minor or fatal injuries. Also, e-scooter deployments often do not address the needs of people with disabilities. There is a need to ensure that with any e-scooter deployment, provisions are included to require accessible e-scooters. Many rural areas do not have the infrastructure to support safe travel by e-scooters, so the addition of safe pathways and other facilities may be needed to
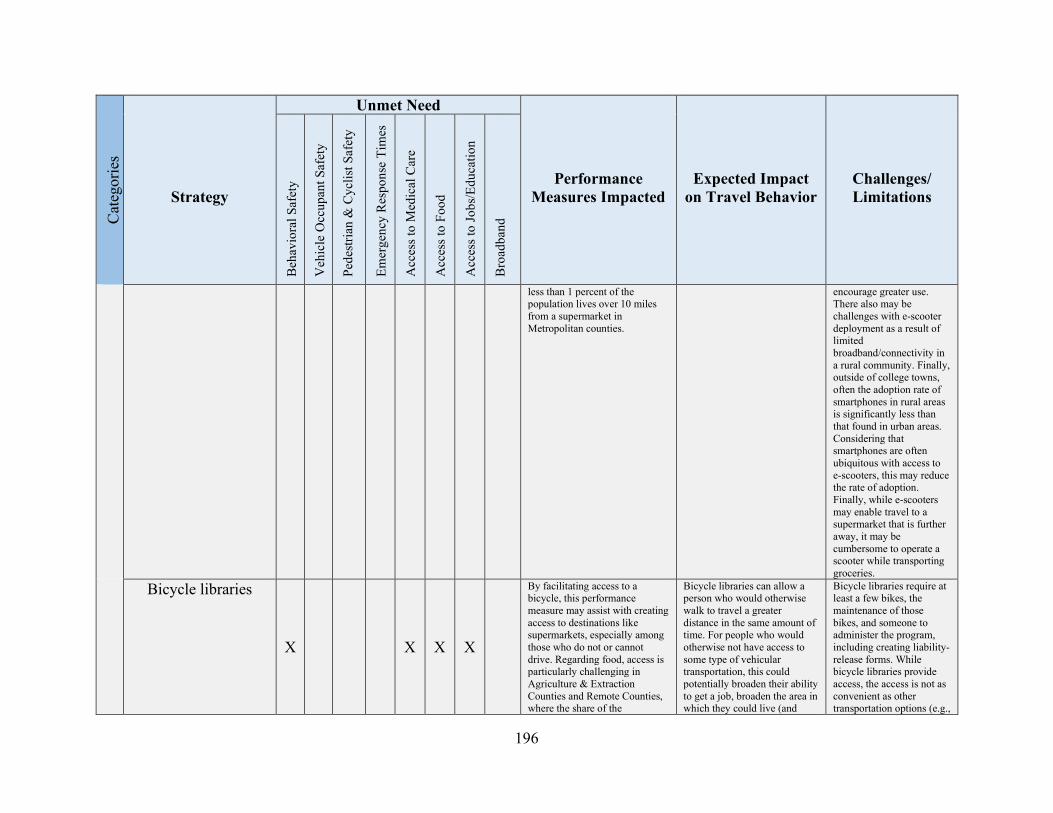
196
Cat
egor
ies
Strategy
Unmet Need
Performance Measures Impacted
Expected Impact on Travel Behavior
Challenges/ Limitations
Beh
avio
ral S
afet
y
Veh
icle
Occ
upan
t Saf
ety
Pede
stria
n &
Cyc
list S
afet
y
Emer
genc
y R
espo
nse
Tim
es
Acc
ess t
o M
edic
al C
are
Acc
ess t
o Fo
od
Acc
ess t
o Jo
bs/E
duca
tion
Bro
adba
nd
less than 1 percent of the population lives over 10 miles from a supermarket in Metropolitan counties.
encourage greater use. There also may be challenges with e-scooter deployment as a result of limited broadband/connectivity in a rural community. Finally, outside of college towns, often the adoption rate of smartphones in rural areas is significantly less than that found in urban areas. Considering that smartphones are often ubiquitous with access to e-scooters, this may reduce the rate of adoption. Finally, while e-scooters may enable travel to a supermarket that is further away, it may be cumbersome to operate a scooter while transporting groceries.
Bicycle libraries
X X X X
By facilitating access to a bicycle, this performance measure may assist with creating access to destinations like supermarkets, especially among those who do not or cannot drive. Regarding food, access is particularly challenging in Agriculture & Extraction Counties and Remote Counties, where the share of the
Bicycle libraries can allow a person who would otherwise walk to travel a greater distance in the same amount of time. For people who would otherwise not have access to some type of vehicular transportation, this could potentially broaden their ability to get a job, broaden the area in which they could live (and
Bicycle libraries require at least a few bikes, the maintenance of those bikes, and someone to administer the program, including creating liability-release forms. While bicycle libraries provide access, the access is not as convenient as other transportation options (e.g.,
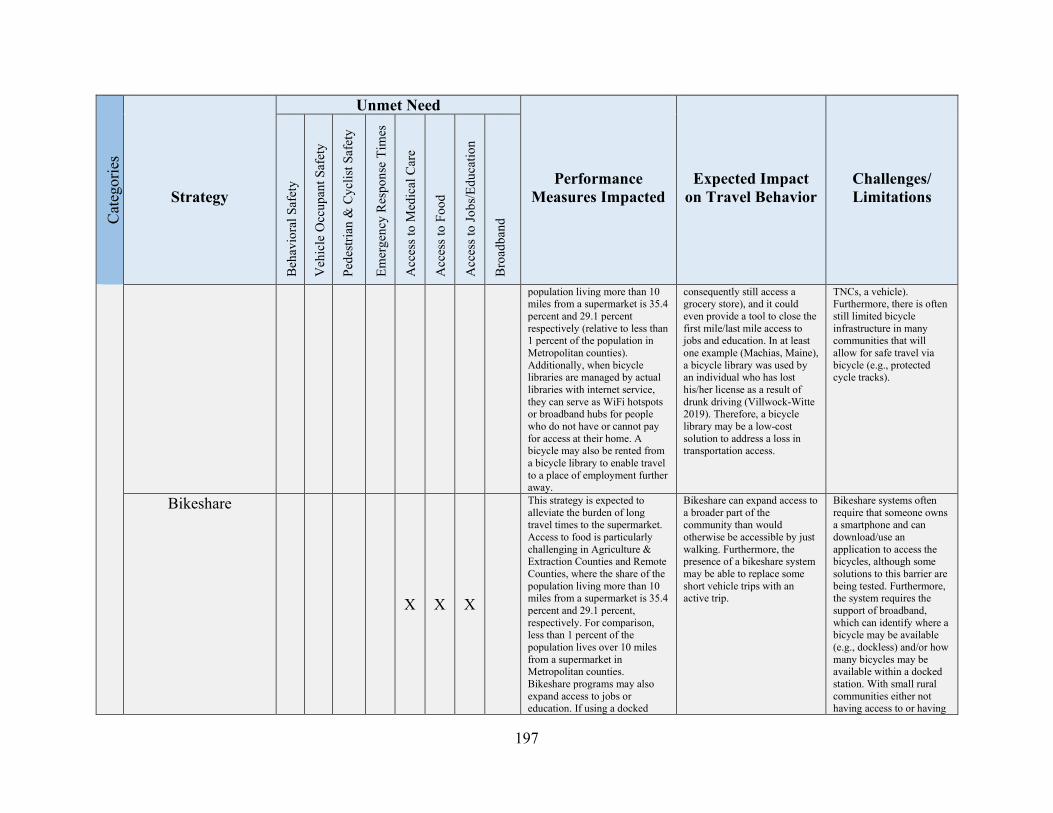
197
Cat
egor
ies
Strategy
Unmet Need
Performance Measures Impacted
Expected Impact on Travel Behavior
Challenges/ Limitations
Beh
avio
ral S
afet
y
Veh
icle
Occ
upan
t Saf
ety
Pede
stria
n &
Cyc
list S
afet
y
Emer
genc
y R
espo
nse
Tim
es
Acc
ess t
o M
edic
al C
are
Acc
ess t
o Fo
od
Acc
ess t
o Jo
bs/E
duca
tion
Bro
adba
nd
population living more than 10 miles from a supermarket is 35.4 percent and 29.1 percent respectively (relative to less than 1 percent of the population in Metropolitan counties). Additionally, when bicycle libraries are managed by actual libraries with internet service, they can serve as WiFi hotspots or broadband hubs for people who do not have or cannot pay for access at their home. A bicycle may also be rented from a bicycle library to enable travel to a place of employment further away.
consequently still access a grocery store), and it could even provide a tool to close the first mile/last mile access to jobs and education. In at least one example (Machias, Maine), a bicycle library was used by an individual who has lost his/her license as a result of drunk driving (Villwock-Witte 2019). Therefore, a bicycle library may be a low-cost solution to address a loss in transportation access.
TNCs, a vehicle). Furthermore, there is often still limited bicycle infrastructure in many communities that will allow for safe travel via bicycle (e.g., protected cycle tracks).
Bikeshare
X X X
This strategy is expected to alleviate the burden of long travel times to the supermarket. Access to food is particularly challenging in Agriculture & Extraction Counties and Remote Counties, where the share of the population living more than 10 miles from a supermarket is 35.4 percent and 29.1 percent, respectively. For comparison, less than 1 percent of the population lives over 10 miles from a supermarket in Metropolitan counties. Bikeshare programs may also expand access to jobs or education. If using a docked
Bikeshare can expand access to a broader part of the community than would otherwise be accessible by just walking. Furthermore, the presence of a bikeshare system may be able to replace some short vehicle trips with an active trip.
Bikeshare systems often require that someone owns a smartphone and can download/use an application to access the bicycles, although some solutions to this barrier are being tested. Furthermore, the system requires the support of broadband, which can identify where a bicycle may be available (e.g., dockless) and/or how many bicycles may be available within a docked station. With small rural communities either not having access to or having
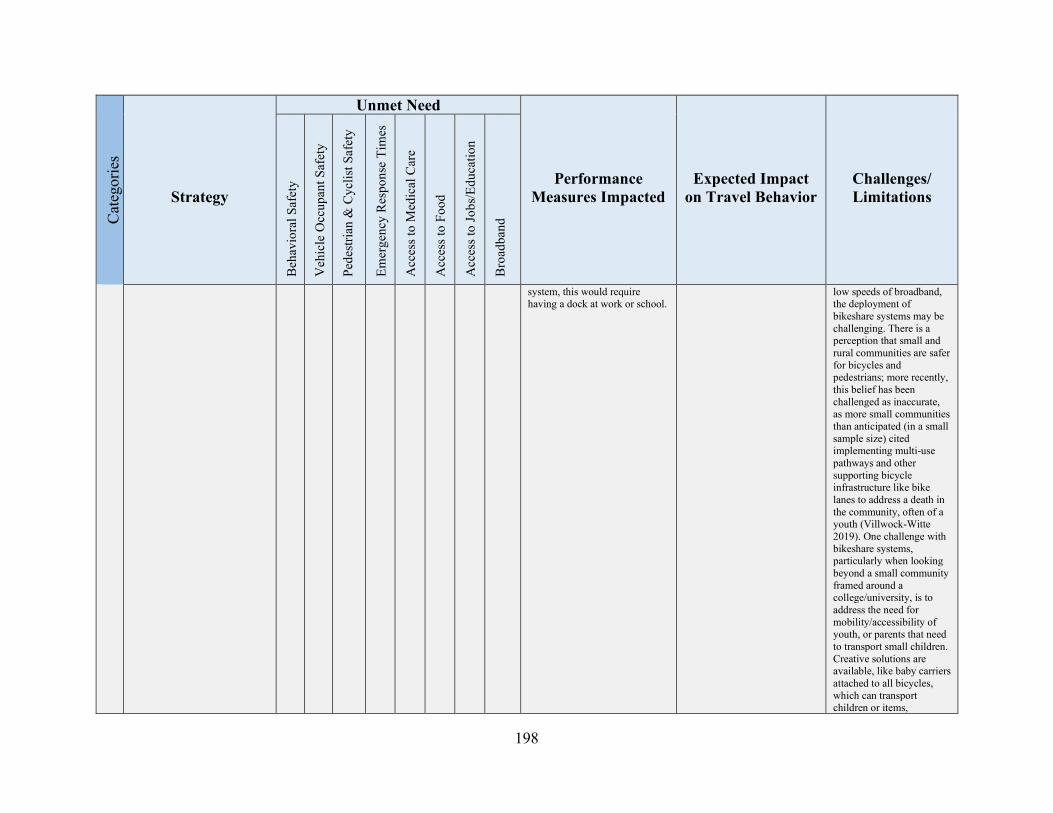
198
Cat
egor
ies
Strategy
Unmet Need
Performance Measures Impacted
Expected Impact on Travel Behavior
Challenges/ Limitations
Beh
avio
ral S
afet
y
Veh
icle
Occ
upan
t Saf
ety
Pede
stria
n &
Cyc
list S
afet
y
Emer
genc
y R
espo
nse
Tim
es
Acc
ess t
o M
edic
al C
are
Acc
ess t
o Fo
od
Acc
ess t
o Jo
bs/E
duca
tion
Bro
adba
nd
system, this would require having a dock at work or school.
low speeds of broadband, the deployment of bikeshare systems may be challenging. There is a perception that small and rural communities are safer for bicycles and pedestrians; more recently, this belief has been challenged as inaccurate, as more small communities than anticipated (in a small sample size) cited implementing multi-use pathways and other supporting bicycle infrastructure like bike lanes to address a death in the community, often of a youth (Villwock-Witte 2019). One challenge with bikeshare systems, particularly when looking beyond a small community framed around a college/university, is to address the need for mobility/accessibility of youth, or parents that need to transport small children. Creative solutions are available, like baby carriers attached to all bicycles, which can transport children or items,
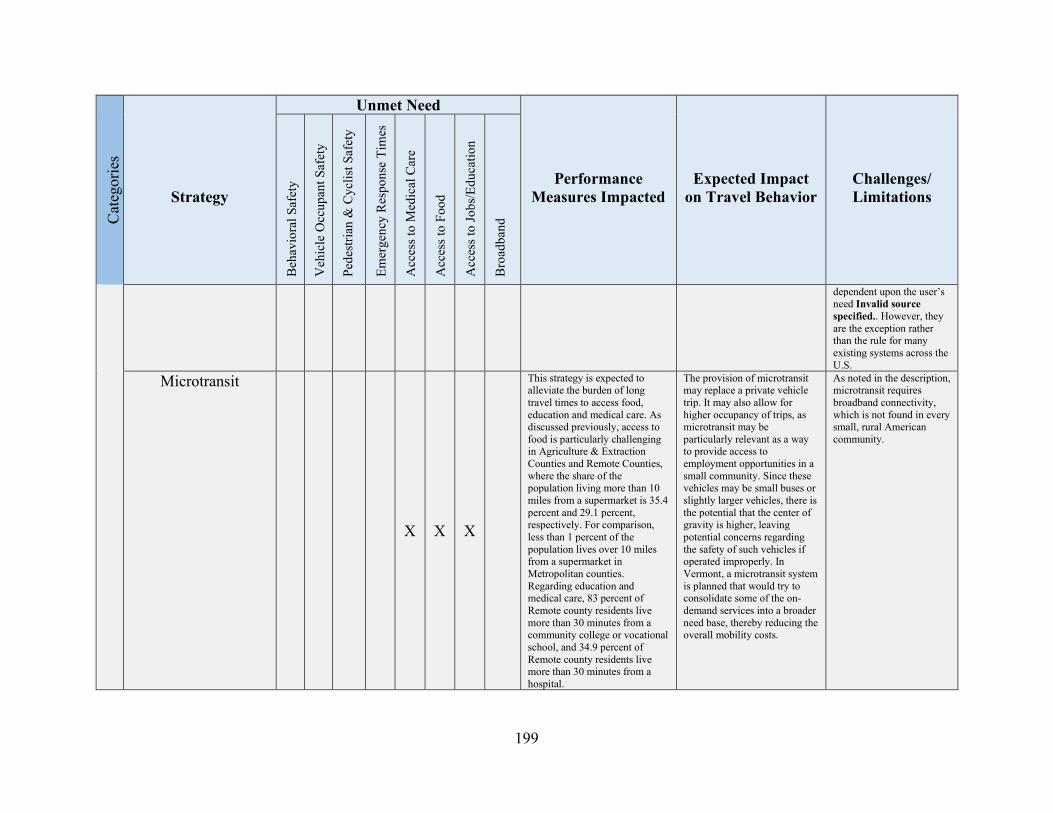
199
Cat
egor
ies
Strategy
Unmet Need
Performance Measures Impacted
Expected Impact on Travel Behavior
Challenges/ Limitations
Beh
avio
ral S
afet
y
Veh
icle
Occ
upan
t Saf
ety
Pede
stria
n &
Cyc
list S
afet
y
Emer
genc
y R
espo
nse
Tim
es
Acc
ess t
o M
edic
al C
are
Acc
ess t
o Fo
od
Acc
ess t
o Jo
bs/E
duca
tion
Bro
adba
nd
dependent upon the user’s need Invalid source specified.. However, they are the exception rather than the rule for many existing systems across the U.S.
Microtransit
X X X
This strategy is expected to alleviate the burden of long travel times to access food, education and medical care. As discussed previously, access to food is particularly challenging in Agriculture & Extraction Counties and Remote Counties, where the share of the population living more than 10 miles from a supermarket is 35.4 percent and 29.1 percent, respectively. For comparison, less than 1 percent of the population lives over 10 miles from a supermarket in Metropolitan counties. Regarding education and medical care, 83 percent of Remote county residents live more than 30 minutes from a community college or vocational school, and 34.9 percent of Remote county residents live more than 30 minutes from a hospital.
The provision of microtransit may replace a private vehicle trip. It may also allow for higher occupancy of trips, as microtransit may be particularly relevant as a way to provide access to employment opportunities in a small community. Since these vehicles may be small buses or slightly larger vehicles, there is the potential that the center of gravity is higher, leaving potential concerns regarding the safety of such vehicles if operated improperly. In Vermont, a microtransit system is planned that would try to consolidate some of the on-demand services into a broader need base, thereby reducing the overall mobility costs.
As noted in the description, microtransit requires broadband connectivity, which is not found in every small, rural American community.
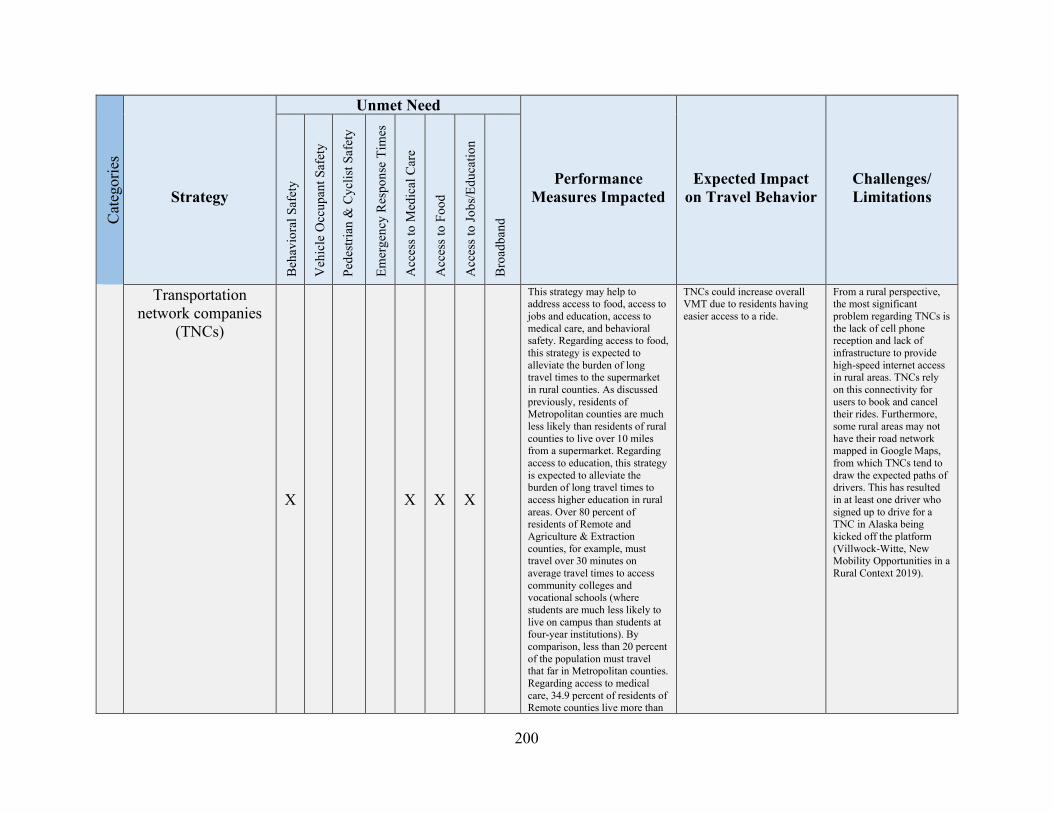
200
Cat
egor
ies
Strategy
Unmet Need
Performance Measures Impacted
Expected Impact on Travel Behavior
Challenges/ Limitations
Beh
avio
ral S
afet
y
Veh
icle
Occ
upan
t Saf
ety
Pede
stria
n &
Cyc
list S
afet
y
Emer
genc
y R
espo
nse
Tim
es
Acc
ess t
o M
edic
al C
are
Acc
ess t
o Fo
od
Acc
ess t
o Jo
bs/E
duca
tion
Bro
adba
nd
Transportation network companies
(TNCs)
X X X X
This strategy may help to address access to food, access to jobs and education, access to medical care, and behavioral safety. Regarding access to food, this strategy is expected to alleviate the burden of long travel times to the supermarket in rural counties. As discussed previously, residents of Metropolitan counties are much less likely than residents of rural counties to live over 10 miles from a supermarket. Regarding access to education, this strategy is expected to alleviate the burden of long travel times to access higher education in rural areas. Over 80 percent of residents of Remote and Agriculture & Extraction counties, for example, must travel over 30 minutes on average travel times to access community colleges and vocational schools (where students are much less likely to live on campus than students at four-year institutions). By comparison, less than 20 percent of the population must travel that far in Metropolitan counties. Regarding access to medical care, 34.9 percent of residents of Remote counties live more than
TNCs could increase overall VMT due to residents having easier access to a ride.
From a rural perspective, the most significant problem regarding TNCs is the lack of cell phone reception and lack of infrastructure to provide high-speed internet access in rural areas. TNCs rely on this connectivity for users to book and cancel their rides. Furthermore, some rural areas may not have their road network mapped in Google Maps, from which TNCs tend to draw the expected paths of drivers. This has resulted in at least one driver who signed up to drive for a TNC in Alaska being kicked off the platform (Villwock-Witte, New Mobility Opportunities in a Rural Context 2019).
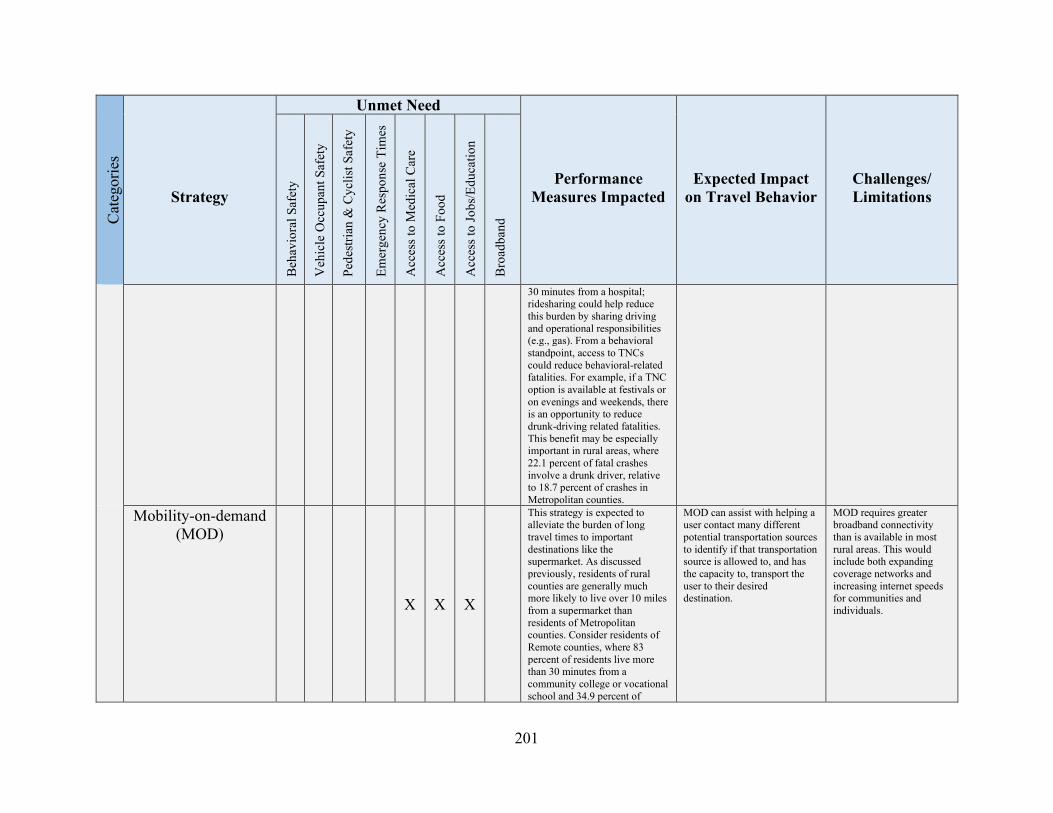
201
Cat
egor
ies
Strategy
Unmet Need
Performance Measures Impacted
Expected Impact on Travel Behavior
Challenges/ Limitations
Beh
avio
ral S
afet
y
Veh
icle
Occ
upan
t Saf
ety
Pede
stria
n &
Cyc
list S
afet
y
Emer
genc
y R
espo
nse
Tim
es
Acc
ess t
o M
edic
al C
are
Acc
ess t
o Fo
od
Acc
ess t
o Jo
bs/E
duca
tion
Bro
adba
nd
30 minutes from a hospital; ridesharing could help reduce this burden by sharing driving and operational responsibilities (e.g., gas). From a behavioral standpoint, access to TNCs could reduce behavioral-related fatalities. For example, if a TNC option is available at festivals or on evenings and weekends, there is an opportunity to reduce drunk-driving related fatalities. This benefit may be especially important in rural areas, where 22.1 percent of fatal crashes involve a drunk driver, relative to 18.7 percent of crashes in Metropolitan counties.
Mobility-on-demand (MOD)
X X X
This strategy is expected to alleviate the burden of long travel times to important destinations like the supermarket. As discussed previously, residents of rural counties are generally much more likely to live over 10 miles from a supermarket than residents of Metropolitan counties. Consider residents of Remote counties, where 83 percent of residents live more than 30 minutes from a community college or vocational school and 34.9 percent of
MOD can assist with helping a user contact many different potential transportation sources to identify if that transportation source is allowed to, and has the capacity to, transport the user to their desired destination.
MOD requires greater broadband connectivity than is available in most rural areas. This would include both expanding coverage networks and increasing internet speeds for communities and individuals.
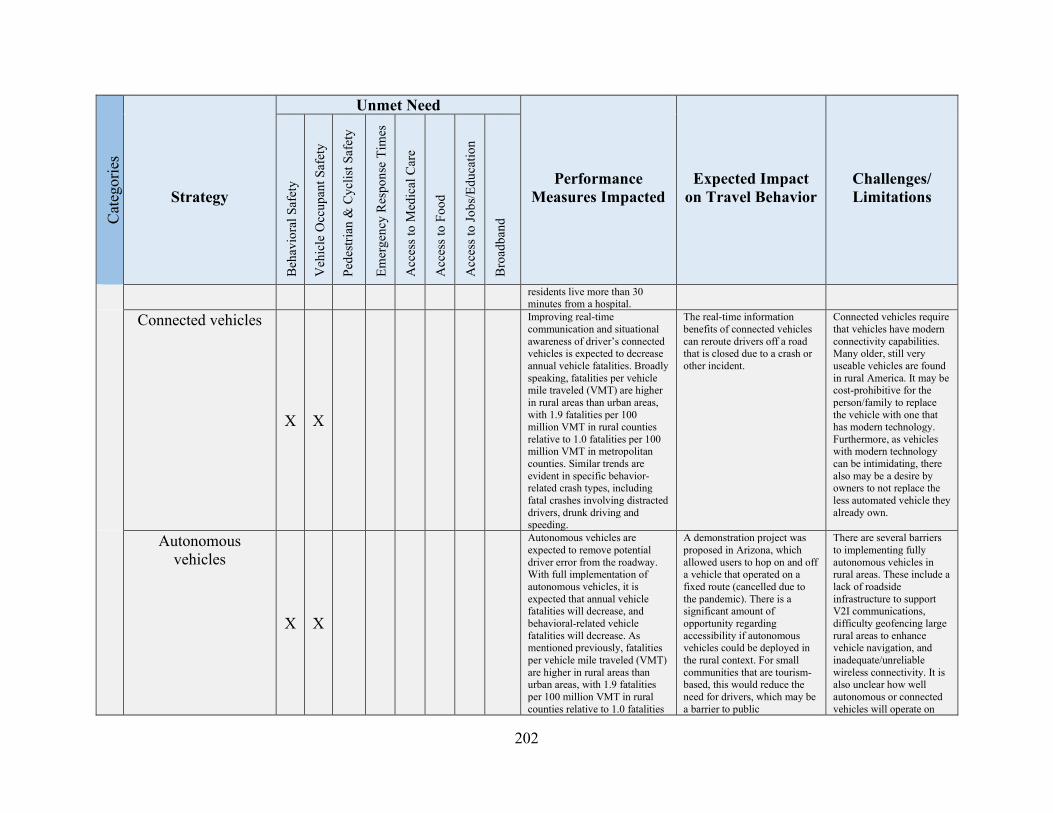
202
Cat
egor
ies
Strategy
Unmet Need
Performance Measures Impacted
Expected Impact on Travel Behavior
Challenges/ Limitations
Beh
avio
ral S
afet
y
Veh
icle
Occ
upan
t Saf
ety
Pede
stria
n &
Cyc
list S
afet
y
Emer
genc
y R
espo
nse
Tim
es
Acc
ess t
o M
edic
al C
are
Acc
ess t
o Fo
od
Acc
ess t
o Jo
bs/E
duca
tion
Bro
adba
nd
residents live more than 30 minutes from a hospital.
Connected vehicles
X X
Improving real-time communication and situational awareness of driver’s connected vehicles is expected to decrease annual vehicle fatalities. Broadly speaking, fatalities per vehicle mile traveled (VMT) are higher in rural areas than urban areas, with 1.9 fatalities per 100 million VMT in rural counties relative to 1.0 fatalities per 100 million VMT in metropolitan counties. Similar trends are evident in specific behavior-related crash types, including fatal crashes involving distracted drivers, drunk driving and speeding.
The real-time information benefits of connected vehicles can reroute drivers off a road that is closed due to a crash or other incident.
Connected vehicles require that vehicles have modern connectivity capabilities. Many older, still very useable vehicles are found in rural America. It may be cost-prohibitive for the person/family to replace the vehicle with one that has modern technology. Furthermore, as vehicles with modern technology can be intimidating, there also may be a desire by owners to not replace the less automated vehicle they already own.
Autonomous vehicles
X X
Autonomous vehicles are expected to remove potential driver error from the roadway. With full implementation of autonomous vehicles, it is expected that annual vehicle fatalities will decrease, and behavioral-related vehicle fatalities will decrease. As mentioned previously, fatalities per vehicle mile traveled (VMT) are higher in rural areas than urban areas, with 1.9 fatalities per 100 million VMT in rural counties relative to 1.0 fatalities
A demonstration project was proposed in Arizona, which allowed users to hop on and off a vehicle that operated on a fixed route (cancelled due to the pandemic). There is a significant amount of opportunity regarding accessibility if autonomous vehicles could be deployed in the rural context. For small communities that are tourism-based, this would reduce the need for drivers, which may be a barrier to public
There are several barriers to implementing fully autonomous vehicles in rural areas. These include a lack of roadside infrastructure to support V2I communications, difficulty geofencing large rural areas to enhance vehicle navigation, and inadequate/unreliable wireless connectivity. It is also unclear how well autonomous or connected vehicles will operate on
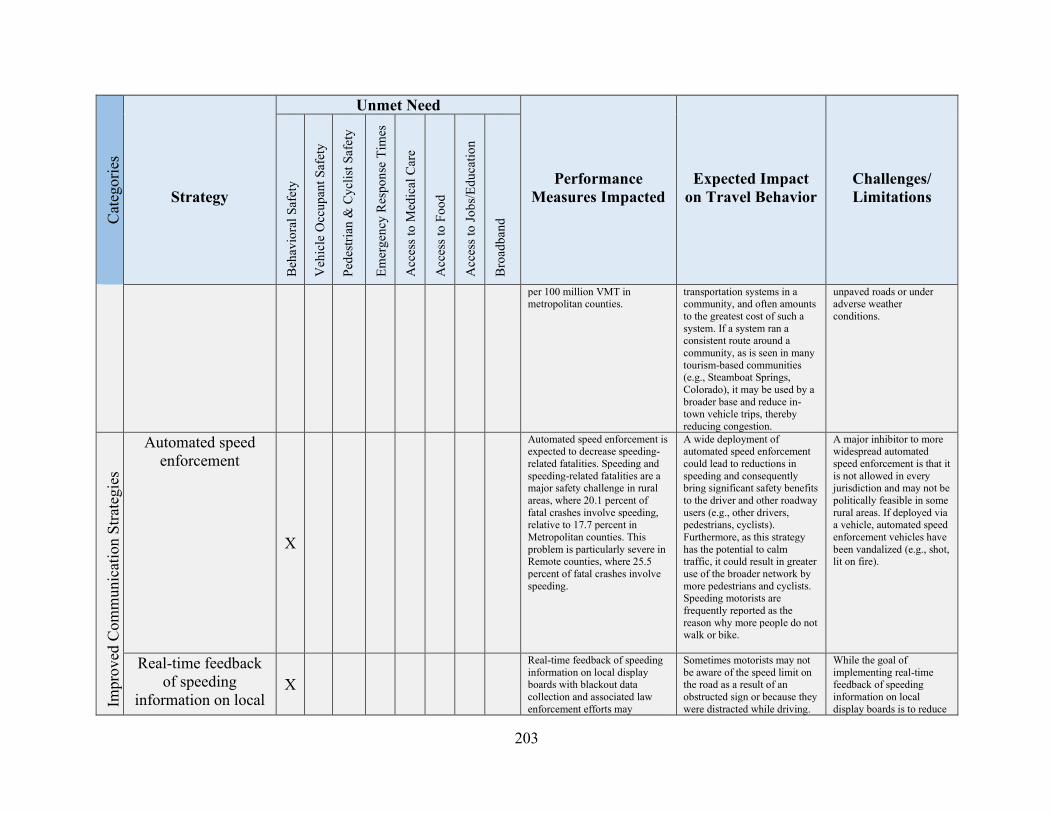
203
Cat
egor
ies
Strategy
Unmet Need
Performance Measures Impacted
Expected Impact on Travel Behavior
Challenges/ Limitations
Beh
avio
ral S
afet
y
Veh
icle
Occ
upan
t Saf
ety
Pede
stria
n &
Cyc
list S
afet
y
Emer
genc
y R
espo
nse
Tim
es
Acc
ess t
o M
edic
al C
are
Acc
ess t
o Fo
od
Acc
ess t
o Jo
bs/E
duca
tion
Bro
adba
nd
per 100 million VMT in metropolitan counties.
transportation systems in a community, and often amounts to the greatest cost of such a system. If a system ran a consistent route around a community, as is seen in many tourism-based communities (e.g., Steamboat Springs, Colorado), it may be used by a broader base and reduce in-town vehicle trips, thereby reducing congestion.
unpaved roads or under adverse weather conditions.
Impr
oved
Com
mun
icat
ion
Stra
tegi
es
Automated speed enforcement
X
Automated speed enforcement is expected to decrease speeding-related fatalities. Speeding and speeding-related fatalities are a major safety challenge in rural areas, where 20.1 percent of fatal crashes involve speeding, relative to 17.7 percent in Metropolitan counties. This problem is particularly severe in Remote counties, where 25.5 percent of fatal crashes involve speeding.
A wide deployment of automated speed enforcement could lead to reductions in speeding and consequently bring significant safety benefits to the driver and other roadway users (e.g., other drivers, pedestrians, cyclists). Furthermore, as this strategy has the potential to calm traffic, it could result in greater use of the broader network by more pedestrians and cyclists. Speeding motorists are frequently reported as the reason why more people do not walk or bike.
A major inhibitor to more widespread automated speed enforcement is that it is not allowed in every jurisdiction and may not be politically feasible in some rural areas. If deployed via a vehicle, automated speed enforcement vehicles have been vandalized (e.g., shot, lit on fire).
Real-time feedback of speeding
information on local X
Real-time feedback of speeding information on local display boards with blackout data collection and associated law enforcement efforts may
Sometimes motorists may not be aware of the speed limit on the road as a result of an obstructed sign or because they were distracted while driving.
While the goal of implementing real-time feedback of speeding information on local display boards is to reduce
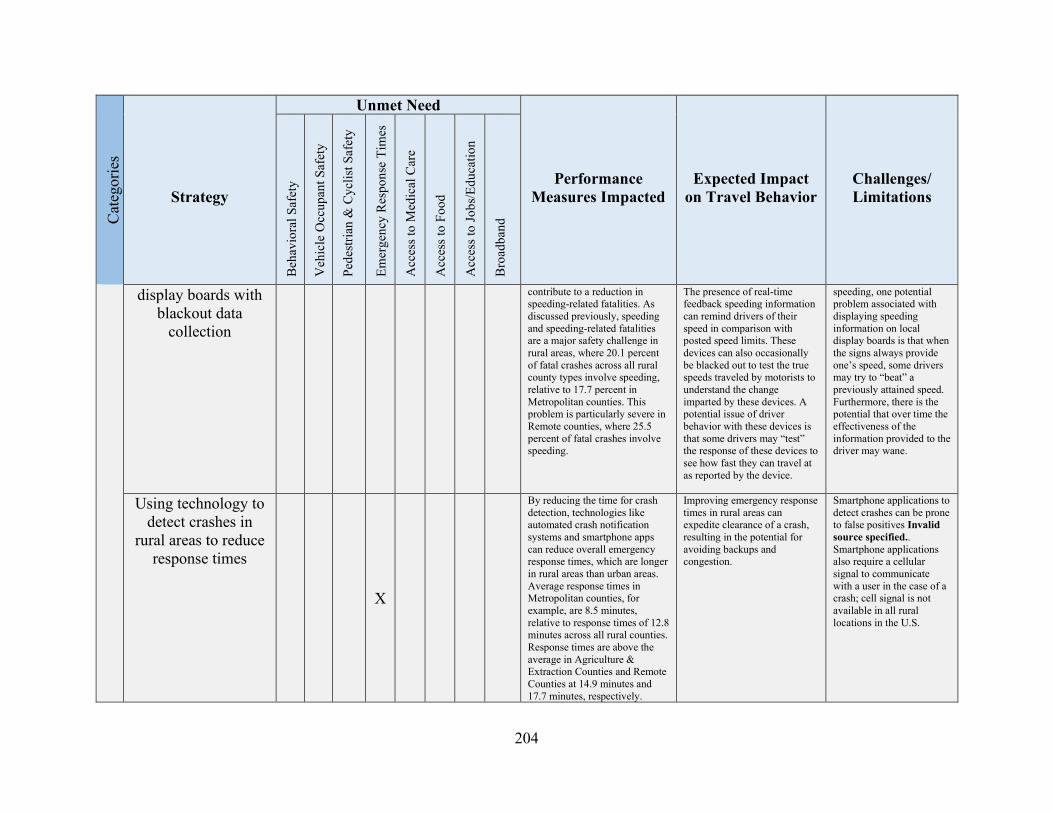
204
Cat
egor
ies
Strategy
Unmet Need
Performance Measures Impacted
Expected Impact on Travel Behavior
Challenges/ Limitations
Beh
avio
ral S
afet
y
Veh
icle
Occ
upan
t Saf
ety
Pede
stria
n &
Cyc
list S
afet
y
Emer
genc
y R
espo
nse
Tim
es
Acc
ess t
o M
edic
al C
are
Acc
ess t
o Fo
od
Acc
ess t
o Jo
bs/E
duca
tion
Bro
adba
nd
display boards with blackout data
collection
contribute to a reduction in speeding-related fatalities. As discussed previously, speeding and speeding-related fatalities are a major safety challenge in rural areas, where 20.1 percent of fatal crashes across all rural county types involve speeding, relative to 17.7 percent in Metropolitan counties. This problem is particularly severe in Remote counties, where 25.5 percent of fatal crashes involve speeding.
The presence of real-time feedback speeding information can remind drivers of their speed in comparison with posted speed limits. These devices can also occasionally be blacked out to test the true speeds traveled by motorists to understand the change imparted by these devices. A potential issue of driver behavior with these devices is that some drivers may “test” the response of these devices to see how fast they can travel at as reported by the device.
speeding, one potential problem associated with displaying speeding information on local display boards is that when the signs always provide one’s speed, some drivers may try to “beat” a previously attained speed. Furthermore, there is the potential that over time the effectiveness of the information provided to the driver may wane.
Using technology to detect crashes in
rural areas to reduce response times
X
By reducing the time for crash detection, technologies like automated crash notification systems and smartphone apps can reduce overall emergency response times, which are longer in rural areas than urban areas. Average response times in Metropolitan counties, for example, are 8.5 minutes, relative to response times of 12.8 minutes across all rural counties. Response times are above the average in Agriculture & Extraction Counties and Remote Counties at 14.9 minutes and 17.7 minutes, respectively.
Improving emergency response times in rural areas can expedite clearance of a crash, resulting in the potential for avoiding backups and congestion.
Smartphone applications to detect crashes can be prone to false positives Invalid source specified.. Smartphone applications also require a cellular signal to communicate with a user in the case of a crash; cell signal is not available in all rural locations in the U.S.
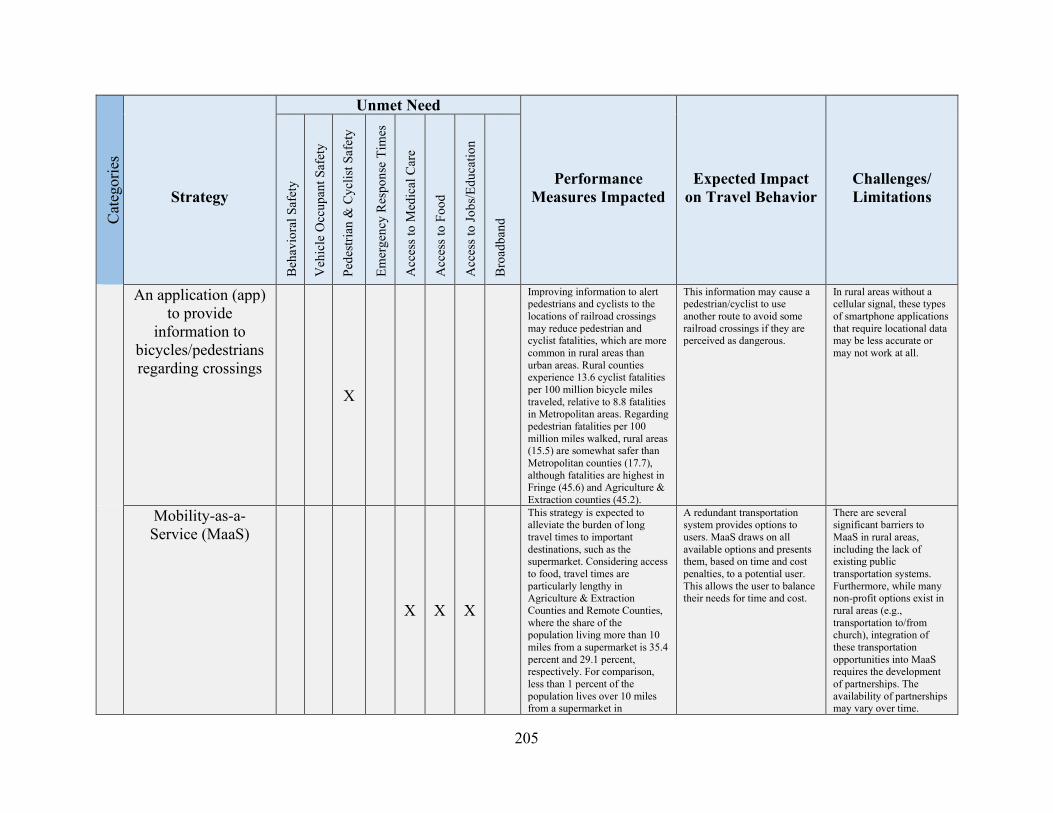
205
Cat
egor
ies
Strategy
Unmet Need
Performance Measures Impacted
Expected Impact on Travel Behavior
Challenges/ Limitations
Beh
avio
ral S
afet
y
Veh
icle
Occ
upan
t Saf
ety
Pede
stria
n &
Cyc
list S
afet
y
Emer
genc
y R
espo
nse
Tim
es
Acc
ess t
o M
edic
al C
are
Acc
ess t
o Fo
od
Acc
ess t
o Jo
bs/E
duca
tion
Bro
adba
nd
An application (app) to provide
information to bicycles/pedestrians regarding crossings
X
Improving information to alert pedestrians and cyclists to the locations of railroad crossings may reduce pedestrian and cyclist fatalities, which are more common in rural areas than urban areas. Rural counties experience 13.6 cyclist fatalities per 100 million bicycle miles traveled, relative to 8.8 fatalities in Metropolitan areas. Regarding pedestrian fatalities per 100 million miles walked, rural areas (15.5) are somewhat safer than Metropolitan counties (17.7), although fatalities are highest in Fringe (45.6) and Agriculture & Extraction counties (45.2).
This information may cause a pedestrian/cyclist to use another route to avoid some railroad crossings if they are perceived as dangerous.
In rural areas without a cellular signal, these types of smartphone applications that require locational data may be less accurate or may not work at all.
Mobility-as-a-Service (MaaS)
X X X
This strategy is expected to alleviate the burden of long travel times to important destinations, such as the supermarket. Considering access to food, travel times are particularly lengthy in Agriculture & Extraction Counties and Remote Counties, where the share of the population living more than 10 miles from a supermarket is 35.4 percent and 29.1 percent, respectively. For comparison, less than 1 percent of the population lives over 10 miles from a supermarket in
A redundant transportation system provides options to users. MaaS draws on all available options and presents them, based on time and cost penalties, to a potential user. This allows the user to balance their needs for time and cost.
There are several significant barriers to MaaS in rural areas, including the lack of existing public transportation systems. Furthermore, while many non-profit options exist in rural areas (e.g., transportation to/from church), integration of these transportation opportunities into MaaS requires the development of partnerships. The availability of partnerships may vary over time.
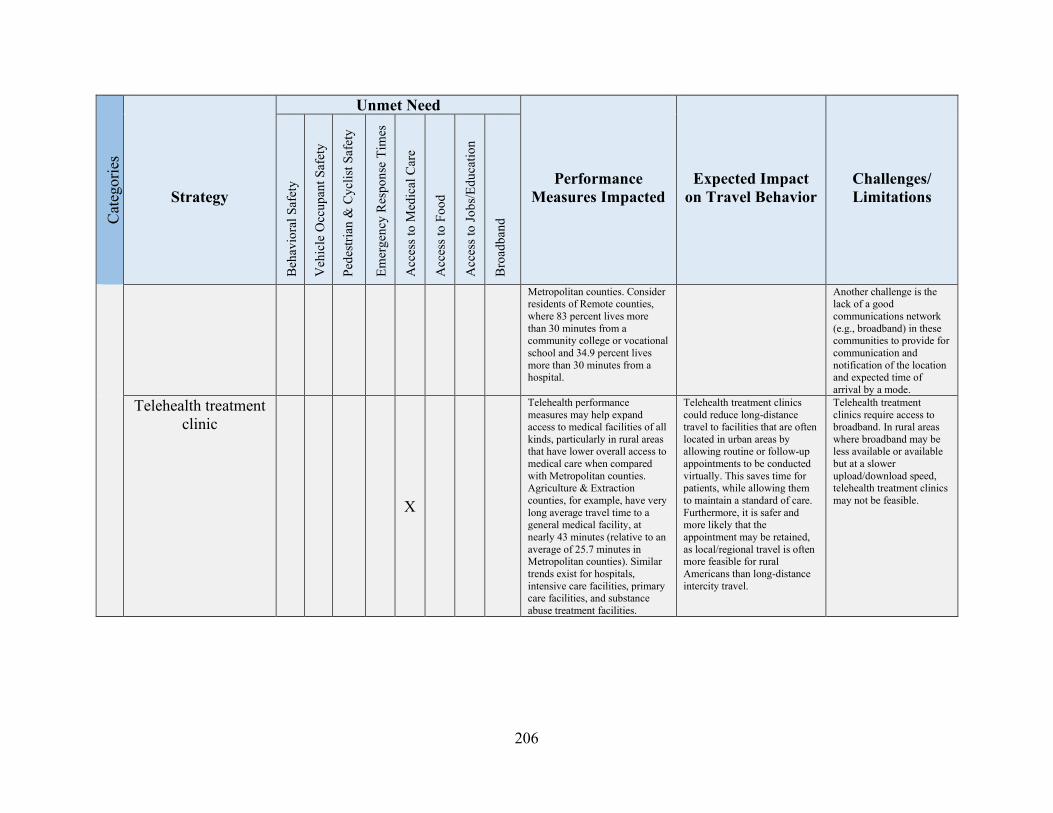
206
Cat
egor
ies
Strategy
Unmet Need
Performance Measures Impacted
Expected Impact on Travel Behavior
Challenges/ Limitations
Beh
avio
ral S
afet
y
Veh
icle
Occ
upan
t Saf
ety
Pede
stria
n &
Cyc
list S
afet
y
Emer
genc
y R
espo
nse
Tim
es
Acc
ess t
o M
edic
al C
are
Acc
ess t
o Fo
od
Acc
ess t
o Jo
bs/E
duca
tion
Bro
adba
nd
Metropolitan counties. Consider residents of Remote counties, where 83 percent lives more than 30 minutes from a community college or vocational school and 34.9 percent lives more than 30 minutes from a hospital.
Another challenge is the lack of a good communications network (e.g., broadband) in these communities to provide for communication and notification of the location and expected time of arrival by a mode.
Telehealth treatment clinic
X
Telehealth performance measures may help expand access to medical facilities of all kinds, particularly in rural areas that have lower overall access to medical care when compared with Metropolitan counties. Agriculture & Extraction counties, for example, have very long average travel time to a general medical facility, at nearly 43 minutes (relative to an average of 25.7 minutes in Metropolitan counties). Similar trends exist for hospitals, intensive care facilities, primary care facilities, and substance abuse treatment facilities.
Telehealth treatment clinics could reduce long-distance travel to facilities that are often located in urban areas by allowing routine or follow-up appointments to be conducted virtually. This saves time for patients, while allowing them to maintain a standard of care. Furthermore, it is safer and more likely that the appointment may be retained, as local/regional travel is often more feasible for rural Americans than long-distance intercity travel.
Telehealth treatment clinics require access to broadband. In rural areas where broadband may be less available or available but at a slower upload/download speed, telehealth treatment clinics may not be feasible.
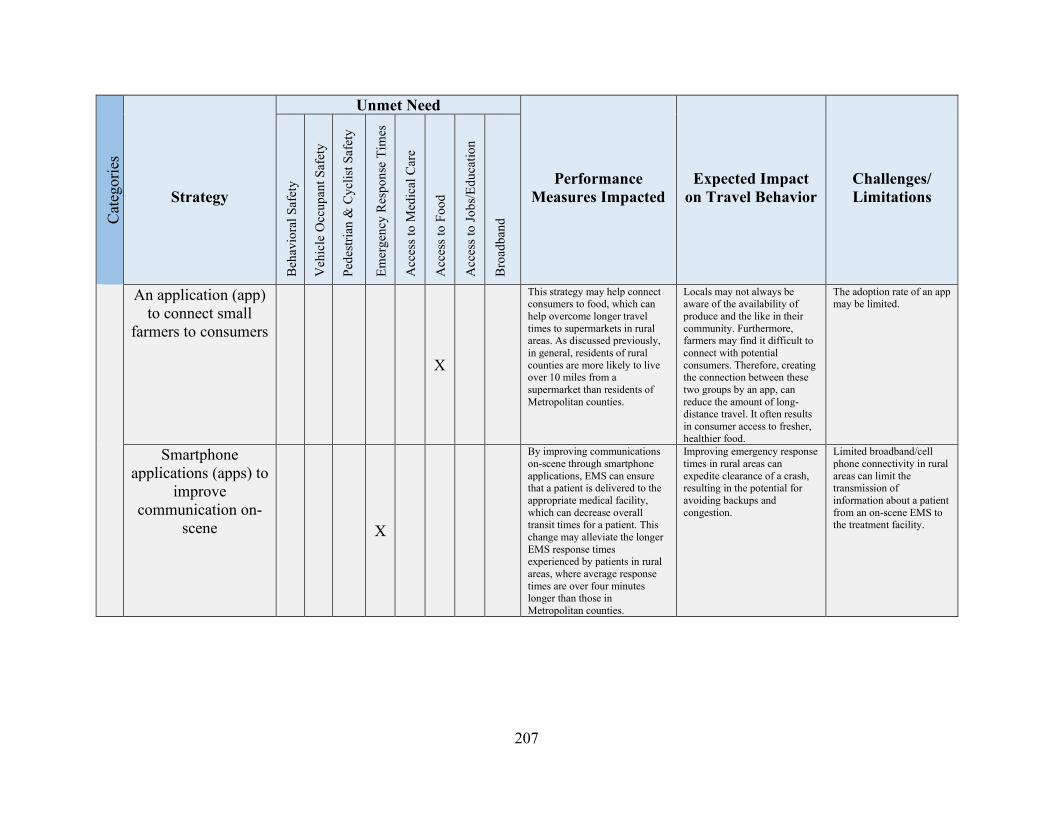
207
Cat
egor
ies
Strategy
Unmet Need
Performance Measures Impacted
Expected Impact on Travel Behavior
Challenges/ Limitations
Beh
avio
ral S
afet
y
Veh
icle
Occ
upan
t Saf
ety
Pede
stria
n &
Cyc
list S
afet
y
Emer
genc
y R
espo
nse
Tim
es
Acc
ess t
o M
edic
al C
are
Acc
ess t
o Fo
od
Acc
ess t
o Jo
bs/E
duca
tion
Bro
adba
nd
An application (app) to connect small
farmers to consumers
X
This strategy may help connect consumers to food, which can help overcome longer travel times to supermarkets in rural areas. As discussed previously, in general, residents of rural counties are more likely to live over 10 miles from a supermarket than residents of Metropolitan counties.
Locals may not always be aware of the availability of produce and the like in their community. Furthermore, farmers may find it difficult to connect with potential consumers. Therefore, creating the connection between these two groups by an app, can reduce the amount of long-distance travel. It often results in consumer access to fresher, healthier food.
The adoption rate of an app may be limited.
Smartphone applications (apps) to
improve communication on-
scene X
By improving communications on-scene through smartphone applications, EMS can ensure that a patient is delivered to the appropriate medical facility, which can decrease overall transit times for a patient. This change may alleviate the longer EMS response times experienced by patients in rural areas, where average response times are over four minutes longer than those in Metropolitan counties.
Improving emergency response times in rural areas can expedite clearance of a crash, resulting in the potential for avoiding backups and congestion.
Limited broadband/cell phone connectivity in rural areas can limit the transmission of information about a patient from an on-scene EMS to the treatment facility.
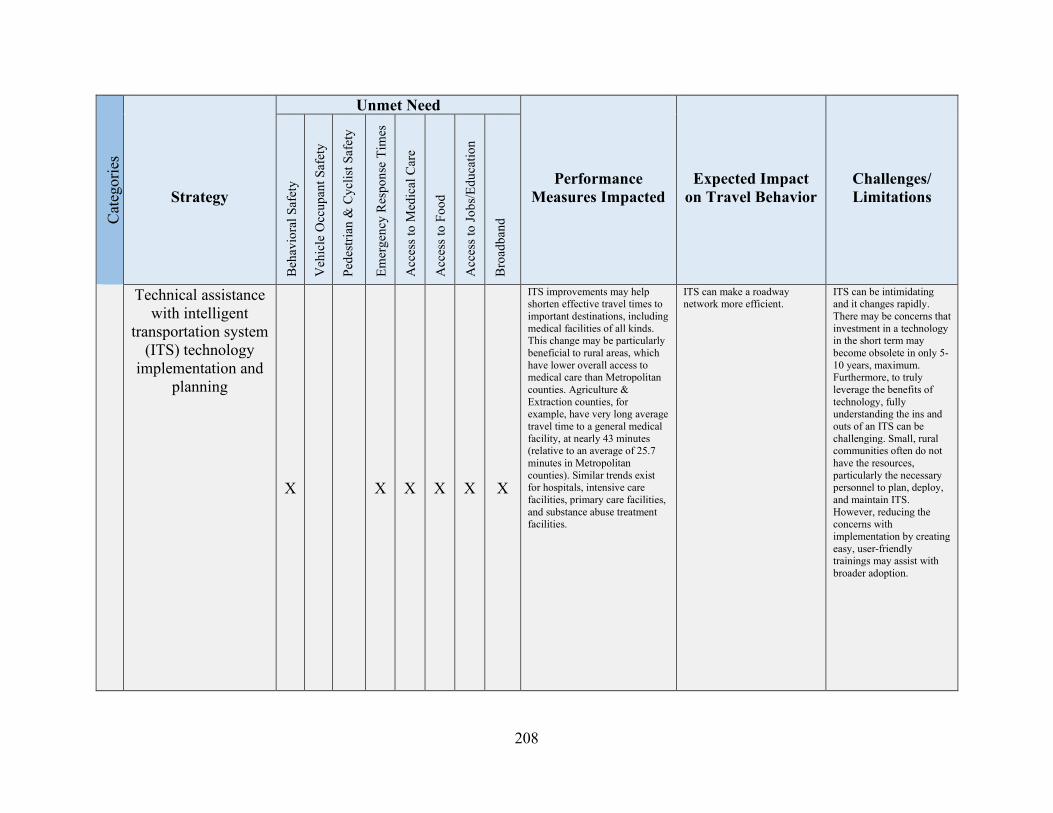
208
Cat
egor
ies
Strategy
Unmet Need
Performance Measures Impacted
Expected Impact on Travel Behavior
Challenges/ Limitations
Beh
avio
ral S
afet
y
Veh
icle
Occ
upan
t Saf
ety
Pede
stria
n &
Cyc
list S
afet
y
Emer
genc
y R
espo
nse
Tim
es
Acc
ess t
o M
edic
al C
are
Acc
ess t
o Fo
od
Acc
ess t
o Jo
bs/E
duca
tion
Bro
adba
nd
Technical assistance with intelligent
transportation system (ITS) technology
implementation and planning
X X X X X X
ITS improvements may help shorten effective travel times to important destinations, including medical facilities of all kinds. This change may be particularly beneficial to rural areas, which have lower overall access to medical care than Metropolitan counties. Agriculture & Extraction counties, for example, have very long average travel time to a general medical facility, at nearly 43 minutes (relative to an average of 25.7 minutes in Metropolitan counties). Similar trends exist for hospitals, intensive care facilities, primary care facilities, and substance abuse treatment facilities.
ITS can make a roadway network more efficient.
ITS can be intimidating and it changes rapidly. There may be concerns that investment in a technology in the short term may become obsolete in only 5-10 years, maximum. Furthermore, to truly leverage the benefits of technology, fully understanding the ins and outs of an ITS can be challenging. Small, rural communities often do not have the resources, particularly the necessary personnel to plan, deploy, and maintain ITS. However, reducing the concerns with implementation by creating easy, user-friendly trainings may assist with broader adoption.
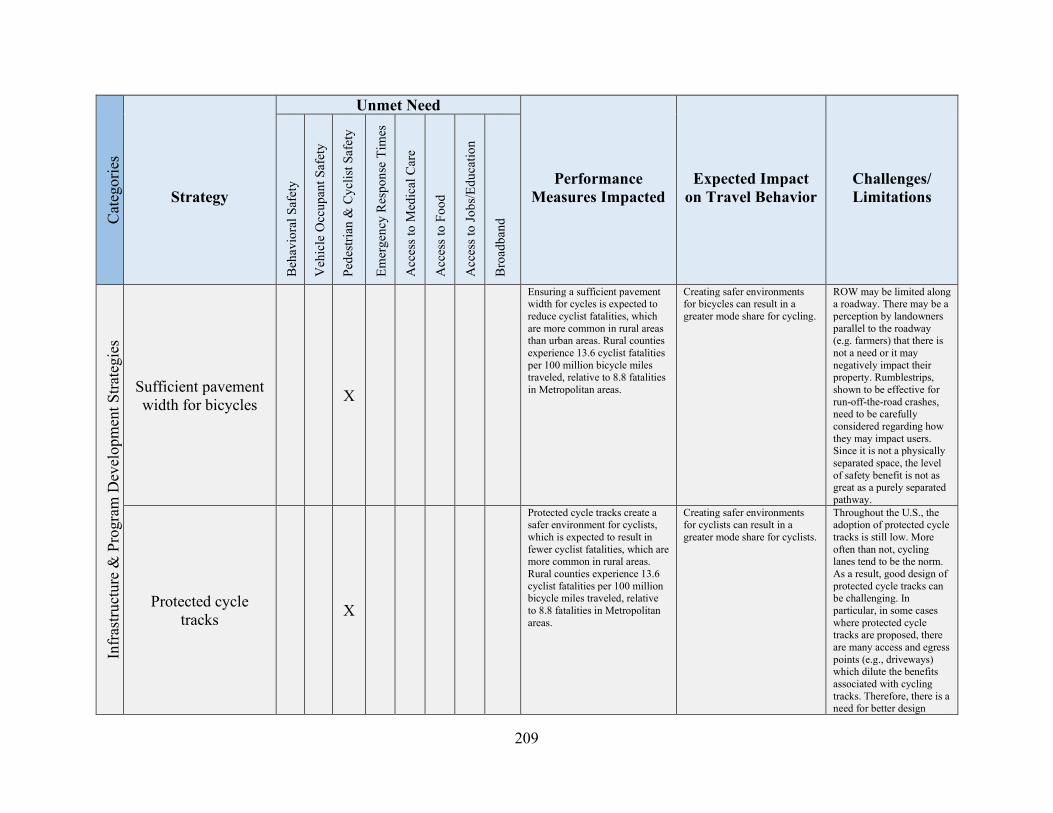
209
Cat
egor
ies
Strategy
Unmet Need
Performance Measures Impacted
Expected Impact on Travel Behavior
Challenges/ Limitations
Beh
avio
ral S
afet
y
Veh
icle
Occ
upan
t Saf
ety
Pede
stria
n &
Cyc
list S
afet
y
Emer
genc
y R
espo
nse
Tim
es
Acc
ess t
o M
edic
al C
are
Acc
ess t
o Fo
od
Acc
ess t
o Jo
bs/E
duca
tion
Bro
adba
nd
Infra
stru
ctur
e &
Pro
gram
Dev
elop
men
t Stra
tegi
es
Sufficient pavement width for bicycles X
Ensuring a sufficient pavement width for cycles is expected to reduce cyclist fatalities, which are more common in rural areas than urban areas. Rural counties experience 13.6 cyclist fatalities per 100 million bicycle miles traveled, relative to 8.8 fatalities in Metropolitan areas.
Creating safer environments for bicycles can result in a greater mode share for cycling.
ROW may be limited along a roadway. There may be a perception by landowners parallel to the roadway (e.g. farmers) that there is not a need or it may negatively impact their property. Rumblestrips, shown to be effective for run-off-the-road crashes, need to be carefully considered regarding how they may impact users. Since it is not a physically separated space, the level of safety benefit is not as great as a purely separated pathway.
Protected cycle tracks X
Protected cycle tracks create a safer environment for cyclists, which is expected to result in fewer cyclist fatalities, which are more common in rural areas. Rural counties experience 13.6 cyclist fatalities per 100 million bicycle miles traveled, relative to 8.8 fatalities in Metropolitan areas.
Creating safer environments for cyclists can result in a greater mode share for cyclists.
Throughout the U.S., the adoption of protected cycle tracks is still low. More often than not, cycling lanes tend to be the norm. As a result, good design of protected cycle tracks can be challenging. In particular, in some cases where protected cycle tracks are proposed, there are many access and egress points (e.g., driveways) which dilute the benefits associated with cycling tracks. Therefore, there is a need for better design
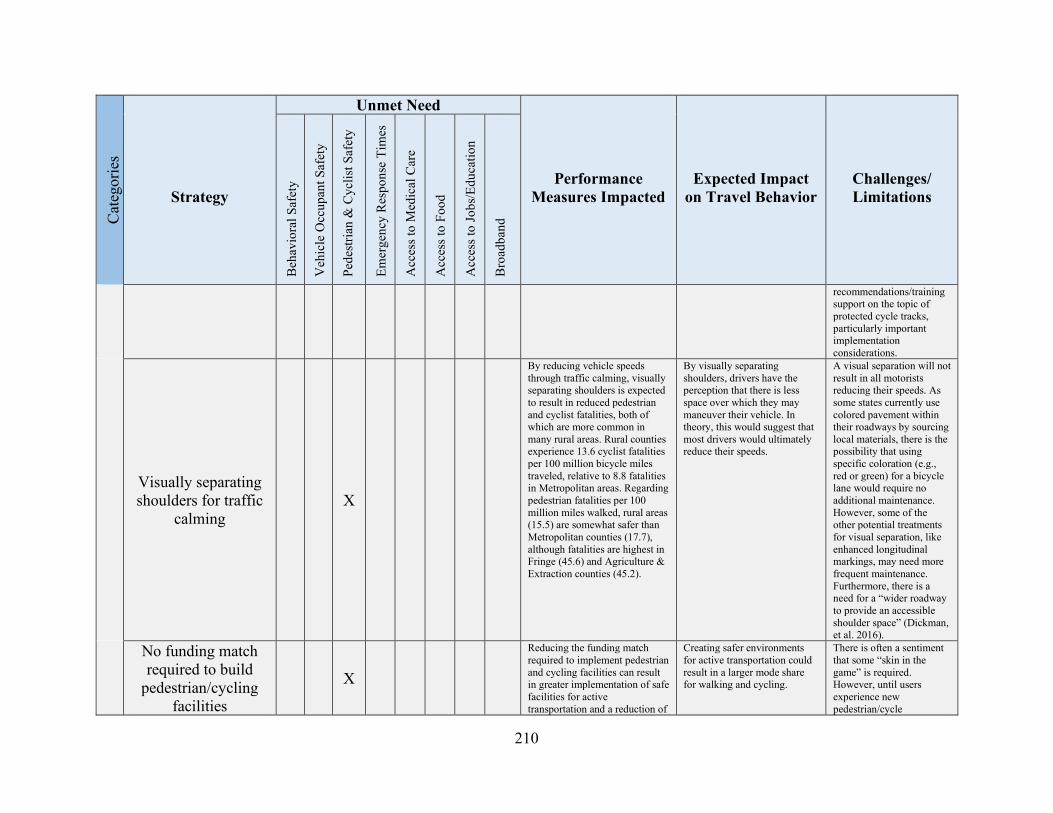
210
Cat
egor
ies
Strategy
Unmet Need
Performance Measures Impacted
Expected Impact on Travel Behavior
Challenges/ Limitations
Beh
avio
ral S
afet
y
Veh
icle
Occ
upan
t Saf
ety
Pede
stria
n &
Cyc
list S
afet
y
Emer
genc
y R
espo
nse
Tim
es
Acc
ess t
o M
edic
al C
are
Acc
ess t
o Fo
od
Acc
ess t
o Jo
bs/E
duca
tion
Bro
adba
nd
recommendations/training support on the topic of protected cycle tracks, particularly important implementation considerations.
Visually separating shoulders for traffic
calming X
By reducing vehicle speeds through traffic calming, visually separating shoulders is expected to result in reduced pedestrian and cyclist fatalities, both of which are more common in many rural areas. Rural counties experience 13.6 cyclist fatalities per 100 million bicycle miles traveled, relative to 8.8 fatalities in Metropolitan areas. Regarding pedestrian fatalities per 100 million miles walked, rural areas (15.5) are somewhat safer than Metropolitan counties (17.7), although fatalities are highest in Fringe (45.6) and Agriculture & Extraction counties (45.2).
By visually separating shoulders, drivers have the perception that there is less space over which they may maneuver their vehicle. In theory, this would suggest that most drivers would ultimately reduce their speeds.
A visual separation will not result in all motorists reducing their speeds. As some states currently use colored pavement within their roadways by sourcing local materials, there is the possibility that using specific coloration (e.g., red or green) for a bicycle lane would require no additional maintenance. However, some of the other potential treatments for visual separation, like enhanced longitudinal markings, may need more frequent maintenance. Furthermore, there is a need for a “wider roadway to provide an accessible shoulder space” (Dickman, et al. 2016).
No funding match required to build
pedestrian/cycling facilities
X
Reducing the funding match required to implement pedestrian and cycling facilities can result in greater implementation of safe facilities for active transportation and a reduction of
Creating safer environments for active transportation could result in a larger mode share for walking and cycling.
There is often a sentiment that some “skin in the game” is required. However, until users experience new pedestrian/cycle
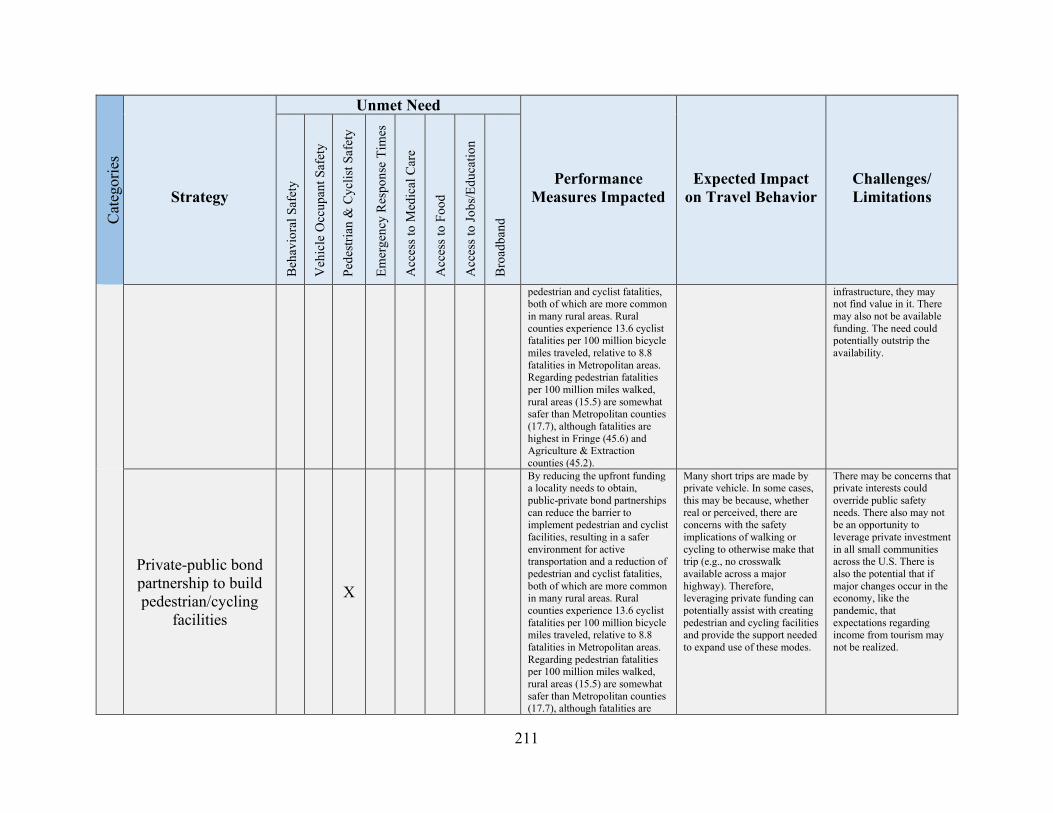
211
Cat
egor
ies
Strategy
Unmet Need
Performance Measures Impacted
Expected Impact on Travel Behavior
Challenges/ Limitations
Beh
avio
ral S
afet
y
Veh
icle
Occ
upan
t Saf
ety
Pede
stria
n &
Cyc
list S
afet
y
Emer
genc
y R
espo
nse
Tim
es
Acc
ess t
o M
edic
al C
are
Acc
ess t
o Fo
od
Acc
ess t
o Jo
bs/E
duca
tion
Bro
adba
nd
pedestrian and cyclist fatalities, both of which are more common in many rural areas. Rural counties experience 13.6 cyclist fatalities per 100 million bicycle miles traveled, relative to 8.8 fatalities in Metropolitan areas. Regarding pedestrian fatalities per 100 million miles walked, rural areas (15.5) are somewhat safer than Metropolitan counties (17.7), although fatalities are highest in Fringe (45.6) and Agriculture & Extraction counties (45.2).
infrastructure, they may not find value in it. There may also not be available funding. The need could potentially outstrip the availability.
Private-public bond partnership to build pedestrian/cycling
facilities
X
By reducing the upfront funding a locality needs to obtain, public-private bond partnerships can reduce the barrier to implement pedestrian and cyclist facilities, resulting in a safer environment for active transportation and a reduction of pedestrian and cyclist fatalities, both of which are more common in many rural areas. Rural counties experience 13.6 cyclist fatalities per 100 million bicycle miles traveled, relative to 8.8 fatalities in Metropolitan areas. Regarding pedestrian fatalities per 100 million miles walked, rural areas (15.5) are somewhat safer than Metropolitan counties (17.7), although fatalities are
Many short trips are made by private vehicle. In some cases, this may be because, whether real or perceived, there are concerns with the safety implications of walking or cycling to otherwise make that trip (e.g., no crosswalk available across a major highway). Therefore, leveraging private funding can potentially assist with creating pedestrian and cycling facilities and provide the support needed to expand use of these modes.
There may be concerns that private interests could override public safety needs. There also may not be an opportunity to leverage private investment in all small communities across the U.S. There is also the potential that if major changes occur in the economy, like the pandemic, that expectations regarding income from tourism may not be realized.
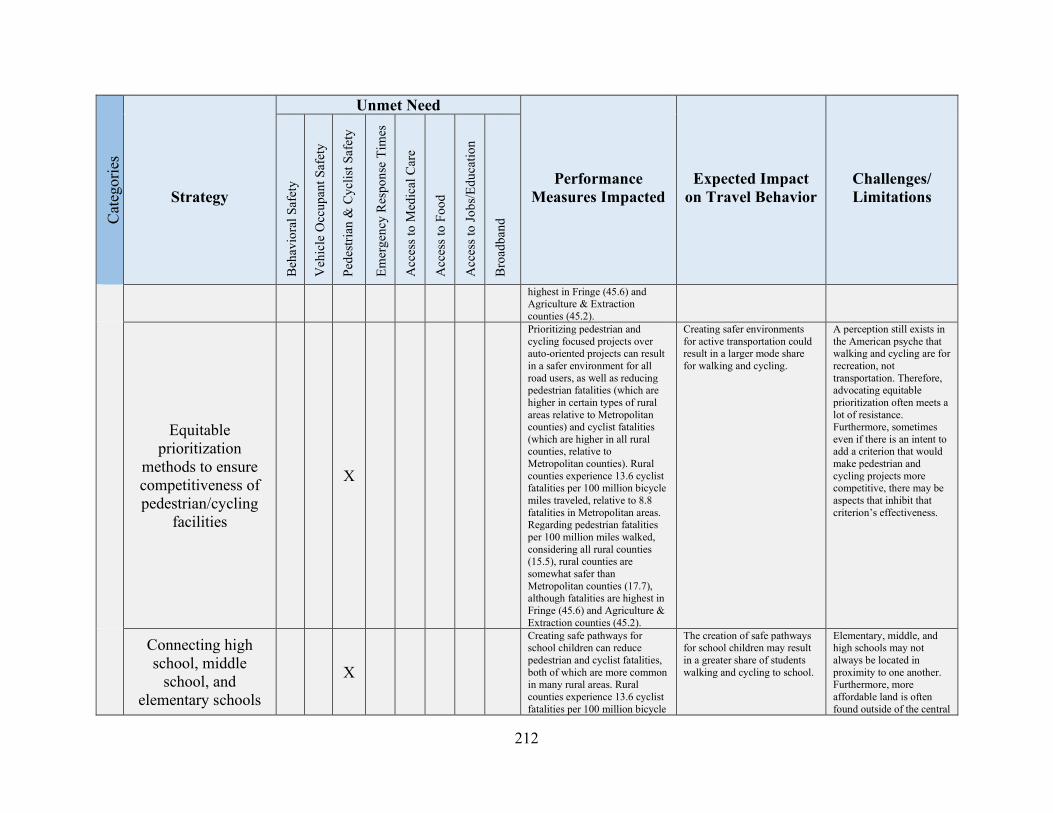
212
Cat
egor
ies
Strategy
Unmet Need
Performance Measures Impacted
Expected Impact on Travel Behavior
Challenges/ Limitations
Beh
avio
ral S
afet
y
Veh
icle
Occ
upan
t Saf
ety
Pede
stria
n &
Cyc
list S
afet
y
Emer
genc
y R
espo
nse
Tim
es
Acc
ess t
o M
edic
al C
are
Acc
ess t
o Fo
od
Acc
ess t
o Jo
bs/E
duca
tion
Bro
adba
nd
highest in Fringe (45.6) and Agriculture & Extraction counties (45.2).
Equitable prioritization
methods to ensure competitiveness of pedestrian/cycling
facilities
X
Prioritizing pedestrian and cycling focused projects over auto-oriented projects can result in a safer environment for all road users, as well as reducing pedestrian fatalities (which are higher in certain types of rural areas relative to Metropolitan counties) and cyclist fatalities (which are higher in all rural counties, relative to Metropolitan counties). Rural counties experience 13.6 cyclist fatalities per 100 million bicycle miles traveled, relative to 8.8 fatalities in Metropolitan areas. Regarding pedestrian fatalities per 100 million miles walked, considering all rural counties (15.5), rural counties are somewhat safer than Metropolitan counties (17.7), although fatalities are highest in Fringe (45.6) and Agriculture & Extraction counties (45.2).
Creating safer environments for active transportation could result in a larger mode share for walking and cycling.
A perception still exists in the American psyche that walking and cycling are for recreation, not transportation. Therefore, advocating equitable prioritization often meets a lot of resistance. Furthermore, sometimes even if there is an intent to add a criterion that would make pedestrian and cycling projects more competitive, there may be aspects that inhibit that criterion’s effectiveness.
Connecting high school, middle
school, and elementary schools
X
Creating safe pathways for school children can reduce pedestrian and cyclist fatalities, both of which are more common in many rural areas. Rural counties experience 13.6 cyclist fatalities per 100 million bicycle
The creation of safe pathways for school children may result in a greater share of students walking and cycling to school.
Elementary, middle, and high schools may not always be located in proximity to one another. Furthermore, more affordable land is often found outside of the central
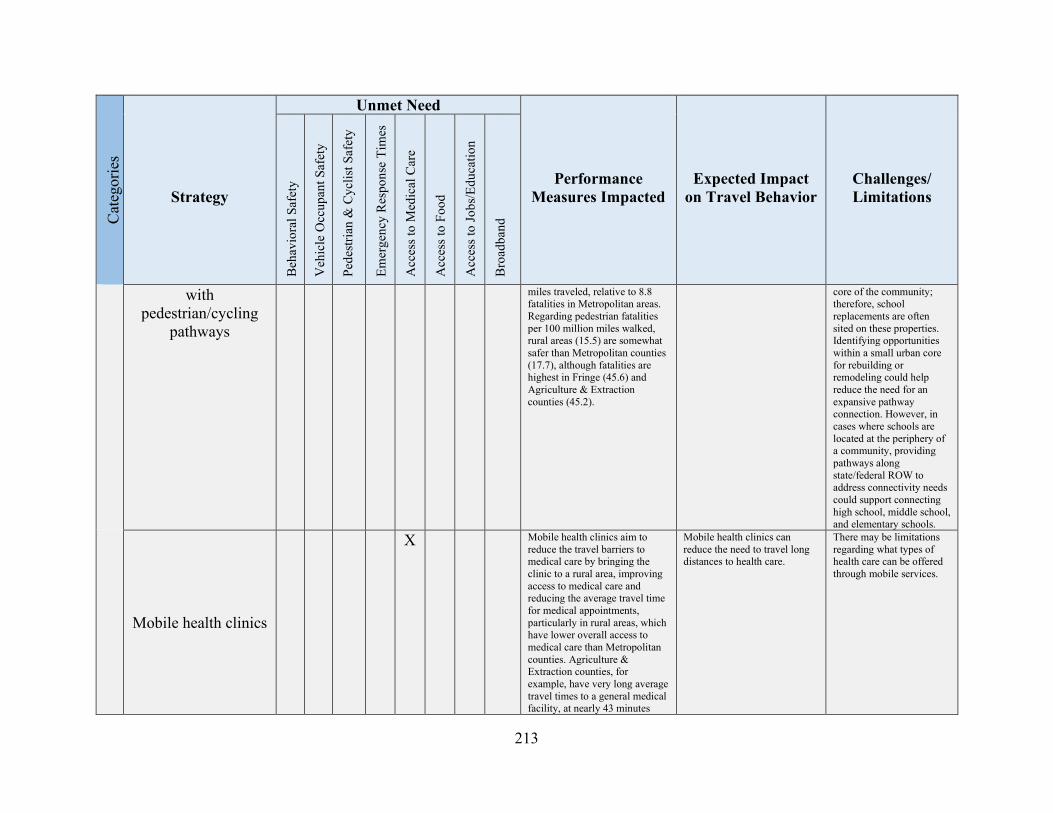
213
Cat
egor
ies
Strategy
Unmet Need
Performance Measures Impacted
Expected Impact on Travel Behavior
Challenges/ Limitations
Beh
avio
ral S
afet
y
Veh
icle
Occ
upan
t Saf
ety
Pede
stria
n &
Cyc
list S
afet
y
Emer
genc
y R
espo
nse
Tim
es
Acc
ess t
o M
edic
al C
are
Acc
ess t
o Fo
od
Acc
ess t
o Jo
bs/E
duca
tion
Bro
adba
nd
with pedestrian/cycling
pathways
miles traveled, relative to 8.8 fatalities in Metropolitan areas. Regarding pedestrian fatalities per 100 million miles walked, rural areas (15.5) are somewhat safer than Metropolitan counties (17.7), although fatalities are highest in Fringe (45.6) and Agriculture & Extraction counties (45.2).
core of the community; therefore, school replacements are often sited on these properties. Identifying opportunities within a small urban core for rebuilding or remodeling could help reduce the need for an expansive pathway connection. However, in cases where schools are located at the periphery of a community, providing pathways along state/federal ROW to address connectivity needs could support connecting high school, middle school, and elementary schools.
Mobile health clinics
X Mobile health clinics aim to reduce the travel barriers to medical care by bringing the clinic to a rural area, improving access to medical care and reducing the average travel time for medical appointments, particularly in rural areas, which have lower overall access to medical care than Metropolitan counties. Agriculture & Extraction counties, for example, have very long average travel times to a general medical facility, at nearly 43 minutes
Mobile health clinics can reduce the need to travel long distances to health care.
There may be limitations regarding what types of health care can be offered through mobile services.
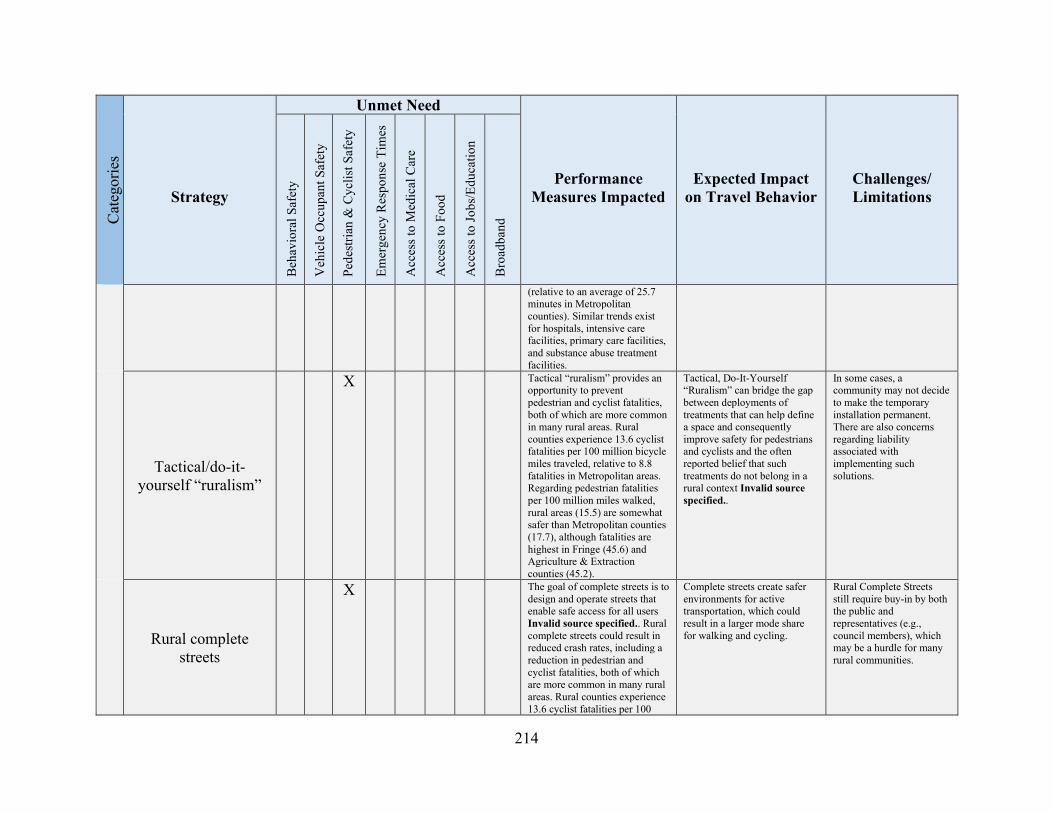
214
Cat
egor
ies
Strategy
Unmet Need
Performance Measures Impacted
Expected Impact on Travel Behavior
Challenges/ Limitations
Beh
avio
ral S
afet
y
Veh
icle
Occ
upan
t Saf
ety
Pede
stria
n &
Cyc
list S
afet
y
Emer
genc
y R
espo
nse
Tim
es
Acc
ess t
o M
edic
al C
are
Acc
ess t
o Fo
od
Acc
ess t
o Jo
bs/E
duca
tion
Bro
adba
nd
(relative to an average of 25.7 minutes in Metropolitan counties). Similar trends exist for hospitals, intensive care facilities, primary care facilities, and substance abuse treatment facilities.
Tactical/do-it-yourself “ruralism”
X Tactical “ruralism” provides an opportunity to prevent pedestrian and cyclist fatalities, both of which are more common in many rural areas. Rural counties experience 13.6 cyclist fatalities per 100 million bicycle miles traveled, relative to 8.8 fatalities in Metropolitan areas. Regarding pedestrian fatalities per 100 million miles walked, rural areas (15.5) are somewhat safer than Metropolitan counties (17.7), although fatalities are highest in Fringe (45.6) and Agriculture & Extraction counties (45.2).
Tactical, Do-It-Yourself “Ruralism” can bridge the gap between deployments of treatments that can help define a space and consequently improve safety for pedestrians and cyclists and the often reported belief that such treatments do not belong in a rural context Invalid source specified..
In some cases, a community may not decide to make the temporary installation permanent. There are also concerns regarding liability associated with implementing such solutions.
Rural complete streets
X The goal of complete streets is to design and operate streets that enable safe access for all users Invalid source specified.. Rural complete streets could result in reduced crash rates, including a reduction in pedestrian and cyclist fatalities, both of which are more common in many rural areas. Rural counties experience 13.6 cyclist fatalities per 100
Complete streets create safer environments for active transportation, which could result in a larger mode share for walking and cycling.
Rural Complete Streets still require buy-in by both the public and representatives (e.g., council members), which may be a hurdle for many rural communities.
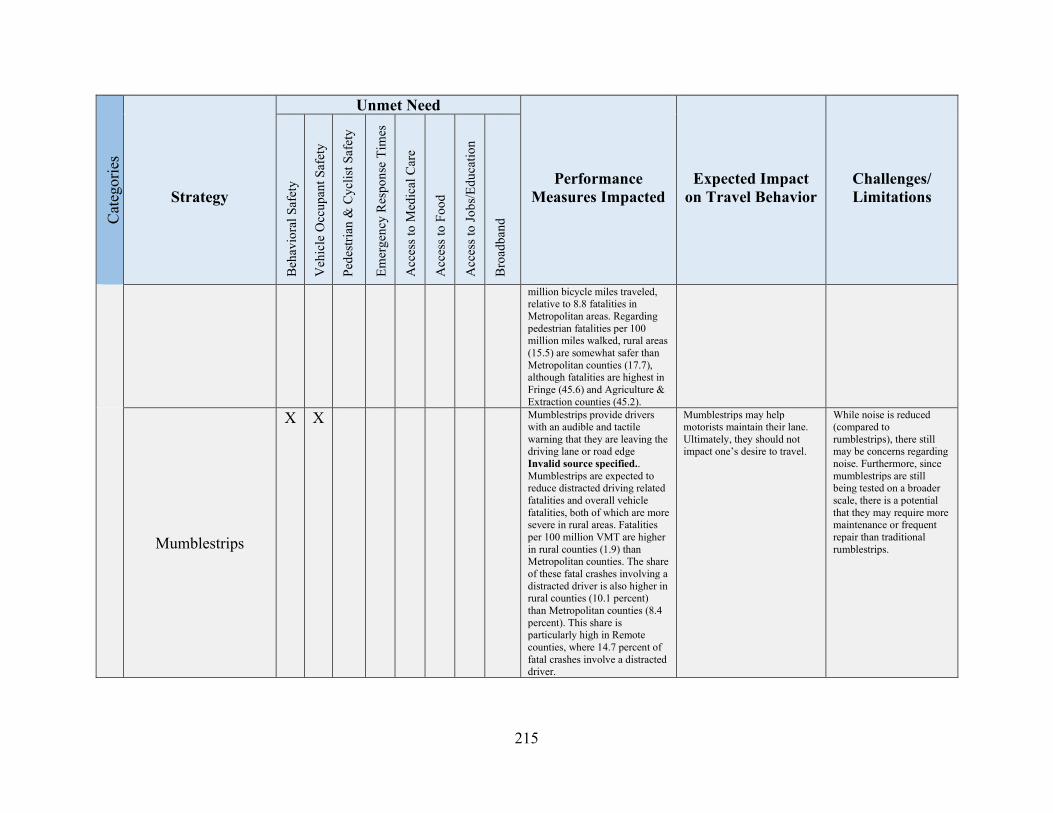
215
Cat
egor
ies
Strategy
Unmet Need
Performance Measures Impacted
Expected Impact on Travel Behavior
Challenges/ Limitations
Beh
avio
ral S
afet
y
Veh
icle
Occ
upan
t Saf
ety
Pede
stria
n &
Cyc
list S
afet
y
Emer
genc
y R
espo
nse
Tim
es
Acc
ess t
o M
edic
al C
are
Acc
ess t
o Fo
od
Acc
ess t
o Jo
bs/E
duca
tion
Bro
adba
nd
million bicycle miles traveled, relative to 8.8 fatalities in Metropolitan areas. Regarding pedestrian fatalities per 100 million miles walked, rural areas (15.5) are somewhat safer than Metropolitan counties (17.7), although fatalities are highest in Fringe (45.6) and Agriculture & Extraction counties (45.2).
Mumblestrips
X X Mumblestrips provide drivers with an audible and tactile warning that they are leaving the driving lane or road edge Invalid source specified.. Mumblestrips are expected to reduce distracted driving related fatalities and overall vehicle fatalities, both of which are more severe in rural areas. Fatalities per 100 million VMT are higher in rural counties (1.9) than Metropolitan counties. The share of these fatal crashes involving a distracted driver is also higher in rural counties (10.1 percent) than Metropolitan counties (8.4 percent). This share is particularly high in Remote counties, where 14.7 percent of fatal crashes involve a distracted driver.
Mumblestrips may help motorists maintain their lane. Ultimately, they should not impact one’s desire to travel.
While noise is reduced (compared to rumblestrips), there still may be concerns regarding noise. Furthermore, since mumblestrips are still being tested on a broader scale, there is a potential that they may require more maintenance or frequent repair than traditional rumblestrips.
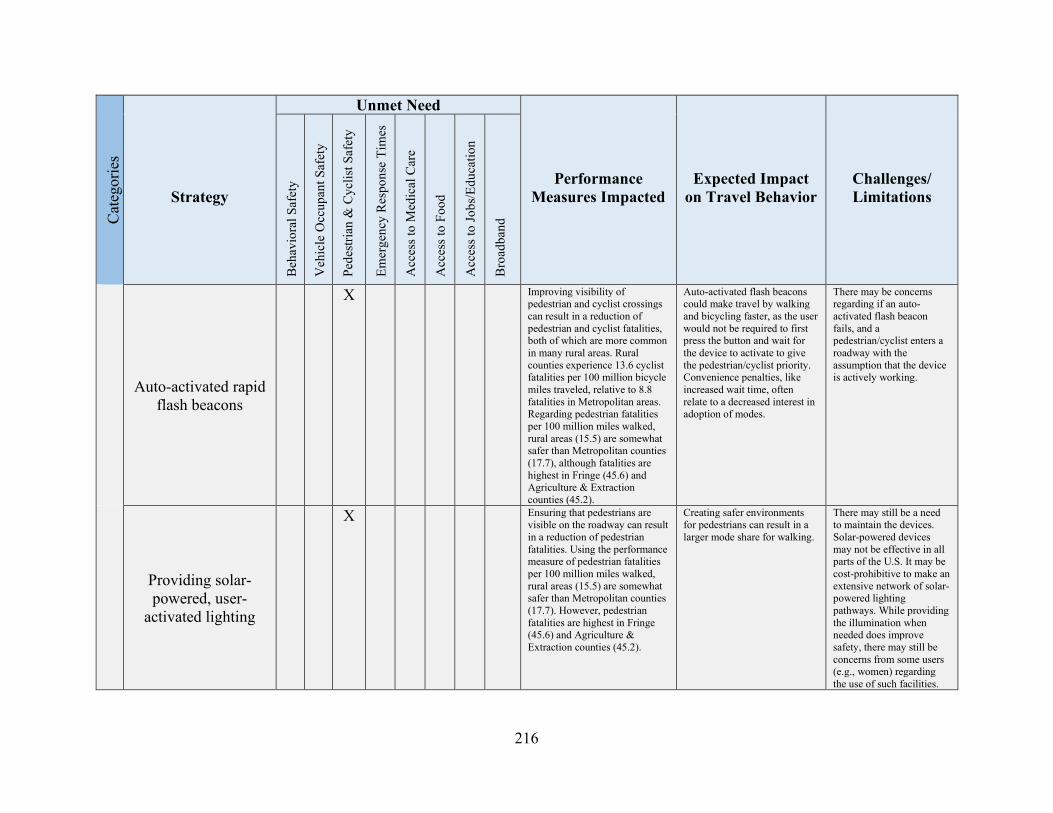
216
Cat
egor
ies
Strategy
Unmet Need
Performance Measures Impacted
Expected Impact on Travel Behavior
Challenges/ Limitations
Beh
avio
ral S
afet
y
Veh
icle
Occ
upan
t Saf
ety
Pede
stria
n &
Cyc
list S
afet
y
Emer
genc
y R
espo
nse
Tim
es
Acc
ess t
o M
edic
al C
are
Acc
ess t
o Fo
od
Acc
ess t
o Jo
bs/E
duca
tion
Bro
adba
nd
Auto-activated rapid flash beacons
X Improving visibility of pedestrian and cyclist crossings can result in a reduction of pedestrian and cyclist fatalities, both of which are more common in many rural areas. Rural counties experience 13.6 cyclist fatalities per 100 million bicycle miles traveled, relative to 8.8 fatalities in Metropolitan areas. Regarding pedestrian fatalities per 100 million miles walked, rural areas (15.5) are somewhat safer than Metropolitan counties (17.7), although fatalities are highest in Fringe (45.6) and Agriculture & Extraction counties (45.2).
Auto-activated flash beacons could make travel by walking and bicycling faster, as the user would not be required to first press the button and wait for the device to activate to give the pedestrian/cyclist priority. Convenience penalties, like increased wait time, often relate to a decreased interest in adoption of modes.
There may be concerns regarding if an auto-activated flash beacon fails, and a pedestrian/cyclist enters a roadway with the assumption that the device is actively working.
Providing solar-powered, user-
activated lighting
X Ensuring that pedestrians are visible on the roadway can result in a reduction of pedestrian fatalities. Using the performance measure of pedestrian fatalities per 100 million miles walked, rural areas (15.5) are somewhat safer than Metropolitan counties (17.7). However, pedestrian fatalities are highest in Fringe (45.6) and Agriculture & Extraction counties (45.2).
Creating safer environments for pedestrians can result in a larger mode share for walking.
There may still be a need to maintain the devices. Solar-powered devices may not be effective in all parts of the U.S. It may be cost-prohibitive to make an extensive network of solar-powered lighting pathways. While providing the illumination when needed does improve safety, there may still be concerns from some users (e.g., women) regarding the use of such facilities.
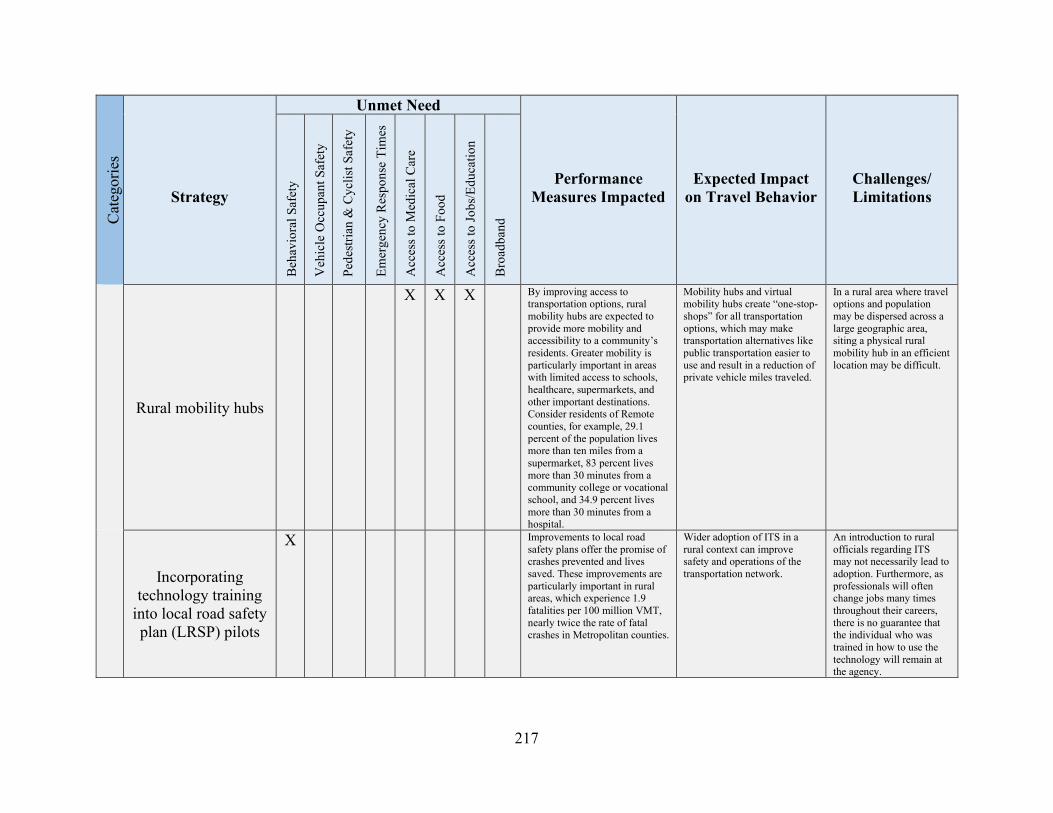
217
Cat
egor
ies
Strategy
Unmet Need
Performance Measures Impacted
Expected Impact on Travel Behavior
Challenges/ Limitations
Beh
avio
ral S
afet
y
Veh
icle
Occ
upan
t Saf
ety
Pede
stria
n &
Cyc
list S
afet
y
Emer
genc
y R
espo
nse
Tim
es
Acc
ess t
o M
edic
al C
are
Acc
ess t
o Fo
od
Acc
ess t
o Jo
bs/E
duca
tion
Bro
adba
nd
Rural mobility hubs
X X X By improving access to transportation options, rural mobility hubs are expected to provide more mobility and accessibility to a community’s residents. Greater mobility is particularly important in areas with limited access to schools, healthcare, supermarkets, and other important destinations. Consider residents of Remote counties, for example, 29.1 percent of the population lives more than ten miles from a supermarket, 83 percent lives more than 30 minutes from a community college or vocational school, and 34.9 percent lives more than 30 minutes from a hospital.
Mobility hubs and virtual mobility hubs create “one-stop-shops” for all transportation options, which may make transportation alternatives like public transportation easier to use and result in a reduction of private vehicle miles traveled.
In a rural area where travel options and population may be dispersed across a large geographic area, siting a physical rural mobility hub in an efficient location may be difficult.
Incorporating technology training
into local road safety plan (LRSP) pilots
X Improvements to local road safety plans offer the promise of crashes prevented and lives saved. These improvements are particularly important in rural areas, which experience 1.9 fatalities per 100 million VMT, nearly twice the rate of fatal crashes in Metropolitan counties.
Wider adoption of ITS in a rural context can improve safety and operations of the transportation network.
An introduction to rural officials regarding ITS may not necessarily lead to adoption. Furthermore, as professionals will often change jobs many times throughout their careers, there is no guarantee that the individual who was trained in how to use the technology will remain at the agency.
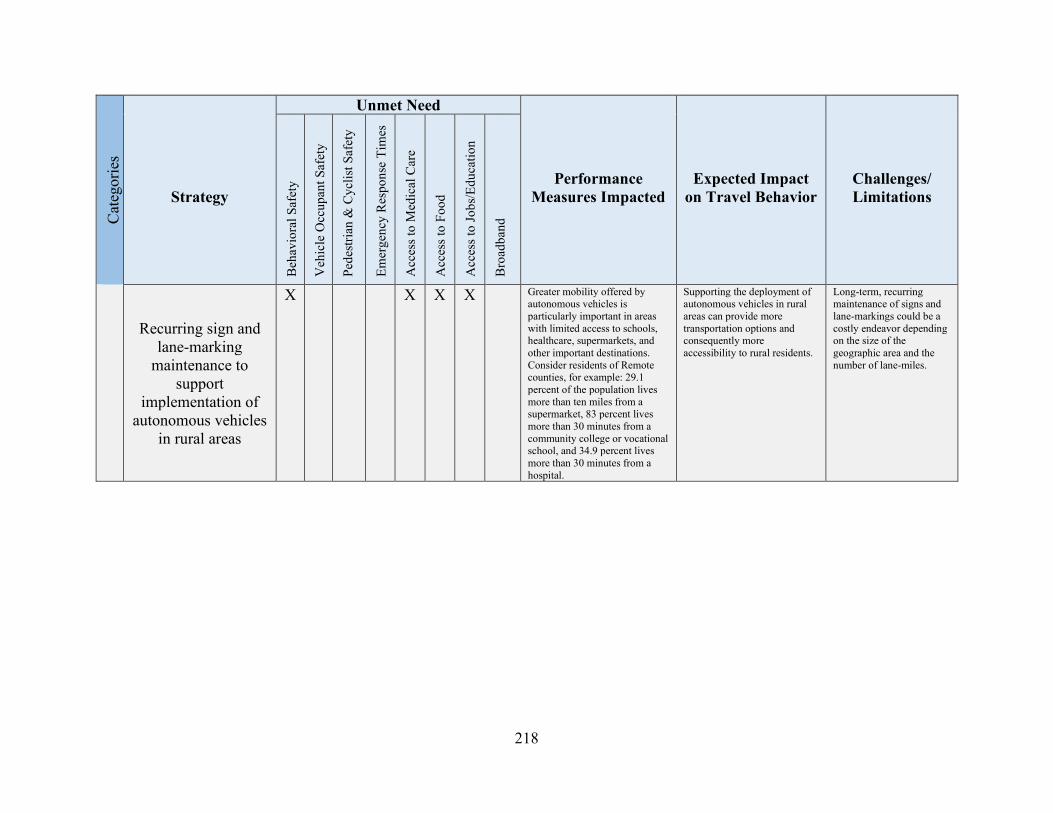
218
Cat
egor
ies
Strategy
Unmet Need
Performance Measures Impacted
Expected Impact on Travel Behavior
Challenges/ Limitations
Beh
avio
ral S
afet
y
Veh
icle
Occ
upan
t Saf
ety
Pede
stria
n &
Cyc
list S
afet
y
Emer
genc
y R
espo
nse
Tim
es
Acc
ess t
o M
edic
al C
are
Acc
ess t
o Fo
od
Acc
ess t
o Jo
bs/E
duca
tion
Bro
adba
nd
Recurring sign and lane-marking
maintenance to support
implementation of autonomous vehicles
in rural areas
X X X X Greater mobility offered by autonomous vehicles is particularly important in areas with limited access to schools, healthcare, supermarkets, and other important destinations. Consider residents of Remote counties, for example: 29.1 percent of the population lives more than ten miles from a supermarket, 83 percent lives more than 30 minutes from a community college or vocational school, and 34.9 percent lives more than 30 minutes from a hospital.
Supporting the deployment of autonomous vehicles in rural areas can provide more transportation options and consequently more accessibility to rural residents.
Long-term, recurring maintenance of signs and lane-markings could be a costly endeavor depending on the size of the geographic area and the number of lane-miles.
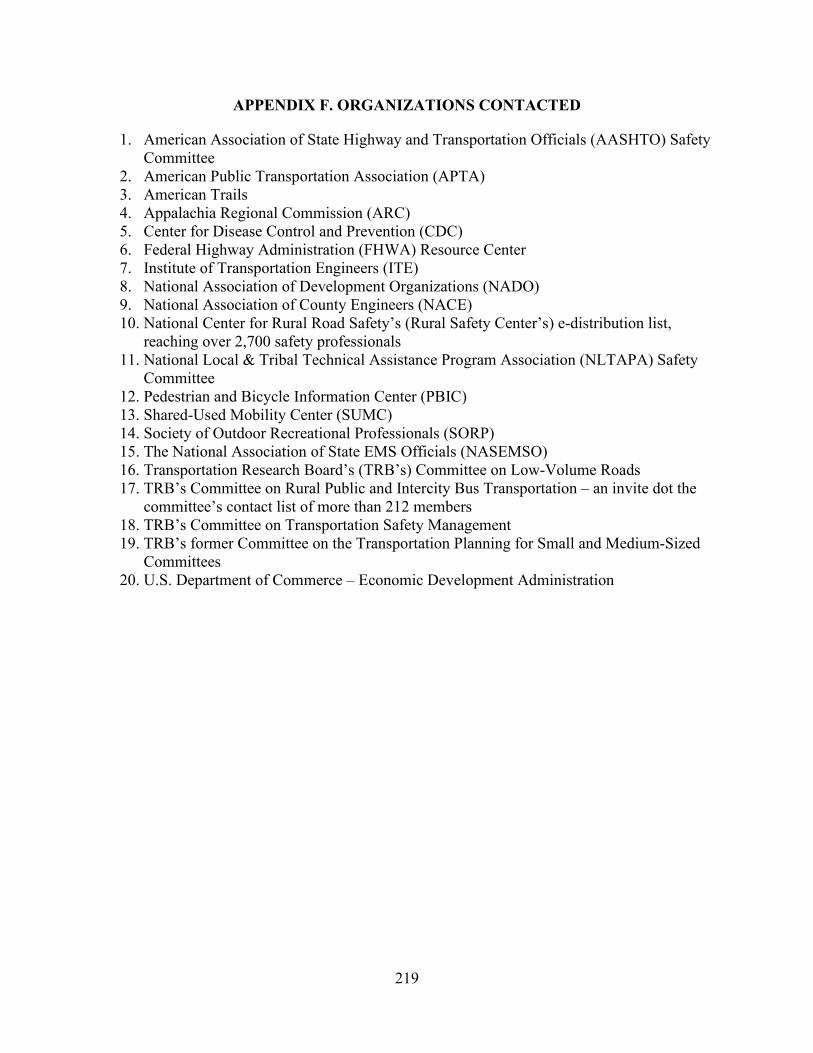
219
APPENDIX F. ORGANIZATIONS CONTACTED
1. American Association of State Highway and Transportation Officials (AASHTO) Safety Committee
2. American Public Transportation Association (APTA) 3. American Trails 4. Appalachia Regional Commission (ARC) 5. Center for Disease Control and Prevention (CDC) 6. Federal Highway Administration (FHWA) Resource Center 7. Institute of Transportation Engineers (ITE) 8. National Association of Development Organizations (NADO) 9. National Association of County Engineers (NACE) 10. National Center for Rural Road Safety’s (Rural Safety Center’s) e-distribution list,
reaching over 2,700 safety professionals 11. National Local & Tribal Technical Assistance Program Association (NLTAPA) Safety
Committee 12. Pedestrian and Bicycle Information Center (PBIC) 13. Shared-Used Mobility Center (SUMC) 14. Society of Outdoor Recreational Professionals (SORP) 15. The National Association of State EMS Officials (NASEMSO) 16. Transportation Research Board’s (TRB’s) Committee on Low-Volume Roads 17. TRB’s Committee on Rural Public and Intercity Bus Transportation – an invite dot the
committee’s contact list of more than 212 members 18. TRB’s Committee on Transportation Safety Management 19. TRB’s former Committee on the Transportation Planning for Small and Medium-Sized
Committees 20. U.S. Department of Commerce – Economic Development Administration
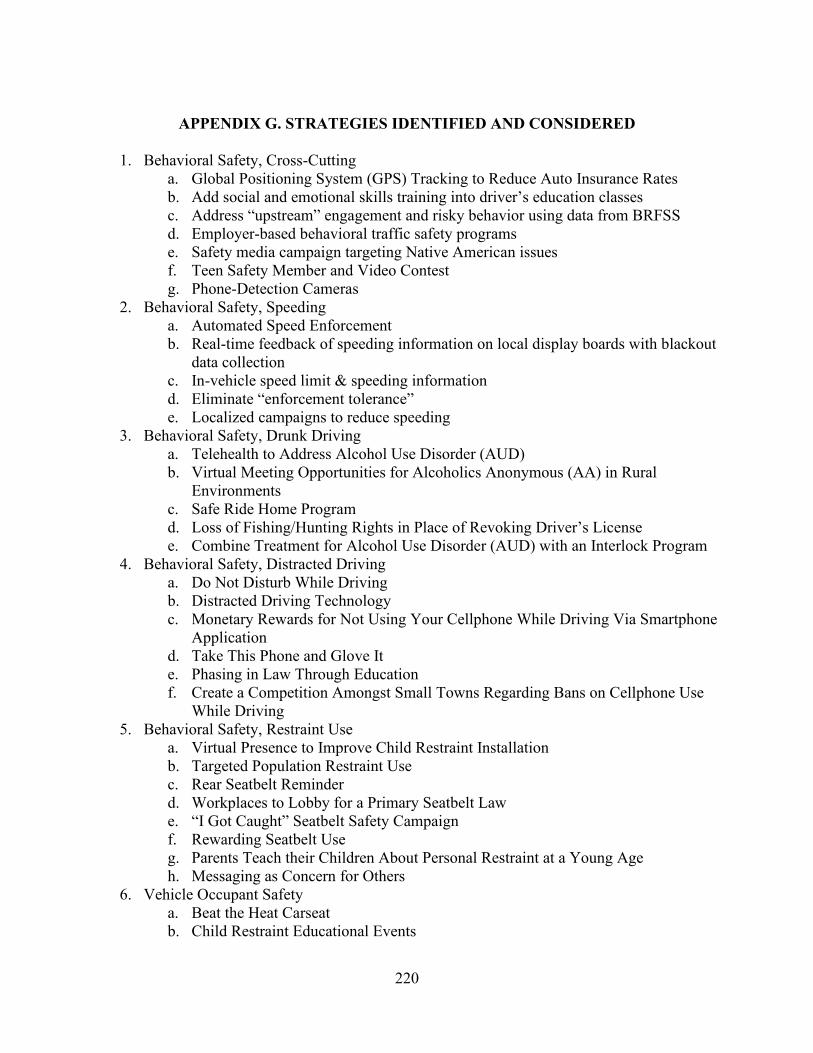
220
APPENDIX G. STRATEGIES IDENTIFIED AND CONSIDERED
1. Behavioral Safety, Cross-Cutting
a. Global Positioning System (GPS) Tracking to Reduce Auto Insurance Rates b. Add social and emotional skills training into driver’s education classes c. Address “upstream” engagement and risky behavior using data from BRFSS d. Employer-based behavioral traffic safety programs e. Safety media campaign targeting Native American issues f. Teen Safety Member and Video Contest g. Phone-Detection Cameras
2. Behavioral Safety, Speeding a. Automated Speed Enforcement b. Real-time feedback of speeding information on local display boards with blackout
data collection c. In-vehicle speed limit & speeding information d. Eliminate “enforcement tolerance” e. Localized campaigns to reduce speeding
3. Behavioral Safety, Drunk Driving a. Telehealth to Address Alcohol Use Disorder (AUD) b. Virtual Meeting Opportunities for Alcoholics Anonymous (AA) in Rural
Environments c. Safe Ride Home Program d. Loss of Fishing/Hunting Rights in Place of Revoking Driver’s License e. Combine Treatment for Alcohol Use Disorder (AUD) with an Interlock Program
4. Behavioral Safety, Distracted Driving a. Do Not Disturb While Driving b. Distracted Driving Technology c. Monetary Rewards for Not Using Your Cellphone While Driving Via Smartphone
Application d. Take This Phone and Glove It e. Phasing in Law Through Education f. Create a Competition Amongst Small Towns Regarding Bans on Cellphone Use
While Driving 5. Behavioral Safety, Restraint Use
a. Virtual Presence to Improve Child Restraint Installation b. Targeted Population Restraint Use c. Rear Seatbelt Reminder d. Workplaces to Lobby for a Primary Seatbelt Law e. “I Got Caught” Seatbelt Safety Campaign f. Rewarding Seatbelt Use g. Parents Teach their Children About Personal Restraint at a Young Age h. Messaging as Concern for Others
6. Vehicle Occupant Safety a. Beat the Heat Carseat b. Child Restraint Educational Events
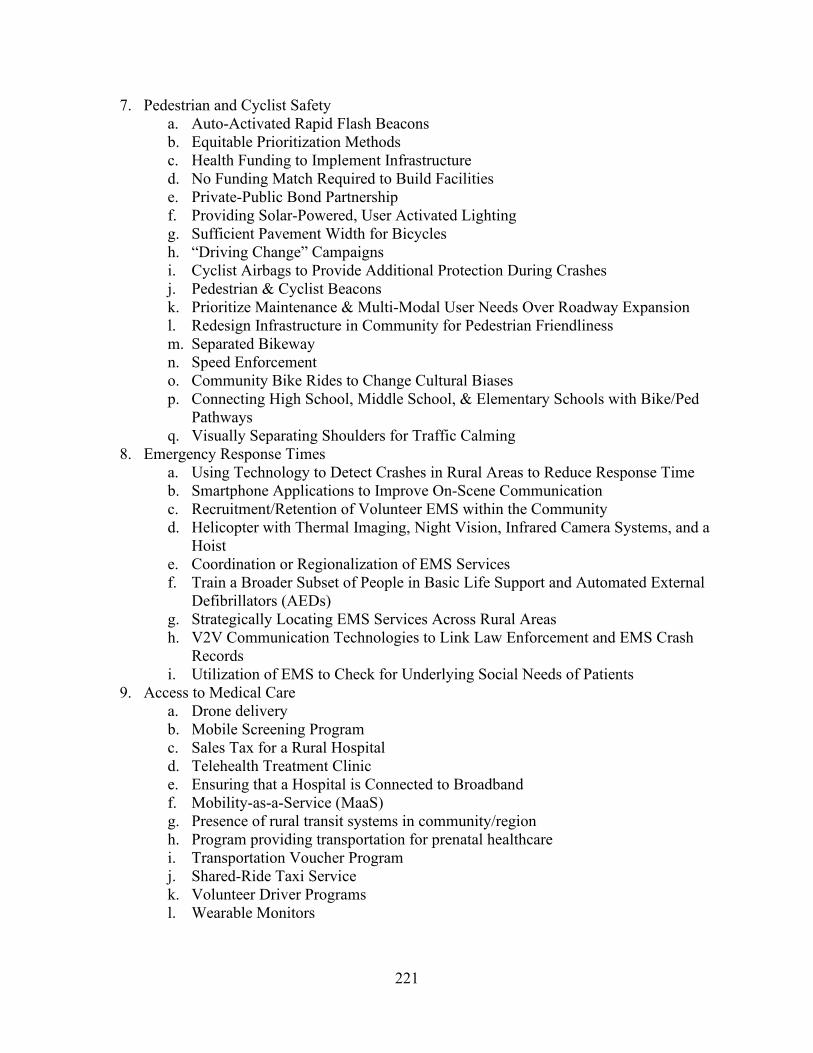
221
7. Pedestrian and Cyclist Safety a. Auto-Activated Rapid Flash Beacons b. Equitable Prioritization Methods c. Health Funding to Implement Infrastructure d. No Funding Match Required to Build Facilities e. Private-Public Bond Partnership f. Providing Solar-Powered, User Activated Lighting g. Sufficient Pavement Width for Bicycles h. “Driving Change” Campaigns i. Cyclist Airbags to Provide Additional Protection During Crashes j. Pedestrian & Cyclist Beacons k. Prioritize Maintenance & Multi-Modal User Needs Over Roadway Expansion l. Redesign Infrastructure in Community for Pedestrian Friendliness m. Separated Bikeway n. Speed Enforcement o. Community Bike Rides to Change Cultural Biases p. Connecting High School, Middle School, & Elementary Schools with Bike/Ped
Pathways q. Visually Separating Shoulders for Traffic Calming
8. Emergency Response Times a. Using Technology to Detect Crashes in Rural Areas to Reduce Response Time b. Smartphone Applications to Improve On-Scene Communication c. Recruitment/Retention of Volunteer EMS within the Community d. Helicopter with Thermal Imaging, Night Vision, Infrared Camera Systems, and a
Hoist e. Coordination or Regionalization of EMS Services f. Train a Broader Subset of People in Basic Life Support and Automated External
Defibrillators (AEDs) g. Strategically Locating EMS Services Across Rural Areas h. V2V Communication Technologies to Link Law Enforcement and EMS Crash
Records i. Utilization of EMS to Check for Underlying Social Needs of Patients
9. Access to Medical Care a. Drone delivery b. Mobile Screening Program c. Sales Tax for a Rural Hospital d. Telehealth Treatment Clinic e. Ensuring that a Hospital is Connected to Broadband f. Mobility-as-a-Service (MaaS) g. Presence of rural transit systems in community/region h. Program providing transportation for prenatal healthcare i. Transportation Voucher Program j. Shared-Ride Taxi Service k. Volunteer Driver Programs l. Wearable Monitors
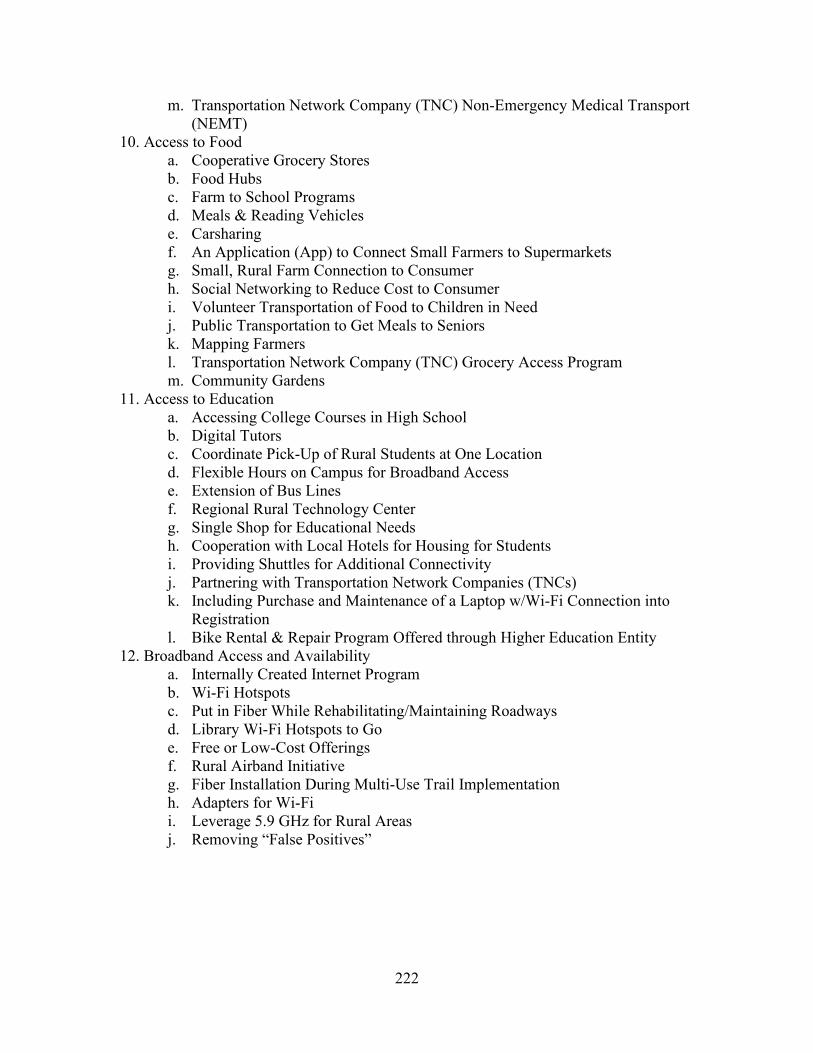
222
m. Transportation Network Company (TNC) Non-Emergency Medical Transport (NEMT)
10. Access to Food a. Cooperative Grocery Stores b. Food Hubs c. Farm to School Programs d. Meals & Reading Vehicles e. Carsharing f. An Application (App) to Connect Small Farmers to Supermarkets g. Small, Rural Farm Connection to Consumer h. Social Networking to Reduce Cost to Consumer i. Volunteer Transportation of Food to Children in Need j. Public Transportation to Get Meals to Seniors k. Mapping Farmers l. Transportation Network Company (TNC) Grocery Access Program m. Community Gardens
11. Access to Education a. Accessing College Courses in High School b. Digital Tutors c. Coordinate Pick-Up of Rural Students at One Location d. Flexible Hours on Campus for Broadband Access e. Extension of Bus Lines f. Regional Rural Technology Center g. Single Shop for Educational Needs h. Cooperation with Local Hotels for Housing for Students i. Providing Shuttles for Additional Connectivity j. Partnering with Transportation Network Companies (TNCs) k. Including Purchase and Maintenance of a Laptop w/Wi-Fi Connection into
Registration l. Bike Rental & Repair Program Offered through Higher Education Entity
12. Broadband Access and Availability a. Internally Created Internet Program b. Wi-Fi Hotspots c. Put in Fiber While Rehabilitating/Maintaining Roadways d. Library Wi-Fi Hotspots to Go e. Free or Low-Cost Offerings f. Rural Airband Initiative g. Fiber Installation During Multi-Use Trail Implementation h. Adapters for Wi-Fi i. Leverage 5.9 GHz for Rural Areas j. Removing “False Positives”
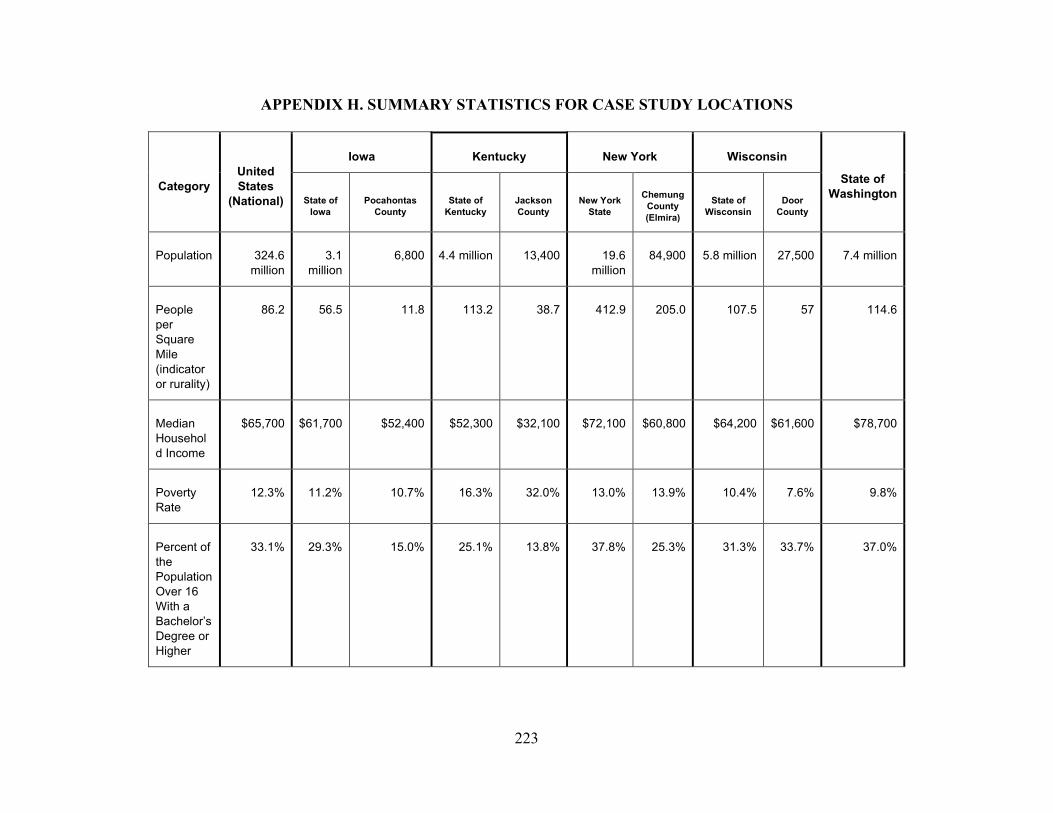
223
APPENDIX H. SUMMARY STATISTICS FOR CASE STUDY LOCATIONS
Category United States
(National)
Iowa Kentucky New York Wisconsin
State of Washington State of
Iowa Pocahontas
County State of
Kentucky Jackson County
New York State
Chemung County (Elmira)
State of Wisconsin
Door County
Population 324.6 million
3.1 million
6,800 4.4 million 13,400 19.6 million
84,900 5.8 million 27,500 7.4 million
People per Square Mile (indicator or rurality)
86.2 56.5 11.8 113.2 38.7 412.9 205.0 107.5 57 114.6
Median Household Income
$65,700 $61,700 $52,400 $52,300 $32,100 $72,100 $60,800 $64,200 $61,600 $78,700
Poverty Rate
12.3% 11.2% 10.7% 16.3% 32.0% 13.0% 13.9% 10.4% 7.6% 9.8%
Percent of the Population Over 16 With a Bachelor’s Degree or Higher
33.1% 29.3% 15.0% 25.1% 13.8% 37.8% 25.3% 31.3% 33.7% 37.0%
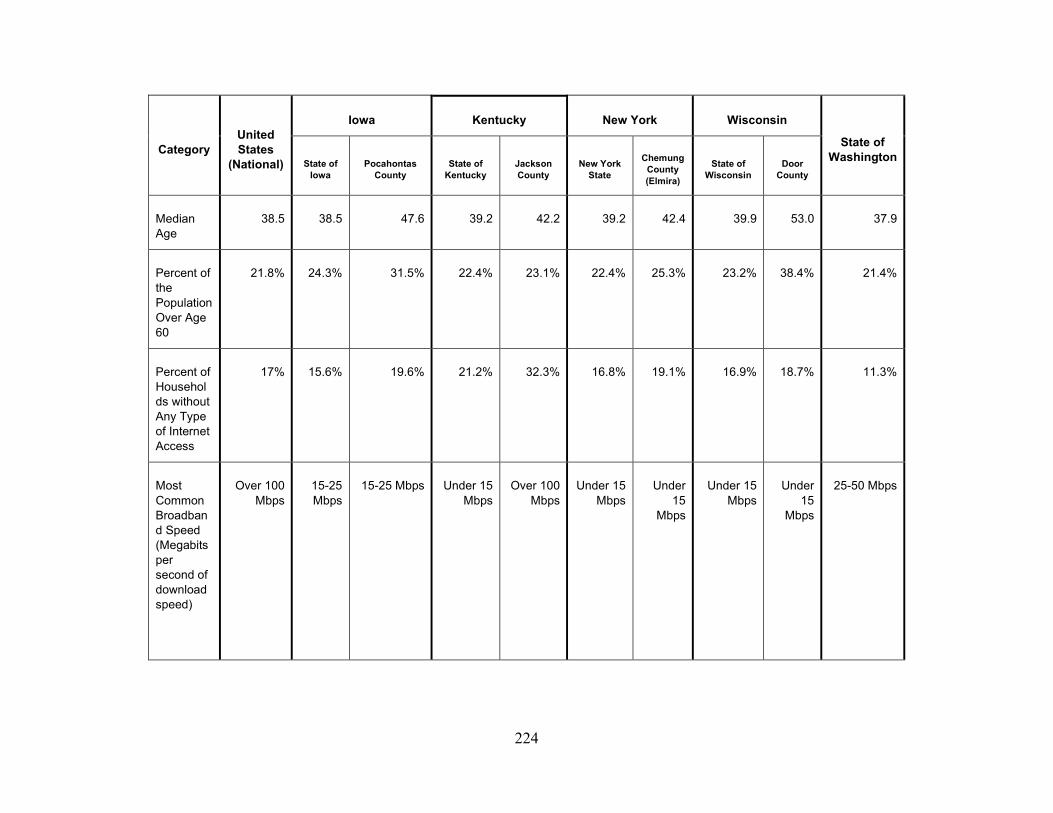
224
Category United States
(National)
Iowa Kentucky New York Wisconsin
State of Washington State of
Iowa Pocahontas
County State of
Kentucky Jackson County
New York State
Chemung County (Elmira)
State of Wisconsin
Door County
Median Age
38.5 38.5 47.6 39.2 42.2 39.2 42.4 39.9 53.0 37.9
Percent of the Population Over Age 60
21.8% 24.3% 31.5% 22.4% 23.1% 22.4% 25.3% 23.2% 38.4% 21.4%
Percent of Households without Any Type of Internet Access
17% 15.6% 19.6% 21.2% 32.3% 16.8% 19.1% 16.9% 18.7% 11.3%
Most Common Broadband Speed (Megabits per second of download speed)
Over 100 Mbps
15-25 Mbps
15-25 Mbps Under 15 Mbps
Over 100 Mbps
Under 15 Mbps
Under 15
Mbps
Under 15 Mbps
Under 15
Mbps
25-50 Mbps
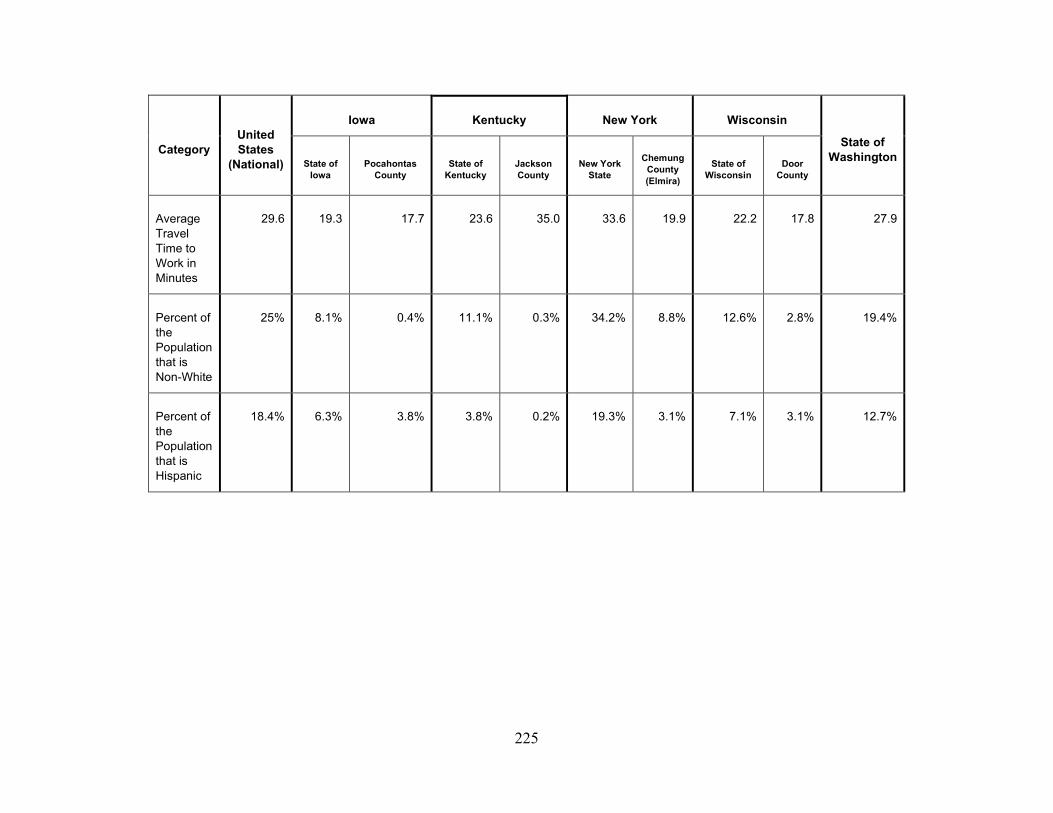
225
Category United States
(National)
Iowa Kentucky New York Wisconsin
State of Washington State of
Iowa Pocahontas
County State of
Kentucky Jackson County
New York State
Chemung County (Elmira)
State of Wisconsin
Door County
Average Travel Time to Work in Minutes
29.6 19.3 17.7 23.6 35.0 33.6 19.9 22.2 17.8 27.9
Percent of the Population that is Non-White
25% 8.1% 0.4% 11.1% 0.3% 34.2% 8.8% 12.6% 2.8% 19.4%
Percent of the Population that is Hispanic
18.4% 6.3% 3.8% 3.8% 0.2% 19.3% 3.1% 7.1% 3.1% 12.7%
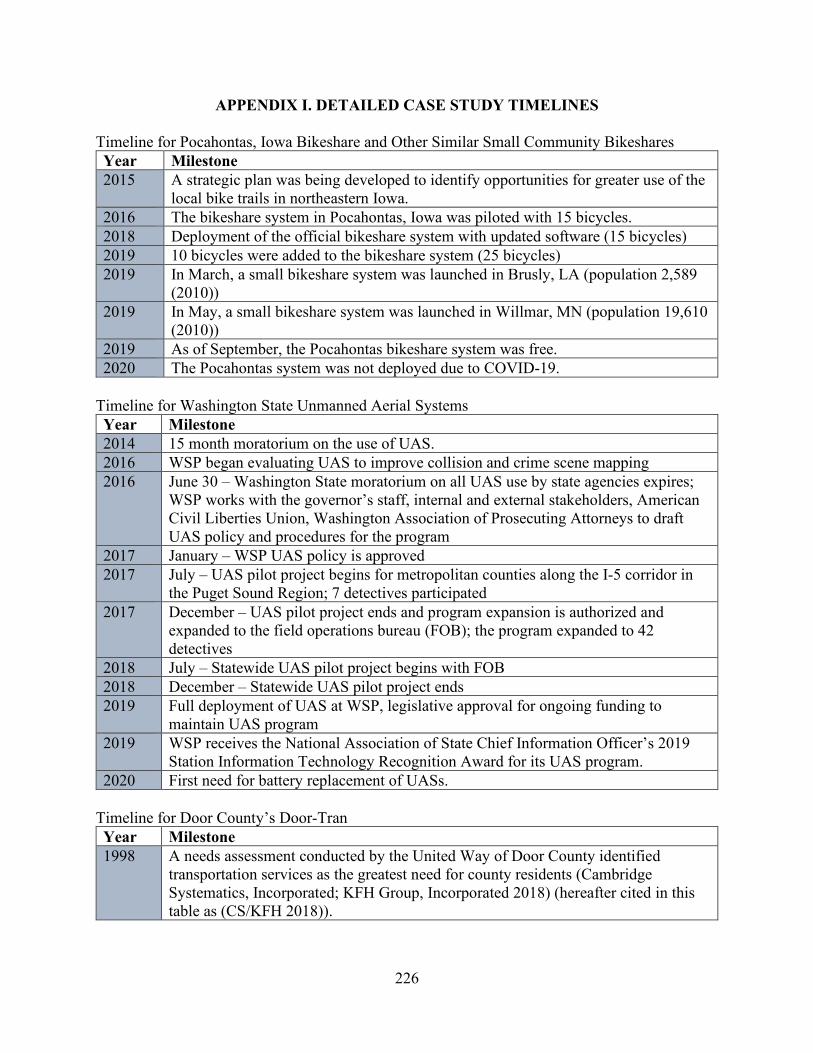
226
APPENDIX I. DETAILED CASE STUDY TIMELINES Timeline for Pocahontas, Iowa Bikeshare and Other Similar Small Community Bikeshares Year Milestone 2015 A strategic plan was being developed to identify opportunities for greater use of the
local bike trails in northeastern Iowa. 2016 The bikeshare system in Pocahontas, Iowa was piloted with 15 bicycles. 2018 Deployment of the official bikeshare system with updated software (15 bicycles) 2019 10 bicycles were added to the bikeshare system (25 bicycles) 2019 In March, a small bikeshare system was launched in Brusly, LA (population 2,589
(2010)) 2019 In May, a small bikeshare system was launched in Willmar, MN (population 19,610
(2010)) 2019 As of September, the Pocahontas bikeshare system was free. 2020 The Pocahontas system was not deployed due to COVID-19.
Timeline for Washington State Unmanned Aerial Systems Year Milestone 2014 15 month moratorium on the use of UAS. 2016 WSP began evaluating UAS to improve collision and crime scene mapping 2016 June 30 – Washington State moratorium on all UAS use by state agencies expires;
WSP works with the governor’s staff, internal and external stakeholders, American Civil Liberties Union, Washington Association of Prosecuting Attorneys to draft UAS policy and procedures for the program
2017 January – WSP UAS policy is approved 2017 July – UAS pilot project begins for metropolitan counties along the I-5 corridor in
the Puget Sound Region; 7 detectives participated 2017 December – UAS pilot project ends and program expansion is authorized and
expanded to the field operations bureau (FOB); the program expanded to 42 detectives
2018 July – Statewide UAS pilot project begins with FOB 2018 December – Statewide UAS pilot project ends 2019 Full deployment of UAS at WSP, legislative approval for ongoing funding to
maintain UAS program 2019 WSP receives the National Association of State Chief Information Officer’s 2019
Station Information Technology Recognition Award for its UAS program. 2020 First need for battery replacement of UASs.
Timeline for Door County’s Door-Tran Year Milestone 1998 A needs assessment conducted by the United Way of Door County identified
transportation services as the greatest need for county residents (Cambridge Systematics, Incorporated; KFH Group, Incorporated 2018) (hereafter cited in this table as (CS/KFH 2018)).
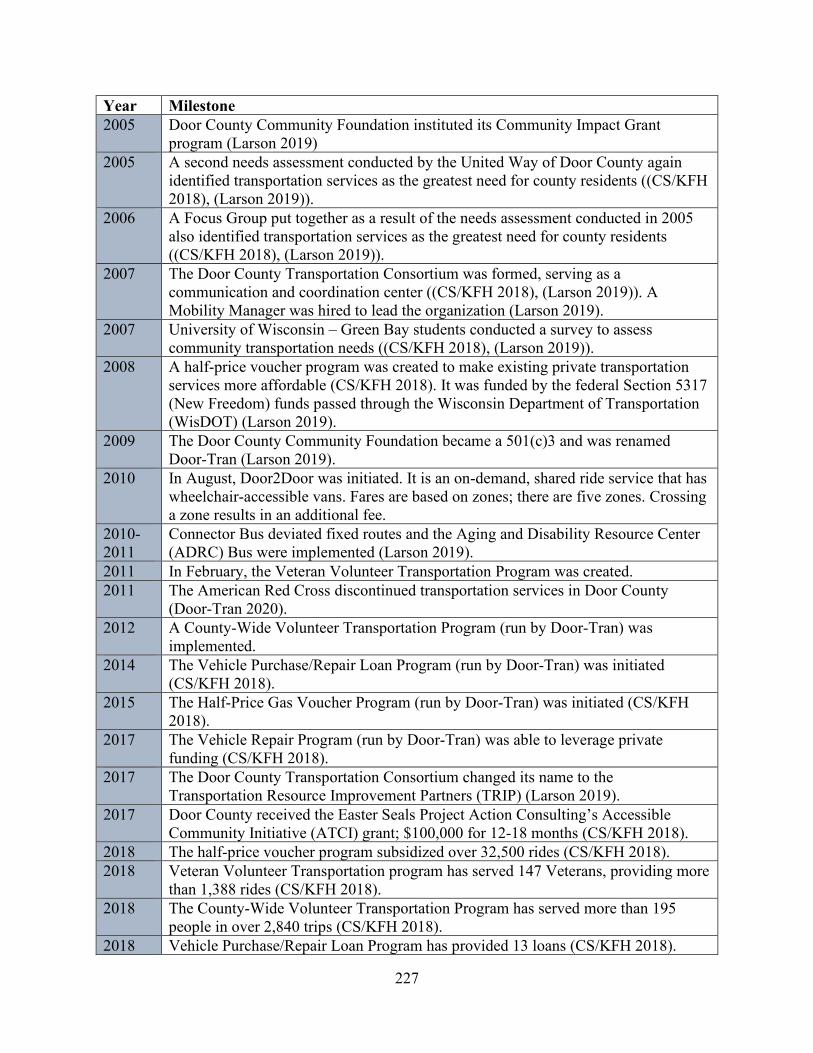
227
Year Milestone 2005 Door County Community Foundation instituted its Community Impact Grant
program (Larson 2019) 2005 A second needs assessment conducted by the United Way of Door County again
identified transportation services as the greatest need for county residents ((CS/KFH 2018), (Larson 2019)).
2006 A Focus Group put together as a result of the needs assessment conducted in 2005 also identified transportation services as the greatest need for county residents ((CS/KFH 2018), (Larson 2019)).
2007 The Door County Transportation Consortium was formed, serving as a communication and coordination center ((CS/KFH 2018), (Larson 2019)). A Mobility Manager was hired to lead the organization (Larson 2019).
2007 University of Wisconsin – Green Bay students conducted a survey to assess community transportation needs ((CS/KFH 2018), (Larson 2019)).
2008 A half-price voucher program was created to make existing private transportation services more affordable (CS/KFH 2018). It was funded by the federal Section 5317 (New Freedom) funds passed through the Wisconsin Department of Transportation (WisDOT) (Larson 2019).
2009 The Door County Community Foundation became a 501(c)3 and was renamed Door-Tran (Larson 2019).
2010 In August, Door2Door was initiated. It is an on-demand, shared ride service that has wheelchair-accessible vans. Fares are based on zones; there are five zones. Crossing a zone results in an additional fee.
2010-2011
Connector Bus deviated fixed routes and the Aging and Disability Resource Center (ADRC) Bus were implemented (Larson 2019).
2011 In February, the Veteran Volunteer Transportation Program was created. 2011 The American Red Cross discontinued transportation services in Door County
(Door-Tran 2020). 2012 A County-Wide Volunteer Transportation Program (run by Door-Tran) was
implemented. 2014 The Vehicle Purchase/Repair Loan Program (run by Door-Tran) was initiated
(CS/KFH 2018). 2015 The Half-Price Gas Voucher Program (run by Door-Tran) was initiated (CS/KFH
2018). 2017 The Vehicle Repair Program (run by Door-Tran) was able to leverage private
funding (CS/KFH 2018). 2017 The Door County Transportation Consortium changed its name to the
Transportation Resource Improvement Partners (TRIP) (Larson 2019). 2017 Door County received the Easter Seals Project Action Consulting’s Accessible
Community Initiative (ATCI) grant; $100,000 for 12-18 months (CS/KFH 2018). 2018 The half-price voucher program subsidized over 32,500 rides (CS/KFH 2018). 2018 Veteran Volunteer Transportation program has served 147 Veterans, providing more
than 1,388 rides (CS/KFH 2018). 2018 The County-Wide Volunteer Transportation Program has served more than 195
people in over 2,840 trips (CS/KFH 2018). 2018 Vehicle Purchase/Repair Loan Program has provided 13 loans (CS/KFH 2018).
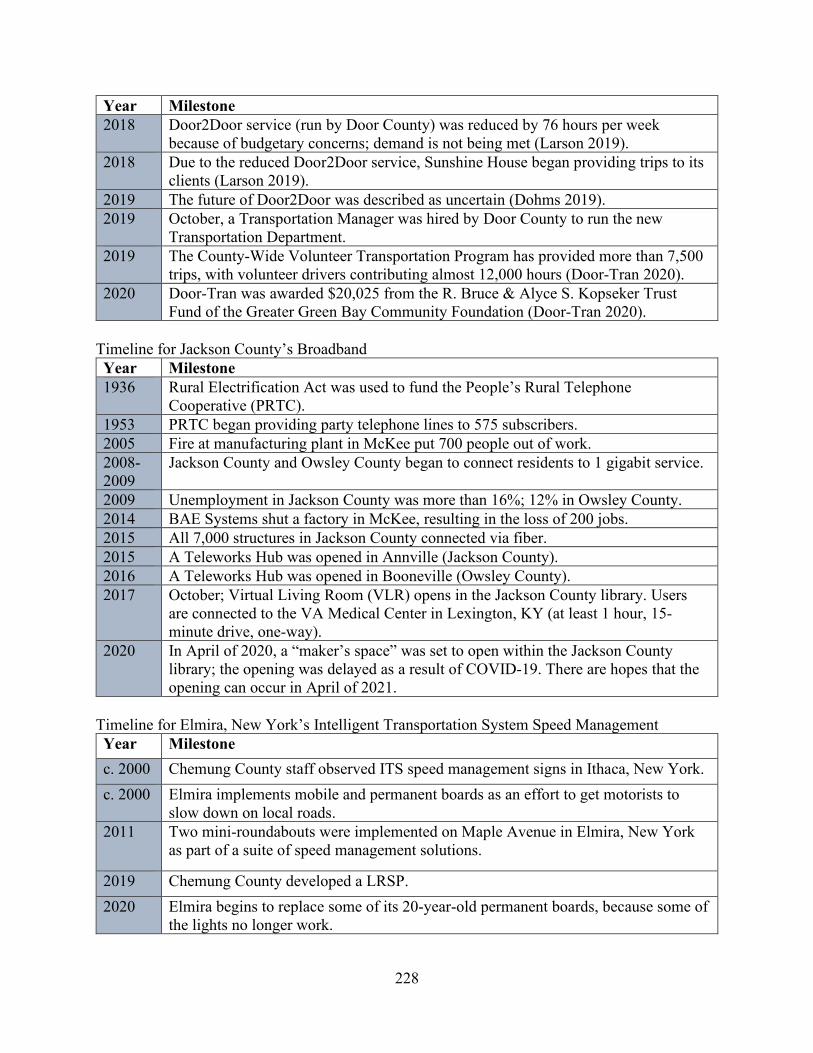
228
Year Milestone 2018 Door2Door service (run by Door County) was reduced by 76 hours per week
because of budgetary concerns; demand is not being met (Larson 2019). 2018 Due to the reduced Door2Door service, Sunshine House began providing trips to its
clients (Larson 2019). 2019 The future of Door2Door was described as uncertain (Dohms 2019). 2019 October, a Transportation Manager was hired by Door County to run the new
Transportation Department. 2019 The County-Wide Volunteer Transportation Program has provided more than 7,500
trips, with volunteer drivers contributing almost 12,000 hours (Door-Tran 2020). 2020 Door-Tran was awarded $20,025 from the R. Bruce & Alyce S. Kopseker Trust
Fund of the Greater Green Bay Community Foundation (Door-Tran 2020). Timeline for Jackson County’s Broadband Year Milestone 1936 Rural Electrification Act was used to fund the People’s Rural Telephone
Cooperative (PRTC). 1953 PRTC began providing party telephone lines to 575 subscribers. 2005 Fire at manufacturing plant in McKee put 700 people out of work. 2008-2009
Jackson County and Owsley County began to connect residents to 1 gigabit service.
2009 Unemployment in Jackson County was more than 16%; 12% in Owsley County. 2014 BAE Systems shut a factory in McKee, resulting in the loss of 200 jobs. 2015 All 7,000 structures in Jackson County connected via fiber. 2015 A Teleworks Hub was opened in Annville (Jackson County). 2016 A Teleworks Hub was opened in Booneville (Owsley County). 2017 October; Virtual Living Room (VLR) opens in the Jackson County library. Users
are connected to the VA Medical Center in Lexington, KY (at least 1 hour, 15-minute drive, one-way).
2020 In April of 2020, a “maker’s space” was set to open within the Jackson County library; the opening was delayed as a result of COVID-19. There are hopes that the opening can occur in April of 2021.
Timeline for Elmira, New York’s Intelligent Transportation System Speed Management Year Milestone c. 2000 Chemung County staff observed ITS speed management signs in Ithaca, New York. c. 2000 Elmira implements mobile and permanent boards as an effort to get motorists to
slow down on local roads. 2011 Two mini-roundabouts were implemented on Maple Avenue in Elmira, New York
as part of a suite of speed management solutions.
2019 Chemung County developed a LRSP. 2020 Elmira begins to replace some of its 20-year-old permanent boards, because some of
the lights no longer work.
U.S. Department of Transportation Federal Highway Administration Office of Operations 1200 New Jersey Avenue, SE Washington, DC 20590
Toll-Free “Help Line” 866-367-7487 www.ops.fhwa.dot.gov
September 2021 FHWA-PL-022-004