EME-OKAFOR, EZINWA PERPETUA.pdf - University Of ...
60
1 EFFECT OF DRYING METHODS ON THE NUTRIENT AND PHYTOCHEMICAL PROPERTIES OF SOME CULTIVATED AND WILD LEAFY VEGETABLES. BY EME-OKAFOR, EZINWA PERPETUA PG/M.Sc/08/49418 DEPARTMENT OF HOME SCIENCE, NUTRITION AND DIETETICS FACULTY OF AGRICULTURE UNIVERSITY OF NIGERIA, NSUKKA
-
Upload
khangminh22 -
Category
Documents
-
view
4 -
download
0
Transcript of EME-OKAFOR, EZINWA PERPETUA.pdf - University Of ...

1
EFFECT OF DRYING METHODS ON THE NUTRIENT AND
PHYTOCHEMICAL PROPERTIES OF SOME CULTIVATED AND WILD
LEAFY VEGETABLES.
BY
EME-OKAFOR, EZINWA PERPETUA
PG/M.Sc/08/49418
DEPARTMENT OF HOME SCIENCE, NUTRITION AND DIETETICS
FACULTY OF AGRICULTURE
UNIVERSITY OF NIGERIA, NSUKKA

2
EFFECT OF DRYING METHODS ON THE NUTRIENT AND
PHYTOCHEMICAL PROPERTIES OF SOME CULTIVATED AND WILD
LEAFY VEGETABLES.
A RESEARCH PROJECT PRESENTED IN PARTIAL FULFILMENT OF
THE REQUIREMENTS FOR THE AWARD OF MASTERS OF SCIENCE
DEGREE IN NUTRITION AND DIETETICS
IN
DEPARTMENT OF HOME SCIENCE, NUTRITION AND
DIETETICS
FACULTY OF AGRICULTURE
UNIVERSITY OF NIGERIA, NSUKKA
BY
EME-OKAFOR, EZINWA PERPETUA
PG/M.Sc/08/49418
SUPERVISOR
PROFESSOR I.C. OBIZOBA
JULY, 2012.

3
CERTIFICATION
This is to certify that this thesis has been approved for the award of
Masters of Science Degree in the Department of Home Science, Nutrition
and Dietetic of University of Nigeria, Nsukka and that the candidate has
effected all the corrections pointed out by the External examiner.
……………… …….... ………..…… ……….. Prof. (Mrs) N.M. Nnam Date Prof. I.C. Obizoba Date
(Head of Department) (Supervisor)
................................... ……………. Prof. (Mrs) E.K. Ngwu Date
(Internal Examiner)

4
ACKNOWLEDGMENT
I wish to acknowledge the help of the Almighty God who without his support his
work would not become a reality. I wish to thank my supervisor Prof I.C Obizoba
who painstakingly guided me throughout the course of this work. Prof., I am really
grateful. May God Almighty ever remain merciful to you. To my parents for all their
care and support throughout my course of study. Mum and dad, I am forever indebted
to you. To my siblings for all their love and distractions. I say thanks for being there.
To the special friends in my life, I pray that the you never lack. To all the lecturers,
staff and students of the department of Home Science, Nutrition and Dietetics who
contributed in one way or the other in making this research work what it is, I say
thank you and lastly, to the ever green memory of Late Prof. E.C.Okeke who saw to
the perfection of my synopsis. Madame, I pray that the ever merciful God grants you
eternal rest. Amen.

5
DEDICATION
This work is dedicated to God Almighty for his love and mercy towards me, and to
my parents Prof. and Mrs E.E Okafor for all their support, prayers and
encouragement.

6
ABSTRACT
The aim of this study was to determine the nutrient and phytochemical composition of
fresh, sun and shade dried okra, bitter, scent, G. latifolium and roselle leaves. The
vegetables were purchased from two markets. Okra, bitter, scent and G.latifolium
leaves were purchased from Nsukka and roselle leaves were bought from Jos market.
All the vegetables were washed, weighed and divided into two equal parts. Each part
was sun, or shade dried, pulverized, packed and stored. The fresh samples for each of
the vegetables served as control. The fresh, sun and shade dried samples of all the
vegetables were separately analyzed for various nutrient and phytochemicals on dry
weight basis using standard assay techniques. Data generated were statistically
analyzed. The means were separated and compared. All the fresh samples had high
moisture values(Okra leaf; 62.22%, bitter leaf; 62.32%, scent leaf; 62.46%,
G.latifolium; 61.44% and roselle leaf; 85.53%) . The moisture content of the sun and
the shade dried samples differed (P<0.05). The exception was that of roselle whose
sun and shade dried values were comparable (6.36 and 6.38%) (P>0.05). Fresh
samples of all the vegetables had lower protein. The processed okra, bitter, scent and
roselle leaves had comparable values (P>0.05). Moisture lost due to drying increased
nutrient density of the vegetables, especially the roselle leaves. The phytochemicals
(Tannins, phytate, saponins and flavonoid) of the fresh samples were higher than
those of the sun and the shade dried samples. This showed that fresh vegetables are
better sources of phytochemicals as against the sun and the shade dried samples. The
shade dried samples had lower tannins except for the bitter leaf and the sundried
samples had lower phytate except the G. latifolium. The sun and the shade dried
samples had comparable saponins and flavonoids content (P<0.05). As judged by the
results, domestic food processing techniques improved the nutrient content of these
vegetables and decreased some of the food toxicants and antinutrients.

7
CHAPTER ONE
1.0 INTRODUCTION
Man must eat to survive for the continuity of the human race. The foods for
human consumption are of both plant and animal origin. Cereals, legumes, roots,
tubers, suckers, oils, nuts, fruits and vegetables are plant foods. Meat, milk, eggs and
oils are animal products. Both plant and animal foods contain nutrients. Oxford
Medical Dictionary (2003) defines nutrients as substances that must be consumed as
part of the diet to provide energy, protein for growth or substances that regulate
growth or energy production. Carbohydrate, proteins, fats, vitamins, minerals and
water are the existing six nutrients.
It is known that too much or too little of these nutrients have adverse effects
on health. The source of these nutrients equally determines how healthy one is. A
typical example is in the case of fats. Animal fat contains about 40-60% of fat as
saturated fatty acids. Plant oils contain mostly unsaturated fatty acids ranging from 73
to 94% of total fat (Wardlaw & Kessel, 2002). Plant oil is the most beneficial to
health. Current studies showed that plant nutrients are not inferior to animal nutrients
as it was earlier thought. In addition, plants contain other non-nutritive dietary
components that are beneficial to health. These components are called
phytochemicals. “Phyto” because they are only found in plant based foods
(Pamplona-Roger, 2005). The present study concentrated on nutrient and
phytochemical levels of five cultivated and wild vegetables.
Vegetables are generally herbaceous (non-woody) plants that are cultivated in
farms, collected from forest trees, market and home gardens as well as kitchen
gardens for home use. Usually, all the botanical parts of the plants (leaves, buds or
flowers, calyxes, fruits, stalk, roots are consumed) (Pamplona-Roger, 2005). This
study laid emphasis on green leafy vegetables.
History shows that vegetables were used for a number of purposes. Many in
the past consumed these vegetables without knowing all they contain. Scent leaf was
used and is still being used to stop diarrhoea. How and what stops diarrhoea in scent
leaf is still a puzzle to many. The foods our ancestors consumed consisted of
carbohydrates, starchy vegetables, leafy vegetables and little or no animal products.
There were not much occurrences of various chronic diseases such as morbid obesity,
cancer, heart and renal failure three to four decades ago as they are now. The juvenile
and paediatric cases of these diseases are on the increase. The cause of their increase

8
is due to migration/changes in lifestyle and food habits (Ene-Obong, 2008). The very
sharp shift from traditional diets as well as the advent of exotic diseases appears to
suggest a serious warning. These warnings call for urgent increases in consumption of
preventive and curative substances inherent in plant based food, especially vegetables.
Chemically, green leafy vegetables are composed of water; 90 to 95%,
minerals e.g. phosphorus, potassium, calcium, iron, vitamins, fibre, proteins,
chlorophyll and most recently discovered- phytochemicals (Pamplona-Roger, 2005).
Indigenous traditional foods are on the verge of extinction. The younger generation is
ignorant of them as such; consume less of these vegetables (Ene-Obong, 2008). As
most of these traditional foods are on the verge of extinction, so are the vegetables,
condiments and spices used in their preparation. Some of the wild forest vegetables
might have been used by a particular community in the past. Based on these serious
observations associated with less consumption of indigenous foods and increases in
many chronic ailments, it is imperative to study the nutrient and phytochemical
potentials of some cultivated and wild vegetables.
1.1 Statement of problem
The increase in the consumption of western diets and neglect of our traditional
foods has precipitated a corresponding increase in ill-health due to diet related non-
communicable diseases. These diseases are of various forms; cancer, kidney and liver
diseases, diabetes and many more. Prevention of these diseases based on new
incidences of these diseases is imperative. This is because these diseases are of
increasing public health concern. Extensive studies are ongoing to address these
public health threats both for the cure of already existing cases and prevention of new
cases. One hopes that the results of these studies will provide baseline information as
to their causes and treatment.
However, some of the information based on the results of recent studies point
to the type of foods consumed by people. Currently, nutrients from plant based foods
have promising solution (Ene-Obong, 2008). Vegetable based foods are advocated
because of their high content of non-nutritive dietary components that are safer and
more beneficial to man. Some of these vegetables contain antioxidants and
phytochemicals. Sadly, in Nigeria, little attention is paid to fruits and vegetables.
Statistics from World Bank (1991) showed that at the National level, an average
household expenditure on household staples was highest on fish (N140.84) followed

9
by meat products (N81.54). The least weekly expenditure was on fruits (N13.12)
followed by weekly expenditure on green leafy vegetables (N20.88).
Vegetables are the most affordable dietary sources of vitamins, trace elements
and other bioactive compounds that offer the only practical and sustainable way to
ensure that micronutrients are supplied through the diet (Odo, 2007). It is imperative
to study more vegetables for their nutrient and photochemical potentials. The
investigation of these vegetables would be of immense benefit to the society.
1.2 Objective of the study
The general objective of the study were to determine the effect of drying
methods on the nutrient and phytochemical properties of some cultivated and wild
leafy vegetables.
The specific objectives of the study are to;
a. determine nutrient, and phytochemical content of these vegetables
b. sun, shade dry and pulverize these vegetables to determine the nutrient content
of their flours.
c. determine the nutrient and phytochemical potentials of these vegetables on dry
weight basis.
1.3 Significance of the study
The results of this study would be a promising and useful tool to home makers
on the increasing need to produce both cultivated and wild forest vegetable and
consume them, especially the children and younger adults. Increase consumption of
these vegetables might be the solution to the cases of micronutrient deficiencies world
wide and some chronic and deadly diseases such as cancers and other diseases and
their complications, particularly in developing countries, Nigeria inclusive.

10
CHAPTER TWO
2.0 LITERATURE REVIEW
In 2000, the member states of the United Nations committed themselves, to
creating a “more peaceful, prosperous and just world” to “freeing our follow men,
women and children from the abject and dehumanizing conditions of extreme
poverty” to making “the right to development a reality for every one” and to ridding
“the entire human race from want” (Von Braun, Swaminthan & Harlow, 2004). This
declaration needed an enforcement which was the Millennium Development Goals
(MDGs). The MDGs are specific and should be met by 2015. The MDGs cannot be
achieved without a direct focus on nutrition because each of the eight goals is directly
or indirectly linked to it.
Nutrition as defined by the council of Food and Nutrition of the American
Medical Association is the “Science of food, the nutrients and the substances therein,
their action, interaction and balance in relation to health and diseases, the process by
which the organism ingests, digests, absorbs, transports, utilizes and excretes food
substances (Wardlaw & Kessel, 2002). Nutrients are classified into micro and macro
nutrients. The macro nutrients being proteins, carbohydrates and fats, and the micro
are vitamins and minerals. Malnutrition is a condition of impaired development and
function caused by either long term deficiency or an excess in energy and/or nutrient
intake (Wardlaw & Kessel, 2002). The former, representing the nutritional state in
Nigeria. The focus here was on micronutrient malnutrition which is of global public
health importance.
2.1Micronutrient malnutrition in Nigeria
In 1990, the term hidden hunger was adapted to refer to micronutrient
deficiency due to substances so small that one could not see them. One out of three
people in the world are affected by one or multiple micronutrient deficiencies (WHO,
2006). Micronutrient deficiencies of international interest include vitamin A, iron,
iodine and zinc. Their deficiencies among the Nigerian population have been
documented (Ene-Obong, 2008). The Nigerian Food Consumption and Nutrition data
showed that 29.5% of children had marginal vitamin A deficiency, and 13% of
mothers and 19.2% of pregnant woman were at risk of vitamin A deficiency. The
study also showed that 20% of the children were both iron and zinc deficient while
14.5%, 8% and 4% had mild, moderate and severe iodine deficiency (Maziya-Dixon
et al., 2004). A study by Ene-Obong, Odoh and Ikwuagwu (2003) showed that despite

11
adequate intakes of vitamin A, 40% of male and 32% of female adolescents had low
plasma concentration of vitamin A (< 20 ug /dl). The first, fourth, fifth and sixth
MDGs (which are to; Eradicate extreme poverty and hunger, reduce child mortality,
improve maternal health and combat HIV/AIDS, malaria and other diseases) are
directly linked to micronutrient malnutrition. To combat micronutrient deficiency,
food and nutrition security is paramount and this cannot be achieved if agriculture and
nutrition are not given top priority.
Sadly, indigenous food crops are no longer given the top priority they deserve
(Okafor, 1975). They and are at the point of extinction (Okeke, Ene-Obong,
Uzuegbunan, Ozioko & Kuhnlein, 2008). The younger generations do not even know
them, like them, let alone consume them (Ene-Obong, 2008). Some food items such
as African yam bean and pigeon pea are now rarely consumed by urban dwellers. This
is because of the length of time they take to cook and amount of fuel they consume,
despite the fact that they are highly nutritious (Okigbo, 1980). They equally contain
both micro and macro nutrients in appreciable amounts. The above scenario shows
that there is need for advocacy and sensitization on the importance of indigenous food
crops and vegetables. The focus here is on vegetables, nutrients and phytochemicals
content.
2.2 Vegetables
The term vegetable usually refers to the fresh edible portion of a herbaceous
plant -root, stem, leaves, flower or fruits (Encarta, 2008). Vegetable are naturally low
in fat and calories. None have cholesterol and many are good sources of fibre. They
are rich in minerals and vitamins (Iloveindia, 2004). Until most recently, a group of
chemicals known as phytochemicals were discovered. They are found only in plant
based food in very small amount. They perform numerous preventive and healing
functions within the body (Pamplona-Roger, 2005).
Vegetables equally contain carbohydrates, proteins, and fat. They can be
categorized according to their type and taste e.g.
Bulb vegetables e.g. onions, garlic and shallots.
Fruit vegetables e.g. avocadoes, cucumbers, okra, tomatoes, pepper and eggplant.
Inflorescent vegetables e.g. broccolis and artichokes.
Leafy vegetables e.g. bitter leaf, scent leaf, lettuce, spinach and cabbage.
Root vegetables e.g. carrots, beets, radishes and turnips.
Stalk vegetables e.g. asparagus, bamboo and celery.

12
Tuber vegetables e.g. cassava, yam, sweet potato, and taro.
Source: Iloveindia (2004).
2.2.1 Roselle (Hibiscus sabdariffa)
Roselle is a native of the old world tropics and a species of hibiscus. It is an
annual, erect, bushy herbaceous subshrub that grows up to 2.4m tall. The leaves are
alternate 7.5-12.5cm long, the flowers borne singly in the leaf axils, are up to 12.5cm
wide yellow or buff with a rose or maroon eye and turn pink as they wither at the end
of the day. The typically red calyx consists of 5 large sepals with a collar (epicarlyx)
of 8 to 12 slim pointed bracts around the base (Morton, 1987). It is known as roselle
in Australia, meshta in the Indian subcontinent, bissap in Senegal, Mali, Burkina
Faso, Benin and Niger, rozelle, sorrel or red sorrel in English speaking regions,
rosella in Indonesia and zobo in Nigeria (Wikipedia-Roselle, 2009).
Uses
Primarily, the plant is cultivated for the production of bast fibre from the stem
of the plant. The fibre may be used as a substitute for jute in making burlap (Hibiscus
sabdariffa, 2007; Morton, 1987). The red carlyx has been extensively used more than
any other part of the plant and was the focus of this study.
Nutrient composition
Nutritionists have found roselle carlyces sold in Central American markets to be high
in calcium, niacin, riboflavin and iron. Food values per 100g of edible portion of fresh
Roselle (Hibiscus sabdariffa) calyces are;
Moisture 9.2g
Protein 1.145g
Fat 2.61g
Fibre 12.0g
Ash 6.20g
Calcium 1,263mg
Phosphorus 273.2mg
Iron 8.98mg
B-Carotene 0.029mg
Thiamin 0.117mg
Riboflavin 0.277mg
Niacin 3.765mg

13
Ascorbic acid 6.7mg
Source: Morton (1987).
Medicinal properties
1. Several studies have shown that hibiscus tea has a substantial antihypertensive
effect attributed to the flowers ACE-inhibiting anthocyanin content and
possible to a diuretic effect. One study found that hibiscus conferred an
antihypertensive effect comparable to 50mg/day of the drug Captopril
(Wikipedia-Prehypertension, 2009).
2) In East Africa, the calyx infusion, called “Sudan tea”, is taken to relieve
coughs (Wikipedia- Roselle, 2009).
3) Morton (1987) reported that it has also been used in the treatment of urinary
tract infection.
Phytochemical content
The calyces contains the flavonoids; gossypetin, hibiscetine and sabdaretine.
The major pigment formerly reported as hibiscin, has been identified as
daphniphylline. Small amount of myatillie, cheysanthenin and delphinidin are
also present. Toxicity is slight (Morton, 1987; Wikipedia-Roselle, 2009).
2.2.2 Bitter leaf (Vernonia amygdalina)
Bitter leaf is widely distributed throughout tropical Africa. It is a shrub or
small tree of 2-5m with petiolate leaves of about 6mm in diameter and elliptic in
shape. The leaves are green with a characteristic odour and a bitter taste (Anonymous,
1999). It is known in Edo as oriwo, chusar doki in Hausa, fatetale/mayemage in
Ibibio, ityuna in Tiv, ewuro in Yoruba and onugbu in Igbo (Vernonia amygdalalina,
2010).
Uses
The most extensively used part of the plant is the leaves which when washed can be
used for soup and stew making and also in the preparation of various local dishes.

14
Nutrient composition
The proximate composition of bitter leaf in percentages and mineral composition in
part per ml as analysed by Okafor (1995) are as follows;
Moisture 76.67 %
Ash 7.67%
Oil 1.10%
Protein 22.07%
Manganese 0.444mg
Calcium 0.185mg
Iron 0.045mg
Phosphorus 6.136 mg
Medicinal properties
1) Many herbalists and naturopathic doctors recommend aqueous extracts of
bitter leaf for their patients as treatment for nausea, diabetes, dysentery and
other gastrointestinal problems. (Wikipedia-Vernonia amygdalina, 2009).
2) Bitter leaf extracts may also suppress, delay or kill cancerous cells in many
ways such as;
a. Suppression of metastasis of cancerous cells in the body by inhibition
of NFkB, an anti-apoptotic transcription factors as demonstrated in
animal studies (Song et al., 2005).
b. Induction of apoptosis as determined in cell culture and animal studies
(Song et al., 2005)
c. Bitter leaf extracts may render cancerous cell to be more sensitive to
chemotherapy (Izevbigie, Bryant & Walker, 2004).
3) It has been used in fever reduction and recently for non-pharmaceutical
solution to persistent fever, headache, and joint pain associated with AIDS
(Herbal Medicine, 1993).
4) It has been used for ginginvitis and toothache due to its proven antimicrobial
activity (Traditional Medicine Development for Medicinal and Dental Primary
Health Care Delivery System in Africa, 2005).
5) In the wild, Chimpanzees have been observed to instinctively ingest the leaves
when suffering from parasitic infections (Huffman & Seifu, 1989).

15
Phytochemical content
The characteristic bitter taste of bitter leaf is due to the presence of phytochemicals
such as alkaloids, saponins, tannins and glycosides (Anonymous, 1999; Bonsi, Osuji
& Tuah, 1995).
2.2.3 Okra (Abelmoschus esculentus)
Okra traces its origin form Ethiopia (formally Abyssinia) spreading right through
Eastern Mediterranean, India, Africa, North America, South America and the Caribbean (Okra,
2009). The species is an annual or perennial, growing to 2 meters tall. The leaves are 10-20cm
long and broad, palmately lobed with 5-7 lobes. The flowers are 4-6cm in diameter, with 5
white to yellow petals, often with a red or purple spot as the base of each petal. The fruit is a
capsule up to 18cm long, containing numerous seeds (Wikipedia –Okra, 2010). It is known as
okra or lady finger in English speaking countries, berdi in Malaysia, bamia, bamya or bamieh
in the Middle East, quiabo in Portugal and Angola, okura in Japan and okwuru in Igbo
(Wikipedia-Okra, 2010; Okra, 2007).
Uses
Okra has many species and they are primarily cultivated for their fruits which come in
pods. The pods are used for vegetables, harvested and ate when tender. The focus is on the
leaves. The products of the plant are mucilaginous and the leaves are not an exception. The
cooked leaves are used as powerful soup thickeners (Wikipedia-Okra, 2010).
Medicinal properties
Okra has several health benefits that include;
1) The superior fibre found in okra stabilizes blood sugar by curbing the rate at which
sugar is absorbed from the intestinal tract.
2) Okra fibre is used for treating ulcers and to keep joints limber.
3) It neutralizes acids, being very alkaline and provides a temporary protective coating for
the digestive tract.
4) Tankano (1999) reported that okra prevents pimples and maintains smooth and beautiful
skin. Its fibre is excellent for feeding the good bacteria (probiotics). This contributes to
the health of the intestinal tract.

16
2.2.4 Utazi (Gongronema latifolium)
G. latifolium is a tropical rainforest plant primarily used as spices and vegetable in
traditional folk medicine (Ugochukwu & Babady, 2002). It is a climber from a tuberous base. It
is known as aborade-aborode, akare, kurutu, nsurogya in Ghana, arokeke in Yoruba, gasub in
Senegal, rupe quial in Sierra Leone and utazi in Igbo (Burkill, 1985).
Uses
Different parts of the plant are used for different purposes. However, the most focus in this
work is on the leaves. The leaves are used primarily for culinary and medicinal purposes.
Nutrient composition
The proximate composition of G.latifolium in percentages and mineral composition in part per
ml as analysed by Okafor (1995) are as follows;
Moisture 71.4%
Ash 10.94%
Oil 18.77%
Protein 0.16%
Sodium 58mg
Potassium 336mg
Magnesium 56mg
Calcium 20.75mg
Copper 0.12mg
Iron 8.17mg
Zinc 0.90 mg
Medicinal properties
1) It is a source of iron, promotes pregnancy and treatment of diabetes (Okafor, 1995).
2) Its aqueous and ethanolic extracts have hypoglycemic, hypolipermic and antioxidant
properties (Ugochukwu & Babady, 2003; Ugochukwu, Babady, Cobourne & Gasset,
2008; Ogundipe, Moody, Akinyemi & Raman, 2003).
3) A study by Morebise, Fafunsu, Makinde, Olajide and Awe (2002), showed that it has
anit-inflamatory properties as well as antibacterial uses (Afolabi, 2007).
17
Phytochemical properties
Reports by various authors showed that it contains essential oils, saponins and pregnanace
among others (Schneider, Rotscheidt & Breitmaier, 1993; Morebise & Fafunso, 1998).
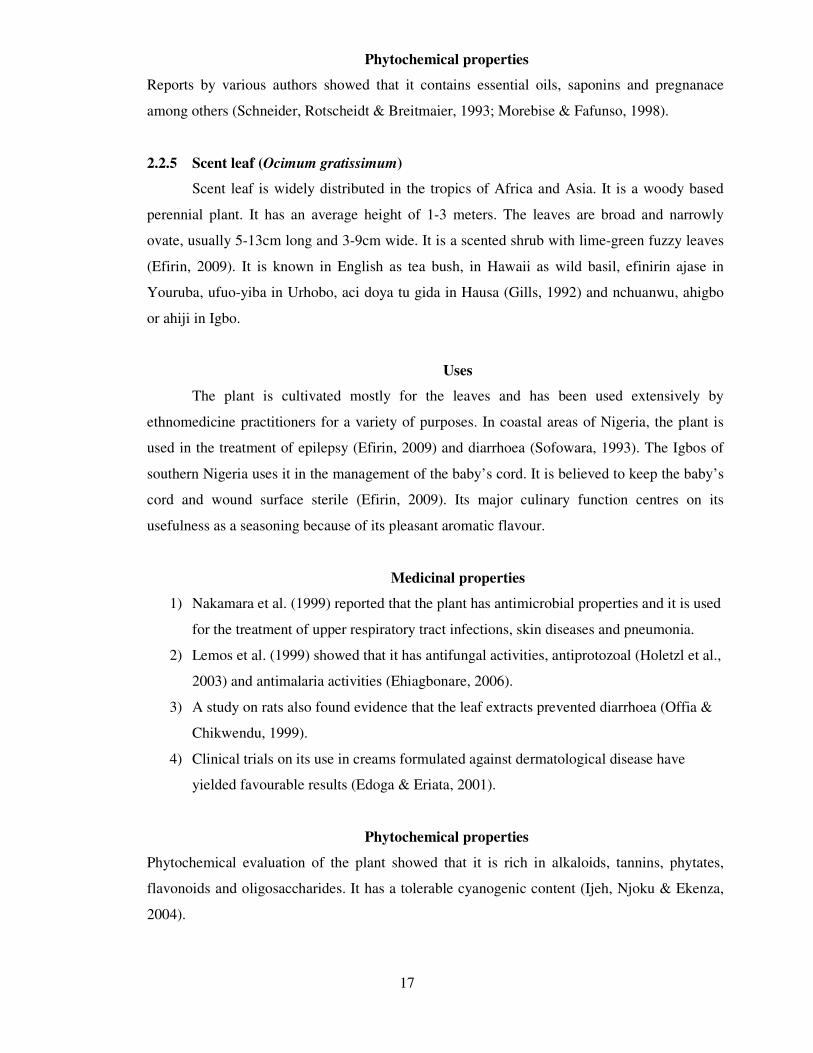
2.2.5 Scent leaf (Ocimum gratissimum)
Scent leaf is widely distributed in the tropics of Africa and Asia. It is a woody based
perennial plant. It has an average height of 1-3 meters. The leaves are broad and narrowly
ovate, usually 5-13cm long and 3-9cm wide. It is a scented shrub with lime-green fuzzy leaves
(Efirin, 2009). It is known in English as tea bush, in Hawaii as wild basil, efinirin ajase in
Youruba, ufuo-yiba in Urhobo, aci doya tu gida in Hausa (Gills, 1992) and nchuanwu, ahigbo
or ahiji in Igbo.
Uses
The plant is cultivated mostly for the leaves and has been used extensively by
ethnomedicine practitioners for a variety of purposes. In coastal areas of Nigeria, the plant is
used in the treatment of epilepsy (Efirin, 2009) and diarrhoea (Sofowara, 1993). The Igbos of
southern Nigeria uses it in the management of the baby’s cord. It is believed to keep the baby’s
cord and wound surface sterile (Efirin, 2009). Its major culinary function centres on its
usefulness as a seasoning because of its pleasant aromatic flavour.
Medicinal properties
1) Nakamara et al. (1999) reported that the plant has antimicrobial properties and it is used
for the treatment of upper respiratory tract infections, skin diseases and pneumonia.
2) Lemos et al. (1999) showed that it has antifungal activities, antiprotozoal (Holetzl et al.,
2003) and antimalaria activities (Ehiagbonare, 2006).
3) A study on rats also found evidence that the leaf extracts prevented diarrhoea (Offia &
Chikwendu, 1999).
4) Clinical trials on its use in creams formulated against dermatological disease have
yielded favourable results (Edoga & Eriata, 2001).
Phytochemical properties
Phytochemical evaluation of the plant showed that it is rich in alkaloids, tannins, phytates,
flavonoids and oligosaccharides. It has a tolerable cyanogenic content (Ijeh, Njoku & Ekenza,
2004).

18
2.3 Origin of phytochemicals
Phytochemicals are of plant origin as the name implies. They are natural
bioactive compounds found in plant foods that work with nutrients and dietary fibre to
protect against diseases (Tantilio, 2009). A wide spectrum of phytochemicals has
been discovered in plant foods, mostly fruits and vegetables. Much more researches
are ongoing, on for details of these important non-nutritve dietary components.
The merits of the preventive and curative potentials of these phytochemicals
would be attained by diversification of our diets (Wardlaw & Kessel, 2002). This is
because; various fruits and vegetables contain varied levels of phytochemicals. Citrus
fruits for example are rich in limonoids that inhibit tumor formation (Lam, Zhang &
Hasegawa, 1994). Cruciferous vegetables, on the other hand, are rich in indoles; a
group of phytochemicals that protect against heart disease, stroke and blindness
(Tantillo, 2009). It is advisable to consume a wide variety of plant foods that contain
different phytochemicals at varied levels to prevent diet related non-communicable
diseases.
2.3.1 Classes of phytochemicals
More than 1,000 different phytochemicals have been identified so far (Be Healthy
Enterprises, 2007). Phytochemicals were classified for easy identification. Some of
the classes include:
1) Carotenoids
a. Alpha-carotene
b. Beta – carotene
c. Beta – cryptoxanthin
d. Lutein
e. Lycopene
f. Zeaxanthin and others
2) Flavonoids/Bioflavonoids/Polyphenols
a. Anthocyanins
b. Catechins
c. Querecetin
d. Tangeritin
e. Resveratrol
f. Hesperidin
g. Coumarins

19
h. Isoflavones (Phytoestrogens)
i. Flavanones
j. Flavones
k. Flavanols and others
3) Organosulfides
a. Allicin
b. Glutathione
c. Indole-3-curbinol
d. Isothiocyanates
e. Sulforaphane and others
4) Alkaloids
a. Caffeine
b. Theobromine
c. Theophylline and others
5) Lignans
a. Pinoresinol
b. Caricresinol
c. Secoisolariciresinol
d. Matairesinol and others
6) Saponins
a. Forosterol saponins
b. Spirosterol sriponins
c. Triterpenoid saponins and others
7) Phenolic acids
a. Capsaicin
b. Ellagic acid
c. Gallic acid
d. Rosmaric acid
e. Tannic acid and others
8) Terpenes/ Mono-terpenes
a. Limonene
b. Linolyl acetate
c. Menthol
d. Thymol and others

20
9) Inositol phosphates (Phytates)
10) Phenols & cyclic compounds
a. Ginerols
b. Diarylhaptanoids and others
2.3.2 Phytochemicals as pigments and flavours
The myriad of colours and flavours associated with different fruits and vegetables
are not accidents of nature. The pigments and compounds which impact these
characteristic colours to fruits and vegetables are phytochemicals (Tantillo, 2009).
This forms basis for easy identification of phytochemicals contained in a fruit or
vegetable due to their distinct colours and flavours. Different colours suggest different
phytochemicals and different phytochmeicals means different nutritional and health
benefits. Based on these facts, it is important to consume a wide variety of colours of
fruits and vegetables on a daily basis (Be Healthy Enterprises, 2009). Listed below are
a few of the phytochemicals that are responsible for the different colours of various
fruits and vegetables.
1) Carotenoids
These are the pigments responsible for the red, blue, yellow, green and orange
colours of various fruits and vegetables (Tantillo, 2009). The variation in colour
depends on the particular carotenoid in the fruit or vegetable. They are contained in;
red pepper, citrus fruits, water-melon, sweet potatoes, mango and papaya.
2) Flavonoids
These are the pigments responsible for the characteristic blue, dark red and purple
colours of some fruits and vegetables (Sanders, 2004). They can be equally found in
green and orange coloured fruits and vegetables. They are contained in blue berries,
grapes, purple onions, egg plants, purple cabbage, figs, pears, strawberries, cherries,
cranberries, raspberries and red wine.

21
3) Organosulfides
These are found in green vegetables particularly cruciferous vegetables
(Pamplona-Roger, 2005). They are contained in cabbage, turnips and watercresses.
The characteristic flavours of different vegetables and herbs are associated with the
type of phytochemicals they contain. Terpenes are contained in aromatic herbs,
gingerols and diarylhaptanols in ginger, the sulphides in garlic and onions and
diathiolthiones and isothiocyanate in broccoli and other cruciferous vegetables are
examples of various phytochemicals that impact flavours (Craig, 2009).
2.3.3 Health benefits of phytochemicals
It might come as a surprise that compounds such as phytates, saponins,
alkaloids and flavonoids are phytochemicals. The toxic and anti-nutrient properties of
these compounds are now beneficial properties. However, most of these compounds
are detoxified by several processing methods (such as soaking, germination, boiling,
fermentation and other processing methods) (Soetan, 2008). Recent information
showed that they have potent preventive, curative, anti-oxidant and anti-inflammatory
properties some of the health benefits at some of these phytochemicals are well
documented.
1) Saponins
a. Recent reports from Canada showed that dietary sources of saponins offer
preferential chemoprotective strategy in lowering the risk of human cancers.
Saponins can kill or inhibit cancer cells without killing normal cells (Rao,
1996).
b. Saponins have also been reported to lower blood cholesterol. The
hypocholesterolemic activity of dietary saponins may be due to its formation
of some complexes with 3-B-hydroxysteroids. They are known to interact and
form large mixed micelles with acids and cholesterol (Messina, 1999).
c. Besides lowering cholesterol, saponins readily increase the permeability of
small intestine to facilitate the uptake of materials to which the G.I.T. would
not normally be permeable (Johnson, Gee, Price, Curl & Fenwick, 1986).

22
d. Malinow, Marbin and delaCastra (1985) reported that saponins assist in the
prevention of cardiovascular diseases by lowering plasma cholesterol
concentration through the excretion of cholesterol directly or indirectly as bile
acids. Saponins cause a depletion of body cholesterol by preventing its
reabsorption, thus increasing its excretion (Soetan, 2008).
e. Saponins form Vigna radiata, Vigna mungo and Vigna sinensis have diuretic
activities (Chowdhurry, Jahirullah, Tabukder & Khan, 1987). They also have
antidiabetic activities. (Yamaguchi, 1993).
2) Flavonoids
a. Flavonoids act as antioxidants that neutralize or inactivate highly unstable and
extremely reactive molecules (free radicals) that attack our body cells daily
(Tantillo, 2009).
b. Research has shown that flavonoids have anticarcinogenic properties. They
block various hormone activities and metabolic pathways that are associated
with the development of cancers (Caragay, 1992).
c. Flavonoids prevent low density lipolipids cholesterol from oxidation to the
unsafe cholesterol oxides (O-Cholesterol), inhibit platelet aggregation and
have anti-inflammatory and anti-tumor actions (Kanner, Frankel & Granit,
1994).
3) Carotenoids
a. The carotenoids; lutein, zeaxanthin and beta-cryptoxanthin have significant
antioxidant activities. These carotenoids are associated with a lower incidence
of age-related macular degeneration (Seddon, Ajani & Sperduto, 1994).
b. Carotenoids have been linked to decreased risk of both hemorrhagic and
ischemic stroke (United States Department of Agriculture [USDA], 2005).
c. Consumption of tomato products (lycopene) has been linked to decreased risk
of prostate cancer (USDA, 2005).
4) Alkaloids
a. Alkaloids have been shown to be the most potent anti-inflammatory agents
(Soetan, 2008).

23
b. They have been severally reported to have anti-microbial action (Ebana,
Madunagu, Ekpe & Otung, 1991).
c. They are used in the treatment of skin infections (Finar, 1987).
4) Terpenes/Mono-terpenes
Limonene; a terpenoid contained in orange and lemon oil have been shown to posses
anticarcinogenic potentials (Olson, 1988).
5) Lignans (Phytoestrogen)
Due to their oestrogenic and anti-oestrogenic activities, many researchers investigate
their potentials in decreasing the incidence of hormone-associated cancers and
maintenance of bone density (Higdon, 2005).
6) Phytates
Phytates have always been infamous because of the negative effect they have on
absorption of iron, zinc and calcium. However, recent studies showed that they are not
as harmful as was formerly believed. Their health benefits include;
a. As antioxidants they combine with iron which behaves like a free radical of
intense oxidizing action. They prevent an excess of this mineral from harming
the intestinal lining, turning into a factor of cancerous degeneration
(Pamplona-Roger, 2005).
b. Several experiences showed that phytates are anti-carcinogenic in both in-vitro
and in-vivo. This partially explains the cancer preventing activity that whole
grains possess (Pamplona-Roger, 2005).
Apparently, the merits of consuming a diet rich in fruits and vegetables cannot
be over-emphasized. With the wealth of phytochemicals inherent in them, one can be
sure of staying healthy. Of surprising, interest is on the discovery that the so-called
anti-nutrients might not be “anti” after all.

24
CHAPTER THREE
3.0 MATERIALS AND METHODS
3.1 Materials
The wild vegetables used for the study were identified by staff of Botany
Department, University of Nigeria, Nsukka. These vegetables were zobo (Hibiscus
sabdariffa), utazi (Gongronem latifolium), bitter leaf (Vernonia amygdalina), scent
leaf (Ocimum gratissimum) and okra (Abelmoschus esculentus or Hibiscus
esculentus), these were purchased from two different areas. Roselle was purchased
from Jos and bitter leaf, okra, scent leaf and G. latifolium were purchased from Ogige
Market in Nsukka Town, Enugu state, Nigeria.
3.2 Methods
Sample preparation
3.2.1 Processing of roselle
One kilogramme of roselle leaves was washed to remove dust and sand. It was
divided into two equal portions (500g, each). One portion was thinly spread,
sundried and the other was thinly spread and shade dried. Both samples were
pulverized into flour and packaged for use (Fig.1)
Fresh roselle leaves
Washed
Shade dried Sundried
Pulverized
Packaged for use
Pulverized
Packaged for use

25
3.2.2 Processing of bitter leaf
One kilogramme of bitter leaf was washed to remove dust, sand and bitterness.
The sample was divided into two equal portions (500g, each). One portion was thinly
spread and sundried. The other was thinly spread and shade dried. Both samples were
pulverized into flour and packaged for use as that of roselle.
3.2.2 Processing of okra leaves
One kilogramme okra leaves was washed to remove dust, sand and divided
into two equal potions (500g, each). One portion was thinly spread and sundried. The
other was also thinly spread and shade dried. Both samples were pulverized and
packaged for use as in (Fig. 1).
3.2.3 Processing of G. latifolium
One kilogramme of G. latifolium leaves was washed to remove dust sand and
divided into two equal portions (500g, each). One portion was spread and sundried.
The other was thinly spread and shade dried. Both samples were pulverized into flour
and packaged for use (see Fig. 1).
3.2.4 Processing of scent leaf
One kilogramme of scent leaf leaves was washed to remove dust, sand and
divided into two equal portions (500g, each). One portion was thinly spread and
sundried. The other was thinly spread and shade dried. Both samples were pulverized
into flour and packaged for use (see Fig.1).
3.3 Analytical methods
3.3.1 Proximate analysis
The proximate analysis of the food samples was carried out according to
AOAC procedure (2000) for moisture, fat, ash and crude fibre. Protein was
determined by the method described by Pearson (1976).
Moisture: This was determined by the drying method using vacuum oven with
aluminum dish at 78oC for 3h. The dry samples were allowed to cool in a desiccator
prior to re-weighing. The sample was put back in the oven and re-weighed at one-
hour interval until a constant weight was obtained
% Moisture + W2 – W1 x 100
Wt of sample 1

26
Where W2 = initial Wt. of dish and sample.
W1 = Final Wt. of dish and sample.
Fat: Sohxlet extraction method was used to determine the fat content of the samples.
Two grammes of each of the sample were put in a fat extraction thimble and inserted
into the Sohxlet extraction apparatus containing petroleum ether (60% Bp). Heat was
introduced to boil the solvent. The hot solvent was allowed to flow into the thimble
containing the sample to extract fat. At the end of the extraction, the thimble was
removed. The extracted fat and the container were put under fume hood chamber to
dry. The dry container and fat were put in a dessicator to cool. The cooled container
was reweighed. The difference in weight was the weight of fat. The value obtained
was expressed as a percentage of the original weight of the sample.
Ash: This was determined by combusting a known weight of sample in muffle
furnace of 5000C for 5h. The ashed sample was cooled and re-weighed with the
crucible. The percentage ash was calculated using the following steps
Weight of crucible =B
Weight of crucible + ash =A
Weight of crucible + ash – Weight of crucible = Wt. of ash A-B= C
% ash = Wt. + of ash x 100
Wt. + of sample 1
Crude protein: Two hundred milligrammes (200mg) of each sample were weighed
into a micro-Kjeldahl digestion flask. About 2.5g of anhydrous sodium sulphate and
0.5mg of copper sulphate were added as catalysts to each sample and subjected to
heat until a colourless solution (ammonium sulphate) was obtained. The solution was
made up to 100ml in100ml volumetric flask. The micro-Kjeldahl distillation
apparatus was positioned by allowing the tip to be about 2cm inside the digestion
flask. About 5ml of 60% sodium hydroxide solution was added through the funnel
stop cork. On the introduction of stem into the distillation apparatus, NH3 was
liberated, condensed and collected with a receiver flask containing 4% boric acid and
mixtures of methyl red and blue in a ratio of 2:1 as end point indicator. As soon as
NH3 dropped in the beaker containing a mixture of boric acid and methyl red and
blue, the purple colouration of the mixture changed to yellowish-green; a
characteristic of alkaline gas (NH3). Distillation was continued until a reasonable

27
volume was collected for titration. A qualitative analysis of the distillate was attained
by titration to a navy blue colour with 0.01N HCL.
Mg N = Titer × 14.001
Wt. of sample
The percentage of protein was determined by the multiplication of %N with the
conversion factor 6.25(N×6.25).
Crude fibre: Crude fibre content of the sample was determined by the official
method of AOAC (2000). About 2g of the sample were boiled for 30mins and filtered
through a fluted funnel and washed with boiling H2O until the washing was no longer
acidic. The sample was boiled for 30mins with 20ml sodium hydroxide, solar filtered
with hot H2O, using calico cloth, rinsed with 1% HCL and finally methylated spirit.
The residue obtained was collected into a crucible and dried in an oven for 30mins.
The content was cooled in a dessicator, weighed prior to taken to the furnace for
ashing at 350oC for 30mins. The ashed sample was moved from the furnace after the
temperature was cooled to 200oC and put into the dessicator and later weighed. The
loss in weight between the incinerated residue before and after incineration was the
crude fibre content. The percentage fibre was calculated thus;
Total wt of fiber × 100
Wt of the sample
Sugars and starch: Free sugar and starch were determined quantitatively using the
method described by Mcready (1970). Ethanol (95%) was used to first extract sugars
from starch. The residue was then hydrolyses with perchloric acis into
monosaccharides. The sugars were quantified colorimetrically using phenol and
sulphuric acid. Sugars gave an orange colour when treated with phenol and sulphuric
acid. Sugars extracted with the solvent were directly analysed to determine the sugar
content. Sugars obtained after hydrolysis of the residue was converted to starch by
multiplying it by 0.9.
3.3.2 Mineral analysis
Copper, phosphorus, iron and zinc content of the samples were determined after wet
digestion using atomic absorption spectrophotometer (ASS). Phosphorus was
determined using emission spectrophotometer (AOAC, 1995).

28
3.3.3 Phytochemical analysis
Tannins: A modified method described by Price and Butler (1977) was adopted. A
sample of 0.5g of each of the samples was extracted with 10ml of deionized water.
Colour was developed with 3ml of 0.1m ferric chloride in 0.1N HCL followed
immediately by 3ml of 0.008ml potassium ferrocyanate. The absorbance was read at
520nm in a UNICAM SP 400 spectrophotometer. Tannins content was extrapolated
from a previously prepared tannic acid standard curve.
Phytate: A modification of the procedure of Latta and Eskin (1980) was used for the
determination of phytate content of the samples. Five grammes of each of the samples
were passed through an amberlite resin, in-organic phosphorus was eluted with 0.1ml
sodium chloride and 0.7ml sodium chloride. Colour was developed with 1ml of
modified Wade reagent (0.03% FeCl2.6H2O and 0.3% sulphursalicylic acid). The
absorbance was read at 520nm in a CE 2343D digital granting spectrophotometer.
Phytate value was extrapolated from a previously prepared phytic acid standard curve.
Saponins: A spectrophotometric method of AOAC (2000) was developed for the
determination of saponins. Saponins fraction of the samples was prepared by a
column chromatography with porous polymer and hydrolyzed with a 2mol/l mixture
of HCL-Ethanol (1+1) to generate sapogenin. Sapogenin amounts of the sample was
determined by measuring absorbance at 430nm, based on the colour reaction with
anisaldehyde, sulfuric acid and ethyl acetate.
Flavonoids: A High-Performance Liquid Chromatography (HPCL) method was
adopted for the determination and separation of flavonoids. Free flavonoids were
fractionated into neutral and acidic groups by means of solid-phase extraction method,
followed by subsequent HPLC separations
3.3.4 Statistical analysis
The data generated was analyzed using means, standard deviation, standard
error of mean and analysis of variance (ANOVA). Duncan’s New Multiple Range
Test was used to separate and compare means (Steel & Torrie, 1960).

29
CHAPTER FOUR
4.0 RESULTS
Table I shows the chemical composition of fresh, sun and shade dried
okra, bitter, scent, G. latifolium and roselle leaves.
The moisture of the fresh, sun and shade dried okra leaves differed. The fresh
okra leaf had the highest moisture (62.22%). The sun and shade dried sample had
7.66% and 10.27%, each. The difference among the sun and shade dried samples
differed as well as that of the fresh sample (62.22, 10.27 and 7.66%, respectively)
(P<0.05). The protein content of the okra leaf samples differed equally. The range was
from 8.84 to 19.78%. The protein content of the fresh okra leaf differed from those of
the sun and shade dried samples (19.78 and 19.64% vs. 8.84%, respectively) (P<
0.05). Sun and shade drying had equal effect on protein of okra leaf (19.78 vs
19.64%) (P > 0.05). The fat values differed. It ranged from 1.16 to 1.24%. Fresh okra
leaf had higher fat than those of the sun and dried samples (1.24 vs 1.16 and 1.17) (P<
0.05). The sun and shade dried okra leaf had comparable fat (1.16 and 1.17%) (P>
0.05). The ash values differed. The range was from 6.66 to 15.03%. The fresh sample
had the least (6.66%) which differed from those of the sun and the shade dried
samples (6.66 vs 14.69 and 15.05%) (P < 0.05). On the other hand, both the sun and
the shade dried samples had higher and comparable values (14.6 and 15.03%)
The fibre content of okra leaf sample was high. The range was from 9.06 to
19.64%:- There was no difference in fibre between the sun and the shade dried
samples (19.64 vs 9.60%) (P >0.05). The fresh sample had the least (9.06%) (P<0.05).
There were differences in sugar content of okra leaf samples. The fresh okra leaf had
the highest sugar (6.27%). The sun and the shade dried samples had 4.70 and 4.78%,
each. The fresh sample had higher sugar, which was different from those of the sun
and shade dried samples (6.27 vs 4.70 and 4.78%, respectively) (P<0.05). On the
other hand, the sugar content of the sun and the shade dried samples was similar
(4.78vs 4.78%) (P>0.05). The starch values differed. It ranged from 5.69 to 32.46%.
The fresh okra leaf had the least starch (5.69%). The sundried sample had the highest
and the shade dried had the second highest (32.46 and 28.61%, respectively).
Sundrying had an edge over shade drying (32.46 vs 28.61%) (P<0.05). However, both
sun and shade drying had higher starch than that of the fresh sample (32.46 and
28.61vs 5.61%) (P<0.05).

30
Table 1. Chemical composition of fresh, sun and shade dried Okra, Bitter, G. latifolium and
Roselle leaves (%)
MOISTURE PROTEIN FAT ASH FIBRE SUGAR STARCH
FOL 62.22 + 0.02 8.84 + 0.04 1.24 +0.01 6.66+0.01 9.06+0.01 6.27+0.01 5.69 + 0.14
SUOL 7.66 + 0.01 19.64+ 0.04 1.16+0.12 14.67+0.01 19.64+0.01 4.78+0.01 32.46 + 0.02
SHOL 10. 27 + 0.01 19.78+ 0.01 1.17+0.01 15.03+0.01 19.60+0.01 4.70+0.01 28.61 + 0.68
FBL 62.32 + 0.06 7.7+ 0.01 1.25+0.18 7.45+0.15 9.85+0.02 5.79+0.01 3.54 + 0.07
SUBL 6.84 + 0.02 19.88+ 0.01 1.20+0.01 14.86+0.01 19.47+0.02 3.85+0.32 33.89 + 0.03
SHBL 10.35 + 0.01 19.42+0.01 1.19+0.01 14.75+0.01 19.35+0.02 3.36+0.01 31.05 + 0.01
FSL 62.46 + 0.01 9.86 + 0.01 1.39+0.01 6.87+0.01 8.63+0.17 5.36+ 0.01 5.43 + 0.02
SUSL 7.75 + 0.12 13.19 + 0.02 1.25+0.01 13.86+0.01 18.85+0.01 3.46+ 0.01 41.15 + 0.02
SHSL 10.11+ 0.03 13.46 + 0.01 1.16+0.01 13.83+0.01 18.86+0.01 3.41+ 0. 12 39..20 + 0.01
FGL 61.44 + 0..29 9.50 + 0.01 1.34+0.01 7.64+0.01 9.03+0.01 5.59+ 0.01 5.75 + 0.03
SUGL 6.86 + 0.0 17.13 +0 .01 1.17 +0.01 15.03+0.01 19..23+0.01 4.63+ 0.02 36.02 + 0.05
SHGL 10.17 + 0.01 16.85 + 0.02 1.15+0.01 14.97+0.01 19.21+0.01 4.57+ 0.01 33.06 + 0.03
FRL 85..53 + 0.01 3.33 + 0.01 0.226+0.01 1.57+0.01 1.62+0.01 5.37+ 0.01 5.12 + 1.46
SURL 6.36 + 0.01 22.86 +0.01 2.06+0.01 11.2+0.01 11.23+0.01 2.04+ 0.01 66.48 + 46.34
SHRL 6.38 + 0.01 22.39 +.0.01 1.97+0.01 10.96+0.01 11..37+0.01 1.97+ 0.07 64.79 + 10.79
Means + Standard deviation of three determinations
FOL = Fresh Okra leaf FGL = Fresh G. latifolium leaf SUOL = Sundried Okra SUGL = Sundried G.latifolium leaf
SHOL = Shadedried Okra leaf SHGL = Shade dried G latifolium leaf
FBL = Fresh bitter leaf FRL = Fresh roselle leaf
SUBL = Sundried bitter leaf SURL = Sundried roselle leaf
SHBL = Sundried bitter leaf SHRL = Shade dried roselle leaf
FSL = Fresh scent leaf
SUSL = Sundried scent leaf
SHSL=Shadedriedscentleaf

31
The moisture content of the fresh, the sun and the shade dried bitter leaf
samples varied. The sun and the shade dried samples had 6.84% and 10.38%, each.
The fresh sample had the highest moisture (62.32%). There were differences in
moisture among the sun and the shade dried sample as well as that of the fresh (6.84,
10.38 and 62.32%, respectively). (P< 0.05). Its protein content equally differed. The
range was from 9.76 to 19.88%. Both the sundried and the shade dried bitter leaf had
higher protein values than the fresh (19.88 and 19.42 vs 1.76%) (P< 0.05). The
protein values of the sun and the shade dried bitter leaf samples were similar (19.88
and 19.42%, respectively) (P> 0.05). The fat value varied. It ranged from 1.19 to
1.25%. The shade dried bitter leaf had lower fat value as against those of the sundried
and the fresh samples (1.19 vs 1.20 and 1.25%, respectively) (P< 0.05). The sundried
and fresh samples had comparable values (1.20 and 1.2 5%) (P>0.05). The ash
values for bitter leaf samples differed. It ranged from 7.45 to 14 86%. The fresh
sample had the least ash in comparison with the shade and the sundried samples (7.45
vs 14.75 and 14.86%, respectively) (P< 0.05). However, the shade and the sundried
dried samples had similar values (14.75 and 14.86%, respectively) (P> 0.05).
The fibre content was high. It ranged from 9.85 to 19.42 %. The fibre values
for the sun and the shade dried samples were comparable (19.35 and 19.47%,
respectively) (P< 0.05). The fresh sample differed from the rest (P>0.05). The sugar
content of bitter leaf samples differed. Its range was from 3.30 to 5.79%. The fresh
bitter leaf sample had the highest sugar (5.79%) followed by the sundried and the
shade dried samples (5.79 vs 3.85 and 3.36%) (P<0.05) The sun and the shade dried
samples had comparable sugar content (3.85 vs 3.36%) (P>0.05). The starch values
differed. Its range was from 3.54 to 33.89%. The fresh had the least as against those
of the sun and the shade dried samples (3.54 vs 33. 89 and 31.05%) (P<0.05). On the
other hand, the sun and the shade dried samples had similar values (33.89 and
31.05%) (P>0.05).
The moisture values for the scent leaf sample were different. The fresh scent
leaf had the highest moisture (62.46%). The sun and the shade dried samples had
7.75% and 10.11%, each. The difference among the sun and the shade dried samples
as well as that of the fresh differed (7.75, 10.11 and 62.40%, respectively ) (P<0.05).
The protein content of the scent leaf samples varied. Its range was from 9.86 to
13.67%. The sun and the shade dried sample had higher and comparable values.
(P>0.05). The fresh had lower value (9.86%) (P<0.05). The fat values differed. The
range was from 1.16 to 1.39%. Fresh scent leaf had higher fat than the sun and the

32
shade dried samples (1.39 vs 1.25 and 1.16%) (P<0.05). The shade and the sundried
samples had comparable fat values (1.25 and 1.16%) (P>0.05). The ash values for the
scent leaf varied. It ranged from 6.87 to 13.86%. The fresh scent leaf had the least ash
(6.87 vs 13.86 and 13.83%, respectively) (P<0.05). The sun and the shade dried
samples had similar value (13.86 and 13.83%) (P>0.05). The fibre content of the scent
leaf samples was high. The range was from 8.63 to 18 83%. There was no difference
in fibre between the sun and the shade dried samples (P>0.05). The sugar content
differed and ranged from 3.41 to 5.36%. The sun and the shade dried samples had
comparable value as against the fresh sample (3.46 and 3.41 vs 5.36 %, respectively)
(P<0.05). The starch values also differed. The range was from 5.43 to 41. 15% .The
sundried scent leaf had the highest starch (41.15%). The shade dried and the fresh
samples had 39.20% and 5.43%, each. The among between the sun and the shade
dried samples differed as well as that of the fresh sample (41.15, 39.20 and 5.43%)
(P<0.05).
The moisture values for the fresh, the sun and the shade dried G. latifolium
leaf differed. The fresh sample had the highest moisture (61.44%). The sun and the
shade dried samples had 6.86% and 10.17%, each. There was difference among the
sun and the shade dried samples as well as that of the fresh sample (61.44, 10.17 and
6.86%, respectively) (P<0.05). Its protein values differed and ranged from 9.50 to
17.13%. The fresh G. latifolium leaf had the least protein followed by the shade and
the sun dried samples (9.50 vs 16.85 and 17.13%) (P<0.05). The shade dried G.
latifolium had comparable protein with the sundried sample (16.85.vs 17.13%)
(P>0.05). The fat values varied. It ranged from 1.15 to 1.34%.
The fresh G.latifolium leaf had fat value that differed from those of the sun
and the shade dried samples (1.34 vs 1.17 and 1.13%) (P<0.05). On the other hand,
the fat value for the sun and the shade dried samples were similar (P>0.05). The ash
content of the fresh, the sun and the shade dried G. latifolium differed. The range was
from 7.64 to 15.03%. The ash values for the sun and the shade dried samples were
similar (13.03 and 14.97) (P>0.05). However, they differed from that of the fresh
sample (P<0.05). The fibre values were high. The range was from 9.03 to 19.23%.
The sun and the shade dried samples had similar values (19.21 vs 19.23%) (P>0.05).
The sugar content of the samples differed. The range was from 4.57 to 5.59%. The
fresh G. latifolium sample had the highest sugar (5.59%). The sun and the shade dried
samples had higher sugar than that of the fresh sample (5.59 vs 4.60 and 4.57%,
respectively) (P<0.05). However, the sugar content of the sun and the shade dried

33
samples was similar (4.60 and 4.57%) (P>0.05). The starch values ranged from 5.75
to 36.02%. The fresh sample had the least starch (5.75 %). The sundried sample had
the highest starch value (36.02%). The shade dried sample had the second highest
value (36.02 and 33.06%, respectively) (P<0.05). Both the sun and the shade dried
samples had higher starch than the fresh sample (36.02 and 33.06 vs 5.78%) (P<0.05).
The moisture content of the fresh, the sun and the shade dried roselle samples
differed. It ranged from 6.30 to 85.53%. The fresh roselle had the highest moisture
(85.53%). The sun and the shade dried samples had 6.36 and 6.38%, each. The fresh
roselle had higher moisture than the sun and the shade dried samples (85.53 vs 6.36
and 6.338%) (P<0.05). The sun and the shade dried samples had similar moisture
(6.36 and 6.38%) (P>0.05). The protein levels differed. Its range was from 3.33 to
22.86%. The sun and the shade dried roselle had higher protein content that the fresh
sample (22.86 and 22.39 vs 3.33%, respectively) (P<0.05). The protein content of the
sun and the shade dried samples was similar (22.86 and 22.39%) (P>0.05). The fat
values varied. The sundried and the shade dried samples had 0.226 and 1.97%, each.
The difference between the sun and shade dried samples as well as that of the
fresh differed (2.06, 1.97 and 0.226%, respectively) (P<0.05). The ash content of the
fresh, the sun and the shade dried roselle leaf varied. The range was from 1.57 to
11.2%. The ash content of the fresh differed from those of the sun and the shade dried
samples (11.2 and 10.96 vs 1.57%, respectively) (P<0.05). Sundrying did not have an
edge over shade drying (11.20 and 11.96) (P>0.05).The fibre content differed. The
range was from 1.62 to 11.32%. There was no significant difference in fibre between
the sun and the shade dried samples (11.23 vs 11.37) (P>0.05). The values differed
from the fibre value for the fresh sample (11.13 and 11.37 vs 1.62%) (P<0.05). The
sugar content of the roselle sample ranged from 1.97 to 5.37%. The shade dried
sample had the least sugar (1.97%) followed by the sundried sample (2.04%). The
fresh sample had the highest sugar (6.87 vs 2.04 and 1.97%) (P<0.05). The starch
content varied. The sundried roselle had the highest starch (66.48%). The shade dried
and the fresh samples had 64.79 and 5.17%, each. The difference among the sun and
shade dried samples differed as well as that of the fresh sample (66.48, 64.79 and
5.12%, respectively) (P<0.05).

34
Table 2 shows the effects of sun and shade drying on the chemical composition
of fresh, sun and shade dried okra, bitter, scent, G.latifolium and roselle leaves
(dry wt.%).
The protein content of all the fresh, the sun and the shade dried samples
differed. It ranged from 14.30 to 26.27%. Fresh scent leaf had the highest protein
value (26.27%) followed closely by fresh bitter leaf (25.90%). Fresh G. latifolium and
sundried roselle leaves both had comparable protein values (24.63 and 24.41%). Fresh
okra, roselle leaves and shade dried roselle leaf had comparable protein (23.34, 23.01
and 23.91%, respectively). Sun dried bitter leaf, shade dried bitter leaf and sundried
okra leaf had similar protein values (21.53, 21.65 and 21.27%). Sun and shade dried
G. latifolium leaf had similar value 18.40 and 18.10%, each. Shade dried scent leaf
had 14.97% and the sundried scent leaf had the lest protein (14.31%)
Fresh scent leaf had the highest fat content (3.70%) followed by the fresh G.
latifolium (3.47%), the fresh bitter leaf had 3.32% and the fresh okra leaf had 3.28%.
Sun and shade dried roselle had similar fat values (2.20 and 2.10%). The fat values for
the sundried okra leaf and the sundried G. latifolium leaf was comparable (1.26%).
The fat for shade dried okra and bitter leaves and sundried scent leaves was
comparable (1.30, 1.33 and 1.36%)
The ash content of the vegetables differed. It ranged from 10.85 to 19.81%.
Fresh roselle leaf had the least ash (10.85%) followed by the sun and the shade dried
roselle leaves which had similar values (11.96) and 11.71%). Sun and shade dried
scent leaves had similar values (15.02 and 15.38%) and the sun dried okra and bitter
leaves had comparable values (15.89 and 15.94%, each). Fresh G. latifolium had the
highest ash (19.81%) followed closely by the fresh bitter leaf (19.77%).
The fibre levels for the vegetables varied. It ranged from 11.20 to 26.14%. Sun
and shade dried okra leaf and shade dried bitter leaf had similar values (21.27, 21.83
and 21.58%). Sun and shade dried G. latifolium leaves had similar values (20.65 and
20.63%). Fresh bitter leaf had the highest (26.14%) followed by the fresh okra leaf
(23.98%) and fresh G.latifolium (23.41%). Fresh roselle had the least value (11.20%).
Fresh roselle had the highest sugar (37.11%) followed by the fresh okra leaf
(16.60%). Fresh bitter leaf had (15.37%). Fresh scent leaf and G. latifolium leaves had
similar values (14.28 and 14.49%). Shade dried bitter leaf and sundried scent leaf had
equal sugar (3.75%).

35
Table 2. Effects of sun and shade drying on the chemical composition of Okra,
Bitter Scent, G.latifolium and Roselle leaves (Dry wt).
PROTEIN FAT ASH FIBRE SUGAR STARCH
FOL 23.34+0.04 3.28+0.01 17.63+0.01 23.98+0.01 16.60+0.01 15.06+0.14
SUOL 21.27+0.04 1.26+0.12 15.89+0.01 21.27+0.01 5.18+0.01 35.15+0.02
SHOL 22.03+0.01 1.30+0.01 16.74+0.01 21.83+0.01 5.24+0.01 31.87+0.68
FBL 25.90+0.01 3.32+0.18 19.77+0.15 26.14+0.02 15.37+0.01 9.40+0.07
SUBL 21.33+0.01 1.29+0.01 13.94+0.01 20.89+0.02 4.13+0.32 39.36+0.03
SHBL 21.65+0.01 1.33+0.01 16.45+0.01 21.58+0.02 3.75+0.01 34.62+0.01
FSL 26.27+0.01 3.70+0.01 18.30+0.01 22.99+0.17 14.28+0.01 14.47+0.02
SUSL 14.30+0.02 1.36+0.01 15.02+0.01 20.43+0.01 3.75+0.01 44.61+0.02
SHSL 14.97+0.01 1.29+0.01 15.38+0.01 20.97+0.01 3.79+0.12 43.39+0.01
FGL 24.63+0.01 3.47+0.01 19.81+0.01 23.41+0.01 14.49+0.01 14.91+0.03
SUGL 18.40+0.01 1.26+0.01 16.14+0.01 20.65+0.01 4.97+0.02 38.69+0.05
SHGL 18.10+0.02 1.24+0.01 16.08+0.01 20.63+0.01 4.91+0.01 35.51+0.03
FRL 23.01+0.01 1.56+0.01 10.85+0.01 11.20+0.01 37.11+0.01 35.38+1.46
SURL 24.41+0.01 2.20+0.01 11.96+0.01 11.99+0.01 2.18+0.01 71.06+46.34
SHRL 23.91+0.01 2.10+0.01 11.71+0.01 12.14+0.01 2.10+0.07 69.20+10.79
Means + Standard deviation of three determinations
FOL = Fresh okra leaf FGL= Fresh G.latifolium leaf
SUOL = Sundried okra leaf SUGL = Sundried G. latifolium leaf
SHOL = Shade dried okra leaf SHGL= Shade dried G. latifolium leaf
FBL = Fresh bitter leaf FRL = Fresh roselle leaf
SUBL = Sundried bitter leaf SURL = Sundreid roselle leaf
SHBL = Shade dried bitter leaf SHRL = Shade dried roelle leaf
FSH = Fresh scent leaf
SUSL = Sundried scent leaf
SHSL = Shade dried scent leaf

36
Sun and shade dried roselle leaves had comparable sugar (2.18 and 2.10%). The sugar
content of the shade dried roselle was the least (2.10%)
The starch values for the vegetables varied. It ranged from 9.40 to 71.06%.
Sundried roselle had the highest starch (71.06%) followed closely by the shade dried
sample (69.20%). Sundried okra leaf and shade dried G. latifolium leaves as well as
the fresh roselle leaves had comparable values (35.15, 35.51 and 35.38%,
respectively). Fresh scent and G. latifolum leaves had similar starch values (14.47 and
14.91%). Fresh bitter leaf had the least value (9.40%)

37
Table 3 shows the mineral composition of the fresh, the sun and the shade dried
okra, bitter, scent, G. latifolium and roselle leaves (g/100g)
The copper content of the fresh, the sun and the shade dried okra leaves
varied. It ranged from 0.02 to 0.05mg. However, the fresh okra leaf had higher copper
than the sun and the shade dried samples (0.05 vs 0.02 and 0.03 mg) (P<0.05). The
value for the sun and the shade dried samples also were similar (P>0.05). The
phosphorous content of the samples varied. The sundried okra leaf had the highest
value (0.44mg). The fresh and the shade dried okra leaves had 0.39 and 0.42mg, each.
The difference in copper among the sun and shade dried samples as well as the fresh
differed (0.44, 0.42 and 0.39mg, respectively) (P<0.05). The iron content of the okra
leaf samples was different. It ranged from 1.15 to 2.07mg. Fresh okra leaf had the
highest iron (2.07 vs 1.17 and 1.15mg) (P<0.05). However, the iron content of the sun
and the shade dried samples was similar (1.17 and 1.15mg) (P>0.05). The zinc
content of the okra leaf samples varied. The range was from 2.01 to 2.13mg. The zinc
content of the sun and the shade dried samples was similar (2.02 and 2.01mg)
(P>0.05). However, they differed from that of the fresh sample (2.02 and 2.01 vs
2.13mg) (P<0.05).
The copper content of the fresh, the sun and the shade dried bitter leaf samples
varied. It ranged from 0.01 to 0.07mg. The copper values for the fresh, the sun and the
shade dried samples were comparable (0.07, 0.03 and 0.03 and 0.01mg, respectively)
(P>0.05). The phosphorus levels of the samples varied. It ranged from 0.38 to
0.42mg. The phosphorus levels for the fresh, the sun and the shade dried samples
were similar (0.38, 0.41 and 0.42 mg) (P>0.05). The iron content of bitter leaf
samples varied. The fresh bitter leaf sample had the highest iron, followed by the sun
dried sample as well as the shade dried sample (2.04 vs 1.19 and 1.15 mg,
respectively) (P<0.05). The iron content of the bitter leaf samples varied. The fresh
bitter leaf sample had the highest iron, followed by the sun dried as well as the shade
dried samples (2.04 vs 1.19 and 1.15mg, respectively) (P<0.05). The iron content of
the sun and the shade dried samples was similar (1.19 and 1.15 mg) (P>0.05). The
zinc levels differed. It ranged from 1.94 to 2.11mg. The shade dried bitter leaf had the
lowest zinc in comparison with the fresh and the sundried samples (1.94 vs 2.10 and
2.11 mg) (P<0.05). The fresh and the sundried samples had similar zinc (2.10 and
2.11mg) (P>0.05).

38
Table 3: Mineral composition of fresh,the sun and the shade dried okra, bitter,
scent, G. latifolium and roselle leaves (mg/100g)
COPPER PHOSPHORUS IRON ZINC
FOL 0.05 + 0.01 0.39 + 0.00 2.07 + 0.01 2.13 + 0.01
SUOL 0.02 + 0.00 0.44 + 0.03 1.17 + 0.01 2.02 + 0.02
SHOL 0.03 + 0.00 0.42 + 0.00 1.15 + 0.01 2.01 + 0.01
FBL 0.07 + 0.01 0.38 + 0.00 2.04 + 0. 51 2.10 + 0.01
SUBL 0.03 + 0.01 0.42 + 0.04 1.19 + 0.01 2.11 + 0.01
SHBL 0.01 + 0.00 0.41 + 0.00 1.15 + 0.20 1.94 + 0.01
FSL 0.05 + 0.00 0.37 + 0.00 1.96 + 0.01 2.13 + 0.03
SUSL 0.02 + 0.00 0.41 + 0.00 1.25 + 0.01 2.04 + 0.01
SHSL 0.02 + 0.00 0.43 + 0.00 1.17 + 0.01 1.95+ 0.01
FGL 0.05 + 0.01 0.37 + 0.00 1.86 + 0.01 2.08 + 0.01
SUGL 0.02 + 0.01 0.42 + 0.00 1.23 + 0.01 2.01 + 0.01
SHGL 0.03 + 0.00 0.43 + 0.00 1.16 + 0.01 1.81 + 0.01
FRL 0.05 + 0.01 0.39 + 0.00 2.00 + 0.01 2.18 + 0.01
SURL 0.07 + 0.01 0.44 + 0.00 1.74 + 0.01 1.68 + 0.01
SHRL 0.08 + 0.01 0.44 + 0.00 1.86 + 0.01 1.79 + 0.01
Means + Standard deviation of three determinations
FOL = Fresh okra leaf FGL= Fresh G. latifolium leaf
SUOL = Sundried okra leaf SUGL = Sundried G. latifolium leaf
SHOL = Shade dried okra leaf SHGL= Shade dried G. latifolium leaf
FBL = Fresh bitter leaf FRL = Fresh roselle leaf
SUBL = Sundried bitter leaf SURL = Sundried roselle leaf
SHBL = Shade dried bitter leaf SHRL = Shade dried roselle leaf
FSL = Fresh scent leaf
SUSL = Sundried leaf
SHSL = Shade dried scent leaf
39
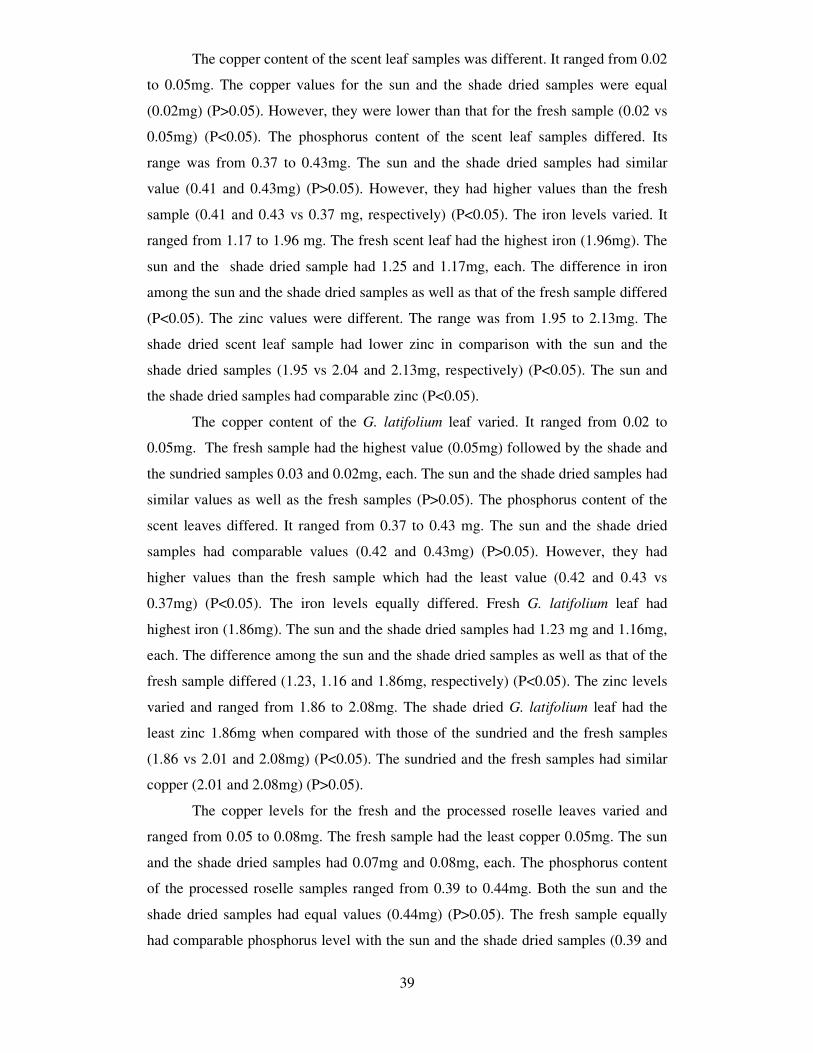
The copper content of the scent leaf samples was different. It ranged from 0.02
to 0.05mg. The copper values for the sun and the shade dried samples were equal
(0.02mg) (P>0.05). However, they were lower than that for the fresh sample (0.02 vs
0.05mg) (P<0.05). The phosphorus content of the scent leaf samples differed. Its
range was from 0.37 to 0.43mg. The sun and the shade dried samples had similar
value (0.41 and 0.43mg) (P>0.05). However, they had higher values than the fresh
sample (0.41 and 0.43 vs 0.37 mg, respectively) (P<0.05). The iron levels varied. It
ranged from 1.17 to 1.96 mg. The fresh scent leaf had the highest iron (1.96mg). The
sun and the shade dried sample had 1.25 and 1.17mg, each. The difference in iron
among the sun and the shade dried samples as well as that of the fresh sample differed
(P<0.05). The zinc values were different. The range was from 1.95 to 2.13mg. The
shade dried scent leaf sample had lower zinc in comparison with the sun and the
shade dried samples (1.95 vs 2.04 and 2.13mg, respectively) (P<0.05). The sun and
the shade dried samples had comparable zinc (P<0.05).
The copper content of the G. latifolium leaf varied. It ranged from 0.02 to
0.05mg. The fresh sample had the highest value (0.05mg) followed by the shade and
the sundried samples 0.03 and 0.02mg, each. The sun and the shade dried samples had
similar values as well as the fresh samples (P>0.05). The phosphorus content of the
scent leaves differed. It ranged from 0.37 to 0.43 mg. The sun and the shade dried
samples had comparable values (0.42 and 0.43mg) (P>0.05). However, they had
higher values than the fresh sample which had the least value (0.42 and 0.43 vs
0.37mg) (P<0.05). The iron levels equally differed. Fresh G. latifolium leaf had
highest iron (1.86mg). The sun and the shade dried samples had 1.23 mg and 1.16mg,
each. The difference among the sun and the shade dried samples as well as that of the
fresh sample differed (1.23, 1.16 and 1.86mg, respectively) (P<0.05). The zinc levels
varied and ranged from 1.86 to 2.08mg. The shade dried G. latifolium leaf had the
least zinc 1.86mg when compared with those of the sundried and the fresh samples
(1.86 vs 2.01 and 2.08mg) (P<0.05). The sundried and the fresh samples had similar
copper (2.01 and 2.08mg) (P>0.05).
The copper levels for the fresh and the processed roselle leaves varied and
ranged from 0.05 to 0.08mg. The fresh sample had the least copper 0.05mg. The sun
and the shade dried samples had 0.07mg and 0.08mg, each. The phosphorus content
of the processed roselle samples ranged from 0.39 to 0.44mg. Both the sun and the
shade dried samples had equal values (0.44mg) (P>0.05). The fresh sample equally
had comparable phosphorus level with the sun and the shade dried samples (0.39 and

40
0.44mg) (P>0.05). The iron (Fe) levels ranged from 1.74 to 2.0mg). The fresh roselle
had the highest Fe which was comparable with those of the sun and the shade dried
samples (2.0 vs 1.74 and 1.86mg) (P>0.05). The zinc values differed. It ranged from
1.68 to 2.18mg. The fresh roselle leaf had the highest value (2.18mg) and differed
from those of the sun and the shade dried samples (2.18 vs 1.68 and 1.79 mg)
(P<0.05). On the other hand, the sun and the shade dried samples had similar Fe (1.68
and 1.79mg) (P<0.05).

41
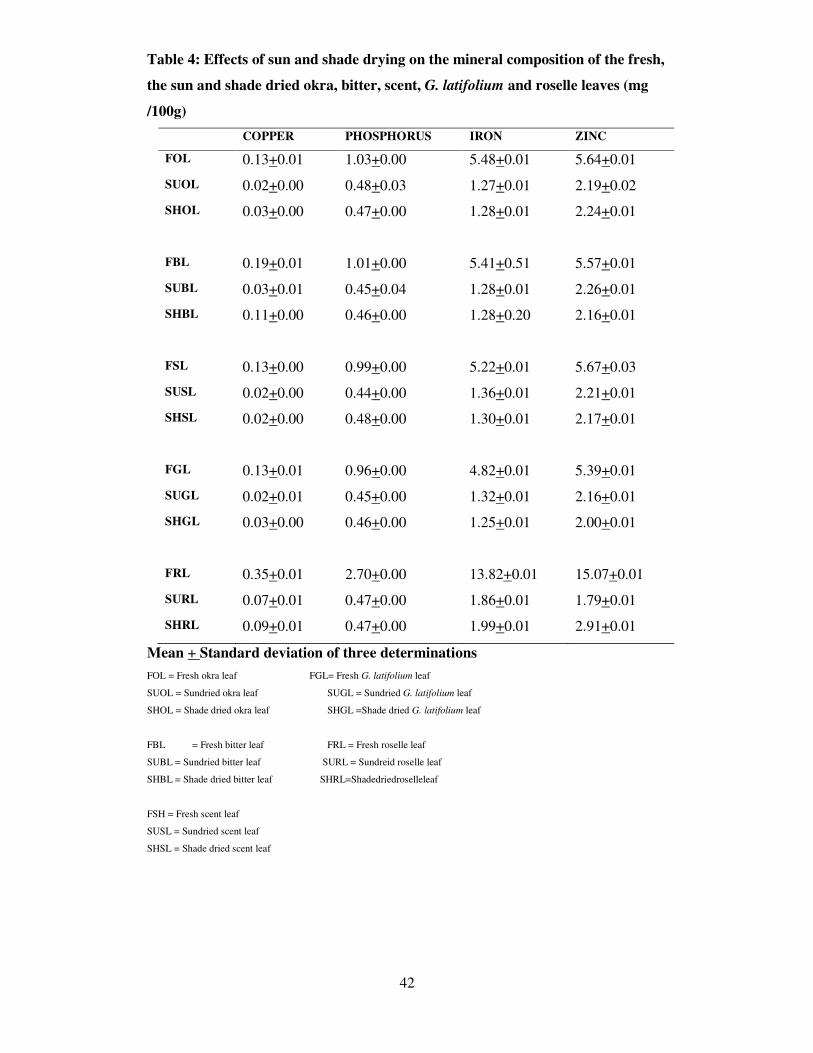
Table 4 shows the effects of sun and shade drying on the mineral composition of
fresh, sun and shade dried okra, bitter, scent, G. latifolium and roselle leaves.
The copper (Cu) levels for all the fresh, the sun and the shade dried samples
varied. It ranged from 0.02 to 0.35mg. Fresh roselle lesf had the highest Cu (0.35mg)
followed by the fresh bitter leaf (0.19mg) as well as fresh okra, scent and G. latifolium
leaves. These had comparable Cu (0.13mg). Sun and shade dried roselle leaves had
0.07 and 0.09mg, each. Shade dried okra and G.latifolium and the sundried bitter leaf
had comparable Cu (0.03mg). The least Cu (0.02mg) was those of the sundried okra,
scent and G. latifolium leaves as well as the shade dried scent leaf.
The phosphrus levels varied. Sundried bitter and G.latifolium leaves had the
least phosphorous (P) (0.45mg) followed by the shade dried bitter and G.latifolium
leaves (0.46mg). Shade dried okra and roselle leaves as well as sundried roselle leaf
had 0.47mg. Fresh roselle leaf had the highest (2.70mg). Fresh okra and bitter leaves
had similar P 1.03 and 1.01mg each. Fresh scent and G. latifolium leaves also had
similar P (0.99 and 0.96mg, each).
Fresh roselle leaf had the highest Fe (13.82mg). Fresh okra, bitter and scent
leaves had similar Fe (5.48 5.44 and 5.22mg). Fresh G. latifolium leaf had 4.87mg Fe.
Shade dried bitter and okra leaves as well as sundried bitter leaves had equal Fe
(1.28mg). Sun and shade dried roselle leaves had comparable Fe (1.86 and 1.99mg).
The shade dried G. latifolium leaf had the least Fe (1.25mg) followed by the sundried
scent and G. latifolium leaves. The shade dried scent leaf also had similar Fe (1.36,
1.32 and 1.30 mg). Fresh roselle leaf had the highest zinc (Zn) (15.07mg). Fresh okra,
bitter scent and G. latifolium leaves had similar Zn (5.64, 5.57, 5.67 and 5.39mg).
Shade dried bitter leaf and sundried G. latifolium leaf had comparable Zn (2.16mg).
The value was similar to that of the sun dried okra and the shade dried scent leaves
(2.19and 2.17mg). Shade dried G. latifolium leaf had the least Zn (2.00mg)
42
Table 4: Effects of sun and shade drying on the mineral composition of the fresh,
the sun and shade dried okra, bitter, scent, G. latifolium and roselle leaves (mg
/100g)
COPPER PHOSPHORUS IRON ZINC
FOL 0.13+0.01 1.03+0.00 5.48+0.01 5.64+0.01
SUOL 0.02+0.00 0.48+0.03 1.27+0.01 2.19+0.02
SHOL 0.03+0.00 0.47+0.00 1.28+0.01 2.24+0.01
FBL 0.19+0.01 1.01+0.00 5.41+0.51 5.57+0.01
SUBL 0.03+0.01 0.45+0.04 1.28+0.01 2.26+0.01
SHBL 0.11+0.00 0.46+0.00 1.28+0.20 2.16+0.01
FSL 0.13+0.00 0.99+0.00 5.22+0.01 5.67+0.03
SUSL 0.02+0.00 0.44+0.00 1.36+0.01 2.21+0.01
SHSL 0.02+0.00 0.48+0.00 1.30+0.01 2.17+0.01
FGL 0.13+0.01 0.96+0.00 4.82+0.01 5.39+0.01
SUGL 0.02+0.01 0.45+0.00 1.32+0.01 2.16+0.01
SHGL 0.03+0.00 0.46+0.00 1.25+0.01 2.00+0.01
FRL 0.35+0.01 2.70+0.00 13.82+0.01 15.07+0.01
SURL 0.07+0.01 0.47+0.00 1.86+0.01 1.79+0.01
SHRL 0.09+0.01 0.47+0.00 1.99+0.01 2.91+0.01
Mean + Standard deviation of three determinations
FOL = Fresh okra leaf FGL= Fresh G. latifolium leaf
SUOL = Sundried okra leaf SUGL = Sundried G. latifolium leaf
SHOL = Shade dried okra leaf SHGL =Shade dried G. latifolium leaf
FBL = Fresh bitter leaf FRL = Fresh roselle leaf
SUBL = Sundried bitter leaf SURL = Sundreid roselle leaf
SHBL = Shade dried bitter leaf SHRL=Shadedriedroselleleaf
FSH = Fresh scent leaf
SUSL = Sundried scent leaf
SHSL = Shade dried scent leaf

43
Table 5 shows the phytochemical composition of the fresh, the sun and the shade dried
okra, bitter, scent, G. latifolium and roselle leaves (mg/100g)
The tannins content of the fresh, the sun and the shade dried samples varied. It ranged
from 0.07 to 0.13mg. The fresh sample had the lowest tannins which differed from the shade
and the sundried samples (0.07 vs 0.10 and 0.13mg, respectively) (P<0.05). The sun and the
shade dried samples had comparable tannins (0.10 and 0.13mg) (P>0.05). The phytate content
of the sample differed. Its range was from65.86 to 122.37mg. However, the sun and the shade
dried samples had higher phytate than the fresh sample (123.22 and 122.37 vs 63.86mg,
respectively) (P<0.05). The phytate content of the sun and the shade dried samples was
similar (123.22 and 122.37mg) (P>0.05). The saponins content of the okra leaves varied. It
ranged from 0.03 to 0.11mg. The fresh okra leaf had varied saponins that varied from those of
the sun and the shade samples (0.11 vs 0.03 and 0.03mg) (P<0.05). However, the saponins
values for the sun and the shade dried samples was the same (0.03mg) (P>0.05). The
flavonoid content of okra leaf ranged from 1.69 to 2.54mg. The fresh okra leaf had the highest
flavonoid (2.25 vs 1.69 and 1.76mg) (P<0.05). The shade dried okra leaf had the second
highest and the sun dried sample had the least (1.76 vs 1.69mg, respectively) (P<0.05)
The tannins content of the fresh, the sun and the shade dried bitter leaf samples was
different. It ranged from 0.07 to 0.13mg. The fresh and the shade dried samples had equal
value (0.13mg) (P>0.05). However, they were higher than that of the fresh bitter leaf samples
(0.13 vs 0.07mg) (P<0.05). The phytate content ranged from 57.31 to 125.60mg. However,
the sun and the shade dried samples had higher phytate values than that of the fresh sample
(125. 60 and 124. 38 vs 57.31mg, respectively) (P<0.05). The phytate content of the sun and
the shade dried samples was comparable (125.60 and 124.38mg) (P>0.05). The saponins
levels ranged from 0.03 to 0.13mg. The sun and the shade dried samples had a similar value
(0.03mg) (P>0.05). However, they had higher value than that of the fresh bitter leaf sample
(0.03 and 0.13mg) (P<0.05). The flavonoid content varied. It ranged from 1.44 to 1.98mg.
The fresh bitter leaf had the highest flavonoid (1.98mg) which differed from that of the sun
and the shade dried samples that had 1.33 and 1.44mg, each (P<0.05). The sun and the shade
dried samples had similar value (P>0.05).
Tannins content of the fresh, the sun and the shade dried scent leaves varied. It
ranged from 0.10 to 0.12mg. The sundried scent leaf had the highest tannins (0.12mg). The
fresh

44
Table 5: Phytochemical composition of the fresh, the sun and the shade dried
okra, bitter, scent G. latifolium and roselle leaves (mg/100g)
TANNINS PHYTATE SAPONINS FLAVONOIDS
FOL 0.07 + 0.12 65.86 + 0.02 0.11 + 0.01 2.54 + 0.01
SUOL 0.13 + 0.01 123.22 + 0.01 0.03 + 0.00 1.69 + 0.01
SHOL 0.10 + 0.01 122.37 + 0.02 0.03 + 0.01 1.76 + 0.02
FBL 0.07 + 0.01 57.31 + 0.01 0.13 + 0. 01 1.98 + 0.01
SUBL 0.13 + 0.01 125.60 + 0.07 0.03 + 0.01 1.53 + 0.01
SHBL 0.13 + 0.00 124.38 + 0.07 0.03 + 0.00 1.44 + 0.02
FSL 0.10 + 0.01 60.12 + 0.01 0.11 + 0.01 2.24 + 0.01
SUSL 0.12 + 0.01 123.52 + 0.01 0.03 + 0.01 1.64 + 0.01
SHSL 0.11 + 0.01 122.63 + 0.01 0.01+ 0.00 1.45+ 0.01
FGL 0.07 + 0.00 55.55 + 0.07 0.11+ 0.01 2.12 + 0.08
SUGL 0.11 + 0.01 127.82 + 0.01 0.02 + 0.00 1.85 + 0.02
SHGL 0.08 + 0.01 125.69 + 0.04 0.03 + 0.01 1.40 + 0.02
FRL 0.10 + 0.00 63.24 + 0.01 0.10+ 0.01 1.55 + 0.01
SURL 0.13 + 0.01 121.13 + 0.01 0.04 + 0.01 2.49 + 0.01
SHRL 0.12 + 0.00 122.67 + 0.01 0.03 + 0.01 2.45 + 0.01
Means + Standard deviation of three determinations
FOL = Fresh okra leaf FGL= Fresh G latifolium leaf
SUOL = Sundried okra leaf SUGL = Sundried G. latifolium leaf
SHOL= Shade dried okra leaf SHGL= Shade dried G. latifolium leaf
FBL = Fresh bitter leaf FRL = Fresh roselle leaf
SUBL = Sundried bitter leaf SURL = Sundreid roselle leaf
SHBL = Shade dried bitter leaf SHRL = Shade dried roselle leaf
FSH = Fresh scent leaf
SUSL = Sundried scent leaf
SHSL = Shade dried scent leaf

45
and the shade dried samples had 0.10 and 0.11mg, each. The difference in tannins
among the fresh and the shade dried samples as well as that of the sun dried sample
was similar (P>0.05). The phytate levels ranged from 60.12 to 123.50mg. The fresh
scent leaf had phytate that differed from those of the shade and the sundried samples
(60.12 vs 122.63 and 123.52mg) (P<0.05). On the other hand, the phytate content of
the shade and the sundried samples was similar (P>0.05). The saponins content
deferred. The range was from 0.01 to 0.11mg. The fresh samples had the highest
value in comparism with the shade and the sun dried samples (0.11 vs 0.03 and
0.01mg) (P<0.05). The shade and the sundried scent leaves had similar values. It
ranged from 1.45 to 2.24 mg. The fresh scent sample had the higher flavonoid than
those of the sun and the shade dried samples (2.24 vs 1.64 and 1.45mg) (P<0.05).
The tannins content of the fresh, the sun and the shade dried G. latifolium
leaves varied. It ranged from 0.07 to 0.11mg. The sun dried sample had highest value
followed by the shade dried and the fresh (0.11vs 0.08 and 0.07mg, respectively)
(P<0.05). The shade dried and the fresh samples had similar value (P>0.05). The
phytate values ranged from 55.55 to 127.82mg. The sun dried G. latifolium leaves had
the highest phytate. The shade dried samples had the second highest (127.83 vs
125.67mg, respectively). Sundrying had an edge over the shade drying (127.83 and
125. 67mg) (P<0.05). However, both the sun and shade drying had higher phytate
than that of the fresh sample (127.83 and 125.67 vs 55.55mg) (P<0.05). The saponins
level G.latifolium leaves ranged from 0.02 to 0.11mg. The sun and the shade dried
samples had comparable saponins (0.02 and 0.03mg) (P>0.05). However, the fresh
sample had the highest which differed from those of the sun and the shade dried
samples (0.11 vs 0.02 and 0.03mg) (P<0.05). The flavonoid levels for the fresh and
the processed G. latifolium leaves varied. The range was from 1.40 to 2.12mg. The
fresh sample had the highest value (2.12mg) and the sun and the shade dried samples
had 1.85 and 1.40mg, each. The sun and the shade dried samples had similar value
(1.85 and 1.40 mg) (P>0.05). However, their values were different from that of the
fresh sample (1.85 and 1.40 vs 2.12mg) (P<0.05).
The tannins levels for the fresh, the sun and the shade dried roselle differed.
The sundried sample had the highest tannins (0.13mg). The sun dried and the fresh
samples had 0.12mg and 0.10mg, each. All three samples had similar values (0.13,
0.12 and 0.10mg) (P>0.05). The phytate content varied and ranged from 63.24 to 122.
67mg. Shade dried roselle had the highest phytate (122.67mg). The sundried and the
fresh samples had 121.13 and 63.224mg, each. The difference in phytate among the

46
sundried and the shade dried samples as well as that of the fresh differed (122.07,
121.13 and 63.24mg) (P<0.05). The saponins levels ranged from 0.04mg to 0.11mg.
The sundried sample had the least saponins (0.04mg). The shade dried sample had the
highest followed closely by the fresh sample (0.11 and 0.10mg) (P>0.05). Both had
different values from that of the fresh sample (0.11 and 0.10 vs 0.04mg) (P<0.05).
The flavonoid levels for the roselle samples ranged from 1.55 to 2.49mg. The shade
dried sample had the highest flavonoid (2.49mg) which was similar to that of the fresh
sample (2.45mg) (P>0.05). However, both values differed from that of the sun dried
sample (2.45 and 2.49 vs 1.55mg) (P<0.05).

47
Table 6 shows the effects of sun and shade drying on the phytochemical
composition of the fresh, the sun and the shade dried okra, bitter, scent, G.
latifolium and roselle leaves (mg/100g).
The tannins content for all the fresh, the sun and the shade dried samples
varied. The range was from 0.11 to 0.69mg. Shade dried okra leaf had the least
tannins (0.11mg) and the fresh roselle leaf had the highest (0.69mg). Fresh scent leaf
had the second highest value (0.22mg) followed by the fresh okra and bitter leaves
(0.19mg). Sundried okra, bitter and roselle leaves as well as the shade dried bitter leaf
had comparable value (0.14mg). The value was comparable to those of the shade
dried scent leaf, the sundried G. latifolium leaf and the shade dried roselle leaf
(0.13mg).
Fresh roselle leaf had the highest phytate (457.05mg). The sundried roselle
had the least values (129.37mg). The sun and the shade dried okra leaves, the sun and
the shade dried bitter leaf, the sun and the shade dried scent leaves and the sun and the
shade dried G. latifolium leaves had comparable values (133.45,136.32, 134.77,
138.68, 133.90, 136.36, 137.28 and 134.99mg, respectively). Fresh okra, bitter and
scent leaves had 174.33mg, 152.10mg and 160. 16mg, each.
The saponins levels for the samples differed. It ranged from 0.02 to 0.69mg.
Sundried G. latifolium leaf had the least saponins (0.02mg). The fresh roselle had the
highest saponins (0.69mg). The fresh bitter leaf had the second highest value
(0.35mg). The sun and the shade dried okra leaf, the sun and the shade dried bitter
leaf, the sundried scent leaf and the shade dried G. latifolium leaves had comparable
values (0.03mg). Shade dried scent and the roselle leaves had similar values (0.11mg
and 0.12mg, each). Fresh okra, scent and G. latifolium leaves had similar values
(0.2mg)
Fresh roselle had the highest flavonoid (10.71mg). The fresh okra leaf had the
second highest value (6.72mg). Fresh bitter, scent and G. latifolium leaves had similar
values (5.25, 5.97, and 5.50mg). Sun and shade dried roselle leaves had similar
flavonoid content (2.66 and 2.67mg). Shade dried okra and the sun dried G. latifolium
leaves had similar values (1.96 and 1.99mg). However, the shade dried bitter and the
scent leaves had comparable value (1.61mg).
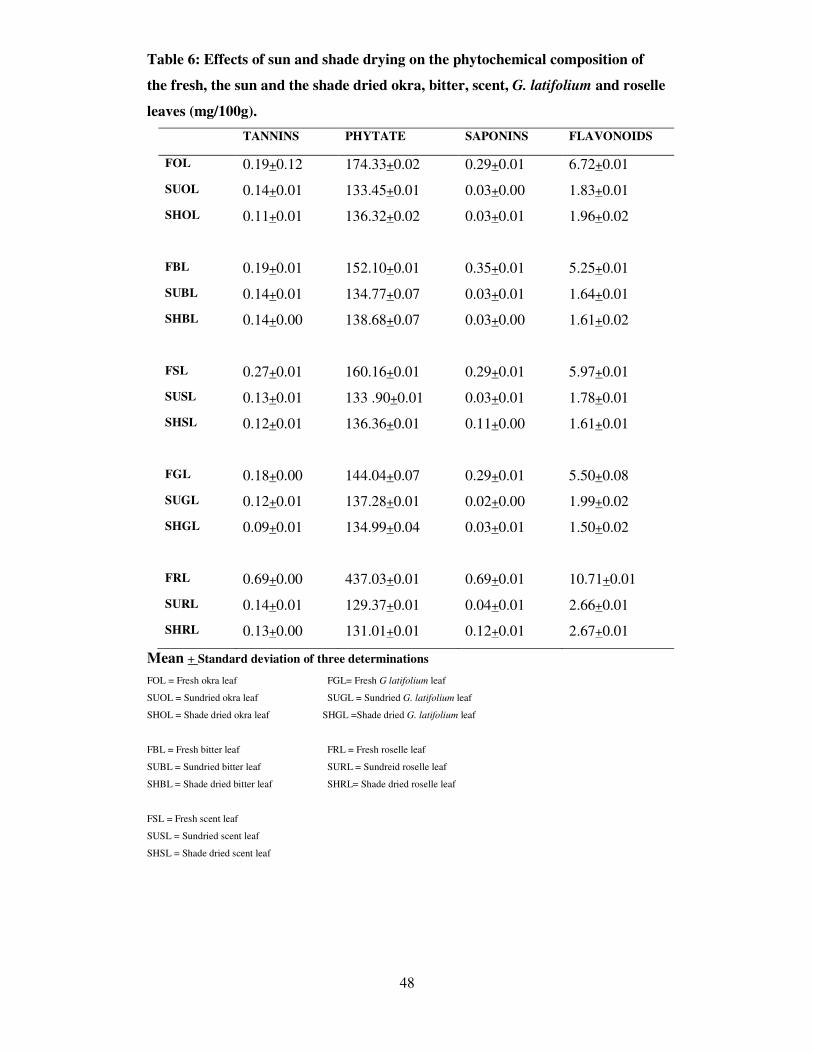
48
Table 6: Effects of sun and shade drying on the phytochemical composition of
the fresh, the sun and the shade dried okra, bitter, scent, G. latifolium and roselle
leaves (mg/100g).
TANNINS PHYTATE SAPONINS FLAVONOIDS
FOL 0.19+0.12 174.33+0.02 0.29+0.01 6.72+0.01
SUOL 0.14+0.01 133.45+0.01 0.03+0.00 1.83+0.01
SHOL 0.11+0.01 136.32+0.02 0.03+0.01 1.96+0.02
FBL 0.19+0.01 152.10+0.01 0.35+0.01 5.25+0.01
SUBL 0.14+0.01 134.77+0.07 0.03+0.01 1.64+0.01
SHBL 0.14+0.00 138.68+0.07 0.03+0.00 1.61+0.02
FSL 0.27+0.01 160.16+0.01 0.29+0.01 5.97+0.01
SUSL 0.13+0.01 133 .90+0.01 0.03+0.01 1.78+0.01
SHSL 0.12+0.01 136.36+0.01 0.11+0.00 1.61+0.01
FGL 0.18+0.00 144.04+0.07 0.29+0.01 5.50+0.08
SUGL 0.12+0.01 137.28+0.01 0.02+0.00 1.99+0.02
SHGL 0.09+0.01 134.99+0.04 0.03+0.01 1.50+0.02
FRL 0.69+0.00 437.03+0.01 0.69+0.01 10.71+0.01
SURL 0.14+0.01 129.37+0.01 0.04+0.01 2.66+0.01
SHRL 0.13+0.00 131.01+0.01 0.12+0.01 2.67+0.01
Mean + Standard deviation of three determinations
FOL = Fresh okra leaf FGL= Fresh G latifolium leaf
SUOL = Sundried okra leaf SUGL = Sundried G. latifolium leaf
SHOL = Shade dried okra leaf SHGL =Shade dried G. latifolium leaf
FBL = Fresh bitter leaf FRL = Fresh roselle leaf
SUBL = Sundried bitter leaf SURL = Sundreid roselle leaf
SHBL = Shade dried bitter leaf SHRL= Shade dried roselle leaf
FSL = Fresh scent leaf
SUSL = Sundried scent leaf
SHSL = Shade dried scent leaf
49
DISCISSION, CONCLUSION AND RECOMMENDATION
Chemical analysis.
The high moisture for fresh samples as well as the decreased moisture of the
sun and shade dried samples is an expected phenomenon (Table 1). It is common
knowledge that foods including fruits and vegetables exposed to either sun or shade
drying lose moisture along with volatile materials (Ezeife, 2003). The lower moisture
for okra, bitter, scent, G. latifolium and roselle leaves had some nutrition implications.
It is known that the lower the moisture content of a food, the higher the nutrient as
well as the shelf life (Odo, 2007). This indicates that sun drying had an edge over
shade drying. However, sundrying might have adverse effect on volatile nutrients e.g.
vitamin A content of fresh foods. This phenomenon is in line with the findings of
Ogbu (2007).
The lower protein for all fresh samples was due to their higher moisture values
(Table 1). The comparable protein for the sun and the shade dried samples for okra
(19.64 and 19.78%) , bitter leaf (19.88 and 19.42%), scent leaf (13.19 and 13.40%)
and roselle leaf (22.86 and 22.39%) showed that either of the methods was as good as
the other to preserve and increase the nutrient (protein). Sundried G. latifolium had an
edge over the shade dried sample. This indicates the superiority of sun drying to
conserve protein (Aletor and Adeogun, 1995). The lower protein for fresh roselle
leaves was due to its high moisture. It is known that the higher the moisture a food
contains, the lower are the dry matter of which protein is one. This is in agreement
with research carried out by many scholars Odo (2007), FAO (1997), Oguntona
(1998), Udofia (2005) in some seasonal vegetables.
The lower fat for all the sun and the shade dried samples except for the
sundried roselle leaf (2.06%) might be due to varietal differences. The lower fat for
treated sample is good. Lower fat of a food prevents chances of rancidity. The lower
fat for all samples regardless of treatment is expected. Vegetables contain low fat in
general to maintain cell wall integrity (Pampona- Roger, 2005).
The lower ash for all fresh vegetable is normal due to high moisture. The
higher ash for the sun and the shade dried vegetables was due to loss of vegetative
part of the vegetables which released the ash (dry matter) to increase free minerals for
their bioavailability (Ezeife, 2003). The comparable values for the sun and the shade
dried vegetables (Table1) showed that none had an edge over the other to increase ash
in these vegetables. However, the slight differences in these values are ascribed to
varietal differences and individual specificity (Oguntona, 1998: Wachap, 2003).
50
The lower fibre levels for all fresh vegetables are a function of moisture and
soil content. The high level for fibre in the processed samples was not a surprise.
Vegetables are good sources of fibre (Wardlaw and Kessel, 2002). However, the
higher levels for the sun and the shade dried samples were due to; (a) loss of moisture
that precipitated increased dry matter and (b) drying and milling, which led to release
of fibre from its complex carbohydrate compounds due to vegetative losses this is a
comparable phenomenon (Okoh, 1984: FAO, 1997).
The higher sugar for all fresh vegetable as against their processed samples
confirms that fresh vegetables are better sources of sugar. The lower sugar for the sun
and the shade dried samples might be due to loss along with moisture (Wachap,
2003). It is known that volatile nutrients’ including sugar is lost at any increase in
temperature (Ogbu, 2007).
The lower starch for the fresh samples as well as the processed samples is not
difficult to explain. Naturally, vegetables are not good sources of carbohydrate
(starch). However, if total carbohydrate was estimated, the value might have been
different. Total carbohydrate is comprised of fibre and sugar. This might have led to
the low starch. The higher starch for the sundried samples except for that of roselle
appeared to suggest the superiority of sun to shade drying of these vegetables.
Effects of sun and shade drying on the chemical composition
The higher protein for the sun and the shade dried vegetables (Table 2) was
because they contained high moisture that ranged from 61.44 to 85. 53%. When high
moisture was lost due to drying, the dry matter increased including protein (Tables 1
and 2). The higher protein for all treated samples was because they had lower
moisture than the fresh ones. As such, when the protein value was based on residual
moisture, the sun and the shade dried samples were advantaged. The lower fat for the
processed samples was an asset as regards risk of rancidity. Shelf life is enhanced in
foods that have low fat values.

51
Mineral composition
The low copper in all treated vegetables except for that of roselle might: (a) be
that the nutrient was low in the vegetables and (b) the anti-nutrient content in the
samples might have formed complex organic salt that made copper unavailable
(Wardlaw and Kessel, 2002).
The higher phosphorus levels for all the vegetables (treated samples) as
against their controls (Table 3) were associated with sun and shade drying. These
processes decreased moisture to increased dry matter of which phosphorus is one of
them.
The higher iron (Fe) for all fresh samples is not a surprise. Udofia (2005) and
Wachap (2006) observed the same phenomenon in various vegetables they studied.
The sun and the shade dried samples of all the vegetables had low iron. This is
contrary to the study of Kendal, DiPerso and Sefos (2008). They reported that iron is
not lost in vegetables due to drying. However, at higher temperature, the loss could be
possible.
The low zinc levels for the treated samples were expected and the higher
levels for fresh samples were also normal expectation. Zinc might exist as a volatile
substance in its complex salt as such; heat from sun and shade drying caused its
evaporation along with moisture.
Effects of sun and shade drying on mineral composition
The decreased values for copper, phosphorus, zinc and iron (Table 4) for the
sun and the shade dried samples was normal. Many had reported the same observation
(Udofia, 2005; Umoh, 2006; Mefoh, 2008; Okoye, 2006) in various vegetables.
Phytochemical composition
The increases in tannins and phytate are in line with the findings of Udofia
(2005) & Umoh (2006). It equally has some nutrition implications. Decades ago,
these two food none-nutritive components were regarded as anti-nutrients that chelate
nutrients and made them unavailable. Calcium, copper and zinc are good examples of
nutrients chelated by tannins and phytate. Recently, these anti-nutrients were found to
have antioxidant effects. Both are known to reduce serum cholesterol and might also
reduce the risk of cancer (Soetan, 2008: Bender, 2002). The increases in phytate were
much more in the sundried samples (Table 5).

52
The saponins levels for all the samples were low except for roselle (fresh
sample, 0.10mg, the sun and the shade dried samples (0.11mg). The higher saponins
for fresh samples have some health implications. Recent studies revealed that
saponins attacked and destroyed cancer cells. This is because saponins have affinity
for cholesterol in cancer virus cell membrane, leaving non cancer cells intact (Rao,
1996; Messina, 1979). The higher saponins in fresh vegetables means that fresh
vegetable is better source of saponins as well as flavonoids.
Effect of sun and shade drying on phytochemical composition of the vegetables
Lower levels for tannins for all shade dried samples except for that of bitter
leaf suggested that it was much more drastic to reduce tannins with shade drying than
with sundrying (Table 6). On the other hand, the lower phytate for all the sundried
samples except for G. latifolium sample appeared to suggest specificity of sundrying
on photochemical – a commonly observed fact. The comparable saponins for all the
vegetables except for those of the shade dried scent leaf and the shade dried roselle
leaf suggested that none of the food processing methods had an edge over the other.

53
CONCLUSION
The nutrient, mineral and phytochemical composition of the five cultivated
and wild forest vegetables were influenced by sun and shade drying. Both processes
decreased moisture, fat and sugar levels of the samples. They increased protein, ash,
fibre and starch of all the vegetables. When the values were based on residual
moisture, protein decreased except for that of roselle . Fat, ash and fibre increased
only in roselle samples. Both sun and shade drying lowered copper, iron and zinc and
increased phosphorus only. Fresh samples had lower protein. When based on residual
moisture, there were increases in protein of the shade dried samples except for scent
leaf. Fat deceased except for the shade dried scent leaf and the sundried G. latifolium
samples. Ash and fibre deceased due to residual moisture. Tannins and phytate
increased due to residual moisture. Saponins and flavonoids decreased in processed
samples because residual moisture reduced all the phytochemicals. The advantages of
sun and shade drying outweighed their disadvantages as domestic food processing
techniques.
RECOMMENDATIONS
1) Increase in vegetable consumption is imperative for all in both
rural and urban settings.
2) Sun and shade drying are cheap methods to preserve vegetables as
well as other foods to maintain food security all year round.
3) Vegetables should be pulverized and added to children’s foods who
often do not consume vegetables as adults.

54
REFERENCES
Afolabi, F. E. (2007). Chemical composition and antibacterial activity of
Gongronema Latifolium. Journal of Zhejiang University Science, 8 (5),
352-358.
Aletor, M.V.A., &Adeogun, O.A. (1995) Nutrient and antinutrient components of
some tropical leafy vegetables. Food Chemistry, 53,375-379.
Anonymous. (1999, September 4). Retrieved April 18, 2010, from http://bkb-
china.com/fidility/bitter.htm.
AOAC. (1995). Official Method of Analysis of the Association of Official analytical
Chemists. (15th
Ed.). Washington D.C; Association of Official Analytical
Chemists.
Be Healthy Enterprises INC. (2009, January 17). Colour Matters. Retrieved October
5, 2009, from, http://www.behealthyenterprise.com/colour-matters.
Bender, D. A (2002). Introduction to Human Nutrition ed Micheal J.G, Hester, H.V.
& France J. Blackwell Publishing London.
Bonis, M.L.K., Osuji, P.O., Tuah, A.K. (1993). Effect of supplementing teff straw
with different levels of leucaena and sesbania leaves on the degradabilities
of teff straw, sesbania, leucaeena, tagasaste and vernonia and on certain
rumen and blood metabolites in Ethiopia Menz sheep. Animal Food
Science Technology, 55, 101-129.
Burkill, H.M. (1983, February 27). The Useful Plants of West-Tropical Africa, VoI I.
Retrieved April 18, 2010, from http://www.aluka.org.html.
Caragay, A.B. (1992). Cancer preventing foods and ingredients. Food Technology, 46
(4), 65-68.
Chowdhurry, A.K.A., Jahirullah, I.J., Tabukder, S.A., & Khan, A.K.A. (1987).
Diuretic activities of saponins of Vigna spp. Journal of Bangladesh
Academy of Science, 11, 75.
Craig, W.J. (2009, June 3). Photochemicals; Guardians of Our Health. The American
Dietetic Association. Retrieved June 7, 2009, from http://www.vegetarian-
nutrition.info/on/phytochemicals.html.
Ebana, R.U.B., Madanagu, B.E., Ekpe, E.O., & Otung, I.N. (1991). Microbiological
exploitation of cardiac glycosides and alkaloids from Garcina kola,
Boreria ocynoides, Kola nitida and Citrus aurantifolia. Journal of Applied
Bacteriology, 71, 398-401.
Edoga, H.O., & Eriata, D.O. (2001). Alkaloid and tannins and content of some
Nigerian medicinal plants. Journal of Medicinal Aromatic Plant Science,
23, 21-25.

55
Efiri, E.C. (2009, April 8). The benefits of herbs O. gratissimum (Scent leaf).
Retrieved May 1, 2010, from, http://christopher-
efiri.blogspot.com/2009/02/effect-of-ocimum-gratissimum-on.html.
Ene-Obong, H.N. (2008). Nutrition Science and Practices; Emerging Issues and
Problems in Food Consumption, Diet Quality and Health. University of
Nigeria, Nsukka: Senate Ceremonials Committee.
Ene-Obong, H.N., Odoh, I.F., & Ikwuagwu O.E. (2003). Plasma vitamins A & C
status of in-school adolescents and associated factors in Enugu State,
Nigeria. Journal of Health Popuation and Nutrition, 21(11), 18-25.
Erasto, P., Grierson, D.S., & Afolayan, A.J. (2007). Evaluation of antioxidant activity
and the fatty acid profile of leaves of Vernonia amygdalina growing in
South Africa. Food Chemistry, 104, 630-642.
Esvanszhuga, G. (1980). The chemical constituents of Ocimum gratissimum. Doki
Tskha, 244, (2) 72-77.
Ezeife. C.J (2003). Identification, Onsumption Pattern and Nutrient Consumption of
Processed Green Leafy Vegetables and their Yam Dishes as Consumed in
Igbo-Ukwu in Anambra State, Nigeria. (Ph.D Thesis. University of
Nigeria, Nsukka).
Finar, I. (1987). Organic chemistry: Vol 11, Stereochemistry and chemistry of natural
products. England: Longman Scientific Technical.
Gills, L.S. (1992). Ethno Medical uses of plants in Nigeria. Uniben Press: University
of Benin, Benin City, Edo State, Nigeria, 176-177.
Herbal Medicin. (1993, December 13). Its use in treating some symptoms of AIDS: 9th
International AIDS conference. Retrieved June 6, 2009, from,
http://www.aegis.org/conferences/ice/1993/WSB326.html.
Hibiscus Sabdariffa. (2007, June 4). Hibiscus sabdariffa. Retrieved August 25, 2009,
from, http://www.hort.purdue.edn/newcrop/duke-energy/hibiscus-
sabdariffa.html.
Higdon, J. (2005). Phytoestrogen. Oregon State University: Linus Pauling Institute.
Holetzl, F.B., Nakamura, T.U., Frlho, B.P.D., Cortez, D.A.G., Diaz, J.A.M., &
Nakamura, C.V. (2003). Effects of essential oil of Ocimum gratissimum.
Herpefomonus Samulpessoai- Acta Protozoal, 42, 269-276.
Huffman, M.A., & Seifu, M. (1989). Primates. 30, 51.
Ijeh, I.I., Njoku, O.U., & Ekenza, E.C. (2004). Medicinal evaluation of Xylopia
aethiopics and Ocimum gratissimum. Journal of medicinal aromatic
science, 26(1), 44-47.
Iloveindia. (2004, August 1). Different Types of Vegetables. Retrieved April 18, 2010,
from, http://www.iloveindia.com.
56
Izevbigie, E.B., Bryant, J.L., 8 Walker, A. (2004). Natural inhibitor of extracellular
signal regulated kinases and human breast cancer cells. Experimental
Biology & Medicine, 229, 163-169.
Johnson, I.T., Gee, J.M., Price, K., Curl, C., & Fenwick, G.R. (1986). Influence of
saponins on gut permeability and active nutrient transport in-vitro. Journal
of American Medical Association, 116, 2270-2277.
Kanner, J., Frankel, E., & Granit, E. (1994). Natural antioxidants in grapes and wines.
Journal of Agriculture Food chemistry, 42, 64-69.
Kennedy, D. (1993). Leaf for life. Retrieved, September 2, 2009, from
http://www.leafforlife.org/pdfs/english/leaf.com.
Lam, L. K. T., Zhang, J., & Hasegawa, S. (1994). Inhibition of chemically induced
carcinogenesis by citrus liminoids. In: Huang, M.J., Osawa, C.T., &
Rosen, R.T. (Eds.). Food Phytochemicals for Cancer Prevention: Fruits
and Vegetables. Washinghton D.C: American Chemical Society.
Latta, M.C., & Eskin, M. (1980). “A simple and rapid colometric method for phytate
determination”, Journal of Agriculturec Food Chemistry, 28, 1313.
Lemos, J.A., Passos, X.S., Fernandes, O.F.L., Paula, J.R., Ferri, P.H., Souzr L.K.W.,
Lemos, A.A., & Silva, M.R.R. (2005). Antifungal activity from Ocimum
gratissimum L. Towards Cryptococcns neoformans. Men Inst. Oswaldo
Cruz: Rio de Janeiro.
Malinow, M.R., Morbin, M.J., & delaCastra, C.A. (1985). Effects of synthetic
glycosides on cholesterol absorption. Annal of. NewYork Academy of.
Science, 23, 454.
Maziya-Dixon, B., Akinyel, I.O., Oguntona, E.B., Nokeo, S., Sanusi, R.A., & Henis,
E. (2004). Nigeria Food Consumption and Nutrition Survey, 2001-2003
(Summary). International Institute of Tropical Agriculture (11TA): Ibadan,
Nigeria. 67.
Mefoh, N.C. (2003). The consumption pattern, nutritive values and organoleptic
attributes of processed Moringa oleifera and Afcelia Africana leaves and
dishes. (Ph.D Thesis. University of Nigeria, Nsukka).
Messina, M.J. (1999). Legumes and Soybeans: Overview of their nutritional profiles
and health benefits. American Journal of Clinical Nutrition, 55, 439-450.
Morebise, O., & Fafunso, M.A. (1998). Antimicrobial and Phototoxic activities of
Saponin Extracts from two Nigerian Edible Medicinal Plants. Biokemistri
8, 69-77.
Morebise, O., Fafunso, M.A., Makinde, J.M., Olajide, O.A., & Awe, E.O. (2002).
Ant- inflammatory Properties of leaves of Gongronema latifolium.
Phytother Reg, 16 (51), 575-577.
Morton, J (1987). Roselle. In: Julia F Morton (Ed) Fruits of Warm Climates (281-
286). Retrieved April 3, 2010, from
http://www.hort.purdu.edu/newcrop/indices/index ab.html.

57
Nakamura, C.V., Nakamura, T.V., Bardo, E., Melo, A.F.N., Cortez, D.A.G., & Ficho,
B.P.D. (1999). Anti-bacterial Activity of Ocimum gratissimum L. Essential
Oil. Mem Inst. Oswald. Cruz: Rio de Janeiro.
Odo, C.C. (2007). Effect of Dry Season on Green Leafy Vegetable production on
Household Food Security and Women Empowerment in Adani and Opi.
(B.Sc. Thesis, University of Nigeria, Nsukka).
Offia, V.N., & Chikwendu, U.A. (1999). Anti-diahorreal effect of Ocimum
gratissimum leaf extract in exponential animals. Journal of
Ethnopharmacology, 68 (1-3), 327-330.
Ogbu, I.F. (2007). Evaluation of beta-carotene, iron and other micronutrient status of
rats fed sun and shade dried fluted pumpkin. (Telifaria occidentalis) leaves
and its product, the leaf curd. Masters thesis, Dept of Nutrition and
Dietetics, U.N.N.
Ogundipe, O.O., Moody, J.O., Akinyemi, I.O., & Raman, A. (2003). Hypoglycemic
potentials of methanolic extracts of selected plant foods in alloxanized
mice. Plant foods for Human Nutrition, 58(3), 1-7.
Oguntona, E.B & Akinyele, I.O.(1995). Nutrient composition of commonly eaten
foods in Nigeria, raw processed and prepared.Food Basket Foundation
Publication Series. OBPT. Ibadan, Nigeria.
Oguntona, T. (1998). Green leafy vegetables In: Nutritional Quality of plant foods.
Osagie, A.U & Eka, O.U. Benin, Nigeria, PP 184-120.
Okafor, J.C. (1975). The place of wild (uncultivated) fruits and vegetables in Nigerian
diet. In: Ojehonim O.O., Town, O.A., & Maclean, K. (Eds). Proceedings
of the first National Seminar on Fruits and Vegetables, Ibadan, October,
1975, 13-17.
Okafor, J.C. (1995). Conservation and use of traditional vegetables from woody forest
species in South Eastern Nigeria. Enugu: FAME Agricultural Centre,
Enugu Nigeria. Retrieved June 20, 2009, from,
http://www.Bioversityinternational.org/publication/webversion/500/cho4/h
tml.
Okala, J.C., & Okaka, A.N.C. (2001). Composition, spoilage, shelflife, extension.
Enugu: O.C Janco Academic Publishers.
Okeke, E.C., Ene-Obong, H.N., Uzuegbunam, A.O., Ozioko, A.O., & Kuhnlein, H.
(2008). Igbo Traditional Food Systems: Documentation, Uses and
Research Needs. Pakistan Journal of Nutrition, 7(2). 365-376.
Okra. (2007, May 4). Herb Information: Okra (Hibiscus esculentus). Retrieved Aprils
3, 2010, from http://www.holisticonline.com/herbhome.html.
Olson, R.E. (Ed.). (1988). D-Limonene, an anticarcinogenic terpene. Nutrition
Review, 46,363-365.
Oxford Medical Dictionary. (2003). New York: Oxford University Press.

58
Pamplona-Roger, G.D. (2005). Encyclopedia of Foods and Their Healing Power.
Pradillo: Editorial Safeliz. S.L.
Pearson, D. (1976). Laboratory Techniques in Food Analysis. (2nd
Ed.) London:
Butterworth and CO (Publishers) Ltd.
Prehypertension. (2009, July 15). Prehypertension. Retrieved April 18, 2010, from,
http://en.wikipedia.org/wiki/prehypertension.
Price, M.L., & Butler, L.C. (1977). “Rapid visual estimation and spectrophotometric
determination of tannins content of sorghum grain”. Journal of
Agricultural Education Chemistry, 25, 1268.
Rao, A.V. (1996). Anticarcinogenic properties of plant saponins. Second
International Symposium on the role of soy in preventing and treating
chronic diseases. September 15-18, Brussels, Belgium.
Sanders, L.M. (2004, September 9). A Rainbow of Nutrition. Retrieved October 5,
2009, from, http://vickids.tamu.ed/nutrition/html.
Schneidr, C., Rotscheidt, K., & Breitmaier, E. (1993). Four New Pregnane Glycosides
From Gongronema latifolium. (Asekepiadaceae) Liebigs Annalen Der
Chemie, 10, 1057-1062.
Seddon, J.M., Ajani, A.U., & Sperduto, R.O. (1994). For the eye disease case-control
study group. Dietary carotenoids, vitamins A,C &E and advanced age-
related macular degeneration. Journal of American Medical Association,
272, 1413.1420.
Soetan, K.O. (2008, May 23). Pharmacological and other beneficial effects of anti-
nutritional factors in plants. A review. African Journal of Biotechnology, 7
(25), 4713-4721. Retrieved June 7, 2009, from,
http://www.academicjournals.org/AJB.
Sofowara, E.A. (1984). Medicinal plants and traditional medicine in Africa. Ibadan:
Spectrum Books Ltd.
Song, Y.Z., Lee, D.Y., Kim, S.N., Lee, K.R., Lee, H.W., Hon, J.W., Kang, D.W., Lee,
H.Y., & Kim, Y.K. (2005). Apoptotic potential of seequiterpen lactone
ergolide through the inhibition of NF-kB signaling pathway. Journal of
Pharmacology, 57(12), 1591-1597.
Steel, R.G.D., & Torrie, H.H. (1960). Principle and Procedure of Statistics with
Special Reference to Biological Sciences. New York: McGraw Hill.
Tankano, J. (1999, November 13). Health Benefits of Okra. Retrieved March A, 2010,
from, http://www.w3.org/1999/xhtml.
Tantillo, T. (2008, May 2). Reference Shelf: Phytochemicals. Retrieved May 5, 2009,
from, http://tonytantillo.com/reference/phyto.html.
59
Traditional medicine development for medical and dental primary health care delivery
system in Africa. (2005). African Journal of Traditional, complementary
and alternative medicine, 2(1), 46-61.
Udofia,U.S. (2006). The nutrient potentials of blends of “atama” (Heinsia arinata)
soup meal and cassava (Manihot esculentus) fufu dishes as consumed in
Ugo. Akwa Ibom State, Nigeria. (Ph.D Thesis. University of Nigeria,
Nsukka).
Ugochukwu, N.H., Babady, M.E., Cobourne, M., & Gusset, S.R. (2003). The effect of
Gongronema latifolium leaf extract on serum lipid profile and oxidative stress
of hepatocytes of diabetic rats. Journal of Bioscience. 28, 1-5.
Ugochukwu, N.H., & Babady, M.E. (2002). Antihyperglycemic effect of aqueous and
ethanolic extracts and Gongronema latifolium leaves on glucose and
glycogen metabolism in livers of normal and streptozotcinic induced
diabetic rats. Life Science, 73(15), 1925-1938.
Ugochukwu, N.H., & Babady, M.E. (2002). Antioxidant effects of Gongronema
latifolium in hepatocytes of rat models of non-insulin dependent diabetes
mellitus. Fitoterapia, 73(7-8), 612-618.
Umoh, E, J. (2007). Nutrient composition of blanched, sun and shade dried selected
green leafy vegetables, their soups and dishes as consumed in Tiv
community, Benue State, Nigeria. (Ph.D Thesis. University of Nigeria,
Nsukka)
United States Department of Agriclture. (2003, March 10). Phytonutrient F & Qs.
Agricultural Research Service. Retrieved June 7, 2009, from,
http://www.ars.usda.gov/Aboutus/does.htm.
Vegetable. (2008). Microsyl Student 2008 [DVD]. Microsoft Corporation.
Vernonia amygdalina. (2000, July 23). Vernonia amygdalina. Retrieved April 18,
2010, from. File:///G:/vernonia%20amggdalina.htm.gif.
Von Braun, J., Swaminathan, M.S., & Rosegrant, M.W. (2004) IFDRI Annual Report
Essay. Agriculture, Food Security, Nutrition and the Millennium
Development Goals.
Wachap, E.D. (2005) effects of sun and shade drying on nutrient qualities of six
seasonal green leafy vegetables used in soups and dishes in Taraba State,
Nigeria. (Ph.D Thesis. University of Nigeria, Nsukka).
Wardlaw, G.M., & Kessel, M. (2002). Perspectives in Nutrition (5th
Ed.). New York:
McGraw Hill.
Wikipedia-Okra. (2010, January 31). Okra. Retrieved April 18, 2010, from,
http://en.wikipedia.org/wiki/okra/xhtml.

60
Wikipedia-Roselle. (2009, October29). Roselle (Plant). Retrieved April 18, 2010,
from, http://en.wikipedia.org/wiki/hibiscus-sabdariffa/xhtml.
Wikipedia-Vernonia. (1999, June 3). Vernonia. Retrieved April 18, 2010, from
http://en.wikipedia.org/wiki/vernonia.xhtml.
WHO (2006). Nutrition for Health and Development Challenges. Department of
Nutrition for Health and Development: World Health Organisation,
Geneva. Retrieved April 18, 2010, from,
http://www.WHO.int/nutrition/challenges.
World Bank. (1991). Nigeria: Strategy for Food and Nutrition Security. Washington
D.C.
Yamaguchi, A. (1993). Antidiabetics containing aqueous extract of Pittosporum
plants. Chemical abstract, 129.