Electrostatically stabilized magnetic nanoparticles – an optimized protocol to label murine T...
9
ORIGINAL RESEARCH ARTICLE published: 16 December 2011 doi: 10.3389/fneur.2011.00072 Electrostatically stabilized magnetic nanoparticles – an optimized protocol to label murineT cells for in vivo MRI Eva Wuerfel †‡ , Maureen Smyth ‡ , Jason M. Millward , Eyk Schellenberger , Jana Glumm,Timour Prozorovski † , Orhan Aktas † , Ulf Schulze-Topphoff † , Jörg Schnorr, Susanne Wagner, Matthias Taupitz, Carmen Infante-Duarte § and Jens Wuerfel * § Charité – University Medicine Berlin, Berlin, Germany Edited by: Hans-Peter Hartung, Heinrich-Heine University Duesseldorf, Germany Reviewed by: Thomas G. Forsthuber, University of Texas at San Antonio, USA Jörg Kraus, Paracelsus Medical University, Austria *Correspondence: Jens Wuerfel, NeuroCure, Charité – University Medicine Berlin, Charitéplatz 1, 10117 Berlin, Germany. e-mail: [email protected] † Present address: Eva Wuerfel, Department of Pediatrics, University Luebeck, Luebeck, Germany; Timour Prozorovski, Department of Neurology, Medical Faculty, Heinrich-Heine-University Duesseldorf, Duesseldorf, Germany; Orhan Aktas, Department of Neurology, Medical Faculty, Heinrich-Heine-University Duesseldorf, Duesseldorf, Germany; Ulf Schulze-Topphoff, Department of Neurology, School of Medicine, University of California, San Francisco, CA, USA. ‡ Eva Wuerfel and Maureen Smyth equally contributing first authors. § Carmen Infante-Duarte and Jens Wuerfel are equally contributing last authors. We present a novel highly efficient protocol to magnetically labelT cells applying electrosta- tically stabilized very small superparamagnetic iron oxide particles (VSOP). Our long-term aim is to use magnetic resonance imaging (MRI) to investigate T cell dynamics in vivo during the course of neuroinflammatory disorders such as experimental autoimmune encephalomyelitis (EAE), an animal model of multiple sclerosis. Encephalitogenic T cells were co-incubated withVSOP, or with protamine-complexedVSOP (VProt), respectively, at different conditions, optimizing concentrations and incubation times. Labeling efficacy was determined by atomic absorption spectrometry as well as histologically, and evaluated on a 7T MR system. Furthermore, we investigated possible alterations of T cell physiology caused by the labeling procedure. T cell co-incubation with VSOP resulted in an efficient cellular iron uptake. T2 times of labeled cells dropped significantly, resulting in prominent hypointensity on T2∗-weighted scans. Optimal labeling efficacy was achieved by VProt (1 mM Fe/ml, 8 h incubation; T2 time shortening of ∼80% compared to untreated cells). Although VSOP promoted T cell proliferation and altered the ratio of T cell subpopulations toward a CD4 + phenotype, no effects on CD4 T cell proliferation or phenotypic stability were observed by labeling in vitro differentiatedTh17 cells with VProt.Yet, high concentra- tions of intracellular iron oxide might induce alterations in T cell function, which should be considered in cell tagging studies. Moreover, we demonstrated that labeling of encephal- itogenic T cells did not affect pathogenicity; labeled T cells were still capable of inducing EAE in susceptible recipient mice. Keywords: magnetic resonance imaging, magnetic nanoparticles, protamine, cell labeling,T cell, EAE INTRODUCTION T cells are key players in inflammatory and degenerative disorders of the central nervous system (CNS), including frequent illnesses such as Alzheimer’s disease (Weiner and Frenkel, 2006) or stroke (Hendrix and Nitsch, 2007), apart from their well described impli- cation in infectious and autoimmune diseases. In multiple sclerosis (MS), encephalitogenic T cells are suspected to trigger demyeli- nation and neuronal damage resulting in persisting disability in patients (Zipp and Aktas, 2006). T cells were shown to directly induce neuronal cell death in murine brain slices (Aktas et al., 2005). In order to gain further insight into the pathogenesis of T cell mediated diseases, a sensitive method to monitor lympho- cyte trafficking in vivo would be of utmost interest. Novel imaging methods visualizing cells have recently emerged or undergone refinement. Among these, magnetic resonance imaging (MRI) has held its ground as an elaborate in vivo tool to non-invasively observe temporal and spatial migration of labeled cells (Modo et al., 2005; Arbab et al., 2006; Liu and Frank, 2008). A prereq- uisite for MR cell tracking is the efficient labeling of cells by a contrast agent that is able to evoke a high cell-to-tissue con- trast. For this purpose, magnetic nanoparticles have become well appreciated. Magnetic particles cause strong susceptibility effects on T2- and T2∗-weighted sequences, and are generally well toler- ated by labeled cells and the organisms under investigation (Rogers et al., 2006). However, in contrast to phagocytic cells such as macrophages, that are easily labeled in vitro and in vivo due to their natural disposition to internalize particles, tagging of T lym- phocytes has remained a particular challenge. Only few studies to data have achieved successful T cell labeling in vivo (Yeh et al., 1995; Dodd et al., 2001; Kircher et al., 2003; Anderson et al., 2004; Pirko et al., 2004; Billotey et al., 2005; Daldrup-Link et al., 2005; Hu et al., 2005; Smirnov et al., 2008). So far, the reluctance of T cells to www.frontiersin.org December 2011 |Volume 2 | Article 72 | 1
-
Upload
independent -
Category
Documents
-
view
2 -
download
0
Transcript of Electrostatically stabilized magnetic nanoparticles – an optimized protocol to label murine T...

ORIGINAL RESEARCH ARTICLEpublished: 16 December 2011doi: 10.3389/fneur.2011.00072
Electrostatically stabilized magnetic nanoparticles – anoptimized protocol to label murineT cells for in vivo MRI
Eva Wuerfel †‡, Maureen Smyth‡, Jason M. Millward, Eyk Schellenberger , Jana Glumm,Timour
Prozorovski †, Orhan Aktas†, Ulf Schulze-Topphoff †, Jörg Schnorr , Susanne Wagner , MatthiasTaupitz,
Carmen Infante-Duarte§ and Jens Wuerfel*§
Charité – University Medicine Berlin, Berlin, Germany
Edited by:
Hans-Peter Hartung, Heinrich-HeineUniversity Duesseldorf, Germany
Reviewed by:
Thomas G. Forsthuber, University ofTexas at San Antonio, USAJörg Kraus, Paracelsus MedicalUniversity, Austria
*Correspondence:
Jens Wuerfel , NeuroCure,Charité – University Medicine Berlin,Charitéplatz 1, 10117 Berlin, Germany.e-mail: [email protected]†Present address:
Eva Wuerfel , Department ofPediatrics, University Luebeck,Luebeck, Germany;Timour Prozorovski , Department ofNeurology, Medical Faculty,Heinrich-Heine-UniversityDuesseldorf, Duesseldorf, Germany;Orhan Aktas, Department ofNeurology, Medical Faculty,Heinrich-Heine-UniversityDuesseldorf, Duesseldorf, Germany;Ulf Schulze-Topphoff , Department ofNeurology, School of Medicine,University of California, SanFrancisco, CA, USA.‡Eva Wuerfel and Maureen Smythequally contributing first authors.§Carmen Infante-Duarte and JensWuerfel are equally contributing lastauthors.
We present a novel highly efficient protocol to magnetically labelT cells applying electrosta-tically stabilized very small superparamagnetic iron oxide particles (VSOP). Our long-termaim is to use magnetic resonance imaging (MRI) to investigate T cell dynamics in vivoduring the course of neuroinflammatory disorders such as experimental autoimmuneencephalomyelitis (EAE), an animal model of multiple sclerosis. Encephalitogenic T cellswere co-incubated with VSOP, or with protamine-complexed VSOP (VProt), respectively, atdifferent conditions, optimizing concentrations and incubation times. Labeling efficacy wasdetermined by atomic absorption spectrometry as well as histologically, and evaluated ona 7T MR system. Furthermore, we investigated possible alterations of T cell physiologycaused by the labeling procedure. T cell co-incubation with VSOP resulted in an efficientcellular iron uptake. T2 times of labeled cells dropped significantly, resulting in prominenthypointensity on T2∗-weighted scans. Optimal labeling efficacy was achieved by VProt(1 mM Fe/ml, 8 h incubation; T2 time shortening of ∼80% compared to untreated cells).Although VSOP promoted T cell proliferation and altered the ratio of T cell subpopulationstoward a CD4+ phenotype, no effects on CD4 T cell proliferation or phenotypic stabilitywere observed by labeling in vitro differentiatedTh17 cells with VProt.Yet, high concentra-tions of intracellular iron oxide might induce alterations in T cell function, which should beconsidered in cell tagging studies. Moreover, we demonstrated that labeling of encephal-itogenic T cells did not affect pathogenicity; labeled T cells were still capable of inducingEAE in susceptible recipient mice.
Keywords: magnetic resonance imaging, magnetic nanoparticles, protamine, cell labeling,T cell, EAE
INTRODUCTIONT cells are key players in inflammatory and degenerative disordersof the central nervous system (CNS), including frequent illnessessuch as Alzheimer’s disease (Weiner and Frenkel, 2006) or stroke(Hendrix and Nitsch, 2007), apart from their well described impli-cation in infectious and autoimmune diseases. In multiple sclerosis(MS), encephalitogenic T cells are suspected to trigger demyeli-nation and neuronal damage resulting in persisting disability inpatients (Zipp and Aktas, 2006). T cells were shown to directlyinduce neuronal cell death in murine brain slices (Aktas et al.,2005). In order to gain further insight into the pathogenesis ofT cell mediated diseases, a sensitive method to monitor lympho-cyte trafficking in vivo would be of utmost interest. Novel imagingmethods visualizing cells have recently emerged or undergonerefinement. Among these, magnetic resonance imaging (MRI) hasheld its ground as an elaborate in vivo tool to non-invasively
observe temporal and spatial migration of labeled cells (Modoet al., 2005; Arbab et al., 2006; Liu and Frank, 2008). A prereq-uisite for MR cell tracking is the efficient labeling of cells bya contrast agent that is able to evoke a high cell-to-tissue con-trast. For this purpose, magnetic nanoparticles have become wellappreciated. Magnetic particles cause strong susceptibility effectson T2- and T2∗-weighted sequences, and are generally well toler-ated by labeled cells and the organisms under investigation (Rogerset al., 2006). However, in contrast to phagocytic cells such asmacrophages, that are easily labeled in vitro and in vivo due totheir natural disposition to internalize particles, tagging of T lym-phocytes has remained a particular challenge. Only few studies todata have achieved successful T cell labeling in vivo (Yeh et al.,1995; Dodd et al., 2001; Kircher et al., 2003; Anderson et al., 2004;Pirko et al., 2004; Billotey et al., 2005; Daldrup-Link et al., 2005; Huet al., 2005; Smirnov et al., 2008). So far, the reluctance of T cells to
www.frontiersin.org December 2011 | Volume 2 | Article 72 | 1

Wuerfel et al. T cell labeling for MRI
incorporate magnetic nanoparticles has remained a major obstacleto MR investigations.
We here developed a novel T lymphocyte labeling proto-col applying very small superparamagnetic iron oxide particles(VSOP). In contrast to commonly used polymer-coated magneticnanoparticles, VSOP are extremely small, but inherit superiorlabeling properties due to an electrostatically stabilized citratecoating (Fleige et al., 2002). VSOP have already been success-fully applied for the visualization of neuronal precursor cells(Focke et al., 2008), mesenchymal stem cells (Heymer et al., 2008),macrophages in a murine ischemia model (Stroh et al., 2005), aswell as macrophages and activated microglia in a mouse model ofMS (Wuerfel et al., 2007). Considering the limited phagocytic abil-ity of T lymphocytes, we compared VSOP co-incubation with celltransfection applying protamine-complexed VSOP (VProt). Pro-tamine is a naturally occurring peptide with membrane translo-cating properties (Reynolds et al., 2005); it is FDA approved as aroutine antidote to heparin-induced blood anticoagulation. In thepast, no modification of cell viability, proliferation, or differentia-tion has been noted when protamine was applied as a transfectionagent (Arbab et al., 2004, 2005; Suzuki et al., 2007). Our protocolhas been established on freshly isolated encephalitogenic murineT cells, which are commonly used to induce experimental autoim-mune encephalomyelitis (EAE), via adoptive transfer (Wuerfelet al., 2007). The study was specifically designed to investigatethe potential impact of the labeling procedure on T cell function-ality as well as to optimize the labeling efficacy for future transferEAE in vivo experiments.
MATERIALS AND METHODSMAGNETIC NANOPARTICLES FOR CELL LABELINGWe applied VSOP (VSOP-C200, Ferropharm GmbH, Teltow, Ger-many) for T cell labeling with magnetic nanoparticles. VSOPare electrostatically stabilized nanoparticles coated with citratemonomers comprising a hydrodynamic diameter of 7.6 ± 2.1 nmand yielding a negative surface charge with a zeta potential of−45.6 ± 30.7 mV.
For the preparation of VProt, VSOP were decorated with pro-tamine (protamine from salmon, Sigma-Aldrich, Munich, Ger-many) by non-covalent electrostatic attraction. Protamine, a pep-tide of about 32 amino acids, is positively charged due to 22arginines. The positive surface charge of VProt keeps the particlesin suspension. VSOP (25 ml; 6.6 mM Fe, pH 7.4) was rapidly mixedwith 25 ml protamine (0.5 mM, pH 7.4). Thereafter,VProt was dia-lyzed for 24 h in a Spectra/Por-7 membrane against water (molec-ular weight cut-off 15000, Spectrum Laboratories, Eindhoven, TheNetherlands). The hydrodynamic diameter and the zeta potentialof VProt were determined by measuring dynamic light scatteringwith a Zetasizer nano ZS (Malvern Instruments, Worcestershire,UK) in water according to the manufacturers instructions. Com-pared to the parent material VSOP, the hydrodynamic size wassubstantially increased to 42 ± 16 nm and the surface charge wasreversed (zeta potential+57.9 ± 6.78 mV). The iron concentrationwas determined spectrophotometrically (Shen et al., 1993).
CELL CULTURE AND LABELINGT cells were obtained from 6- to 8-week-old female SJLmice (Charles River, Sulzfeld, Germany), housed in a pathogen
free-environment. All experiments were approved by the by thelocal animal welfare committee (LAGeSo Berlin, Germany), andconformed to the European Communities Council Directive(86/609/EEC). Mice were immunized subcutaneously with 200 μgPLP 139–1051 (Pepceuticals, Leicester, UK), 600 μg Mycobac-terium tuberculosis H37Ra (Difco Laboratories Detroit, MI, USA)emulsified in 100 μl Complete Freund’s adjuvant (CFA, DifcoLaboratories Detroit, MI, USA) and 100 μl phosphate bufferedsaline (PBS). Mice were sacrificed 10 days after immunization,and paraaortal, popliteal as well as inguinal lymph nodes wereextracted. For cell isolation, tissue was macerated through an80-μm mesh (BD Falcon, Heidelberg, Germany). Lymph nodecells were re-stimulated for 4 days with 12.5 μg PLP in RPMI1640 cell culture medium (Sigma-Aldrich, Munich, Germany)supplemented with 10% fetal calf serum, 1% glutamine, 1%penicillin/streptomycin, and 1% Hepes buffer at 37˚C. There-after, the fraction of CD3+ T cells was enriched (purity 90–95%) using a negative magnetic selection kit for T cells (DynalInvitrogen, Oslo, Norway). Subsequently, T cells were platedat a concentration of 2 × 10⁶ cells/ml in cell culture mediumwith 100 U/ml IL-2 (Invitrogen, Karlsruhe, Germany) and leftfor 1 h at 37˚C to recover. Optimal settings for cell labeling byco-incubation with VSOP were determined varying the incu-bation time (1 h, 4 h, 8 h, 12 h, 24 h, 2 days, 4 days) as well asthe concentrations (0.5, 1, 3, 6, 9 mM Fe/ml), based on proto-cols previously approved for macrophage labeling (Fleige et al.,2002). Equivalent dose finding experiments were carried outapplying VProt (0.001, 0.01, 0.05, 0.1, 1, 3 mM Fe/ml). Afterco-incubation, cells were thoroughly washed three times withPBS to remove excessive contrast agent. Cell viability was deter-mined in a trypan-blue exclusion assay using a Neubauer countingchamber.
ASSESSMENT OF IRON UPTAKEIntracellular iron uptake was assessed by atomic absorption spec-troscopy (AAS). For cell lysis, 6 × 10⁵ cells were incubated with50 μl HCl 32% until complete dissolution and then topped upto 3 ml with distilled water. Samples could subsequently be mea-sured by an atom absorption spectrometer (Unicam 969; NicoletInstruments GmbH, Offenbach, Germany).
Additionally, nuclear magnetic resonance (NMR) transverserelaxation time (T2) was determined by relaxometry (Bruker Min-ispec MQ 40, 0.94 T, Karlsruhe, Germany), as previously described(Stroh et al., 2004, 2006). A suspension of 2 × 10⁶ cells in 1 mlcell culture medium supplemented with 5% fetal calf serum,1% penicillin/streptomycin, and 1% Hepes buffer, was preheatedto 40˚C before measurement to avoid temperature equilibrationartifacts.
In all in vitro MRI experiments, labeled and thoroughly washedT cells were resuspended in preheated 1% agarose in distilled water,and transferred to 500 μl tubes, which we embedded in agarose-prefilled 50 ml tubes. These gel phantoms were subsequentlyimaged applying a T2∗-weighted sequence (GEFI, TR 1200 ms, TE5.6 ms, 6 slices, 1 mm slice thickness, matrix 4 × 3.06 cm) on a 7 Tsmall animal MRI Scanner (Pharmascan 70/16AS, Bruker BioSpin,Ettlingen, Germany). We included control samples of unsortedlymph node cells in all measurements to exclude a contaminationof magnetic beads deriving from the cell separation kit.
Frontiers in Neurology | Multiple Sclerosis and Neuroimmunology December 2011 | Volume 2 | Article 72 | 2
Wuerfel et al. T cell labeling for MRI
For microscopy,cells were incubated on Poly-d-Lysine (BD Bio-sciences, Heidelberg, Germany) coated object slides for 2 h, washedthree times with PBS, and fixed for 10 min in 4% paraformalde-hyde in PBS. Prussian Blue staining was performed on the slidesaccording to Pearl’s method (Perl and Good, 1992) for visual-ization of the iron oxide particles. Cells were examined by epi-fluorescence microscopy and digitally photographed (OlympusBX-51, Hamburg, Germany). Images were assembled using AdobePhotoshop (Adobe Systems, San Jose, CA, USA).
3[H]THYMIDINE INCORPORATION ASSAYAntigen-specific proliferation was assessed by a 3[H]thymidineincorporation assay. Briefly, PLP-primed CD3+-enriched T cellswere incubated with irradiated splenocytes in cell culture mediumin a 96-well plate (BD Falcon, Heidelberg, Germany) at concen-trations of 50000 T cells and 150000 splenocytes per well. Prolifer-ation was induced by 12.5 or 25 μg PLP added to the medium andcompared to the untreated condition. Each condition was repeatedwith different VSOP concentrations (1, 3, 6, 9 mM Fe/ml). After48 h, 0.5 μCi 3[H]thymidine (Amersham, Buckinghamshire, UK)was added to the culture, and the incorporation into the T cellDNA measured with a beta counter (Wallac, Freiburg, Germany)18 h later.
FLOW CYTOMETRYCell death, activation as well as differentiation markers were inves-tigated by flow cytometric analysis. After the labeling procedure,T cells were incubated with CD16/CD32 to avoid unspecific anti-body binding and stained afterward with anti-CD3-FITC, anti-CD4-PE and anti-CD8-FITC antibodies. After staining, all sampleswere thoroughly washed, and analyzed by flow cytometry (FAC-SCalibur, BD Biosciences, Heidelberg, Germany). Cell viability wasdetermined by adding 0.1 mg propidium iodide/ml to the sampleimmediately before acquisition.
GENERATION AND ASSESSMENT OF PROLIFERATION AND CYTOKINEPRODUCTION OF DIFFERENTIATED IL-17 PRODUCING T CELLSSpleen and lymph nodes were collected from TCR transgenicmice (2D2) specific for MOG 35–55, and a CD4 naive MACSseparation was performed to generate Th17-polarized T cells.T cells were co-cultured in a 1:4 ratio with CD90-depleted, irra-diated antigen presenting cells, taken from wild-type C57Bl/6mice in the presence of TGF-β (3 ng/ml), IL-23 (20 ng/ml), andIL-6 (20 ng/ml) all from R&D. IL-2 was added to the culturesat day 3. After 7 days, the T cells were re-stimulated for 72 hat 37˚C in 5% CO2 with cytokines in the presence of Vprot(0.3 or 1 mM) or an equivalent amount of protamine aloneand carboxyfluorescein succinimidyl ester (CFSE, 2.5 μM) toassess proliferation. Subsequently, the cells were stained withanti-CD4 antibodies (BD, Heidelberg, Germany). Additionally, tomonitor phenotypic stability, a cell fraction was fixed with 2%formaldehyde for 20 min and then permeabilized with saponin(0.5%; Sigma) for intracellular staining with anti-IL-17 antibod-ies (eBioscience, Frankfurt, Germany) as described previously(Infante-Duarte et al., 2000). The proportion of proliferatingCD4-positive cells and IL-17-producing cells was analyzed by flowcytometry.
ADOPTIVE TRANSFER EAEFor adoptive transfer EAE, PLP-specific T cells obtained fromPLP immunized mice were cultured in the presence of VSOPor VProt for 4 days as described in 2.2. To induce EAE, 8–12 × 106 T-cell blasts in 100 μl PBS were injected intraperi-toneally into syngenic recipients (Wuerfel et al., 2010). Mice wereweighed daily and scored for neurological deficits as previouslydescribed (Wuerfel et al., 2010): 0, unaffected; 1, tail weakness orimpaired righting reflex; 2, paraparesis; 3, paraplegia; 4, paraple-gia with forelimb weakness or complete paralysis; score >3, to besacrificed.
DATA ANALYSISOneway/univariate ANOVA with post hoc Scheffé analysis was per-formed to determine significant differences (p < 0.05) betweenVSOP, VProt and negative controls. AAS measurements were runin triplicate. The relaxometry data presented in this study werepooled from three different experiments, each run in duplicate,except for the time course experiment in Figure 2C, which wasconducted only once in duplicate, and hence excluded from fur-ther statistical analysis. Flow cytometry data were obtained fromfour independent experiments. The proliferation assay was con-ducted in quadruplicate. Data in the figures present mean valuesand standard deviation.
RESULTST CELL LABELING BY CO-INCUBATION WITH VSOPFirst we determined the optimal concentration of VSOP and thebest incubation time for labeling T cells. Efficient T cell label-ing was achieved after 24 h co-incubation with VSOP at con-centrations approved for macrophage labeling (1–9 mM Fe/ml)as reflected by Prussian Blue staining in Figure 1A. The vesicu-larly shaped distribution of particles suggested an accumulationwithin cytosolic endosomes. The amount of intracellular VSOPaugmented with increasing concentrations of VSOP during co-incubation (Figure 1A1–3). However, at concentrations exceeding6 mM Fe/ml, unspecific adherence of VSOP to the cellular surfacebecame more prominent (Figure 1A3).
Relaxometry measurements revealed a sequential shorteningof T2 times by increasing VSOP concentrations during incu-bation. We observed a decrease of T2 times from 832.4 ms at1 mM Fe/ml to 329.7 ms at 9 mM Fe/ml (Figure 1B). The ANOVAgroup difference between VSOP treated and unlabeled controlcells was significant (p < 0.001). Post hoc Scheffé testing revealeda significant difference already at lowest VSOP concentrations at1 mM Fe/ml VSOP (p < 0.001). Accordingly, the iron content perT cell determined by atomic absorption spectrometry increasedwith augmenting VSOP labeling concentrations between 1 and9 mM Fe/ml. After 24 h of co-incubation, maximal uptake wasreached for 9 mM Fe/ml VSOP, resulting in 34.92 pg iron per T cell(Table 1A). T cell phantoms were imaged on a 7 T rodent scanner.At a concentration of 1000 cells/μl agarose, T cells were clearlydistinguishable as hypointense spots on T2∗-weighted images(Figure 1C).
Applying a moderate concentration of 3 mM Fe/ml during thelabeling procedure, we assessed the time dependency of VSOPuptake. The amount of iron per T cell increased with the extension
www.frontiersin.org December 2011 | Volume 2 | Article 72 | 3

Wuerfel et al. T cell labeling for MRI
of incubation time, reaching a maximal concentration of 10.12 pgFe/cell after 48 h (Table 1B).
IMPROVED T CELL LABELING CAPACITY OF VProtConsidering the limited phagocytic ability of T lymphocytes, wecompared VSOP co-incubation with cell transfection applyingprotamine-complexed VProt. Protamine is a naturally occurringpeptide with membrane translocating properties (Reynolds et al.,
FIGURE 1 |T cell labeling efficiency and magnetic nanoparticle
distribution was evaluated microscopically by Prussian Blue staining.
Higher labeling concentrations resulted in an augmentation of incorporatedVSOP into cytoplasmatic endosomes [(A1), 3 mM Fe/ml; (A2), 6 mM Fe/ml;(A3), 9 mM Fe/ml]. At a concentration of 9 mM Fe/ml, VSOP aggregatedand non-specific adherence to the cell surface occurred (A3). We assessedNMR transverse relaxation times (T2) as a measure of the T cell labelingefficacy by relaxometry (B). T2 times decreased significantly (p < 0.001) andin a concentration-dependent manner after incubation of T cells with VSOPfor 20 h. Agarose phantoms containing labeled T cells at a concentration of1000 cells/μl, imaged at 7T, are presented at different labelingconcentrations (ut, untreated; 1–9 mM Fe/ml) into (C).
2005). We investigated whether complexation of VProt prior tothe actual labeling procedure would improve the uptake of mag-netic nanoparticles into the cells. Incubation of T cells with VProtresulted in significantly reduced incubation times and labelingconcentrations for efficient labeling. In histology, Prussian Bluestained T cells incubated with VProt were more homogenouslylabeled (Figure 2A) compared to cells incubated with simpleVSOP(Figure 1A). The distribution seemed less scattered within thecells but uniformly spread throughout the cytoplasm, potentiallydue to an additional uptake mechanism independent from theaccumulation in endosomes. Labeling was visibly increased byprolongation of the incubation times (Figure 2A1–3). However,after 12 h of labeling, VProt also aggregated to the cell surface(Figure 2A3). Sufficient labeling was feasible at concentrations aslow as 0.5 mM Fe/ml at incubation times of 12 h. T2 times droppedto 125.2 ms applying 1 mM Fe/ml VProt, considerably exceed-ing the T2 shortening achieved by VSOP (Figure 2B; p < 0.001,ANOVA). Investigating the kinetics of VProt and VSOP uptake,we applied a moderate concentration of 1 mM Fe/ml for bothcontrast agents. In T cells, VSOP incorporation increased steadilywith time. In contrast, VProt-incubated T cells achieved high T2time reductions even in the early phase. After 8 h of incubation,T2 time reduction reached a peak, widely exceeding the levels ofVSOP treated cells (Figure 2C). Imaging of VProt labeled cellssuspended in agarose using a 7 T rodent scanner confirmed thehigh labeling efficacy detected by microscopy. Compared to bareVSOP, T cells incubated with VProt at concentrations as low as0.5–1 mM Fe/ml caused a strong hypointensity on T2∗-weightedimages (Figure 2D).
EFFECTS OF VSOP AND VProt ON THE VIABILITY OFENCEPHALITOGENIC T CELLSIncubation with VSOP did not suppress T cell proliferationmeasured by a 3[H]thymidine assay. VSOP-labeled CD3+ cellsshowed increased proliferation rates in the presence of specificantigen (PLP), equivalent to control cells, in a concentration-dependent manner (Figure 3). Scheffé testing indicated a signifi-cantly increased proliferation capacity at lowVSOP concentrations(1 mM Fe/ml) compared to untreated cells (p < 0.01), but not at
Table 1 | Iron uptake intoT cells after simple incubation with VSOP quantified with atomic absorption spectroscopy in probes containing
600000 cells.
Incubation time (h) Concentration (mM) Fe in probe in μg mean ± SD Calculated Fe per cell in pg
A 24 untreated 0.365 ± 0.027 0.61
24 1 4.904 ± 0.101 8.17
24 3 10.404 ± 0.115 17.34
24 6 15.582 ± 0.028 25.97
24 9 20.949 ± 0.632 34.92
B 48 untreated 0.21 ± 0.014 0.35
2 3 4.107 ± 0.068 6.85
6 3 4.576 ± 0.206 7.63
12 3 4.762 ± 0.135 7.94
24 3 5.169 ± 0.241 8.62
48 3 6.070 ± 0.015 10.12
SD, standard deviation.
Frontiers in Neurology | Multiple Sclerosis and Neuroimmunology December 2011 | Volume 2 | Article 72 | 4

Wuerfel et al. T cell labeling for MRI
FIGURE 2 | InT cells, diffusely distributed intracellular magnetic
nanoparticles are present after labeling with 1 mM Fe/ml VProt for 1 h
(A1), 4 h (A2), and 10 h (A3). NMR transverse relaxation time (T2) afterT cell labeling was estimated by relaxometry. Comparing the labelingefficacy of VSOP to that of protamine-complexed VSOP (VProt), we foundthat after 10 h of incubation, T2 times were significantly reduced (p < 0.001)in VProt samples already at low concentrations (B). In a longitudinalexperiment we noted a continuous reduction of T2 times at a concentrationof 1 mM Fe/ml over 21 h in VSOP-labeled T cells. In contrast, VProt labeledT cells reached a maximum already after 8 h of incubation (C). In agarosephantoms containing T cells at a concentration of 1000 cells/μl, imaged on a7T scanner, hypointensities caused by VProt labeled cells in T2∗-weightedimages were more homogenously distributed and produced pronouncedsignal extinctions even at low labeling concentrations (0.5–1 mM Fe/ml)compared to VSOP-labeled T cells (D). Untreated T cells (ut) caused onlydiscrete signal hypointensities.
higher VSOP concentrations (3–9 mM Fe/ml). The viability ofT cells after 24 h incubation at different concentrations (1–9 mMFe/ml VSOP) determined by propidium iodide incorporation inflow cytometry was not significantly impaired (Figure 4A). Weassessed potential effects of VSOP on T cell differentiation ana-lyzing CD4+ and CD8+ T cell subpopulations. The proportion ofCD4+ T cells appeared slightly increased, while the proportion ofCD8+ T cells was decreased at high VSOP co-incubation concen-trations (Figure 4B), although this effect did not reach statisticalsignificance. Subsequent propidium iodide staining revealed thata significant shift was caused by selective induction of cell deathin the CD8+ T cell population labeled with VSOP compared tountreated T cells (Figure 4C; p < 0.05). In CD4+ T cells, onlythe highest VSOP concentration (9 mM Fe/ml) reduced viability(p < 0.05).
FIGURE 3 | Changes in the proliferative capacity ofT cells were
assessed in a 3[H]thymidine assay. T cells incubated with VSOPconcentrations of 1–9 mM Fe/ml were compared to unlabeled cells (ut).Proliferation rates were determined in the presence of the specific antigenproteolipid protein (PLP) in two concentrations (12.5 and 25 μg/ml) andwithout stimulation. After incubation with low VSOP concentrations(1–3 mM Fe/ml), the proliferation rate was significantly increased comparedto untreated cells (p = 0.003).
EFFECTS OF VProt ON THE PHENOTYPE OF DIFFERENTIATED TH17ENCEPHALITOGENIC T CELLSThe relative effects of VSOP (1 mM) on PLP-specific T cell prolifer-ation, as described above, may also result from a more pronouncedinduction of apoptosis in CD8 positive cells, that could be detectedat equivalent VSOP concentrations. Therefore, we established asimplified system using TCR transgenic CD4 T cells (our targetcells), to monitor the effects of VSOP, and in particular VProt,on CD4 T cell physiology. In these experiments, we also com-pared protamine alone versus VProt, affecting antigen-specificproliferation and cytokine production.
Hence, MOG-specific 2D2-TCR transgenic CD4 T cells weredifferentiated in vitro under Th17-polarizing conditions. VProt at0.3 and 1 mM, or equivalent concentrations of protamine, respec-tively, were added to the cell culture medium at day 7, the timepoint of restimulation. Proliferation of 2D2-TCR transgenic T cellsin the presence of the specific antigen MOG was assessed by CFSEdilution assays and monitored by flow cytometry. The effect ofVProt or protamine alone on phenotype profile, as defined by theproduction of IL-17, was determined by intracellular staining ofIL-17 in CD4 T cells.
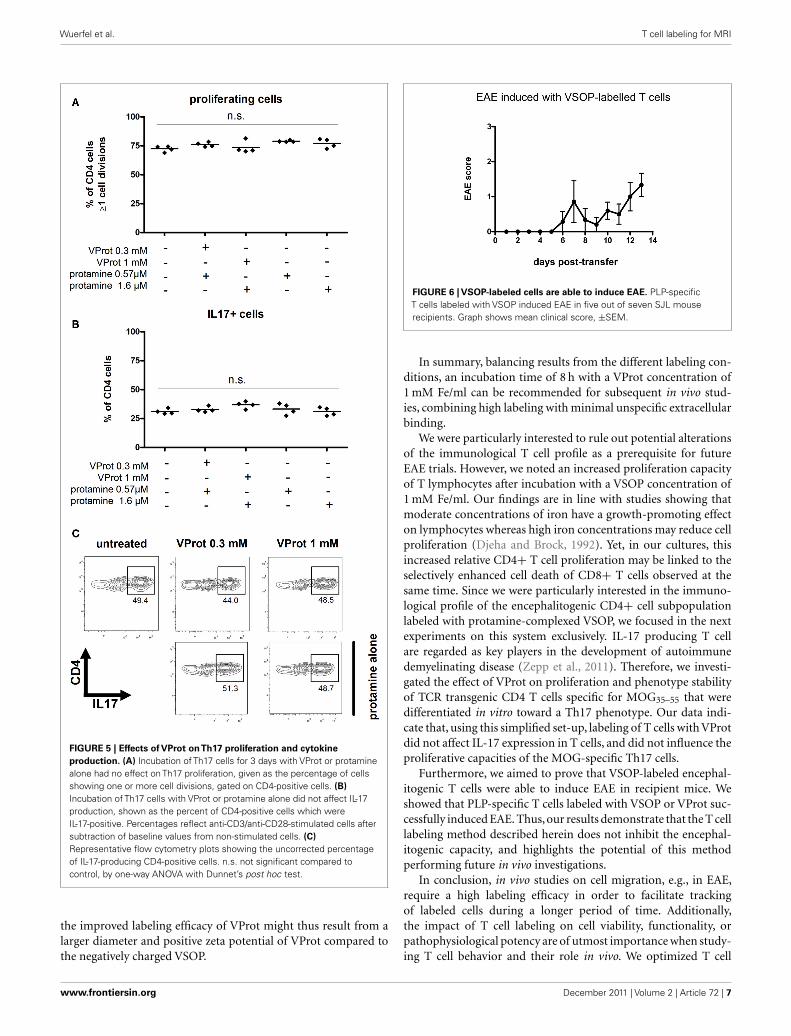
CFSE based dilution assays showed that neither VProt nor prot-amine alone affected the proliferation of MOG-specific CD4 T cellsin vitro at the applied concentrations (Figure 5A).
Furthermore, the amount of CD4 cells expressing IL-17 orthe production of IL-17 was not influenced by the addition ofVProt or protamine alone (Figure 5B, representative flow cytom-etry profiles are given in Figure 5C). About 30% of CD4 T cellsdifferentiated into Th17 T cells under both conditions.
ADOPTIVE TRANSFER EAE BY ENCEPHALITOGENIC VSOP-CD4 T CELLSIn order to demonstrate the encephalitogenic potential of labeledT cells, we performed a murine adoptive transfer SJL-EAE withPLP-specific T cells obtained from PLP immunized mice, whichwere subsequently labeled in vitro with VSOP or VProt. Five outof seven recipient mice transferred with VSOP-T cells developedEAE with a median onset at day 10 after immunization (range
www.frontiersin.org December 2011 | Volume 2 | Article 72 | 5

Wuerfel et al. T cell labeling for MRI
FIGURE 4 | We investigated the influence of VSOP onT cell viability,
differentiation and activation. The number of dead cells was quantified byFACS analysis using propidium iodide (PI). No significant reduction of cellviability was detected using VSOP concentrations of 1–9 mM Fe/ml incomparison to untreated cells (ut) (A). The percentage of CD4+ cells within
the CD3+ T cell pool was augmented by increasing VSOP concentrations,while the percentage of CD8+ cells diminished slightly, although withoutreaching statistical significance (B). With increasing VSOP concentrations, wenoted an increasing number of PI positive cells in the CD8+ cell poolindicating cell death (C).
6–12) and maximum disease severity ranging from score 1 to 4(Figure 6). As proof of principle, two recipient mice were trans-ferred with VProt labeled T cells, and both of these mice developedEAE, presenting first signs of disability at day 9 and 10, respectively,after transfer.
Thus, in vitro labeled PLP-specific T cells were capable ofinducing EAE.
DISCUSSIONThe motivation for this study was the development of a lympho-cyte labeling technique suited for longitudinal visualization andtracing of encephalitogenic T cells within the CNS during theinduction and the course of EAE in vivo by MRI. Recently, success-ful labeling and in vivo tracking of lymphocytes have been shownin different tumor models (Kircher et al., 2003; Daldrup-Link et al.,2005; Hu et al., 2005) and a model of autoimmune diabetes (Bil-lotey et al., 2005). To our knowledge, imaging of T cell migration tothe CNS has been reported only twice up to now (Anderson et al.,2004; Pirko et al., 2004), and both studies were hampered by rel-atively low resolution and difficulties to assign hypointensities inT2∗-weighted images to labeled cells, as distinct from blood vesselsor other confounders. Thus the need to improve T cell labeling forsubsequent use in in vivo studies during EAE is obvious. This rep-resents a particular challenge because of the time gap of 8–12 daysbetween T cell transfer and disease onset (Wuerfel et al., 2007)and the consequent T cell divisions and dilution of the nanopar-ticles, that takes place during this time interval in the recipientmice. An additional difficulty is that only a very low fraction ofthe initially transferred T cells infiltrate into the CNS (Raine et al.,1990). Externalized nanoparticles, e.g., released from dying labeledT2 cells, will eventually be internalized by local macrophages oractivated microglia, as shown in previous murine (Wuerfel et al.,2007) as well as human (Vellinga et al., 2008) studies, or adhere tothe perivascular extracellular matrix (Wuerfel et al., 2007).
We applied electrostatically stabilized very small particles,VSOP, since these nanoparticles showed excellent labeling proper-ties, achieving a 5.7-fold higher labeling efficacy of macrophagescompared to conventional dextran-coated magnetic nanoparti-cles, as demonstrated in a previous study (Fleige et al., 2002). In ourhands, incubation of freshly isolated T lymphocytes with VSOP ina concentration of 3 mM Fe/ml over 24 h was well tolerated, and
resulted in an iron uptake of 17.37 pg per cell, well above the levelof 1–5 pg of iron per cell achieved with commonly used protocols(Arbab et al., 2006), and corresponding to a 55% shortening ofthe T2 time, as compared to unlabeled control cells. The uptake ofVSOP was dependent on the concentration as well as on the incu-bation time applied, and could thus be slightly increased usinghigher VSOP dosages or extending the incubation period.
A commonly used method to further enhance labeling effi-cacy relies on the use of secondary compounds with transfectionagents (Walczak et al., 2005). Among various approaches includ-ing viral transactivator transcription proteins (Lewin et al., 2000;Dodd et al., 2001; Kircher et al., 2003), polycationic transfectionagents (Frank et al., 2003; Berger et al., 2006), or electroporation(Daldrup-Link et al., 2005; Suzuki et al., 2007), protamine hasrecently been employed by several groups. Delivering high celltransfection efficacy, this compound confers only very low toxic-ity in comparison to other transfection agents (Arbab et al., 2004;Reynolds et al., 2005; Anderson et al., 2006). We did not detectany influence of VProt on T cell viability and activation (data notshown), confirming other studies that excluded influences of pro-tamine on cell viability, proliferation, and stem cell differentiation(Arbab et al., 2004, 2005; Suzuki et al., 2007).
We show here that the complexation of protamine to VSOPboosted the uptake of nanoparticles into T cells, and allowed for areduction of VSOP dosage as well as of incubation times. In com-parison to VSOP only, T2 relaxation times were reduced by 62%after 12 h of incubation with a concentration of 0.5 mM Fe/mlVProt. MR images of T cell phantoms confirmed the high label-ing efficacy of VProt. VProt uptake reached a maximum after 8 hof incubating T cells with 1 mM Fe/ml, potentially resulting fromdifferent cellular uptake mechanisms of VSOP compared to VProt.Intracellular storage of VProt appeared diffuse in light microscopydiffering from the vesicular distribution evident in T cells incu-bated with VSOP. Fleige et al. (2002) showed that macrophagesinternalize VSOP via phagocytosis. In contrast, polycationic trans-fection agents promote ingestion by macropinocytosis (Arbabet al., 2006). Whether these pathways also apply to the entry ofVSOP and VProt into lymphocytes remains to be determined.Recent reports stress the importance of the surface charge and thesize of magnetic nanoparticles as being crucial for the uptake intonon-phagocytic cells (Thorek and Tsourkas, 2008). Accordingly,
Frontiers in Neurology | Multiple Sclerosis and Neuroimmunology December 2011 | Volume 2 | Article 72 | 6
Wuerfel et al. T cell labeling for MRI
FIGURE 5 | Effects of VProt onTh17 proliferation and cytokine
production. (A) Incubation of Th17 cells for 3 days with VProt or protaminealone had no effect on Th17 proliferation, given as the percentage of cellsshowing one or more cell divisions, gated on CD4-positive cells. (B)
Incubation of Th17 cells with VProt or protamine alone did not affect IL-17production, shown as the percent of CD4-positive cells which wereIL-17-positive. Percentages reflect anti-CD3/anti-CD28-stimulated cells aftersubtraction of baseline values from non-stimulated cells. (C)
Representative flow cytometry plots showing the uncorrected percentageof IL-17-producing CD4-positive cells. n.s. not significant compared tocontrol, by one-way ANOVA with Dunnet’s post hoc test.
the improved labeling efficacy of VProt might thus result from alarger diameter and positive zeta potential of VProt compared tothe negatively charged VSOP.
FIGURE 6 | VSOP-labeled cells are able to induce EAE. PLP-specificT cells labeled with VSOP induced EAE in five out of seven SJL mouserecipients. Graph shows mean clinical score, ±SEM.
In summary, balancing results from the different labeling con-ditions, an incubation time of 8 h with a VProt concentration of1 mM Fe/ml can be recommended for subsequent in vivo stud-ies, combining high labeling with minimal unspecific extracellularbinding.
We were particularly interested to rule out potential alterationsof the immunological T cell profile as a prerequisite for futureEAE trials. However, we noted an increased proliferation capacityof T lymphocytes after incubation with a VSOP concentration of1 mM Fe/ml. Our findings are in line with studies showing thatmoderate concentrations of iron have a growth-promoting effecton lymphocytes whereas high iron concentrations may reduce cellproliferation (Djeha and Brock, 1992). Yet, in our cultures, thisincreased relative CD4+ T cell proliferation may be linked to theselectively enhanced cell death of CD8+ T cells observed at thesame time. Since we were particularly interested in the immuno-logical profile of the encephalitogenic CD4+ cell subpopulationlabeled with protamine-complexed VSOP, we focused in the nextexperiments on this system exclusively. IL-17 producing T cellare regarded as key players in the development of autoimmunedemyelinating disease (Zepp et al., 2011). Therefore, we investi-gated the effect of VProt on proliferation and phenotype stabilityof TCR transgenic CD4 T cells specific for MOG35–55 that weredifferentiated in vitro toward a Th17 phenotype. Our data indi-cate that, using this simplified set-up, labeling of T cells with VProtdid not affect IL-17 expression in T cells, and did not influence theproliferative capacities of the MOG-specific Th17 cells.
Furthermore, we aimed to prove that VSOP-labeled encephal-itogenic T cells were able to induce EAE in recipient mice. Weshowed that PLP-specific T cells labeled with VSOP or VProt suc-cessfully induced EAE. Thus,our results demonstrate that the T celllabeling method described herein does not inhibit the encephal-itogenic capacity, and highlights the potential of this methodperforming future in vivo investigations.
In conclusion, in vivo studies on cell migration, e.g., in EAE,require a high labeling efficacy in order to facilitate trackingof labeled cells during a longer period of time. Additionally,the impact of T cell labeling on cell viability, functionality, orpathophysiological potency are of utmost importance when study-ing T cell behavior and their role in vivo. We optimized T cell
www.frontiersin.org December 2011 | Volume 2 | Article 72 | 7

Wuerfel et al. T cell labeling for MRI
labeling, applying VSOP and VProt at different concentrations andincubation times, comparing labeling efficacy in vitro. Best resultswere achieved with VProt at a concentration of 1 mM Fe/ml andan incubation time of 8 h. These conditions did not affect CD4T cell physiology in terms of proliferative capacities or phenotypicstability. Finally, we showed that labeled encephalitogenic T cellsT cells maintained their pathologic potential and are able to induceEAE in recipient mice.
ACKNOWLEDGMENTSThis work was supported by the Deutsche Forschungsgemeinschaft(KFO213). We thank Martina Paetzel for editing this manuscriptas native English speaker, and Thordis Hohnstein for technicalassistance. We thank Constantin Scharlach for his contributionin protamin-coupling as well as Prof. Frauke Zipp for support-ing this study and critically discussing a previous manuscriptversion.
REFERENCESAktas, O., Smorodchenko, A., Brocke,
S., Infante-Duarte, C., Schulze Top-phoff, U., Vogt, J., Prozorovski, T.,Meier, S., Osmanova, V., Pohl, E.,Bechmann, I., Nitsch, R., and Zipp, F.(2005). Neuronal damage in autoim-mune neuroinflammation mediatedby the death ligand TRAIL. Neuron46, 421–432.
Anderson, S. A., Lee, K. K., and Frank,J. A. (2006). Gadolinium-fullerenolas a paramagnetic contrast agent forcellular imaging. Invest. Radiol. 41,332–338.
Anderson, S. A., Shukaliak-Quandt, J.,Jordan, E. K., Arbab, A. S., Martin,R., Mcfarland, H., and Frank, J. A.(2004). Magnetic resonance imagingof labeled T-cells in a mouse modelof multiple sclerosis. Ann. Neurol. 55,654–659.
Arbab, A. S., Liu, W., and Frank, J. A.(2006). Cellular magnetic resonanceimaging: current status and futureprospects. Expert Rev. Med. Devices3, 427–439.
Arbab, A. S., Yocum, G. T., Kalish,H., Jordan, E. K., Anderson, S.A., Khakoo, A. Y., Read, E. J.,and Frank, J. A. (2004). Efficientmagnetic cell labeling with prota-mine sulfate complexed to ferumox-ides for cellular MRI. Blood 104,1217–1223.
Arbab, A. S., Yocum, G. T., Rad, A. M.,Khakoo, A. Y., Fellowes, V., Read, E.J., and Frank, J. A. (2005). Labelingof cells with ferumoxides-protaminesulfate complexes does not inhibitfunction or differentiation capac-ity of hematopoietic or mesenchy-mal stem cells. NMR Biomed. 18,553–559.
Berger, C., Rausch, M., Schmidt, P., andRudin, M. (2006). Feasibility andlimits of magnetically labeling pri-mary cultured rat T cells with fer-umoxides coupled with commonlyused transfection agents. Mol. Imag-ing 5, 93–104.
Billotey, C., Aspord, C., Beuf, O., Piag-gio, E., Gazeau, F., Janier, M. F., andThivolet, C. (2005). T-cell homing tothe pancreas in autoimmune mousemodels of diabetes: in vivo MRimaging. Radiology 236, 579–587.
Daldrup-Link, H. E., Meier, R.,Rudelius, M., Piontek, G., Piert,M., Metz, S., Settles, M., Uherek,C., Wels, W., Schlegel, J., andRummeny, E. J. (2005). In vivotracking of genetically engineered,anti-HER2/neu directed naturalkiller cells to HER2/neu positivemammary tumors with magneticresonance imaging. Eur. Radiol. 15,4–13.
Djeha, A., and Brock, J. H. (1992).Uptake and intracellular handlingof iron from transferrin and ironchelates by mitogen stimulatedmouse lymphocytes. Biochim. Bio-phys. Acta 1133, 147–152.
Dodd, C. H., Hsu, H. C., Chu, W. J.,Yang, P., Zhang, H. G., Mountz, J.D. Jr., Zinn, K., Forder, J., Josephson,L., Weissleder, R., Mountz, J. M., andMountz, J. D. (2001). Normal T-cellresponse and in vivo magnetic reso-nance imaging of T cells loaded withHIV transactivator-peptide-derivedsuperparamagnetic nanoparticles. J.Immunol. Methods 256, 89–105.
Fleige, G., Seeberger, F., Laux, D., Kresse,M., Taupitz, M., Pilgrimm, H., andZimmer, C. (2002). In vitro charac-terization of two different ultrasmalliron oxide particles for magnetic res-onance cell tracking. Invest. Radiol.37, 482–488.
Focke, A., Schwarz, S., Foerschler, A.,Scheibe, J., Milosevic, J., Zimmer, C.,and Schwarz, J. (2008). Labeling ofhuman neural precursor cells usingferromagnetic nanoparticles. Magn.Reson. Med. 60, 1321–1328.
Frank, J. A., Miller, B. R., Arbab, A. S.,Zywicke, H. A., Jordan, E. K., Lewis,B. K., Bryant, L. H. Jr., and Bulte,J. W. (2003). Clinically applicablelabeling of mammalian and stemcells by combining superparamag-netic iron oxides and transfectionagents. Radiology 228, 480–487.
Hendrix, S., and Nitsch, R. (2007). Therole of T helper cells in neuroprotec-tion and regeneration. J. Neuroim-munol. 184, 100–112.
Heymer, A., Haddad, D., Weber, M.,Gbureck, U., Jakob, P. M., Eulert,J., and Noth, U. (2008). Iron oxidelabeling of human mesenchymalstem cells in collagen hydrogels for
articular cartilage repair. Biomateri-als 29, 1473–1483.
Hu, D. E., Kettunen, M. I., andBrindle, K. M. (2005). Mon-itoring T-lymphocyte traffickingin tumors undergoing immunerejection. Magn. Reson. Med. 54,1473–1479.
Infante-Duarte, C., Horton, H. F.,Byrne, M. C., and Kamradt, T.(2000). Microbial lipopeptidesinduces the production of IL-17 in Th cells. J. Immunol. 165,6107–6115.
Kircher, M. F.,Allport, J. R., Graves, E. E.,Love, V., Josephson, L., Lichtman, A.H., and Weissleder, R. (2003). In vivohigh resolution three-dimensionalimaging of antigen-specific cyto-toxic T-lymphocyte trafficking totumors. Cancer Res. 63, 6838–6846.
Lewin, M., Carlesso, N., Tung, C. H.,Tang, X. W., Cory, D., Scadden,D. T., and Weissleder, R. (2000).Tat peptide-derivatized magneticnanoparticles allow in vivo trackingand recovery of progenitor cells. Nat.Biotechnol. 18, 410–414.
Liu, W., and Frank, J. A. (2008). Detec-tion and quantification of magnet-ically labeled cells by cellular MRI.Eur. J. Radiol. 70, 258–264.
Modo, M., Hoehn, M., and Bulte, J. W.(2005). Cellular MR imaging. Mol.Imaging 4, 143–164.
Perl, D. P., and Good, P. F. (1992). Com-parative techniques for determiningcellular iron distribution in brain tis-sues. Ann. Neurol. 32(Suppl.), S76–S81.
Pirko, I., Johnson, A., Ciric, B., Gamez,J., Macura, S. I., Pease, L. R., andRodriguez, M. (2004). In vivo mag-netic resonance imaging of immunecells in the central nervous systemwith superparamagnetic antibodies.FASEB J. 18, 179–182.
Raine, C. S., Cannella, B., Duijvestijn, A.M., and Cross, A. H. (1990). Hom-ing to central nervous system vascu-lature by antigen-specific lympho-cytes. II. Lymphocyte/endothelialcell adhesion during the initial stagesof autoimmune demyelination. Lab.Invest. 63, 476–489.
Reynolds, F., Weissleder, R., and Joseph-son, L. (2005). Protamine as an
efficient membrane-translocatingpeptide. Bioconjug. Chem. 16,1240–1245.
Rogers, W. J., Meyer, C. H., and Kramer,C. M. (2006). Technology insight:in vivo cell tracking by use of MRI.Nat. Clin. Pract. Cardiovasc. Med. 3,554–562.
Shen, T., Weissleder, R., Papisov, M.,Bogdanov, A. Jr., and Brady, T. J.(1993). Monocrystalline iron oxidenanocompounds (MION): physico-chemical properties. Magn. Reson.Med. 29, 599–604.
Smirnov, P., Poirier-Quinot, M., Wil-helm, C., Lavergne, E., Ginefri, J.C., Combadiere, B., Clement, O.,Darrasse, L., and Gazeau, F. (2008).In vivo single cell detection oftumor-infiltrating lymphocytes witha clinical 1.5 Tesla MRI system.Magn. Reson. Med. 60, 1292–1297.
Stroh, A., Faber, C., Neuberger, T.,Lorenz, P., Sieland, K., Jakob, P. M.,Webb, A., Pilgrimm, H., Schober,R., Pohl, E. E., and Zimmer, C.(2005). In vivo detection limitsof magnetically labeled embryonicstem cells in the rat brain usinghigh-field (17.6 T) magnetic res-onance imaging. Neuroimage 24,635–645.
Stroh, A., Zimmer, C., Gutzeit, C.,Jakstadt, M., Marschinke, F., Jung,T., Pilgrimm, H., and Grune, T.(2004). Iron oxide particles for mol-ecular magnetic resonance imagingcause transient oxidative stress in ratmacrophages. Free Radic. Biol. Med.36, 976–984.
Stroh, A., Zimmer, C., Werner, N.,Gertz, K., Weir, K., Kronenberg, G.,Steinbrink, J., Mueller, S., Sieland,K., Dirnagl, U., Nickenig, G., andEndres, M. (2006). Tracking ofsystemically administered mononu-clear cells in the ischemic brain byhigh-field magnetic resonance imag-ing. Neuroimage 33, 886–897.
Suzuki, Y., Zhang, S., Kundu, P., Yeung,A. C., Robbins, R. C., and Yang, P. C.(2007). In vitro comparison of thebiological effects of three transfec-tion methods for magnetically label-ing mouse embryonic stem cells withferumoxides. Magn. Reson. Med. 57,1173–1179.
Frontiers in Neurology | Multiple Sclerosis and Neuroimmunology December 2011 | Volume 2 | Article 72 | 8

Wuerfel et al. T cell labeling for MRI
Thorek, D. L., and Tsourkas, A.(2008). Size, charge and con-centration dependent uptakeof iron oxide particles by non-phagocytic cells. Biomaterials 29,3583–3590.
Vellinga, M. M., Oude Engberink, R.D., Seewann, A., Pouwels, P. J., Wat-tjes, M. P., van der Pol, S. M., Per-ing, C., Polman, C. H., de Vries,H. E., Geurts, J. J., and Barkhof,F. (2008). Pluriformity of inflam-mation in multiple sclerosis shownby ultra-small iron oxide particleenhancement. Brain 131, 800–807.
Walczak, P., Kedziorek, D. A., Gilad,A. A., Lin, S., and Bulte, J. W.(2005). Instant MR labeling ofstem cells using magnetoelectro-poration. Magn. Reson. Med. 54,769–774.
Weiner, H. L., and Frenkel, D. (2006).Immunology and immunotherapy
of Alzheimer’s disease. Nat. Rev.Immunol. 6, 404–416.
Wuerfel, E., Infante-Duarte, C., Glumm,R., and Wuerfel, J. T. (2010). Gad-ofluorine M-enhanced MRI showsinvolvement of circumventricularorgans in neuroinflammation. J.Neuroinflammation 18, 70.
Wuerfel, J., Tysiak, E., Prozorovski, T.,Smyth, M., Mueller, S., Schnorr, J.,Taupitz, M., and Zipp, F. (2007).Mouse model mimics multiple scle-rosis in the clinico-radiologicalparadox. Eur. J. Neurosci. 26,190–198.
Yeh, T. C., Zhang, W., Ildstad, S. T.,and Ho, C. (1995). In vivo dynamicMRI tracking of rat T-cells labeledwith superparamagnetic iron-oxideparticles. Magn. Reson. Med. 33,200–208.
Zepp, J., Wu, L., and Li, X. (2011). IL-17 receptor signaling and T helper
17-mediated autoimmune demyeli-nating disease. Trends Immunol. 32,232–239.
Zipp, F., and Aktas, O. (2006). Thebrain as a target of inflam-mation: common pathways linkinflammatory and neurodegenera-tive diseases. Trends Neurosci. 29,518–527.
Conflict of Interest Statement: Theauthors declare that the research wasconducted in the absence of anycommercial or financial relationshipsthat could be construed as a potentialconflict of interest.
Received: 16 May 2011; accepted: 01November 2011; published online: 16December 2011.Citation: Wuerfel E, Smyth M, Mill-ward JM, Schellenberger E, Glumm
J, Prozorovski T, Aktas O, Schulze-Topphoff U, Schnorr J, Wagner S,Taupitz M, Infante-Duarte C and Wuer-fel J (2011) Electrostatically stabilizedmagnetic nanoparticles – an optimizedprotocol to label murine T cells forin vivo MRI. Front. Neur. 2:72. doi:10.3389/fneur.2011.00072This article was submitted to Frontiersin Multiple Sclerosis and Neuroimmunol-ogy, a specialty of Frontiers in Neurology.Copyright © 2011 Wuerfel, Smyth,Millward, Schellenberger , Glumm,Prozorovski, Aktas, Schulze-Topphoff,Schnorr, Wagner, Taupitz, Infante-Duarte and Wuerfel. This is anopen-access article subject to a non-exclusive license between the authorsand Frontiers Media SA, which permitsuse, distribution and reproduction inother forums, provided the originalauthors and source are credited and otherFrontiers conditions are complied with.
www.frontiersin.org December 2011 | Volume 2 | Article 72 | 9