Electronic Supplementary Information - The Royal Society of ...
14
1 Non-Covalent Self Assembly Controls the Relaxivity of Magnetically Active Guests Vincent Li, Yoo-Jin Ghang, Richard J. Hooley,* and Travis J. Williams* Electronic Supplementary Information Loker Hydrocarbon Research Institute and Department of Chemistry, University of Southern California, 837 Bloom Walk, Los Angeles, CA 90089. Department of Chemistry, University of California - Riverside, Riverside CA 92521. [email protected]; [email protected] Table of Contents 1. Synthetic Details ................................................................................................................................... 2 General Procedures ......................................................................................................................... 2 Synthesis of 4 .................................................................................................................................. 3 Synthesis of 2a ................................................................................................................................ 5 Synthesis of 2b ................................................................................................................................ 6 Synthesis of 5 .................................................................................................................................. 7 Effect of cavitand on gadolinium complex 2a ................................................................................. 7 Effect of choline on masked contrast complex ................................................................................ 8 2. Molar Relaxivity Curves ....................................................................................................................... 9 Figure S-8. Relaxivity of complex 2a ............................................................................................. 9 Figure S-9. Relaxivity of complex 2a with 6 equivalents of cavitand 1 ......................................... 9 Figure S-10. Relaxivity of complex 2a with 6 equivalents of cavitand and excess choline ........... 9 Figure S-11. Relaxivity of complex 5 ........................................................................................... 10 Figure S-12. Relaxivity of complex 5 with 4 equivalents of cavitand 1 ....................................... 10 Figure S-13. Relaxivity of complex 5 with 4 equivalents of cavitand and excess choline ........... 10 3. 1 H NMR spectra of Y·DOTA complex 2b titration experiments ........................................................ 11 Figure S-14. Titration of Y·DOTA complex 2b into cavitand ...................................................... 11 Figure S-15. Titration of cavitand into Y·DOTA complex 2b ...................................................... 11 Figure S-16. Titration of acetonitrile-d 3 into a 6:1 mixture of 1:2b............................................... 12 4. Graphical DLS Data ........................................................................................................................... 13 Figure S-17. DLS histogram of cavitand 1 ................................................................................... 13 Figure S-18. DLS histogram of cavitand 1 with Gd complex 2a .................................................. 13 Figure S-19. DLS histogram of cavitand 1 with Gd complex 2a upon exposure to choline ......... 14 Electronic Supplementary Material (ESI) for Chemical Communications This journal is © The Royal Society of Chemistry 2014
-
Upload
khangminh22 -
Category
Documents
-
view
5 -
download
0
Transcript of Electronic Supplementary Information - The Royal Society of ...
1
Non-Covalent Self Assembly Controls the Relaxivity of Magnetically Active Guests
Vincent Li, Yoo-Jin Ghang, Richard J. Hooley,* and Travis J. Williams*
Electronic Supplementary Information
Loker Hydrocarbon Research Institute and Department of Chemistry,
University of Southern California, 837 Bloom Walk, Los Angeles, CA 90089. Department of Chemistry, University of California - Riverside, Riverside CA 92521.
[email protected]; [email protected]
Table of Contents
1. Synthetic Details ................................................................................................................................... 2 General Procedures ......................................................................................................................... 2 Synthesis of 4 .................................................................................................................................. 3 Synthesis of 2a ................................................................................................................................ 5 Synthesis of 2b ................................................................................................................................ 6 Synthesis of 5 .................................................................................................................................. 7 Effect of cavitand on gadolinium complex 2a ................................................................................. 7 Effect of choline on masked contrast complex ................................................................................ 8 2. Molar Relaxivity Curves ....................................................................................................................... 9 Figure S-8. Relaxivity of complex 2a ............................................................................................. 9 Figure S-9. Relaxivity of complex 2a with 6 equivalents of cavitand 1 ......................................... 9 Figure S-10. Relaxivity of complex 2a with 6 equivalents of cavitand and excess choline ........... 9 Figure S-11. Relaxivity of complex 5 ........................................................................................... 10 Figure S-12. Relaxivity of complex 5 with 4 equivalents of cavitand 1 ....................................... 10 Figure S-13. Relaxivity of complex 5 with 4 equivalents of cavitand and excess choline ........... 10 3. 1H NMR spectra of Y·DOTA complex 2b titration experiments ........................................................ 11 Figure S-14. Titration of Y·DOTA complex 2b into cavitand ...................................................... 11 Figure S-15. Titration of cavitand into Y·DOTA complex 2b ...................................................... 11 Figure S-16. Titration of acetonitrile-d3 into a 6:1 mixture of 1:2b ............................................... 12 4. Graphical DLS Data ........................................................................................................................... 13 Figure S-17. DLS histogram of cavitand 1 ................................................................................... 13 Figure S-18. DLS histogram of cavitand 1 with Gd complex 2a .................................................. 13 Figure S-19. DLS histogram of cavitand 1 with Gd complex 2a upon exposure to choline ......... 14
Electronic Supplementary Material (ESI) for Chemical CommunicationsThis journal is © The Royal Society of Chemistry 2014

2
1. Synthetic Details General Procedures
Deuterated NMR solvents were purchased from Cambridge Isotopes Labs. All NMR spectra
were obtained on a Varian 400 MHz spectrometer at 25 ºC. Proton (1H) chemical shifts are
reported in parts per million (δ) with respect to tetramethylsilane (TMS, δ = 0), and referenced
internally with respect to the protio solvent impurity. DLS were acquired on a Wyatt Dynapro
Titan instrument, and each DLS measurement was replicated at least 3 times consecutively. All
reversed-phase C18 columns were purchased from Teledyne. Elemental analysis and ICP-MS
data were acquired by the University of Illinois at Urbana-Champaign School of Chemical
Sciences Microanalysis Laboratory. Reverse-phase chromatography was achieved with a
Teledyne Combiflash RF automated chromatography system.
Molecular modeling (semi-empirical calculations) was performed using the AM1 force field
using SPARTAN.1 Cavitand 1 was synthesized according to literature procedures.2
Distilled
water was purchased from Arrowhead. Acetonitrile (CH3CN) was purchased from EMD.
Dicyclohexylcarbodiimide (DCC) was purchased from Lancaster. Methanol (MeOH) was
purchased from Macron. 1,4,7,10-tetraazacyclododecane-1,4,7,10-tetraacetic acid (DOTA) was
purchased from Strem Chemicals. 2-aminoethyltrimethylammonium chloride hydrochloride was
purchased from Sigma Aldrich. Gadolinium (III) hexahydrate, yttrium (III) hydrate, and choline
chloride were purchased from Alfa Aesar. All chemicals were used as received.
Electronic Supplementary Material (ESI) for Chemical CommunicationsThis journal is © The Royal Society of Chemistry 2014

3
Synthesis of ligand 4
N N
NNCO
NH
OH
OO
HO
O
HO N
Cl-
Aqueous acetonitrile (50%, 10 mL) was added to 1,4,7,10-tetraazacyclododecane-1,4,7,10-
tetraacetic acid (DOTA, 100 mg, 0.25 mmol), and 2-aminoethyltrimethylammonium chloride
hydrochloride (43.5 mg, 0.25 mmol) and stirred at room temperature until fully dissolved (15
minutes). DCC (dicyclohexylcarbodiimide, 51 mg, 0.31 mmol) was dissolved in pyridine (2 mL)
and added dropwise to the reaction mixture. The reaction was stirred for 2 days in a sealed flask
at room temperature. The resulting precipitate was filtered, and the filtrate was purified via
reversed phase column chromatography (C18 Silica, H2O eluent) to provide 4 as a white powder
(93 mg, 71%). 1H NMR (500 MHz, D2O, 298 K) δ: 3.90-3.08 ppm (m, broad 26H), 3.20 ppm (s,
9H). 13C NMR (125 MHz, D2O, 298 K) δ: 174.56, 172.31, 170.29, 64.06, 56.20, 55.48, 53.58,
51.55, 50.86, 48.99, 48.47, 33.72. MS (MALDI) m/z calcd for C21H41N6O7+: 489.30 g/mol, found
489.09 g/mol.
Figure S-1. Chromatography trace of 4.
Electronic Supplementary Material (ESI) for Chemical CommunicationsThis journal is © The Royal Society of Chemistry 2014

4
Figure S-2. 1H NMR spectrum of 4 (500 MHz, D2O, 298 K).
Figure S-3. 13C NMR spectrum of 4 (125 MHz, D2O, 298 K).
N N
NNCO
NH
OH
OO
HO
O
HO N
Cl-
N N
NNCO
NH
OH
OO
HO
O
HO N
Cl-
Electronic Supplementary Material (ESI) for Chemical CommunicationsThis journal is © The Royal Society of Chemistry 2014

5
Synthesis of Gd-containing guest 2a
N N
NNCO
NHGd O
OO
O
O
O
Cl-
N
To a solution of 6 (6.8 mg, 0.01 mmol) in H2O (1 mL) was added GdCl3·6H2O (4.8 mg, 0.01
mmol). The resulting solution was then stirred at 50 ºC for 20 hours. The pH of the solution was
neutralized to pH ~ 7 by the addition of NaOH (0.1 M aq) every hour over the first ten hours.
The product lyopholized to powder then purified via reversed phase column chromatography
(C18 silica, H2O eluent) to provide 2 as a white powder (4.6 mg, 55%). A single
chromatography trace was observed. The product was dissolved in distilled water and the final
Gd3+ concentration was determined by ICP-MS. No free Gd3+ was detected in solution by
xylenol orange test.3 NMR for this compound cannot be recorded because this compound is
paramagnetic. MS (MALDI) m/z calcd for C21H38GdN6O7: 644.20 g/mol; found 643.94 g/mol.
Measured isotopic distribution matches calculated prediction.
Figure S-4. Chromatography trace of 2a.
Electronic Supplementary Material (ESI) for Chemical CommunicationsThis journal is © The Royal Society of Chemistry 2014

6
Synthesis of Yttrium Complex 2b
N N
NNCO
NHY O
OO
O
O
O
Cl-
N
Ligand 6 (148 mg, 0.282 mmol) and YCl3·xH2O (64 mg) were dissolved in H2O (5 mL). The
reaction was stirred at room temperature for 12 hours. The solution was neutralized over the
course of the reaction to pH ~ 7 by the addition of NaOH (0.1 M aq). The product was purified
via reversed phase column chromatography (C18 silica, 0-5% MeOH:H2O) to yield product as a
white solid (63 mg, 36%). 1H NMR (500 MHz, D2O, 25 ºC) δ 3.96-3.25 (m, broad, 16H) 3.21 (s,
9H) 2.81 (s, broad, 7H) 2.61-2.50 (m, broad, 6H). 13C NMR was not obtained as significant
broadening of the peaks (c.f. 13C spectrum of ligand 4, Fig S-3) rendered the signal:noise ratio
too low for detection, even after extensive acquisition. MS (MALDI) m/z calcd for
C21H38N6O7Y: 575.19 g/mol; found 574.94 g/mol.
Figure S-5. 1H NMR spectrum of 2b (500 MHz, D2O, 25 ºC).
N N
NNCO
NHY O
OO
O
O
O
Cl-
N
Electronic Supplementary Material (ESI) for Chemical CommunicationsThis journal is © The Royal Society of Chemistry 2014

7
Synthesis of Na[Gd(DOTA)] 5
DOTA (24.3 mg, 0.06 mmol) and GdCl3·6H2O were dissolved in 3 mL H2O. The solution
was neutralized over the course of the reaction to pH ~ 7 by the addition of NaOH (0.1 M aq).
The reaction was stirred until the pH was constant for 1 hour (4 hour total reaction time). The
solution was then adjusted to pH ~ 11 by the addition of NaOH (0.1 M aq) and the reaction was
stirred for 20 minutes more, then filtered through a 0.45 µm syringe filter. The product was
lyopholized to powder, then purified via reversed phase column chromatography (C18 silica, 0-
5% MeOH:H2O) to yield Gd·DOTA as a white solid (10.2 mg, 31%). Product was dissolved in
distilled water and the final gadolinium concentration was determined via ICP-MS. NMR for this
compound cannot be recorded because this compound is paramagnetic.
Effect of cavitand on gadolinium complex 2a
2a (125 µl of a 1 mM solution) was added to six 0.5 dram glass vials, which were lyophilized
to dryness. Cavitand 1 (5 mg, 3.6 µmol) was dissolved in 368 µL H2O. The cavitand solution
(12.5 µL per equivalent of Gd) was added to each vial to make vials containing gadolinium
complex 2a with 1, 2, 3, 4, 5, and 10 equivalents cavitand, respectively. An appropriate volume
of water was added to each vial to bring the total volume of water to 125 µL. The solutions were
then transferred to a 3 mm diameter coaxial NMR tube insert for T1 measurements. T1 relaxation
rates were then acquired using Varian’s inversion recovery sequence, with interpulse from 62.5
ms to 32 s, and T1 times were tabulated by the native software.
Figure S-6. Modulation of the T1 relaxation rate of 2a by cavitand 1. a) T1 (H2O) variation upon increasing [1] (H2O, 298 K, [2a] = 1 mM).
N N
NNGd O
OO
O
O
O O
O
Electronic Supplementary Material (ESI) for Chemical CommunicationsThis journal is © The Royal Society of Chemistry 2014

8
Effect of choline on masked complex
To 9 glass vials were distributed choline chloride (10 mM aq). These were lyopholized to
dryness. A solution of complex 2a (0.5 mM) along with 4 equivalents of cavitand 1 (125 µL, 0.5
mM [Gd]) was added to the vials, which were then transferred to a 3 mm diameter coaxial NMR
tube insert for T1 measurements. Data were recorded as above.
Figure S-7. Modulation of T1 relaxation rate upon addition of a competitive guest. a) T1(H2O) variation upon addition of choline 6 to a solution of 1•2a (H2O, 298 K, [2a] = 0.5 mM, [1] = 3 mM)
Electronic Supplementary Material (ESI) for Chemical CommunicationsThis journal is © The Royal Society of Chemistry 2014
9
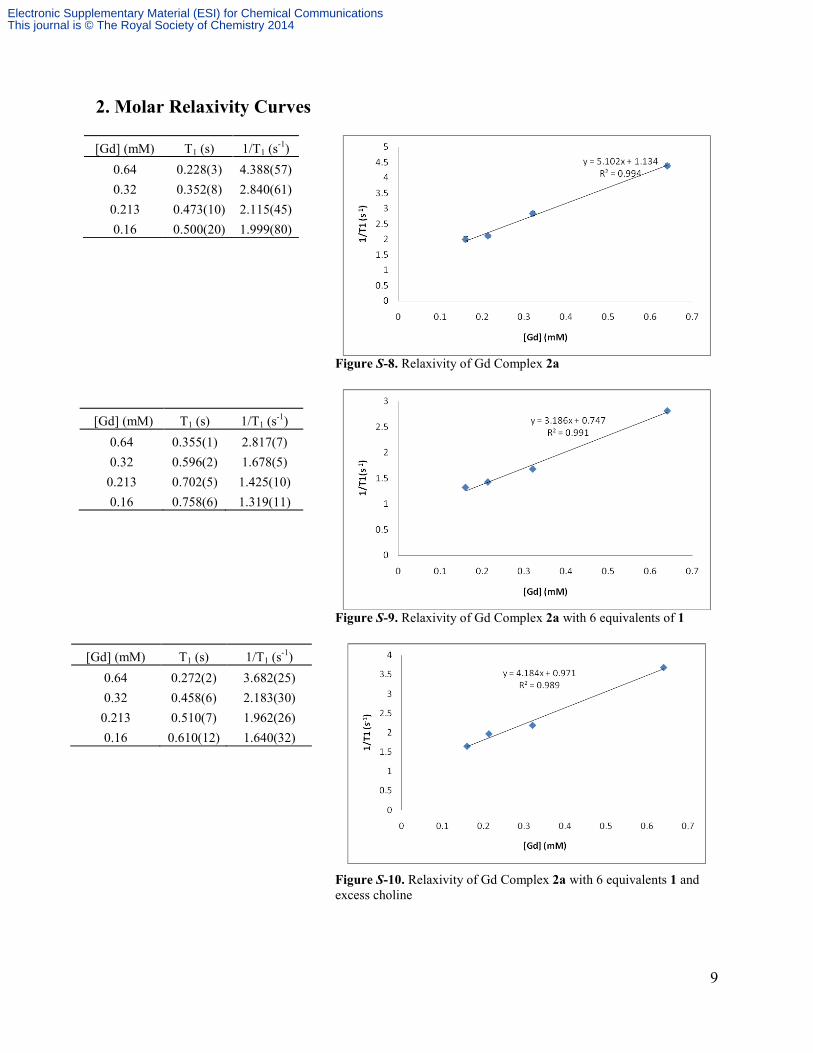
2. Molar Relaxivity Curves [Gd] (mM) T1 (s) 1/T1 (s-1)
0.64 0.228(3) 4.388(57) 0.32 0.352(8) 2.840(61)
0.213 0.473(10) 2.115(45) 0.16 0.500(20) 1.999(80)
Figure S-8. Relaxivity of Gd Complex 2a
[Gd] (mM) T1 (s) 1/T1 (s-1)
0.64 0.355(1) 2.817(7) 0.32 0.596(2) 1.678(5)
0.213 0.702(5) 1.425(10) 0.16 0.758(6) 1.319(11)
Figure S-9. Relaxivity of Gd Complex 2a with 6 equivalents of 1
[Gd] (mM) T1 (s) 1/T1 (s-1)
0.64 0.272(2) 3.682(25) 0.32 0.458(6) 2.183(30)
0.213 0.510(7) 1.962(26) 0.16 0.610(12) 1.640(32)
Figure S-10. Relaxivity of Gd Complex 2a with 6 equivalents 1 and excess choline
Electronic Supplementary Material (ESI) for Chemical CommunicationsThis journal is © The Royal Society of Chemistry 2014

10
[Gd] (mM) T1 (s) 1/T1 (s-1) 1 0.277(6) 3.617(74)
0.5 0.439(16) 2.279(84) 0.33 0.522(23) 1.917(83) 0.25 0.730(28) 1.370(52)
Figure S-11. Relaxivity of Gd·DOTA 5
[Gd] (mM) T1 (s) 1/T1 (s-1)
1 0.286(4) 3.494(51) 0.5 0.446(12) 2.242(60)
0.33 0.509(22) 1.963(84) 0.25 0.588(43) 1.701(125)
Figure S-12. Relaxivity of Gd·DOTA 5 with 4 equivalents of 1
Relaxivity of Gd·DOTA 5 with 4 equivalents of cavitand 2 upon exposure to excess choline [Gd] (mM) T1 (s) 1/T1 (s-1)
1 0.298(3) 3.357(29) 0.5 0.476(7) 2.103(31)
0.33 0.621(14) 1.611(36) 0.25 0.657(26) 1.522(60)
Figure S-13. Relaxivity of Gd·DOTA 5 with 4 equivalents of 1 and excess choline
Electronic Supplementary Material (ESI) for Chemical CommunicationsThis journal is © The Royal Society of Chemistry 2014

11
3. 1H NMR spectra of Y-DOTA titration experiments
Figure S-14. 1H NMR spectra of the titration of Y·DOTA complex 2b into a solution of cavitand 1 ([1] = 2 mM, D2O, 400 MHz, 298 K).
Figure S-15. 1H NMR spectra of the titration of cavitand 1 into a solution of Y·DOTA complex 2b ([2b] = 2 mM, D2O, 400 MHz, 298 K).
Electronic Supplementary Material (ESI) for Chemical CommunicationsThis journal is © The Royal Society of Chemistry 2014

12
Figure S-16. 1H NMR spectra of the titration of acetonitrile-d3 into a 6:1 mixture of cavitand 1 and Y·DOTA complex 2b ([2b] = 2 mM, D2O, 400 MHz, 298 K).
Electronic Supplementary Material (ESI) for Chemical CommunicationsThis journal is © The Royal Society of Chemistry 2014
13
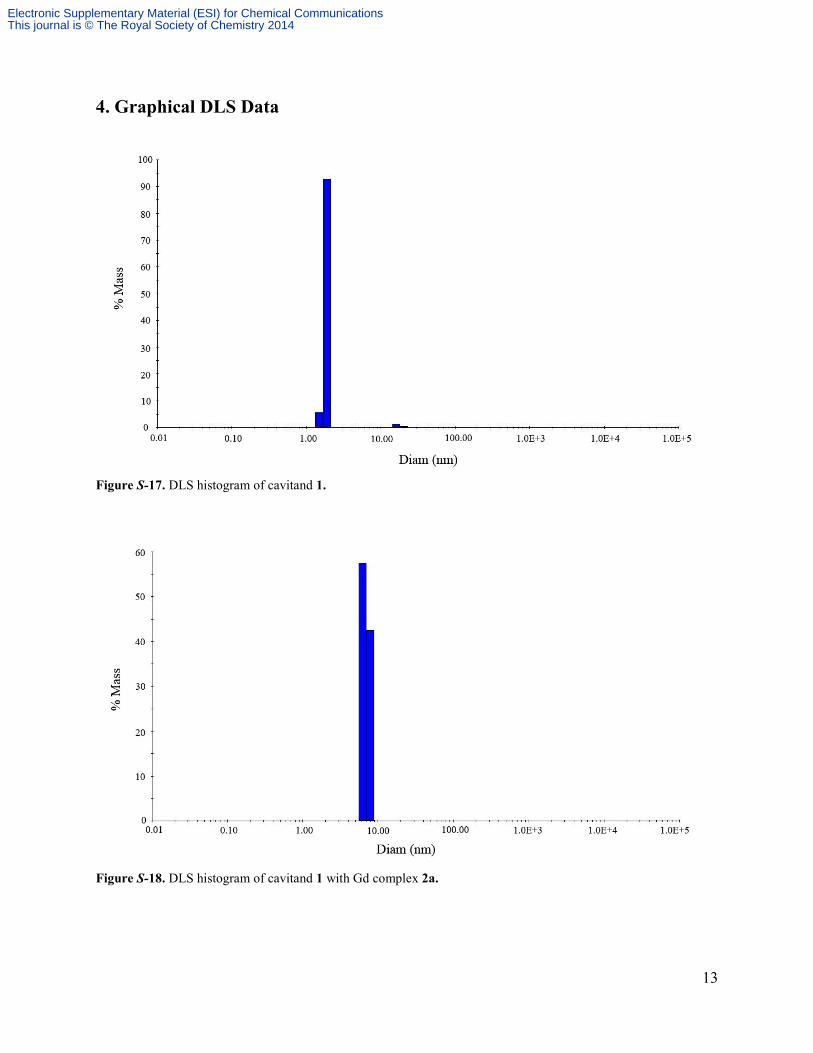
4. Graphical DLS Data
Figure S-17. DLS histogram of cavitand 1.
Figure S-18. DLS histogram of cavitand 1 with Gd complex 2a.
Electronic Supplementary Material (ESI) for Chemical CommunicationsThis journal is © The Royal Society of Chemistry 2014

14
Figure S-19. DLS histogram of cavitand 1 with Gd complex 2a upon exposure to choline. [1] M. J. S. Dewar, E. G. Zoebisch, E. F. Healy and J. J. P. Stewart, J. Am. Chem. Soc. 1985, 107, 3902-
3909; calculations performed on SPARTAN 06, Wavefunction Inc. [2] S. M. Biros, E. C. Ullrich, F. Hof, L. Trembleau and J. Rebek, Jr. J. Am. Chem. Soc. 2004, 126, 2870-
2876. [3] A. Barge, G. Cravotto, E. Gianolio and F. Fedeli, Contrast Media Mol. Imaging 2006, 1, 184-188.
Electronic Supplementary Material (ESI) for Chemical CommunicationsThis journal is © The Royal Society of Chemistry 2014