Fundamental aspects and applications of electrodeposited nanostructured metals
Upload
khangminh22Category
view
3download
0
ORIGINAL RESEARCH ARTICLE
Electrodeposited Ni-Cu Coatings with HierarchicalSurface Morphology
S. STARON , P. LEDWIG , and B. DUBIEL
In recent years, Ni-Cu alloy coatings obtained by electrolytic deposition have receivedincreasing interest, because of their good anti-corrosive, mechanical, magnetic, electrical, anddecorative properties. Further applications of these coatings for electrode materials andcatalysts may be possible by developing hierarchical surface morphology, and thus acombination of high surface roughness, high microhardness, and good corrosion resistance.In the present work, four types of Ni-Cu alloy coatings were deposited in a single-step processfrom electrolytic baths with Cu2+:Ni2+ concentrations equal to 1:30, 1:20, 1:15, and 1:10 usingdeposition current densities of 2 A/dm2 and 4 A/dm2. The surface morphology of the coatingswas characterized using a scanning electron microscope and an optical profilometer. Thecoatings exhibited a nodular morphology, which with the change of the Cu2+:Ni2 ratio and thecurrent parameters changed from smooth and compact to rougher with regularly spacednodular microprotrusions. Thus, a hierarchical surface morphology was obtained. Transmissionelectron microscopy investigations revealed that the fine-grained microstructure of the coatingsconsisted of the c solid solution, as well as the metastable intermetallic L10 NiCu phase. Thedifferences in the Cu concentration at the cross-sections demonstrated by quantitativemicroanalysis of the chemical composition indicated a dendritic growth of the coatings and apreferential reduction of copper ions over nickel ions. The coatings were also characterized by amicrohardness greater than 3.71 GPa and good electrochemical corrosion resistance in chloridemedia. Coatings with hierarchical morphology and high surface roughness showed a highercorrosion current. The study provides a new method for electrodeposition hierarchical Ni-Cucoatings under specific chemical compositions of the electrolytic bath and current conditions,characterized by a combination of promising properties for electrode and catalytic applications.
S. STARON, P. LEDWIG, and B. DUBIEL are with the Faculty ofMetals Engineering and Industrial Computer Science, AGHUniversity of Science and Technology, al. Adama Mickiewicza 30,30-059 Krakow, Poland. Contact e-mail: [email protected]
Manuscript submitted November 23, 2021; acceptedMarch 6, 2022.Article published online March 29, 2022
METALLURGICAL AND MATERIALS TRANSACTIONS A VOLUME 53A, JUNE 2022—2071
https://doi.org/10.1007/s11661-022-06649-7� The Author(s) 2022
I. INTRODUCTION
ONE of the most popular methods for obtainingNi-Cu coatings is electrolytic deposition. The mainadvantage of the process is the ability to control thechemical composition and structure of the coatings bychanging the current density,[1,2] the deposition poten-tial,[3,4] the pH, as well as the chemical composition ofthe electrolytic bath.[2,3,5–10] By modifying the processparameters, it is possible to order the distribution ofmorphological features on the surface and consequentlyshape the hierarchical coating morphology. To obtainthis, the electrodeposition with dynamic hydrogen
bubble template (DHBT),[11–13] electrodeposition undersuper gravity field,[14] electrolytic bath modification bychemical growth modifier,[12,15] or deposition underspecific current conditions[16–18] could be used.Ni-Cu alloy coatings are characterized primarily by
good corrosion resistance and mechanical, decorative,optical, electrocatalytic, thermoelectric, and magneticproperties.[2,3,5] As a result of their excellent opticalproperties and good electrical conductivity, Ni-Cualloys are used as modules for mirror telescopes andother astronomical instruments.[5] ElectrodepositedNi-Cu alloys are also used as supercapacitors.[19,20]
Thanks to the high corrosion resistance as well as good
2072—VOLUME 53A, JUNE 2022 METALLURGICAL AND MATERIALS TRANSACTIONS A

thermal and electrical conductivity, electrodepositedNi-Cu alloys are also used in the marine, oil, and gasindustries and sanitary engineering. The possibility ofobtaining materials with high surface developmentmakes Ni-Cu alloys used as oxygen/hydrogen evolutionreaction electrodes (OER/HER),[21] superhydrophobiccoatings,[22] and radiators in microelectronic applica-tions.[23] To meet the increasing demand for catalystsand OER/HER electrodes with more effective chargetransport during reactions, materials with a 3D hierar-chical structure can be applied.[24] One of the methodsthat allows production of Ni-Cu coatings with ahierarchical structure is electrochemical deposition.
Co-deposition of Cu and Ni is strongly dependent onthe deposition potential, as it influences the chemicalcomposition, microstructure, and surface morphologyof Ni-Cu alloys. At lower potential values, the alloys areenriched with nickel, and the surface morphologychanges from dendritic to cauliflower-like. The increasein the relative concentration of Ni2+ ions in the bathleads to an increase in the Ni content in the coating,which is associated with the formation of a smoothsurface.[25–27] Meanwhile, when the pH value of the bathdecreases and the Cu2+ concentration increases, thesurface roughness increases. Appropriate selection ofthe chemical composition of the electrolytic bath andcurrent conditions of electrodeposition should allow theobtaining of Ni-Cu coatings with hierarchical surfacemorphology.
Despite many experimental results on electrode-posited Ni-Cu alloy coatings in the literature, there islimited information on their hierarchical surface mor-phology. However, the hierarchical Ni-Cu coatings witha larger specific surface are of great interest regardingtheir potential application for catalysts and electrodes.
Goranova et al.[18] examined Ni-Cu coatings from thebaths with a high Cu2+:Ni2+ ratio in the range from 1:2to 1:8. They have achieved coatings with a dendriticsurface morphology showing hierarchical distribution.Moreover, they proposed a numerical model of theelectrodeposition based on the kinetics of co-depositionof Ni and Cu ions and the dendritic growth mechanismof two phases, namely Ni-based and Cu-based solidsolutions. However, the differences in chemical compo-sition of both phases were shown only for the subsurfaceareas of the coating.
Meanwhile, the range of compositions with a low Cucontent has been poorly investigated, so the minimumconcentration of Cu2+ ions needed to deposit thehierarchical Ni-Cu hierarchical coatings has not beendetermined. Therefore, in this work, we present themethod of electrodeposition of Ni-Cu coatings withhierarchical structure from the electrolytic baths withCu2+:Ni2+ ratio opposite to that reported in litera-ture.[18] We show for which Cu2+:Ni2+ ratio thehierarchical growth begins and how the change of ionsconcentration influence of the growth of the coatings.
The surface morphology is influenced by manyparameters of electrodeposition, among others chemicalcomposition and pH of the electrolytic bath, currentdensity, or temperature. In this paper, we investigate the
influence of Cu2+:Ni2+ ratio and current density on thehierarchical growth of Ni-Cu coatings. It is demon-strated that the coatings characterized by regularlyspaced globular microprotrusions are deposited as aconsequence of the difference in the kinetics of Ni2+ andCu2+ electroreduction. The influence of electrodeposi-tion conditions on the surface morphology and rough-ness, microstructure, chemical and phase composition,microhardness, and electrochemical properties isinvestigated.
II. MATERIALS AND METHODS
Four electrolytic baths with different concentrationsof copper sulfate and nickel sulfate, A, B, C, and D,were used in the experiment. Cu concentrations rangingfrom low to high were designated to examine theinfluence of a high range of Cu2+:Ni2+ ratio on themorphology, microstructure, and coating properties.The sodium citrate was added as a buffering andcomplexing agent. The chemical compositions of thebaths are given in Table I.The electrodeposition process was carried out using
Autolab PGSTAT 302N potentiostat/galvanostat(Metrohm, Switzerland), operating with three elec-trodes: the working electrode (Cu substrate), the refer-ence electrode (saturated Ag/AgCl), and the counterelectrode (platinum plate). The distance between theworking electrode and the counter electrode was set at25 mm. Rectangular Cu plates with dimensions15 mm 9 25 mm 9 1 mm were used as working elec-trodes. They were ground with water sandpapers up to2000 grit and polished on microfiber cloth using anAl2O3 suspension. The pH of the electrolytic bath wasequal to 4.5 ± 0.1. Deposition was carried out fromfreshly prepared electrolytic baths at the temperature of25 �C with a current density equal to 2 A/dm2 (coatingsA1, B1, C1 and D1) or 4 A/dm2 (coatings A2, B2, C2and D2).The electrodeposition current densities of 2 A/dm2
and 4 A/dm2 are within the range of values commonlyused for the electrodeposition of Ni-based coatings.Through examining the deposition with different valuesof current density, it was possible to determine the effectof the ion electroreduction rate on the formation ofhierarchical structures. A constant charge density equalto 36 �C/cm2 was used. The variants of electrodepositedcoatings and the deposition parameters are presented inTable II.The roughness parameters were determined using an
optical profilometer from VeecoWyko NT930. For eachcoating, an area equal to 1.235 mm2 was measured andthe Ra (arithmetical mean deviation of the roughnessprofile), Rq (root-mean-square deviation of the rough-ness profile), and Rt (maximum height of the roughnessprofile) parameters were determined.Microhardness was measured using a Tukon 2500
microhardness tester (Wolpert Wilson, USA) with theKnoop indenter under a load equal to 0.025 N. Theapplied force was chosen such that the load did not
METALLURGICAL AND MATERIALS TRANSACTIONS A VOLUME 53A, JUNE 2022—2073

affect the substrate. Ten measurements were performedfor each coating, and the microhardness (HK) wasdetermined using Eq. [1]:
HK ¼ 14:228 � 0:102Ld2
½1�
where L and d were the load and length of the longerdiagonal of hardness imprint. The Knopp hardnessvalues were converted to GPa.
The surface morphology investigation and analysis ofthe chemical composition were carried out using anInspect S50 (FEI, USA) scanning electron microscope(FEI, USA) equipped with an Octane Energy dispersiveX-ray Spectroscopy detector (EDS) and Genesis soft-ware with ExpertID plugin (EDAX INC, USA). Formicrostructural studies the accelerating voltage from 10to 15 kV was used, while the EDS measurements werecarried out at 5 kV. The advantage of performingchemical microanalysis at low voltage is the shortelectron penetration depth and thus improvement ofthe spatial resolution. The depth of electron penetrationin Ni-Cu at a 5 kV accelerating voltage calculated usingthe method described by Potts[28] was equal to 0.13 lm.Routinely, for quantitative EDS microanalysis, the K-apeaks of Ni at 7.471 keV and Cu at 8.040 keV spectrallines are used. At low voltage conditions, these peaks arenot detected; therefore, quantification with the use ofL-a peaks has to be performed. However, due to thesmall difference in the energy of Ni L-a (at 0.851 keV)and Cu L-a (at 0.930 keV), the peaks overlap. Beingaware of this limitation, a Bayesian deconvolutionapproach of overlapping peaks was used. Each EDSspectrum was collected for at least 50 seconds to obtainthe peak-to-background ratio of at least 2:1. The relative
error of the quantitative analysis related to the overlap-ping of the peaks was in the range from 20 to 33 pct. Toobtain quantitative chemical composition maps, EDSspectra were acquired at least a 45-point mesh on thecross-sections of the coatings. The distance between twoadjacent EDS measurements was approximately 0.5 lm.Based on the results of quantitative EDS microanalysis,the chemical composition maps were generated with theuse of the Surfer software (Golden Software, USA). Theaverage Cu concentration in the coatings was calculatedas the average value of the Cu concentration for allpoint EDS measurements used to create the map.Microstructural investigations were performed using
the JEM-2010 ARP (Jeol, Japan) transmission electronmicroscope (TEM). Equivalent circular diameters(ECD) of grains were calculated using ImageJ softwarefrom TEM images. The grains in the D1 and D2coatings were manually marked on the images, andsubsequently their areas and ECDs were determined.The JEMS v4.4230 software (Pierre Stadelmann,
JEMS-SAS, Switzerland) was used to analyze theselected area electron diffraction (SAED) patterns.Phase crystallographic data were taken from the Inor-ganic Material Database.[29]
Electrochemical corrosion measurements were carriedout in 3 pct NaCl solution.A potentiostat/galvanostat with the same system as
for coating electrodeposition was used. Linear polariza-tion was performed in a potential range from � 0.3 to0.8 V versus Open Electrode Potential (OCP) and a scanrate equal to 0.001 V/s. If the maximum current range(0.01 A) was achieved, the measurement was shortened.For each coating, the OCP and polarization curves were
Table I. Chemical Composition of Electrolytic Baths
Type of bath Cu2+:Ni2+ Ratio
Compound [g/L]
NiSO4Æ 6H2O CuSO4Æ 5H2O C6H5Na3O7
A 1:30 157.8 3.2 60.0B 1:20 157.8 4.8 60.0C 1:15 157.8 6.4 60.0D 1:10 157.8 9.6 60.0
Table II. Parameters of Electrolytic Deposition of Ni-Cu Alloy Coatings
Coating Electrolyte Bath Current Density [A/dm2] Deposition Time [s]
A1 A 2 1800A2 A 4 900B1 B 2 1800B2 B 4 900C1 C 2 1800C2 C 4 900D1 D 2 1800D2 D 4 900
2074—VOLUME 53A, JUNE 2022 METALLURGICAL AND MATERIALS TRANSACTIONS A

determined using Nova 2.0 software. The corrosionpotential and the corrosion current density were deter-mined by the Tafel extrapolation method.
III. RESULTS AND DISCUSSION
A. Surface Morphology and Roughness
Figure 1(a) through (h) shows SEM images of thesurface morphology of electrodeposited Ni-Cu alloycoatings. The surface of all coatings exhibits typicalnodular morphology. However, significant differences inthe size and distribution of nodules occur with increas-ing the Cu2+ concentration in the electrolyte. For bothinvestigated current densities, we observed the evolutionof the surface morphology and the formation of agreater number of microprotrusions due to an increasein the concentration of Cu2+ ions in the electrolyticbath. In addition, the higher number of microprotru-sions was noticeable for the current density of 4 A/dm2
than for 2 A/dm2. The surface of A1 coatings is rathersmooth with sparsely located small cauliflower-likeislands (Figure 1(a)). As the concentration of Cu2+
increases, a greater number of isolated islands areobserved in B1 (Figure 1(c)), while in C1 (Figure 1(e)),the islands overlapped, but smooth areas below thecoating islands were also visible. The surface morphol-ogy of D1 (Figure 1(g)) consisted of microprotrusions ofa large amount of irregular surface structures in thepillar shape. Similar observations of changes in surfacemorphology were also observed for the depositioncurrent of 4 A/dm2, while the number of cauliflowerislands was definitely greater than for coatings depositedat a lower current density. For a higher current density,overlapping of the islands was observed for B2(Figure 1(d)), while C2 (Figure 1(f)) consisted ofuniformly distributed cauliflower islands on the wholesurface.
The literature reports that the reason for the devel-opment of a pillar morphology is a dendritic structureand may be achieved by an increase in the coppercontent in the deposited coatings.[18,27,30] Otherresearchers obtained the nodular morphology of theNi-Cu coatings, but the pillar shape morphology hasrarely been observed.[3,4,6,31–33]
Surface morphology studies by SEM were supple-mented with roughness measurements. The roughnessmaps obtained with the use of an optical profilometerare given in Figures 2(a) through (h) and the values ofroughness parameters are listed in Table III. Theroughness parameters were in good agreement with theSEM observation and correlated with the type of surfacemorphology. The average roughness of the coatings isstrictly dependent on the surface morphology of theNi-Cu coatings. The lowest Ra values were observed forthe A1 and A2 coatings due to the presence of a smoothsurface with a low number of small microprotrusions. Aslightly higher Ra characterized the B2 and C1 coatings,which showed a surface morphology consisting ofoverlapped cauliflower islands. In turn, C2 and D2coatings with surface morphology consisting of
homogeneously distributed cauliflower islands werecharacterized by even higher Ra values. The D1 coating,which consisted of a large amount of irregular surfacestructures, microprotrusions of pillar shape, had thehighest Ra value.The increase in Rt values was due to the increase in
the concentration of Cu2+ ions for both investigatedcurrent densities. The coatings deposited at 4 A/dm2
were characterized by the presence of microprotru-sions higher than those electrodeposited under 2 A/dm2.The results of the roughness measurements confirmed
that the presence of pillar shapes and cauliflower-likemicroprotrusions was associated with a rough surface.Based on roughness profiles, it was possible to estimatethe heights of single or/and colonies of morphologicalfeatures using the procedure described in.[16] For the A1,A2, B1, and C1 coatings, the maximum protrusionheight did not exceed 5 lm.In turn, for B2, C2, D1, and D2, they were in the
range of 10 to 15 lm. It can be observed that the highconcentration of Cu2+ and the higher depositioncurrent are crucial to the formation of higherprotrusions.It has been reported in the literature that values of
roughness parameters of electrodeposited Ni-Cu coat-ings increase with the higher current density[27,34] anddeposition time.[35] At higher current densities andlonger deposition times, the surface is rough and thenumber of cauliflower features increases. This can beexplained by the increase in the ion nucleation rate athigher current densities. At high current densities, thereis an excess of ions, leading to the uneven growth of thecoating in the direction perpendicular to the substrate,creating a rough surface, which was also confirmed byAugustin et al.[36] Furthermore, an extension of theelectrodeposition time from 15 to 45 minutes at acurrent density of 10 mA/cm2 results in significantsurface roughness of the coatings. An interesting obser-vation in the present work is that the D1 and D2coatings obtained from the same bath D exhibit clearlydifferent values of roughness parameters. At a lowercurrent density of 2 A/dm2, the value of the Ra
parameter was several times higher than for the coatingobtained with a current density of 4 A/dm2. However,the value of the Rt parameter was similar. Cauliflower-like structures indicate uneven growth and thereforecreate a rough surface.[35] In the coatings examined inthe present study, the surface roughness increases withincreasing Cu content, which is in line with resultsobtained by Goranova et al.[25] They reported that theincrease in Ni2+ concentration (for the Cu2+:Ni2+
molar ratios 1:2, 1:4, 1:6, and 1:8) leads to a smoothersurface and an increase in nickel content in the alloycoating at 1 A/dm2, while at 2 A/dm2 the dendriticmorphology changes to cauliflower-like morphology.[25]
Due to the increase in the catalytic activity ofelectrocatalysts, a large surface development is necessaryand thus a greater active surface area of coatings, whichmakes the method of electrolytic deposition of Ni-basedalloys attractive.
METALLURGICAL AND MATERIALS TRANSACTIONS A VOLUME 53A, JUNE 2022—2075

B. Microstructure and Chemical Composition
Figure 3(a) through (h) shows the cross-section SEMimages of the deposited Ni-Cu alloy coatings. The thick-ness of the coatingswas in the rangeof 10 to20 lm.TheA1
and A2 exhibited a smooth and even surface profile(Figures 3(a) and (b)). With the change of concentrationratio of Cu2+:Ni2+ to 1:20 irregularly placed protrusionsappeared in the cross-sections of B1 and B2 (Figures 3(c)
Fig. 1—Surface morphology of the electrodeposited: (a) A1, (b) A2, (c) B1, (d) B2, (e) C1, (f) C2, (g) D1, and (h) D2 Ni-Cu alloy coatings withhigher magnification images in inserts, SEM SE.
2076—VOLUME 53A, JUNE 2022 METALLURGICAL AND MATERIALS TRANSACTIONS A

and (d)). For 1:15 ratio, the small microprotrusions in B1and B2 were regularly placed on the surface of C1 and C2(Figures 3(e) and (f)). Extensive growth of surface
irregularities and formation of large cauliflower-like struc-tures occurred in D1 and D2 coatings electrodepositedfrom a bath with 1:10 ratio (Figures 3(g) and (h)).
Fig. 2—Roughness maps of the electrodeposited Ni-Cu alloy coatings: (a) A1, (b) A2, (c) B1, (d) B2, (e) C1, (f) C2, (g) D1, and (h) D2, opticalprofilometer.
METALLURGICAL AND MATERIALS TRANSACTIONS A VOLUME 53A, JUNE 2022—2077

The A1 and A2 coatings had a similar structure tomost of the electrodeposited Ni-based coatings with aneven thickness, consisting of grains elongated in thedirection perpendicular to the substrate.[37,38] Besides,the D1 and D2 coatings were characterized by ahierarchical structure with an evenly distributed nodularstructures growing above the mean line of the coatingprofile to a height less than 5 lm in D1 and less than10 lm in D2. Results of microstructural investigation ofcross-sections are in line with the observations of surfacemorphology and the profilometry measurements.
TEM microstructural studies were performed for D1and D2 coatings, which were characterized by a hierar-chical structure. The thin foils were prepared from thecenter part of the thickness of the coatings. Figure 4(a)through (d) shows bright-field TEM images and thecorresponding SAED patterns, which reveal a fine-grained microstructure. The grain size histograms arepresented in Figures 4(e) and (f), and the ECD valuesare given in Table IV. In both coatings, the graindiameters were smaller than 300 nm, but the D2 coatingwas characterized by finer grains with a higher fractionof grains smaller than 100 nm. The mean ECD valuesfor D1 and D2 were equal to 80 ± 49 nm and60 ± 47 nm, respectively. In turn, the median valuesof grain diameter were equal to 68 nm and 45 nm. Thegrain sizes of the Ni-Cu alloy coatings were severalorders of magnitude smaller than those obtained in theconventional process[39] but were in a similar range asthe electrodeposited Ni-Cu described by Alper et al.[3] orother coatings deposited without grain refinement agentadditive, such as Ni or Ni-Co.[40–42]
In the D1 and D2 coatings, the rings of the diffractionspots originating from the Ni-Cu solid solution wereidentified using crystallographic data of c-Ni (Ni-basedsolid solution, a = 0.368 nm, space group Fm3m),[43]
and c-Ni0.5Cu0.5 (Ni-Cu solid solution, a = 0.3572 nm,space group Fm3m).[44] The difference in the latticeparameter of the c phase in the analyzed areas of bothcoatings, resulting from the different concentrations ofCu in Ni, could be a consequence of the cyclic changesof the chemical composition of the bath in the diffusionzone. Although the Cu content in our coatings waslower compared to the study of Goranova,[18] we haveachieved a similar surface morphology of the coating
which resulted from the microsegregation of Cu ratherthan the formation of the Cu-rich solid solution.In addition to the c phase, weak rings from the
intermetallic L10 NiCu phase were identified(a = 0.330 nm, c = 0.290, space group P4/mmm)[45,46]
in both the c-Ni or c-Ni0.5Cu0.5 areas. The L10-orderedphase with AB stoichiometry characterized by a prim-itive tetragonal structure is probably a superlatticederivative of c-Ni0.5Cu0.5 phase. The presence of L10phase in electrodeposited Ni-Cu coatings was alsoobserved by Ghosh et al.,[46] and in ion beam-evapo-rated Ni-Cu thin films by Sarrazin et al.[45] The L10phase is metastable and is quite rarely present in Ni-Cualloys. Its electrodeposition requires the formation ofhigh energy nucleation sites due to high local overpo-tential and thus is slower than the deposition of thedisordered c solid solution. The process of L10 forma-tion might probably be accelerated by temporary localinhibition of kink sites by citrate anions. The specificcrystallization requirement causes L10 grains to be muchsmaller than c phase.[46]
The average concentration of Cu in the coatingsdetermined by EDS is given in Table V.An increase in the average Cu content was observed
due to an increase in the concentration of Cu2+ ions inthe electrolytic bath. Furthermore, a lower Cu contentwas observed in all samples deposited at 4 A/dm2 than2 A/dm2.However, the results of phase identification by elec-
tron diffraction analysis indicate the local variations inthe Ni and Cu concentrations. Therefore, quantitativeEDS microanalysis was performed on the cross-sectionof the coatings. Figure 5(a) through (d) shows thequantitative chemical composition maps that reveal theconcentration of Cu, superimposed on the SEMcross-section images of the coatings. The locations ofthe point EDS microanalysis are marked. The colorscale was selected according to the concentration rangesfrom minimum to maximum of Cu content in theexamined area, to emphasize the local fluctuations inchemical composition. Therefore, the similar colors inFigures 5(a) through (d) do not correspond to thesimilar Cu concentrations. The distribution of Ni andCu is inhomogeneous for all coatings. A higher Cucontent was observed in the protrusions.In A1 and D1 coatings, the differences in Cu
distribution revealed its segregation to dendrites, and asignificant increase in the Cu content was observed inmicroprotrusions (Figures 5(a) and (c)). Moreover, theformation of microprotusions was preceded by thedecrease in the Cu content (Figures 5(c) and (d)). Thisresult confirms that the intensification of dendriticgrowth occurs when the local concentration of Cu2+
ions in the bath decreases.In the D1 and D2 coatings, a depletion of the
diffusion zone in the Cu2+ ions during depositioncaused more developed surface morphology and forma-tion of higher microprotrusions in D2 than D1. On thecontrary, in the case of A1 and A2 coatings, theconcentration of Cu ions in the bath was low and only alimited effect of dendritic growth on the microstructurewas observed (Figures 5(a) and (b)). The A2 coating was
Table III. Roughness Parameters of Ni-Cu Alloy Coatings
Coating
Parameter
Ra [lm] Rq [lm] Rt [lm]
A1 0.23 0.40 3A2 0.21 0.37 10B1 0.50 0.63 10B2 0.27 0.59 25C1 0.31 0.48 18C2 0.46 0.98 28D1 4.39 5.29 39D2 0.45 1.19 41
2078—VOLUME 53A, JUNE 2022 METALLURGICAL AND MATERIALS TRANSACTIONS A

Fig. 3—Microstructure of (a) A1, (b) A2, (c) B1, (d) B2, (e) C1, (f) C2, (g) D1, and (h) D2 coatings observed in cross-section images, SEM, SE.
METALLURGICAL AND MATERIALS TRANSACTIONS A VOLUME 53A, JUNE 2022—2079

characterized by a more even surface than A1 (elec-trodeposited at lower current density), which might beconnected with a lower deposition rate and a higherconcentration of Cu ions in the diffusion layer or/and byoverpotential. On the basis of the results of the surfacemorphology and roughness, it can be assumed that the
growth of coatings deposited from baths B and C willproceed in an analogous pattern.Higher current density during electrodeposition
caused a lower concentration of Cu in the electrode-posited coatings, which was caused by the higherelectrodeposition rate and lower average concentration
Fig. 4—TEM bright-field images of (a) D1 and (b) D2 coatings with corresponding SAED patterns and their solution for (c) Ni and L10 phasein D1 and (d) Ni0.5Cu0.5 and L10 phase in D2, as well as (e, f) grain size distribution in D1 and D2.
Table IV. ECD Range, Mean ECD With Its Standard Deviation (ECD ± SD) and Median of ECD in D1 and D2 Coatings
Coating
Parameter
ECD Range [nm] ECD ± SD [nm] Median of ECD [nm]
D1 10 to 289 80 ± 49 68D2 13 to 284 60 ± 47 45
2080—VOLUME 53A, JUNE 2022 METALLURGICAL AND MATERIALS TRANSACTIONS A

of Cu ions in the diffusion layer. It is in line with theliterature data on electrodeposition using citrate baths,which show that Cu is usually reduced under the controlof mass transport, while Ni is under the control ofactivation over a wide range of potentials.[18,47,48]
Moreover, it was revealed that with increasing currentdensity, the Ni content in Ni-Cu alloys obtained fromcitrate-based baths increases.[2,18,23,47]
The microsegregation of Cu in coatings is related tothe co-deposition mechanism of Ni2+ and Cu2+ ions.The deposition behavior of Ni2+ and Cu2+ in a citratebath is well known.[34,49] Preferential reduction of Cu2+
over Ni2+ ions causes the depletion of Cu2+ ions in thediffusion layer and thus the dendritic growth caused by
mass limitation,[50,51] which was confirmed by the higherconcentration of Cu on the surface of the coating.During electrodeposition, Cu2+ ions are reduced atmicroprotrusions, while Ni2+ ions are discharged inmore recessed parts of the coating. Similar observationsare described by Deo et al.[35]
Based on the microstructural and compositionalstudies, a three-stage scheme for the formation ofhierarchical surface morphology in Ni-Cu coatings isproposed in Figure 6. At the start of electrodeposition,the chemical composition of the bath is similar in thediffusion zone and the bulk electrolyte. Therefore, in thefirst stage, the thin inner zone of a coating with uniformchemical composition and smooth surface is electrode-posited. As a result of the depletion of Cu2+ ions in thediffusion layer, in the second stage, Cu2+ ions are morelikely to be deposited in the dendritic microprotrusions,giving rise to the shaping of a surface development.During the third stage, regularly spaced microprotru-sions with a higher Cu content grow faster than adjacentareas, deposited from a bath depleted in Cu2+ ions, andconsequently, the outer zone of a coating with ahierarchical morphology is formed.The presented scheme is based on the microstructural
and compositional studies performed on the cross-sec-tions of the coatings and therefore gives a new input intothe detailed examination of the growth mechanism ofNi-Cu coatings. Therefore, it is a complement to theprevious model presented in Reference 18, which was
Table V. Average Chemical Composition of ElectrodepositedNi-Cu Coatings
CoatingAverage Concentration of Cu ± Standard
Deviation [Weight Percent]
A1 6.7 ± 1.1A2 4.7 ± 1.0B1 8.4 ± 3.3B2 6.9 ± 3.9C1 13.2 ± 3.8C2 8.3 ± 4.5D1 18.3 ± 5.9D2 11.6 ± 9.0
Fig. 5—Concentration maps of Cu in (a) A1, (b) A2, (c) D1, and (d) D2 coatings superimposed with their SEM SE cross-sections images. Thelocations of point EDS microanalysis are marked. Fragments of the experimental EDS spectra acquired in the (e) medium and (f) high Cuconcentration areas with the calculated curves showing the deconvolution of the Ni-La (in blue) and Cu-La (in green) peaks are also given(Color figure online).
METALLURGICAL AND MATERIALS TRANSACTIONS A VOLUME 53A, JUNE 2022—2081
postulated on the basis of the surface morphology andlocal chemical analysis of the areas near the surface.
C. Microhardness
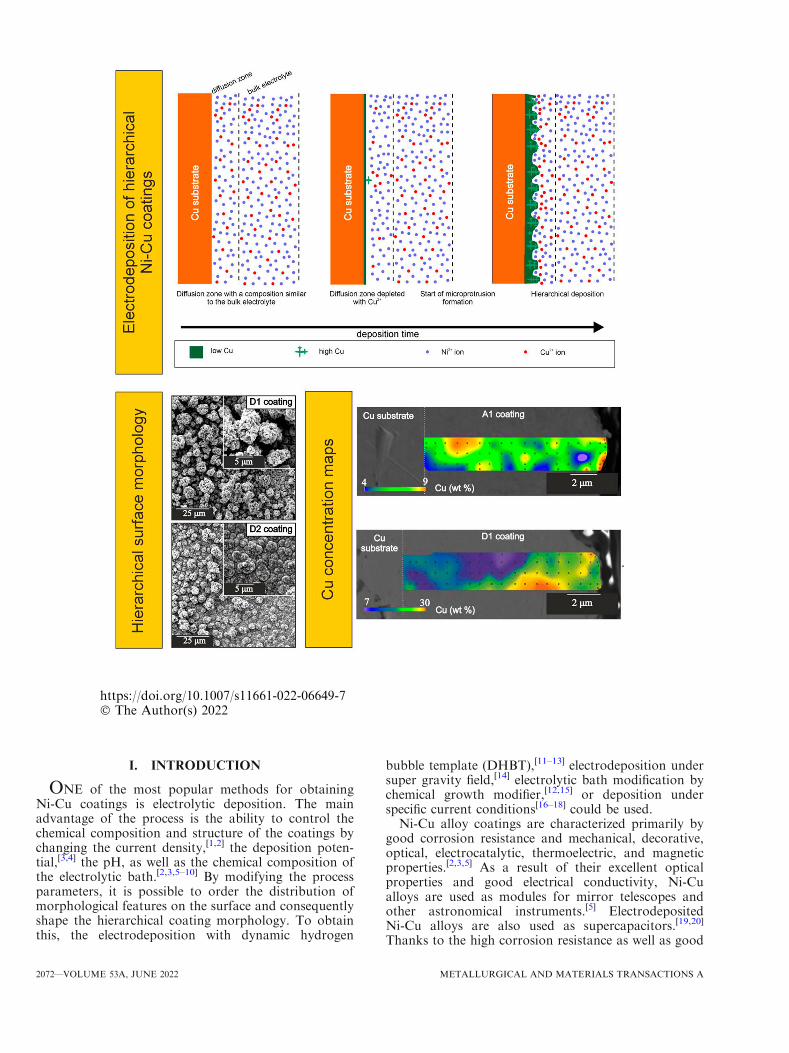
The results of the microhardness measurements aregiven in Figure 7. The bars show the mean values of 10microhardness measurements and the error bars show-ing the standard deviation are marked. The averagevalues and their standard deviations indicate that thedifferences in the microhardness of the B1, B2, C1, and
C2 coatings are slight, but it can be concluded that thehardness of these coatings is greater than A1, A2, D1,and D2.The highest microhardness was reached for coatings
obtained from baths B and C. The lowest microhardnesswas observed for coatings obtained from bath A withthe lowest Cu content in the electrolyte. However, forcoatings obtained from baths with the highest coppercontent, the microhardness was slightly higher than that
Fig. 6—Scheme of the formation of hierarchical morphology of Ni-Cu coatings: stage (1), the chemical composition of the bath is similar in thediffusion zone and the bulk electrolyte; stage (2), as a result of the depletion of Cu2+ ions in the diffusion layer, formation of microprotrusionsis initiated; and stage (3), microprotrusions with higher Cu content separated by areas depleted with Cu are created.
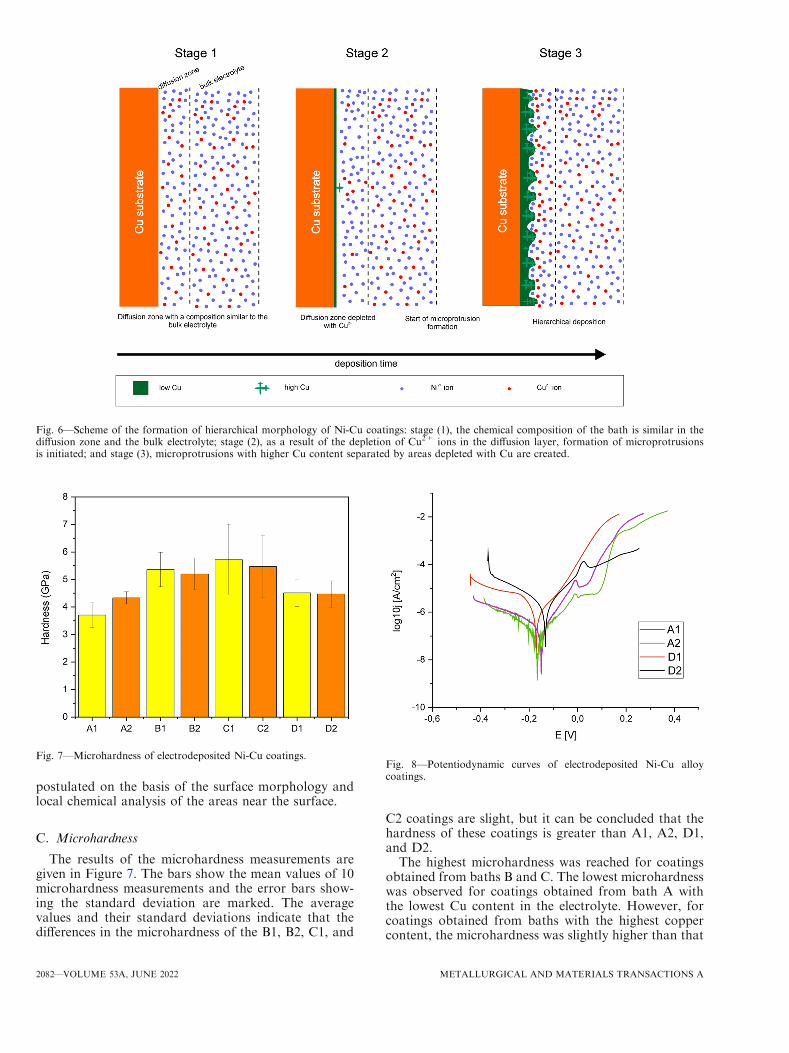
Fig. 7—Microhardness of electrodeposited Ni-Cu coatings.Fig. 8—Potentiodynamic curves of electrodeposited Ni-Cu alloycoatings.
2082—VOLUME 53A, JUNE 2022 METALLURGICAL AND MATERIALS TRANSACTIONS A

obtained from bath A. The results of microhardnessmeasurements were similar to the literature reportsobtained for Ni-based coatings.[52–56]
In the coatings obtained from electrolytic baths B andC, it was observed that with the increase of the Cucontent in the coatings, the microhardness increasedcompared to coatings with a lower copper concentrationin the coatings. It is also closely related to the currentdensity of deposition, the deposition at 2 A/dm2
increases the microhardness in these coatings comparedto the deposition at 4 A/dm2. It is well known that thehardness of the material depends on the grain size, sothe smaller the grain size, the bigger is the fraction ofgrain boundaries in the volume, which impede thedislocations’ movement.[57] It is also worth noting thatthe electrodeposited alloys with finer grain size might becharacterized by higher compactness and lowerporosity.[8]
However, B1 and B2 coatings are characterized bylower microhardness than C1 and C2 coatings, indicat-ing an influence of the solid solution mechanism due tothe dissolution of Cu atoms in Ni matrix. The presenteddata are consistent with the study of Epstein andCarlson[58] and Dai et al.[59] who confirmed that themechanical properties of the Ni-Cu alloys increase dueto solid solution with Cu content up to 32 pct. Theyshowed that this is related with both the solid solutionstrengthening and grain refinement.
In our study, we observed local differences in micro-hardness in the coatings, which are the result ofheterogeneous growth, and correlate well with thesurface morphology. However, the heterogeneous hier-archical structure is also associated with the hetero-geneities in the chemical composition and grain size, andthus the higher values of the microhardness are relatedboth with the dissolution of Cu in the Ni matrix and thegrain refinement.
D. Electrochemical Studies
Figure 8 shows the potentiodynamic polarizationcurves for Ni-Cu coatings in 3 pct NaCl solution andthe corrosion parameters are presented in Table VI.OCP values were in the range from � 0.144 to� 0.074 V. The Ecorr values were in the narrow rangebetween � 0.180 and � 0.131 V and were slightly higherthan OCP. No differences in OCP and Ecorr related tothe chemical composition were observed.
The corrosion current density jcorr values were higherabout a decade for the coatings obtained from the D
bath than the A bath. Such differences in corrosioncurrent were caused by the higher surface developmentof the D1 and D2 coatings. Furthermore, in thepolarization curves of A1, A2, and D2, the passive areawas in the range of potential from 0.01 to 0.08 V. Thelack of passivation of D1 might be related to a highersurface roughness of that coating.The obtained values of corrosion parameters of A1
and A2 coatings demonstrate their very good corrosionresistance and self-passivation behavior in the presenceof chloride ions. However, the higher Cu contentobserved on the surface may cause a less electronegativecorrosion potential of the Ni-Cu than the pure Niobtained in our previous work,[60] which makes the alloycoatings less susceptible to electrochemical corrosion.The deterioration of corrosion resistance due to the
higher roughness of the surface is obvious, well known,and described in many works, e.g. References 61–64.However, high surface roughness is desirable in mate-rials for application as catalytic materials[65–68] andOER/HER electrodes. Therefore, the hierarchical coat-ings obtained in this study are characterized by afavorable combination of surface roughness and elec-trochemical properties in terms of their prospectiveapplication.
IV. CONCLUSIONS
In this study, Ni-Cu coatings with hierarchical surfacemorphology consisting of ordered microprotrusionswere deposited through single-step electrodeposition.The influence of deposition conditions on the surfacemorphology and roughness, microstructure, chemicalcomposition, microhardness, and electrochemical prop-erties of Ni-Cu coatings was investigated.The results showed that the concentration of Cu2+
ions in the electrolyte and the current density have asignificant influence on the surface morphology androughness. We have found that uniform hierarchicalstructure starts to form for the Cu2+:Ni2+ ratio greaterthan 1:15.The formation of ordered Cu-rich microprotrusions is
related to the kinetics of the reduction of Ni2+ and theCu2+ ions and the dendritic growth of the coating.Moreover, TEM investigations revealed that themicrosegregation of Cu in the coatings results in localdifferences in the phase composition. The fine-grainedmicrostructure consists on the c phase solid solutionwith lattice parameter varied with Cu concentration, as
Table VI. Results of Measurements of Electrochemical Parameters Determined During the Corrosion Resistance Test in 3 Pct
NaCl Solution
Coating OCP [V] Corrosion Potential Ecor [V] Corrosion Current Density jcorr [A/cm2]
A1 � 0.131 � 0.147 4.04 9 10-7
A2 � 0.088 � 0.180 8.52 9 10-8
D1 � 0.144 � 0.170 1.41 9 10-6
D2 � 0.074 � 0.131 2.72 9 10-6
METALLURGICAL AND MATERIALS TRANSACTIONS A VOLUME 53A, JUNE 2022—2083

well as the ordered intermetallic NiCu phase with theL10 structure. It was demonstrated that the coatingsexhibit a combination of a high microhardness and goodcorrosion resistance. Because of the unique morphology,microstructure, and promising properties, the developedNi-Cu coatings are expected to be useful for electrodeand catalytic applications.
ACKNOWLEDGMENTS
The authors thank Prof. Slawomir Kac (AGH UST)for providing access to the facilities for SEM analysis,hardness, and roughness measurements.
FUNDING
The study was supported by AGH UST Project No.16.16.110.663.
CONFLICT OF INTEREST
The authors declare that they have no conflict ofinterest.
OPEN ACCESS
This article is licensed under a Creative CommonsAttribution 4.0 International License, which permitsuse, sharing, adaptation, distribution and reproductionin any medium or format, as long as you give appro-priate credit to the original author(s) and the source,provide a link to the Creative Commons licence, andindicate if changes were made. The images or otherthird party material in this article are included in thearticle’s Creative Commons licence, unless indicatedotherwise in a credit line to the material. If material isnot included in the article’s Creative Commons licenceand your intended use is not permitted by statutoryregulation or exceeds the permitted use, you will needto obtain permission directly from the copyrightholder. To view a copy of this licence, visit http://creativecommons.org/licenses/by/4.0/.
REFERENCES1. E. Pellicer, A. Varea, S. Pane, K.M. Sivaraman, B.J. Nelson, S.
Surinach, M.D. Baro, and J. Sort: Surf. Coat. Technol., 2011, vol.205, pp. 5285–93.
2. I. Baskaran, T.S.N.S. Narayanan, and A. Stephen: Mater. Lett.,2006, vol. 60, pp. 1990–95.
3. M. Alper, H. Kockar, M. Safak, and M.C. Baykul: J. AlloysCompd., 2008, vol. 453, pp. 15–19.
4. E. Beltowska-Lehman, E. Chassaing, and K.V. Quang: J. Appl.Electrochem., 1991, vol. 21, pp. 606–11.
5. P. Calleja, J. Esteve, P. Cojocaru, L. Magagnin, E. Valles, and E.Gomez: Electrochim. Acta., 2012, vol. 62, pp. 381–89.
6. R. Solmaz, A. Doner, and G. Kardas: Electrochem. commun.,2008, vol. 10, pp. 1909–11.
7. K. Agarwal, M. Kumar, V. Malladi, S.R.K. Balasubramaniam,and R. Balani: JOM J. Miner. Met. Mater. Soc., 2010, vol. 62, pp.88–92.
8. S.K. Ghosh, A.K. Grover, G.K. Dey, and M.K. Totlani: Surf.Coat. Technol., 2000, vol. 126, pp. 48–63.
9. T.A. Green, A.E. Russell, and S. Roy: J. Electrochem. Soc., 1998,vol. 145, pp. 875–81.
10. S. Roy: J. Electrochem. Soc., 1994, vol. 141, pp. 1509–16.11. N.D. Nikolic, P.M. Zivkovic, N. Elezovic, and U. Lacnjevac: J.
Solid State Electrochem., 2020, vol. 24, pp. 1615–24.12. X. Yu, J. Yang, X. Ren, and Z. Sui: Membranes (Basel)., 2021,
vol. 11, pp. 1–13.13. X. Yu and Z. Yuan: Metall. Mater. Trans. B., 2019, vol. 50, pp.
587–94.14. X. Yu, M. Wang, Z. Wang, X. Gong, and Z. Guo: J. Phys. Chem.
C., 2017, vol. 121, pp. 16792–16802.15. E. Hatami, A. Toghraei, and G.B. Darband: Int. J. Hydrogen
Energy., 2021, vol. 46, pp. 9394–9405.16. P. Salehikahrizsangi, K. Raeissi, F. Karimzadeh, L. Calabrese,
and E. Proverbio: Appl. Surf. Sci., 2020, vol. 520, pp. 1–9.17. Z. Chen, C. Zhu, M. Cai, X. Yi, and J. Li: Appl. Surf. Sci., 2020,
vol. 508, pp. 1–10.18. D. Goranova, R. Rashkov, G. Avdeev, and V. Tonchev: J. Mater.
Sci., 2016, vol. 51, pp. 8663–73.19. F. Wolfart, B.R. Brito, L.F. Marchesi, and M. Vidotti: J. Braz.
Chem. Soc., 2017, vol. 28, pp. 1732–40.20. X. Zhang, T. Wang, L. Ma, Q. Zhang, Y. Yu, and Q. Liu: Catal.
Commun., 2013, vol. 33, pp. 15–19.21. A.A. Smirnov, S.A. Khromova, O.A. Bulavchenko, V.V. Kaichev,
A.A. Saraev, S.I. Reshetnikov, M.V. Bykova, L.I. Trusov, andV.A. Yakovlev: Kinet. Catal., 2014, vol. 55, pp. 69–78.
22. Q. Yu, Z. Zeng, W. Zhao, M. Li, X. Wu, and Q. Xue: ColloidsSurf. A Physicochem. Eng. Asp., 2013, vol. 427, pp. 1–6.
23. M. Sundaram, A.B. Kamaraj, and G. Lillie: Procedia CIRP., 2018,vol. 68, pp. 227–31.
24. M.A. Khan, H. Zhao, W. Zou, Z. Chen, W. Cao, J. Fang, J. Xu,L. Zhang, and J. Zhang: Electrochem. Energy Rev., 2018, vol. 1,pp. 483–530.
25. D. Goranova, G. Avdeev, and R. Rashkov: Surf. Coat. Technol.,2014, vol. 240, pp. 204–10.
26. M. Haciismailoglu and M. Alper: Surf. Coat. Technol., 2011, vol.206, pp. 1430–38.
27. U. Sarac, R.M. Oksuzoglu, and M.C. Baykul: J. Mater. Sci.Mater. Electron., 2012, vol. 23, pp. 2110–16.
28. P.J. Potts: A Handbook of Silicate Rock Analysis, Chapman andHall, New York, 1987, pp. 336–37.
29. Y. Xu, M. Yamazaki, and P. Villars: Jpn. J. Appl. Phys., 2011, vol.50, pp. 1–5.
30. H. Kockar, M. Bayirli, and M. Alper: Appl. Surf. Sci., 2010, vol.256, pp. 2995–99.
31. O. Oztop, G.H. Agaoglu, and G. Orhan: Surf. Eng. Appl. Elec-trochem., 2019, vol. 55, pp. 410–17.
32. R.S. Yang, Q.S. Fu, M.T. Li, and Y.Z. Jin: Adv. Mater. Res.,2014, vol. 910, pp. 11–14.
33. H. Nady and M. Negem: Zeitschrift fur Phys Chemie., 2016, vol.231, pp. 1–20.
34. R.Y. Ying, P.K. Ng, Z. Mao, and R.E. White: J. Electrochem.Soc., 1988, vol. 135, pp. 2964–71.
35. Y. Deo, S. Guha, K. Sarkar, P. Mohanta, D. Pradhan, and A.Mondal: Appl. Surf. Sci., 2020, vol. 515, pp. 1–12.
36. A. Augustin, K.R. Udupa, and K.U. Bhat: Perspect. Sci., 2016,vol. 8, pp. 472–74.
37. A. Shibata, H. Noda, M. Sone, and Y. Higo: Thin Solid Films.,2010, vol. 518, pp. 5153–58.
38. V.G. Shadrow, T.A. Tochitskii, and A.V. Boltushkin: Cryst. Res.Technol., 1993, vol. 28, pp. 157–61.
39. W.D. Cao, M.W. Lee, and R.L. Kennedy: Scr. Metall. Mater.,1993, vol. 28, pp. 955–60.
40. B. Li, T. Mei, D. Li, and S. Du:Ultrason. Sonochem., 2019, vol. 58,pp. 1–9.
41. T. Ratajski, I. Kalemba-Rec, P. Indyka, S. Kac, M. Kot, and B.Dubiel: Mater. Charact., 2018, vol. 142, pp. 478–91.
42. A.W. Thompson and H.J. Saxton: Metall. Trans., 1973, vol. 4, pp.1599–1605.
2084—VOLUME 53A, JUNE 2022 METALLURGICAL AND MATERIALS TRANSACTIONS A

43. J.W. Cable and Y. Tsunoda: J. Magn. Magn. Mater., 1995, vol.140–144, pp. 93–94.
44. R.P. Van Ingen, R.H.J. Fastenau, and E.J. Mittemeijer: J. Appl.Phys., 1994, vol. 76, pp. 1871–83.
45. C. Sarrazin, R.J. Gaboriaud, and J.P. Riviere: Phys. Status Solidi.,1988, vol. 107, pp. 867–71.
46. S.K. Ghosh, A.K. Grover, G.K. Dey, U.D. Kulkarni, R.O.Dusane, A.K. Suri, and S. Banerjee: J. Mater. Res., 2006, vol. 21,pp. 45–61.
47. S. Rode, C. Henninot, and M. Matlosz: J. Electrochem. Soc., 2005,vol. 152, pp. C248-254.
48. E. Chassaing, K.V. Quang, and R. Wiart: J. Appl. Electrochem.,1987, vol. 17, pp. 1267–80.
49. T.B. Field, J.L. McCourt, and W.A.E. McBryde: Can. J. Chem.,1974, vol. 52, pp. 3119–24.
50. D. Landolt: Electrochim. Acta., 1994, vol. 39, pp. 1075–90.51. T. Watanabe: Nano-plating: Microstructure Control Theory of
Plated Film and Data Base of Plated Film Microstructure, 1st ed.Elsevier Science, Amsterdam, 2004, pp. 37–38.
52. A. Varea, E. Pellicer, S. Pane, B.J. Nelson, S. Surinach, M.D.Baro, and J. Sort: Int. J. Electrochem. Sci., 2012, vol. 7, pp.1288–1302.
53. M. Trzaska and G. Cieslak: Compos. Theory Pract., 2014, vol. 14,pp. 50–53.
54. A.A. Maizelis, B.I. Bairachniy, L.V. Trubnikova, and B.A. Sav-itsky: Funct. Mater., 2012, vol. 19, pp. 238–44.
55. J.C. Hsu and K.L. Lin: Thin Solid Films., 2005, vol. 471, pp.186–93.
56. P. Ledwig, M. Kac, A. Kopia, J. Falkus, and B. Dubiel: Materials(Basel)., 2021, vol. 14, pp. 1–16.
57. N.J. Petch: I. Iron Steel Inst., 1953, vol. 174, pp. 25–28.58. S.G. Epstein and O.N. Carlson: Acta Metall., 1965, vol. 13, pp.
487–91.59. P.Q. Dai, C. Zhang, J.C. Wen, H.C. Rao, and Q.T. Wang: J.
Mater. Eng. Perform., 2016, vol. 25, pp. 594–600.60. P. Ledwig and B. Dubiel: Arch. Metall. Mater., 2017, vol. 62, pp.
2455–60.61. G. Ghosh, A. Sidpara, and P.P. Bandyopadhyay: Surf. Coat.
Technol., 2019, vol. 378, pp. 1–16.62. S.G. Croll: Prog. Org. Coat., 2020, vol. 148, pp. 1–14.63. R. Walter and M.B. Kannan: Mater. Des., 2011, vol. 32, pp.
2350–54.64. A.S. Toloei, V. Stoilov, and D.O. Northwood: WIT Trans. Eng.
Sci., 2013, vol. 77, pp. 193–204.65. R.K. Shervedani and A. Lasia: J. Appl. Electrochem., 1999, vol.
29, pp. 979–86.66. I. Kim, G. Park, and J.J. Na: Int. J. Heat Mass Transf., 2019, vol.
138, pp. 916–22.67. I. Kim, Y. Yang, and G. Park: Acta Astronaut., 2020, vol. 166, pp.
260–69.68. I. Herraiz-Cardona, E. Ortega, J.G. Anton, and V. Perez-Herranz:
Int. J. Hydrogen Energy., 2011, vol. 36, pp. 9428–38.
Publisher’s Note Springer Nature remains neutral with regard tojurisdictional claims in published maps and institutional affiliations.
METALLURGICAL AND MATERIALS TRANSACTIONS A VOLUME 53A, JUNE 2022—2085
Copyright © 2022 FDOKUMEN