Electrochemical Synthesis of Poly(3,4-ethylenedioxythiophene) on Steel Electrodes: Properties and...
8
Electrochemical synthesis of poly(3,4- ethylenedioxythiophene) in aqueous dispersion of high porosity reduced graphene oxide† Tom Lindfors, * ab Zhanna A. Boeva ac and Rose-Marie Latonen a We report here the one-step electrochemical synthesis of poly(3,4-ethylenedioxythiophene) (PEDOT) in an aqueous dispersion of reduced graphene oxide (rGO). The electrochemical polymerization is carried out at 1.05 V in aqueous media in the presence of 10 2 M 3,4-ethylenedioxythiophene and 1 g L 1 rGO. Unlike composites of PEDOT and graphene oxide or poly(styrene sulfonate) which have rather smooth and non-porous surface morphologies, the scanning electron microscopy images reveal that the PEDOT composite films obtained in this work have uniformly porous and open surface morphology. X-ray photoelectron spectroscopy (XPS) showed that rGO had initially a low concentration of oxygen- containing surface groups (C : O ratio ¼ 6.5), but both FTIR spectroscopy and XPS showed that the electropolymerization resulted in the formation of OH groups in the composite film. Characterization with cyclic voltammetry and electrochemical impedance spectroscopy demonstrates that the composite films behave almost like ideal capacitors having an areal capacitance of 12.2 mF cm 2 . The composite films had a very good potential cycling stability in 0.1 M KCl with only 12.4% degradation of the capacitance in a three-electrode cell after 3000 cycles between 0.5 and 0.5 V. The degradation was higher (32.8%) in the broader potential range of 0.8 and 0.7 V. 1. Introduction Graphene has great potential in several applications ranging from e.g. electronics, supercapacitors, exible displays, touch screens, solar cells, chemical sensors, and biodiagnostics due to its one-atom thick 2-D structure and transparency, high specic surface area, good mechanical and electrical properties, and the possibility of functionalizing the graphene surface. 1–3 The exfoliation of graphite usually results in the formation of the water soluble and electrically non-conducting graphene oxide (GO) with oxygen-containing groups (hydroxyl, epoxy, carbonyl and carboxyl) 4 on the GO sheets which can be chemically reduced 5 with hydrazine, 6 sodium borohydride, 7 strongly alka- line NaOH, 8 L-ascorbic acid, 9 sodium carbonate 10 or electro- chemically at sufficiently negative potentials. 11–13 The reduction removes most of the surface groups of GO and converts it to the electrically conducting reduced graphene oxide (rGO) which is water insoluble (like graphene) complicating further processing of the rGO. Composite materials of electrically conducting polymers (ECP) and graphene or rGO have a synergetic effect which improves, for example, the capacitance of the composite materials compared to the ECPs and graphene or rGO alone. 13 In the ECP–graphene and ECP–rGO composites, the graphene and rGO which are electrical double layer capacitors add mechanical strength to the ECP matrix and increase its elec- trical conductivity while the ECPs are redox capacitors (pseu- docapacitors) improving the relatively low capacitance of graphene and rGO. This synergetic effect was reected in the high capacitance of 1126 F g 1 obtained for the PANI–rGO composite, 14 in comparison to the much lower capacitance of the graphene ultracapacitors, 135 F g 1 , 15 and polyaniline (PANI) with a nanowire structure, 724 F g 1 . 16 It was also recently shown that the electrochemical reduction of PANI–GO to PANI–rGO improved the electroactivity with 30% and increased the areal capacitance with 15% from 67 mF cm 2 to 77 mF cm 2 . 13 Moreover, the PANI–GO composite lm had an outstanding potential cycling stability in 0.1 M KCl for 10 000 cycles between 0.5 to 0.5 V with no degradation of the anodic charge showing the benecial effect of incorporating GO in the ECP matrix. Among the ECPs, the poly(3,4-ethylenedioxythiophene) (PEDOT) has a very good environmental stability. It is difficult to reduce PEDOT to its electrically non-conducting form and it a ˚ Abo Akademi University, Process Chemistry Centre, Department of Chemical Engineering, Laboratory of Analytical Chemistry, Biskopsgatan 8, FIN-20500 Turku, Finland. E-mail: Tom.Lindfors@abo.; Tel: +358 2 2154419 b Academy of Finland, Helsinki, Finland c M.V. Lomonosov Moscow State University, Chemistry Department, Polymer Division, Leninskie gory 1, build. 3, Moscow, Russian Federation † Electronic supplementary information (ESI) available. See DOI: 10.1039/c4ra03423f Cite this: RSC Adv. , 2014, 4, 25279 Received 15th April 2014 Accepted 28th May 2014 DOI: 10.1039/c4ra03423f www.rsc.org/advances This journal is © The Royal Society of Chemistry 2014 RSC Adv. , 2014, 4, 25279–25286 | 25279 RSC Advances PAPER
-
Upload
independent -
Category
Documents
-
view
1 -
download
0
Transcript of Electrochemical Synthesis of Poly(3,4-ethylenedioxythiophene) on Steel Electrodes: Properties and...
RSC Advances
PAPER
aAbo Akademi University, Process Chem
Engineering, Laboratory of Analytical Chem
Finland. E-mail: Tom.Lindfors@abo.; Tel:bAcademy of Finland, Helsinki, FinlandcM.V. Lomonosov Moscow State University,
Leninskie gory 1, build. 3, Moscow, Russian
† Electronic supplementary informa10.1039/c4ra03423f
Cite this: RSC Adv., 2014, 4, 25279
Received 15th April 2014Accepted 28th May 2014
DOI: 10.1039/c4ra03423f
www.rsc.org/advances
This journal is © The Royal Society of C
Electrochemical synthesis of poly(3,4-ethylenedioxythiophene) in aqueous dispersion ofhigh porosity reduced graphene oxide†
Tom Lindfors,*ab Zhanna A. Boevaac and Rose-Marie Latonena
We report here the one-step electrochemical synthesis of poly(3,4-ethylenedioxythiophene) (PEDOT) in an
aqueous dispersion of reduced graphene oxide (rGO). The electrochemical polymerization is carried out at
1.05 V in aqueous media in the presence of 10�2 M 3,4-ethylenedioxythiophene and 1 g L�1 rGO. Unlike
composites of PEDOT and graphene oxide or poly(styrene sulfonate) which have rather smooth and
non-porous surface morphologies, the scanning electron microscopy images reveal that the PEDOT
composite films obtained in this work have uniformly porous and open surface morphology. X-ray
photoelectron spectroscopy (XPS) showed that rGO had initially a low concentration of oxygen-
containing surface groups (C : O ratio ¼ 6.5), but both FTIR spectroscopy and XPS showed that the
electropolymerization resulted in the formation of OH groups in the composite film. Characterization
with cyclic voltammetry and electrochemical impedance spectroscopy demonstrates that the composite
films behave almost like ideal capacitors having an areal capacitance of 12.2 mF cm�2. The composite
films had a very good potential cycling stability in 0.1 M KCl with only 12.4% degradation of the
capacitance in a three-electrode cell after 3000 cycles between �0.5 and 0.5 V. The degradation was
higher (32.8%) in the broader potential range of �0.8 and 0.7 V.
1. Introduction
Graphene has great potential in several applications rangingfrom e.g. electronics, supercapacitors, exible displays, touchscreens, solar cells, chemical sensors, and biodiagnostics due toits one-atom thick 2-D structure and transparency, high specicsurface area, goodmechanical and electrical properties, and thepossibility of functionalizing the graphene surface.1–3 Theexfoliation of graphite usually results in the formation of thewater soluble and electrically non-conducting graphene oxide(GO) with oxygen-containing groups (hydroxyl, epoxy, carbonyland carboxyl)4 on the GO sheets which can be chemicallyreduced5 with hydrazine,6 sodium borohydride,7 strongly alka-line NaOH,8 L-ascorbic acid,9 sodium carbonate10 or electro-chemically at sufficiently negative potentials.11–13 The reductionremoves most of the surface groups of GO and converts it to theelectrically conducting reduced graphene oxide (rGO) which is
istry Centre, Department of Chemical
istry, Biskopsgatan 8, FIN-20500 Turku,
+358 2 2154419
Chemistry Department, Polymer Division,
Federation
tion (ESI) available. See DOI:
hemistry 2014
water insoluble (like graphene) complicating further processingof the rGO.
Composite materials of electrically conducting polymers(ECP) and graphene or rGO have a synergetic effect whichimproves, for example, the capacitance of the compositematerials compared to the ECPs and graphene or rGO alone.13
In the ECP–graphene and ECP–rGO composites, the grapheneand rGO which are electrical double layer capacitors addmechanical strength to the ECP matrix and increase its elec-trical conductivity while the ECPs are redox capacitors (pseu-docapacitors) improving the relatively low capacitance ofgraphene and rGO. This synergetic effect was reected in thehigh capacitance of 1126 F g�1 obtained for the PANI–rGOcomposite,14 in comparison to the much lower capacitance ofthe graphene ultracapacitors, 135 F g�1,15 and polyaniline(PANI) with a nanowire structure, 724 F g�1.16 It was alsorecently shown that the electrochemical reduction of PANI–GOto PANI–rGO improved the electroactivity with 30% andincreased the areal capacitance with 15% from 67 mF cm�2 to77 mF cm�2.13 Moreover, the PANI–GO composite lm had anoutstanding potential cycling stability in 0.1 M KCl for 10 000cycles between �0.5 to 0.5 V with no degradation of the anodiccharge showing the benecial effect of incorporating GO in theECP matrix.
Among the ECPs, the poly(3,4-ethylenedioxythiophene)(PEDOT) has a very good environmental stability. It is difficult toreduce PEDOT to its electrically non-conducting form and it
RSC Adv., 2014, 4, 25279–25286 | 25279
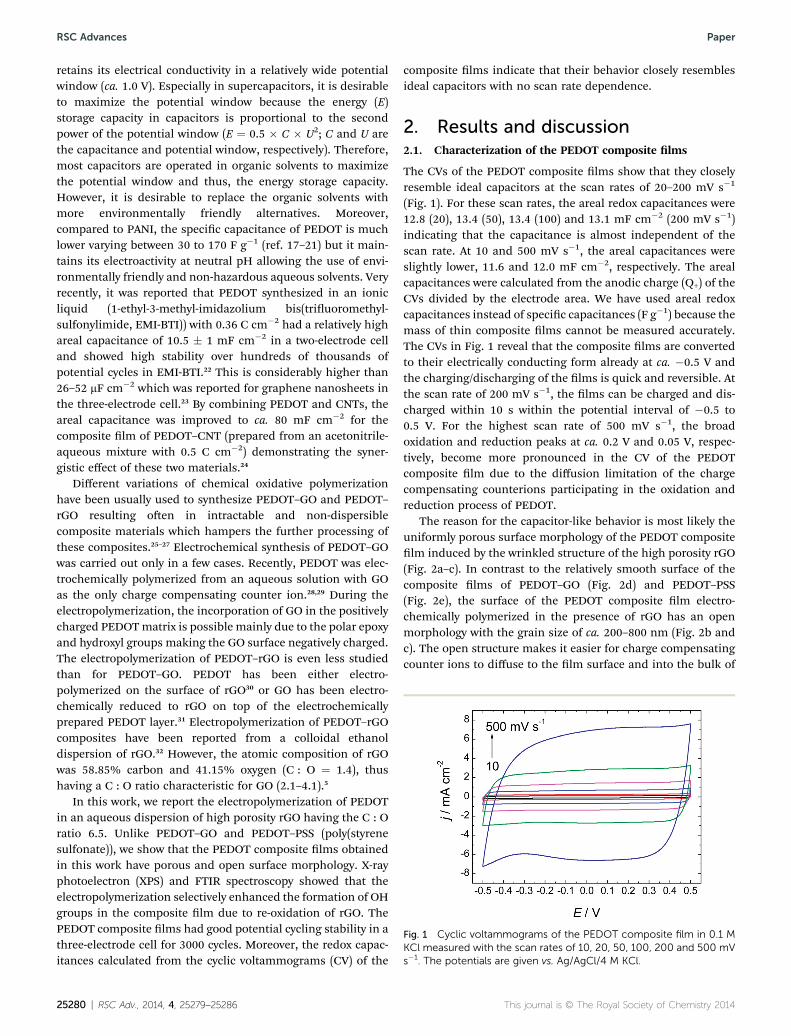
Fig. 1 Cyclic voltammograms of the PEDOT composite film in 0.1 MKCl measured with the scan rates of 10, 20, 50, 100, 200 and 500 mVs�1. The potentials are given vs. Ag/AgCl/4 M KCl.
RSC Advances Paper
retains its electrical conductivity in a relatively wide potentialwindow (ca. 1.0 V). Especially in supercapacitors, it is desirableto maximize the potential window because the energy (E)storage capacity in capacitors is proportional to the secondpower of the potential window (E ¼ 0.5 � C � U2; C and U arethe capacitance and potential window, respectively). Therefore,most capacitors are operated in organic solvents to maximizethe potential window and thus, the energy storage capacity.However, it is desirable to replace the organic solvents withmore environmentally friendly alternatives. Moreover,compared to PANI, the specic capacitance of PEDOT is muchlower varying between 30 to 170 F g�1 (ref. 17–21) but it main-tains its electroactivity at neutral pH allowing the use of envi-ronmentally friendly and non-hazardous aqueous solvents. Veryrecently, it was reported that PEDOT synthesized in an ionicliquid (1-ethyl-3-methyl-imidazolium bis(triuoromethyl-sulfonylimide, EMI-BTI)) with 0.36 C cm�2 had a relatively highareal capacitance of 10.5 � 1 mF cm�2 in a two-electrode celland showed high stability over hundreds of thousands ofpotential cycles in EMI-BTI.22 This is considerably higher than26–52 mF cm�2 which was reported for graphene nanosheets inthe three-electrode cell.23 By combining PEDOT and CNTs, theareal capacitance was improved to ca. 80 mF cm�2 for thecomposite lm of PEDOT–CNT (prepared from an acetonitrile-aqueous mixture with 0.5 C cm�2) demonstrating the syner-gistic effect of these two materials.24
Different variations of chemical oxidative polymerizationhave been usually used to synthesize PEDOT–GO and PEDOT–rGO resulting oen in intractable and non-dispersiblecomposite materials which hampers the further processing ofthese composites.25–27 Electrochemical synthesis of PEDOT–GOwas carried out only in a few cases. Recently, PEDOT was elec-trochemically polymerized from an aqueous solution with GOas the only charge compensating counter ion.28,29 During theelectropolymerization, the incorporation of GO in the positivelycharged PEDOTmatrix is possible mainly due to the polar epoxyand hydroxyl groups making the GO surface negatively charged.The electropolymerization of PEDOT–rGO is even less studiedthan for PEDOT–GO. PEDOT has been either electro-polymerized on the surface of rGO30 or GO has been electro-chemically reduced to rGO on top of the electrochemicallyprepared PEDOT layer.31 Electropolymerization of PEDOT–rGOcomposites have been reported from a colloidal ethanoldispersion of rGO.32 However, the atomic composition of rGOwas 58.85% carbon and 41.15% oxygen (C : O ¼ 1.4), thushaving a C : O ratio characteristic for GO (2.1–4.1).5
In this work, we report the electropolymerization of PEDOTin an aqueous dispersion of high porosity rGO having the C : Oratio 6.5. Unlike PEDOT–GO and PEDOT–PSS (poly(styrenesulfonate)), we show that the PEDOT composite lms obtainedin this work have porous and open surface morphology. X-rayphotoelectron (XPS) and FTIR spectroscopy showed that theelectropolymerization selectively enhanced the formation of OHgroups in the composite lm due to re-oxidation of rGO. ThePEDOT composite lms had good potential cycling stability in athree-electrode cell for 3000 cycles. Moreover, the redox capac-itances calculated from the cyclic voltammograms (CV) of the
25280 | RSC Adv., 2014, 4, 25279–25286
composite lms indicate that their behavior closely resemblesideal capacitors with no scan rate dependence.
2. Results and discussion2.1. Characterization of the PEDOT composite lms
The CVs of the PEDOT composite lms show that they closelyresemble ideal capacitors at the scan rates of 20–200 mV s�1
(Fig. 1). For these scan rates, the areal redox capacitances were12.8 (20), 13.4 (50), 13.4 (100) and 13.1 mF cm�2 (200 mV s�1)indicating that the capacitance is almost independent of thescan rate. At 10 and 500 mV s�1, the areal capacitances wereslightly lower, 11.6 and 12.0 mF cm�2, respectively. The arealcapacitances were calculated from the anodic charge (Q+) of theCVs divided by the electrode area. We have used areal redoxcapacitances instead of specic capacitances (F g�1) because themass of thin composite lms cannot be measured accurately.The CVs in Fig. 1 reveal that the composite lms are convertedto their electrically conducting form already at ca. �0.5 V andthe charging/discharging of the lms is quick and reversible. Atthe scan rate of 200 mV s�1, the lms can be charged and dis-charged within 10 s within the potential interval of �0.5 to0.5 V. For the highest scan rate of 500 mV s�1, the broadoxidation and reduction peaks at ca. 0.2 V and 0.05 V, respec-tively, become more pronounced in the CV of the PEDOTcomposite lm due to the diffusion limitation of the chargecompensating counterions participating in the oxidation andreduction process of PEDOT.
The reason for the capacitor-like behavior is most likely theuniformly porous surface morphology of the PEDOT compositelm induced by the wrinkled structure of the high porosity rGO(Fig. 2a–c). In contrast to the relatively smooth surface of thecomposite lms of PEDOT–GO (Fig. 2d) and PEDOT–PSS(Fig. 2e), the surface of the PEDOT composite lm electro-chemically polymerized in the presence of rGO has an openmorphology with the grain size of ca. 200–800 nm (Fig. 2b andc). The open structure makes it easier for charge compensatingcounter ions to diffuse to the lm surface and into the bulk of
This journal is © The Royal Society of Chemistry 2014

Fig. 2 SEM images of the (a) rGO powder, (b and c) PEDOT composite, (d) PEDOT–GO and (e) PEDOT–PSS films. Magnification: 10 000� exceptof (c) which is measured with 50 000�.
Paper RSC Advances
the composite lm which improves the charging/dischargingproperties of the composite lm. The capacitor-like behavior ofthe PEDOT composite lm was further conrmed by the elec-trochemical impedance spectroscopic (EIS) measurement at0.25 V. In Fig. 3a, the almost vertical shape of the impedancespectra obtained at low frequencies (10–100 mHz) indicate thatthe composite lms have nearly a pure capacitive behavior. Theline tting28 in Fig. 3b show that the PEDOT composite lm
This journal is © The Royal Society of Chemistry 2014
measured at 0.25 V had the areal redox capacitance of 12.2 mFcm�2 (r2 ¼ 0.9999) which is in rather good accordance with theareal redox capacitance of PEDOT–GO lms electropolymerizedat 0.94 V (14.3 mF cm�2) and 0.97 V (14.7 mF cm�2), butconsiderably higher than for PEDOT–GO prepared at 1.05 V(5.3 mF cm�2).29
In Fig. 4a, the Raman spectrum of rGO is shown with the Dand G bands at 1346 and 1588 cm�1, respectively. The Raman
RSC Adv., 2014, 4, 25279–25286 | 25281
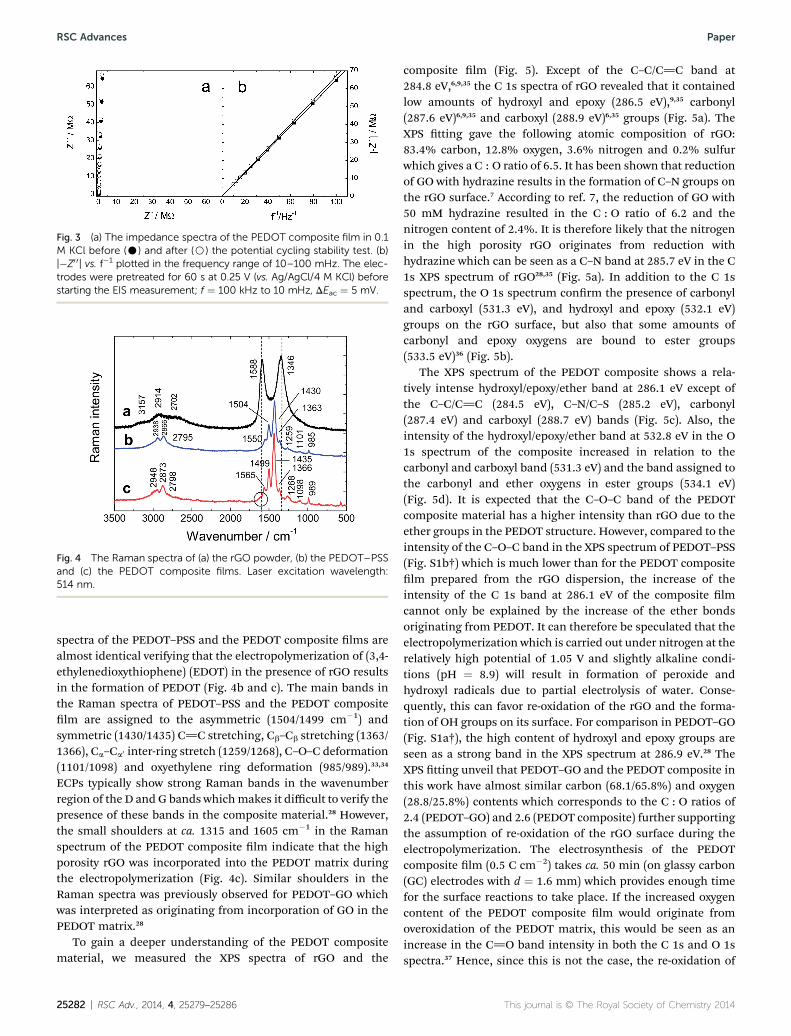
Fig. 3 (a) The impedance spectra of the PEDOT composite film in 0.1M KCl before (C) and after (B) the potential cycling stability test. (b)|�Z0 0| vs. f�1 plotted in the frequency range of 10–100 mHz. The elec-trodes were pretreated for 60 s at 0.25 V (vs. Ag/AgCl/4 M KCl) beforestarting the EIS measurement; f ¼ 100 kHz to 10 mHz, DEac ¼ 5 mV.
Fig. 4 The Raman spectra of (a) the rGO powder, (b) the PEDOT–PSSand (c) the PEDOT composite films. Laser excitation wavelength:514 nm.
RSC Advances Paper
spectra of the PEDOT–PSS and the PEDOT composite lms arealmost identical verifying that the electropolymerization of (3,4-ethylenedioxythiophene) (EDOT) in the presence of rGO resultsin the formation of PEDOT (Fig. 4b and c). The main bands inthe Raman spectra of PEDOT–PSS and the PEDOT compositelm are assigned to the asymmetric (1504/1499 cm�1) andsymmetric (1430/1435) C]C stretching, Cb–Cb stretching (1363/1366), Ca–Ca0 inter-ring stretch (1259/1268), C–O–C deformation(1101/1098) and oxyethylene ring deformation (985/989).33,34
ECPs typically show strong Raman bands in the wavenumberregion of the D and G bands whichmakes it difficult to verify thepresence of these bands in the composite material.28 However,the small shoulders at ca. 1315 and 1605 cm�1 in the Ramanspectrum of the PEDOT composite lm indicate that the highporosity rGO was incorporated into the PEDOT matrix duringthe electropolymerization (Fig. 4c). Similar shoulders in theRaman spectra was previously observed for PEDOT–GO whichwas interpreted as originating from incorporation of GO in thePEDOT matrix.28
To gain a deeper understanding of the PEDOT compositematerial, we measured the XPS spectra of rGO and the
25282 | RSC Adv., 2014, 4, 25279–25286
composite lm (Fig. 5). Except of the C–C/C]C band at284.8 eV,6,9,35 the C 1s spectra of rGO revealed that it containedlow amounts of hydroxyl and epoxy (286.5 eV),9,35 carbonyl(287.6 eV)6,9,35 and carboxyl (288.9 eV)6,35 groups (Fig. 5a). TheXPS tting gave the following atomic composition of rGO:83.4% carbon, 12.8% oxygen, 3.6% nitrogen and 0.2% sulfurwhich gives a C : O ratio of 6.5. It has been shown that reductionof GO with hydrazine results in the formation of C–N groups onthe rGO surface.7 According to ref. 7, the reduction of GO with50 mM hydrazine resulted in the C : O ratio of 6.2 and thenitrogen content of 2.4%. It is therefore likely that the nitrogenin the high porosity rGO originates from reduction withhydrazine which can be seen as a C–N band at 285.7 eV in the C1s XPS spectrum of rGO28,35 (Fig. 5a). In addition to the C 1sspectrum, the O 1s spectrum conrm the presence of carbonyland carboxyl (531.3 eV), and hydroxyl and epoxy (532.1 eV)groups on the rGO surface, but also that some amounts ofcarbonyl and epoxy oxygens are bound to ester groups(533.5 eV)36 (Fig. 5b).
The XPS spectrum of the PEDOT composite shows a rela-tively intense hydroxyl/epoxy/ether band at 286.1 eV except ofthe C–C/C]C (284.5 eV), C–N/C–S (285.2 eV), carbonyl(287.4 eV) and carboxyl (288.7 eV) bands (Fig. 5c). Also, theintensity of the hydroxyl/epoxy/ether band at 532.8 eV in the O1s spectrum of the composite increased in relation to thecarbonyl and carboxyl band (531.3 eV) and the band assigned tothe carbonyl and ether oxygens in ester groups (534.1 eV)(Fig. 5d). It is expected that the C–O–C band of the PEDOTcomposite material has a higher intensity than rGO due to theether groups in the PEDOT structure. However, compared to theintensity of the C–O–C band in the XPS spectrum of PEDOT–PSS(Fig. S1b†) which is much lower than for the PEDOT compositelm prepared from the rGO dispersion, the increase of theintensity of the C 1s band at 286.1 eV of the composite lmcannot only be explained by the increase of the ether bondsoriginating from PEDOT. It can therefore be speculated that theelectropolymerization which is carried out under nitrogen at therelatively high potential of 1.05 V and slightly alkaline condi-tions (pH ¼ 8.9) will result in formation of peroxide andhydroxyl radicals due to partial electrolysis of water. Conse-quently, this can favor re-oxidation of the rGO and the forma-tion of OH groups on its surface. For comparison in PEDOT–GO(Fig. S1a†), the high content of hydroxyl and epoxy groups areseen as a strong band in the XPS spectrum at 286.9 eV.28 TheXPS tting unveil that PEDOT–GO and the PEDOT composite inthis work have almost similar carbon (68.1/65.8%) and oxygen(28.8/25.8%) contents which corresponds to the C : O ratios of2.4 (PEDOT–GO) and 2.6 (PEDOT composite) further supportingthe assumption of re-oxidation of the rGO surface during theelectropolymerization. The electrosynthesis of the PEDOTcomposite lm (0.5 C cm�2) takes ca. 50 min (on glassy carbon(GC) electrodes with d ¼ 1.6 mm) which provides enough timefor the surface reactions to take place. If the increased oxygencontent of the PEDOT composite lm would originate fromoveroxidation of the PEDOT matrix, this would be seen as anincrease in the C]O band intensity in both the C 1s and O 1sspectra.37 Hence, since this is not the case, the re-oxidation of
This journal is © The Royal Society of Chemistry 2014

Fig. 5 XPS spectra of (a and b) the rGO powder and (c and d) the PEDOT composite film. (a) and (c): C 1s spectra (c2 ¼ 2.1 and 2.5, respectively);(b) and (d): O 1s spectra (c2 ¼ 1.6 and 2.1, respectively).
Paper RSC Advances
the rGO seems as the most plausible explanation to theincreased oxygen content in the PEDOT composite lm.Nevertheless, the combination of EDOT and the high porosityrGO as starting materials, and the re-oxidation of rGO creates aPEDOT composite lm with completely open surfacemorphology, ideal capacitor-like behavior and fast charging/discharging properties.
The FTIR spectra of rGO in Fig. 6 (spectrum a) is almostfeatureless except of the bands related to the absorption ofcrystal water at 532 cm�1 and 631 cm�1, and the vibrationalbands at 777, 1065 and 1163 cm�1 bands originating from thecarbon-hydroxo complexes of rGO and coordinated water.38 Thisis in good accordance with the XPS spectrum of rGO in Fig. 5aand b conrming the low amount of hydroxyl, epoxy, carbonyland carboxylic groups in rGO. In Fig. 6 (spectrum b), the FTIRspectrum of the PEDOT composite shows bands originating
Fig. 6 The FTIR spectra of (a) the rGO powder and (b) the PEDOTcomposite film.
This journal is © The Royal Society of Chemistry 2014
from OH stretching and absorbed water (3320 cm�1), –C]Ostretching of carboxylic and carbonyl groups (1730 cm�1),39,40 C–OH deformation (1409 cm�1), C–O–C (1205 cm�1) and C–Ogroups (1046 cm�1).41,42 The rather broad band at 1643 cm�1 ismost likely related to skeletal vibrations of graphitic (sp2)domains or bending vibrations of water molecules.38,41 Themain IR bands of PEDOT are usually located below 1550 cm�1
and are so called doping induced bands (983, 1085, 1281, 1338cm�1).43–45 A more thorough discussion of the FTIR bands ofPEDOT–GO is given in ref. 25. It can be concluded from theFTIR spectrum b in Fig. 6 that the electropolymerization processresults in formation of PEDOT and the bands at 1046, 1409 and3320 cm�1 indicate that OH groups are formed on the re-oxidized rGO surface. Moreover, the band at 1730 cm�1
assigned to carboxyl and carbonyl stretching may indicate acertain degree of overoxidation of the PEDOT matrix.
2.2. Potential cycling stability
To increase the potential window of the PEDOT composite lmin 0.1 M KCl, the lm was rst cycled from 0.5 V to differentcathodic end potentials (�0.5 to �1.0 V) to study its oxidationand reduction behavior (Fig. 7a). The CVs in Fig. 7a demon-strate that the composite lm converts to the electrically con-ducting form at ca. �0.8 V (the current density becomespositive). This potential is 0.3 Vmore negative than the cathodicend potential of �0.5 V which is usually used in potentialcycling of PEDOT in aqueous media. To extend the cathodic/anodic end potentials to more negative/positive potentials willbe benecial for improving the energy storage capacity of thePEDOT composite lm. Fig. 7b shows the inuence of theanodic end potential on the CV of the composite lm in 0.1 MKCl. The potential cycling was started at �1.0 V and continuedto the anodic end potential of 0.6–1.0 V. The CVs reveal a rather
RSC Adv., 2014, 4, 25279–25286 | 25283
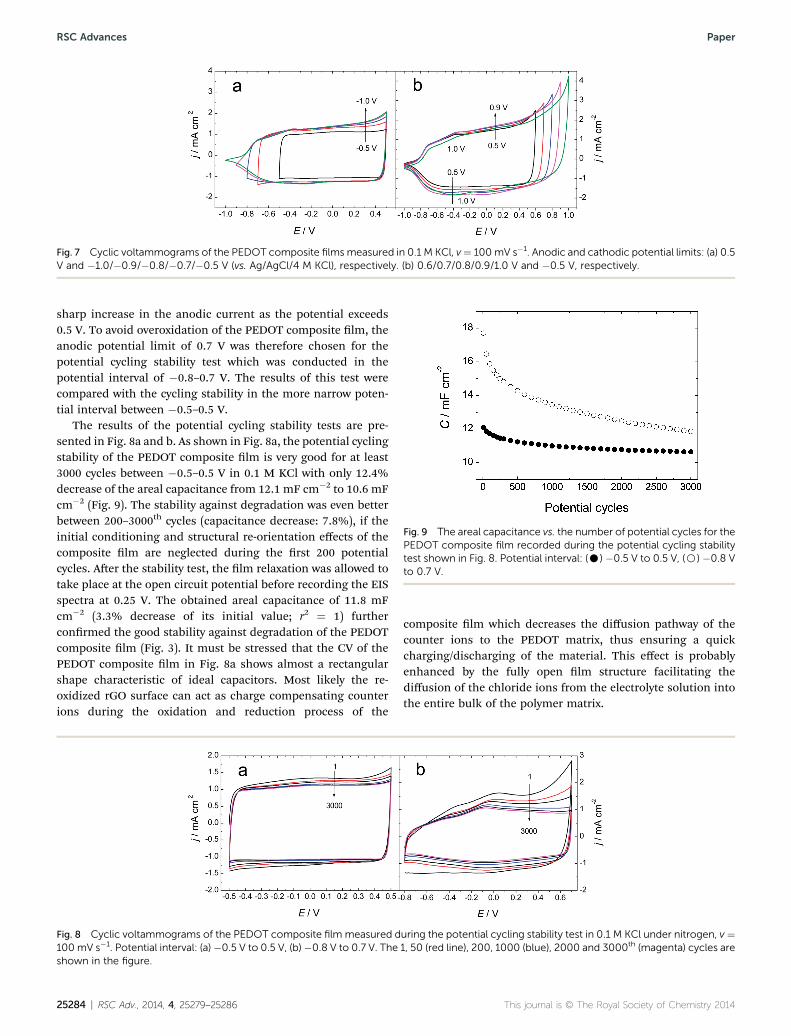
Fig. 7 Cyclic voltammograms of the PEDOT composite films measured in 0.1 M KCl, v¼ 100mV s�1. Anodic and cathodic potential limits: (a) 0.5V and �1.0/�0.9/�0.8/�0.7/�0.5 V (vs. Ag/AgCl/4 M KCl), respectively. (b) 0.6/0.7/0.8/0.9/1.0 V and �0.5 V, respectively.
Fig. 9 The areal capacitance vs. the number of potential cycles for thePEDOT composite film recorded during the potential cycling stabilitytest shown in Fig. 8. Potential interval: (C) �0.5 V to 0.5 V, (B) �0.8 Vto 0.7 V.
RSC Advances Paper
sharp increase in the anodic current as the potential exceeds0.5 V. To avoid overoxidation of the PEDOT composite lm, theanodic potential limit of 0.7 V was therefore chosen for thepotential cycling stability test which was conducted in thepotential interval of �0.8–0.7 V. The results of this test werecompared with the cycling stability in the more narrow poten-tial interval between �0.5–0.5 V.
The results of the potential cycling stability tests are pre-sented in Fig. 8a and b. As shown in Fig. 8a, the potential cyclingstability of the PEDOT composite lm is very good for at least3000 cycles between �0.5–0.5 V in 0.1 M KCl with only 12.4%decrease of the areal capacitance from 12.1 mF cm�2 to 10.6 mFcm�2 (Fig. 9). The stability against degradation was even betterbetween 200–3000th cycles (capacitance decrease: 7.8%), if theinitial conditioning and structural re-orientation effects of thecomposite lm are neglected during the rst 200 potentialcycles. Aer the stability test, the lm relaxation was allowed totake place at the open circuit potential before recording the EISspectra at 0.25 V. The obtained areal capacitance of 11.8 mFcm�2 (3.3% decrease of its initial value; r2 ¼ 1) furtherconrmed the good stability against degradation of the PEDOTcomposite lm (Fig. 3). It must be stressed that the CV of thePEDOT composite lm in Fig. 8a shows almost a rectangularshape characteristic of ideal capacitors. Most likely the re-oxidized rGO surface can act as charge compensating counterions during the oxidation and reduction process of the
Fig. 8 Cyclic voltammograms of the PEDOT composite film measured d100 mV s�1. Potential interval: (a)�0.5 V to 0.5 V, (b)�0.8 V to 0.7 V. Theshown in the figure.
25284 | RSC Adv., 2014, 4, 25279–25286
composite lm which decreases the diffusion pathway of thecounter ions to the PEDOT matrix, thus ensuring a quickcharging/discharging of the material. This effect is probablyenhanced by the fully open lm structure facilitating thediffusion of the chloride ions from the electrolyte solution intothe entire bulk of the polymer matrix.
uring the potential cycling stability test in 0.1 M KCl under nitrogen, v ¼1, 50 (red line), 200, 1000 (blue), 2000 and 3000th (magenta) cycles are
This journal is © The Royal Society of Chemistry 2014
Paper RSC Advances
The areal capacitance of the PEDOT composite lm wasimproved when the potential cycling was done between �0.8 –
0.7 V (Fig. 8b and 9). In the beginning of the potential cyclingstability test, the areal capacitance was 17.7 mF cm�2 which isca. 46% higher than the capacitance value obtained in thepotential interval of �0.5–0.5 V (Fig. 9). However, the arealcapacitance decreases quickly especially during the rst 200potential cycles which is reected as a decrease in the oxidationand reduction currents in the CV of the composite lm (Fig. 8b).By neglecting the initial capacitance decrease for the rst 200potential cycles, the areal capacitance decreases with 21.7%during the rest of the stability test (200–3000th cycles). It can bespeculated that the continuous potential cycling of the PEDOTcomposite lm to 0.7 V partially overoxidizes the polymer whichresults in the decrease of the oxidation and reduction currentsobserved in the CV in Fig. 8b, and consequently, in a lower arealcapacitance. However, the composite lm showed still areasonably good areal capacitance of 11.9 mF cm�2 aer 3000potential cycles between �0.8–0.7 V (Fig. 9).
3. Experimental3.1. Electropolymerization
The electropolymerization at 1.05 V (vs. Ag/AgCl/4 M KCl) wascarried out to the charge density of 0.5 C cm�2 in an aqueousdispersion of rGO (1 g L�1) and 0.01 M EDOT at pH 8.9.Deionized water was rst added to the high porosity rGOpowder before EDOT was added to the dispersion which waspurged with nitrogen for 15 min before starting the electro-polymerization. The high porosity rGO was purchased fromGraphene Supermarket (specic surface area: �400 m2 g;average ake thickness: 1 monolayer; average lateral particlesize: �3–10 mm). The PEDOT composite lms were formed in athree-electrode cell on GC (d ¼ 1.6 or 3.0 mm) electrodesincorporated in PEEK bodies while a GC rod functioned as thecounter electrode. At lower electrode potentials than 1.05 V thelm growth was very slow.
3.2. Cyclic voltammetry and electrochemical impedancespectroscopy
Aer the polymerization, the PEDOT composite lms werecharacterized in oxygen-free 0.1 M KCl with cyclic voltammetryand electrochemical impedance spectroscopy. The CVs andimpedance spectra were measured with an Autolab potentiostatequipped with the FRA module. The EIS spectra were recordedat 0.25 V (vs. Ag/AgCl/4 M KCl) in the frequency range of 100 kHzto 10 mHz with DEac ¼ 5 mV. The composite lms wereconditioned at 0.25 V for 60 s prior to the EIS measurement.
3.3. Scanning electron microscopy (SEM) and X-rayphotoelectron spectroscopy
The SEM images were recorded with a LEO 1530 Gemini FEG-SEM instrument and the XPS spectra were collected using a PhiQuantum 2000 (Physical Electronics) instrument with mono-chromatized Al Ka as the radiation source.
This journal is © The Royal Society of Chemistry 2014
3.4. FTIR-ATR and Raman spectroscopy
The FTIR-ATR spectra were recorded using a Harrick's Video-MVP™ single reection diamond ATR accessory (incidenceangle: 45�) having a horizontal sampling area (diameter: 500mm) and a built-in pressure applicator. All the analyzed lmswere tightly pressed against the diamond crystal during thespectral measurement. The VideoMVP™ ATR accessory wasmounted in the Bruker IFS 66S spectrometer equipped with theDTGS detector. Totally 32 interferograms were co-added foreach spectrum (resolution: 4 cm�1).
All Raman measurements were carried out with the 514 nmlaser (LaserPhysics, Ar ion laser) connected to a Leica DMLMand Renishaw Raman imaging microscope (equipped with theWire™ v1.3 Raman soware). The spectrometer was calibratedagainst a Si-standard (520.0 cm�1) before measuring the Ramanspectra of each composite lm with 1% of the maximum laserpower (20 mW) by accumulating 10 spectra.
3.5. Potential cycling stability
In a three-electrode cell, the potential cycling stability wasmeasured in oxygen-free 0.1 M KCl (20 mL) by cycling thepotential for 3000 cycles either between �0.5–0.5 V or �0.8–0.7V (vs. Ag/AgCl/4 M KCl) with the scan rate of 100 mV s�1. Thesolution was sealed and was blanketed with a low nitrogen gasow during the entire stability test.
4. Conclusions
The electrosynthesis of PEDOT at 1.05 V in an aqueous disper-sion of rGO results in the formation of C–O groups in thecomposite lm having a fully open surface morphology. It islikely that re-oxidation of the rGO surface occurs during theelectropolymerization at the relatively high polymerizationpotential and OH groups are formed on its surface. The re-oxidized rGO akes can therefore act as charge compensatingcounter ions favoring the lm formation. CV measurementsshowed that the electrochemical behavior of the composite lmclosely resembles an ideal capacitor with almost no scan ratedependence (20–200 mV s�1). This is probably due to thecombination of the unique open lm structure and the chargecompensation process which efficiently shortens the diffusionpathways of the counter ions in the PEDOT matrix. In a three-electrode cell, the potential cycling stability tests demonstratedthat the PEDOT composite lm had very good stability for 3000cycles in 0.1 M KCl with only 12.4% decrease in the arealcapacitance from its initial value of 12.1 mF cm�2 when thepotential was cycled between �0.5 V and 0.5 V. Due to itsreversible redox properties and good electrochemical stability itis expected that the PEDOT composite lms can be applied asion-to-electron transducers in solid-state devices.
Acknowledgements
Dr Anna Osterholm at Georgia Institute of Technology (USA),Assoc. Prof. Robert E. Gyurcsanyi at the Budapest University ofTechnology and Economics (Hungary) and Lic. Fil. Jyrki
RSC Adv., 2014, 4, 25279–25286 | 25285

RSC Advances Paper
Juhanoja (Finland, Top Analytica Ltd.) are gratefully acknowl-edged for fruitful discussions and advices. T.L. acknowledgesthe Academy of Finland for nancial support (project numbers130588, 263656 and 257918).
References
1 V. Singh, D. Joung, L. Zhai, S. Das, S. I. Khondaker andS. Seal, Prog. Mater. Sci., 2011, 56, 1178.
2 Y. W. Zhu, S. Murali, W. W. Cai, X. S. Li, J. W. Suk, J. R. Pottsand R. S. Ruoff, Adv. Mater., 2010, 22, 3906.
3 T. Kuilla, S. Bhadra, D. H. Yao, N. H. Kim, S. Bose andJ. H. Lee, Prog. Polym. Sci., 2010, 35, 1350.
4 D. R. Dreyer, S. Park, C. W. Bielawski and R. S. Ruoff, Chem.Soc. Rev., 2010, 39, 228.
5 S. F. Pei and H. M. Cheng, Carbon, 2012, 50, 3210.6 S. Stankovich, R. D. Piner, X. Q. Chen, N. Q. Wu, S. T. Nguyenand R. S. Ruoff, J. Mater. Chem., 2006, 16, 155.
7 H. J. Shin, K. K. Kim, A. Benayad, S. M. Yoon, H. K. Park,I. S. Jung, M. H. Jin, H. K. Jeong, J. M. Kim, J. Y. Choi andY. H. Lee, Adv. Funct. Mater., 2009, 19, 1987.
8 X. B. Fan, W. C. Peng, Y. Li, X. Y. Li, S. L. Wang, G. L. Zhangand F. B. Zhang, Adv. Mater., 2008, 20, 4490.
9 J. L. Zhang, H. J. Yang, G. X. Shen, P. Cheng, J. Y. Zhang andS. W. Guo, Chem. Commun., 2010, 46, 1112.
10 Y. H. Jin, S. Huang, M. Zhang, M. Q. Jia and D. Hu, Appl. Surf.Sci., 2013, 268, 541.
11 G. K. Ramesha and S. Sampath, J. Phys. Chem. C, 2009, 113,7985.
12 A. Viinikanoja, Z. J. Wang, J. Kauppila and C. Kvarnstrom,Phys. Chem. Chem. Phys., 2012, 14, 14003.
13 T. Lindfors and R.-M. Latonen, Carbon, 2014, 69, 122.14 H. L. Wang, Q. L. Hao, X. J. Yang, L. D. Lu and X. Wang,
Nanoscale, 2010, 2, 2164.15 M. D. Stoller, S. J. Park, Y. W. Zhu, J. H. An and R. S. Ruoff,
Nano Lett., 2008, 8, 3498.16 V. Gupta and N. Miura, Electrochem. Solid-State Lett., 2005, 8,
A630.17 K. Lota, V. Khomenko and E. Frackowiak, J. Phys. Chem.
Solids, 2004, 65, 295.18 J. Jang, J. Bae and E. Park, Adv. Mater., 2006, 18, 354.19 Y. Li, B. C. Wang, H. M. Chen and W. Feng, J. Power Sources,
2010, 195, 3025.20 R. Liu, S. Il Cho and S. B. Lee, Nanotechnology, 2008, 19,
215710.21 W. K. Li, J. Chen, J. J. Zhao, J. R. Zhang and J. J. Zhu, Mater.
Lett., 2005, 59, 800.22 A. M. Osterholm, D. E. Shen, A. L. Dyer and J. R. Reynolds,
ACS Appl. Mater. Interfaces, 2013, 5, 13432.
25286 | RSC Adv., 2014, 4, 25279–25286
23 X. Du, P. Guo, H. Song and X. Chen, Electrochim. Acta, 2010,55, 4812.
24 C. Peng, G. A. Snook, D. J. Fray, M. S. P. Shaffer andG. Z. Chen, Chem. Commun., 2006, 4629.
25 S. Biswas and L. T. Drzal, Chem. Mater., 2010, 22, 5667.26 J. T. Zhang and X. S. Zhao, J. Phys. Chem. C, 2012, 116, 5420.27 X. B. Yan, J. T. Chen, J. Yang, Q. J. Xue and P. Miele, ACS Appl.
Mater. Interfaces, 2010, 2, 2521.28 A. Osterholm, T. Lindfors, J. Kauppila, P. Damlin and
C. Kvarnstrom, Electrochim. Acta, 2012, 83, 463.29 T. Lindfors, A. Osterholm, J. Kauppila and M. Pesonen,
Electrochim. Acta, 2013, 110, 428.30 F. Jiang, Z. Yao, R. Yue, Y. Du, J. Xu, P. Yang and C. Wang,
Int. J. Hydrogen Energy, 2012, 37, 14085.31 J. R. F. Foronda, S. M. R. Cabrera, D. L. Cumpas,
P. G. A. Villar, J. L. Tan and B. J. V. Tongol, J. Chem., 2013,501824.
32 A. P. Saxena, M. Deepa, A. G. Joshi, S. Bhandari andA. K. Srivastava, ACS Appl. Mater. Interfaces, 2011, 3, 1115.
33 S. Garreau, G. Louarn, J. P. Buisson, G. Froyer and S. Lefrant,Macromolecules, 1999, 32, 6807.
34 M. Lapkowski and A. Pron, Synth. Met., 2000, 110, 79.35 H. Bai, Y. X. Xu, L. Zhao, C. Li and G. Q. Shi, Chem. Commun.,
2009, 1667.36 G. P. Lopez, D. G. Castner and B. D. Ratner, Surf. Interface
Anal., 1991, 17, 267.37 P. Tehrani, A. Kanciurzewska, X. Crispin, N. D. Robinson,
M. Fahlman and M. Berggren, Solid State Ionics, 2007, 177,3521.
38 G. Socrates, Infrared and Raman characteristic groupfrequencies: tables and charts, Wiley, Chichester, New York,2001.
39 T. Szabo, O. Berkesi, P. Forgo, K. Josepovits, Y. Sanakis,D. Petridis and I. Dekany, Chem. Mater., 2006, 18, 2740.
40 T. Szabo, E. Tombacz, E. Illes and I. Dekany, Carbon, 2006,44, 537.
41 Y. Si and E. T. Samulski, Nano Lett., 2008, 8, 1679.42 M. Acik, G. Lee, C. Mattevi, M. Chhowalla, K. Cho and
Y. J. Chabal, Nat. Mater., 2010, 9, 840.43 C. Kvarnstrom, H. Neugebauer, S. Blomquist, H. J. Ahonen,
J. Kankare and A. Ivaska, Electrochim. Acta, 1999, 44, 2739.44 C. Kvarnstrom, H. Neugebauer, A. Ivaska and N. S. Saricici,
J. Mol. Struct., 2000, 521, 271.45 A. Dkhissi, F. Louwet, L. Groenendaal, D. Beljonne,
R. Lazzaroni and J. L. Bredas, Chem. Phys. Lett., 2002, 359,466.
This journal is © The Royal Society of Chemistry 2014
![1-[2-(3,4-Dichlorobenzyloxy)-2-phenylethyl]-1 H -benzimidazole](https://static.fdokumen.com/doc/165x107/63152ee185333559270d05af/1-2-34-dichlorobenzyloxy-2-phenylethyl-1-h-benzimidazole.jpg)