Electrochemical and structural characterization of copper recycled from anodes of spent Li-ion...
9
IJRRAS 17 (2) ● November 2013 www.arpapress.com/Volumes/Vol17Issue2/IJRRAS_17_2_03.pdf 158 ELECTROCHEMICAL AND STRUCTURAL CHARACTERIZATION OF SPENT AND FRESH LITHIUM-ION CELL PHONE BATTERIES Ricardo Floriano 1* , Adenilson O. dos Santos 2 , Alexandre Urbano 1 , Lisandro P. Cardoso 3 & Jair Scarminio 1 1 Departamento de Física, Universidade Estadual de Londrina, 86051-980, Londrina, PR, Brazil 2 Centro de Ciências Sociais, Saúde e Tecnologia, Universidade Federal do Maranhão, 65900-410, Imperatriz, MA, Brazil 3 Departamento de Física Aplicada, Universidade Estadual de Campinas, CP 6165, 13083-970, Campinas, SP, Brazil ABSTRACT In this study, we showed the results of the electrochemical characterization of spent and fresh commercial cell phone lithium-ion (Li-ion) batteries including the detailed crystalline characterization of their electrodes. The charging current and cell voltage (CC-CV) charging protocol showed charge capacities very close to the nominal capacity (C) for both batteries, although abnormal charge transference was observed during the CC-CV charging regime for the spent battery. However, after the current constant (CC) discharging, the batteries showed different discharge capacities measured at 3,0 V being much lower for the spent battery in comparison with the fresh one. X-ray diffraction (XRD) patterns followed by Rietveld analysis showed the presence of a single-phase with hexagonal crystalline structure and the Li 1 CoO 2 composition (Phase I) for the discharged fresh cathode. While for the discharged cathode of the spent battery, the presence of two-phase lithium-cobalt oxide composed by 11 % of Phase I and 89 % of a second hexagonal phase characterized by an extended c axes (Phase II) were found as a result of cycling. No phase changes were observed in the hexagonal lattice of the carbon anodes of these batteries except for a decrease in relative intensities in the Bragg peaks for the spent anode material in comparison with the fresh anode. Keywords: Lithium-ion batteries, spent battery, capacity fade, XRD analysis. 1. INTRODUCTION Li-ion rechargeable batteries are currently used as power sources in many portable devices such as cellular phones. Although conceptually simple, the electrochemical process that drives a Li-ion battery is complex, with side reactions that unavoidably lead to the battery capacity fading after hundreds of charging-discharging cycles [1-3]. Extensive studies have been carried out in recent decades on the capacity fading mechanisms in Li-ion batteries. Most of them are performed under controllable conditions on assembled laboratory cells and more scarcely under a realistic approach, directly on commercial batteries[1-7]. In any case, the charge-discharge process is always conducted using battery analyzers under very controllable parameters of current, voltage, power, time and temperature, and the cycles are applied in a continuous sequence until a desirable number of cycles are achieved or throughout the battery fails. However, the daily use of a cell phone and consequently of its battery differs considerably from controllable laboratory procedures. Firstly, the cycles of charging and discharging of the battery are neither continuous nor regular in time. The charging is usually performed either when the cell phone battery runs down orat the personal convenience of the user, for example, regularly at night, no matter the real battery state of charge. Discharge current is variable during phone use, contrary to the constant and well-defined laboratory discharge currents. Furthermore, the battery operates under no temperature control due to the characteristic mobility of a cell phone. In a few minutes, it can change from 20 o C (in an acclimatized environment) to 40 o C (outdoors) and should be considered the intrinsic heating after longer conversation times. In contrast to laboratory battery tests, there is no possibility for an user to control the battery charging or even to know if it is not working properly or if an overpotential was inadvertently applied to the battery. In view of these considerations, the capacity fading process of a cell phone operated by a regular user can be different of fails induced in laboratory testing. In this paper, we present the results of electrochemical and structural analyses performed on a spent Li-ion cell phone battery that was discarded by the user. The purpose here was to investigate the electrochemical behavior of this battery under standard charging and discharging protocols as well as the crystalline phases and lattice parameters of the cathode and anode electroactive materials by X-ray diffraction (XRD) followed by the Rietveld refinement. In order to compare, these analyses were also performed on a fresh battery of the same model.
-
Upload
independent -
Category
Documents
-
view
2 -
download
0
Transcript of Electrochemical and structural characterization of copper recycled from anodes of spent Li-ion...

IJRRAS 17 (2) ● November 2013 www.arpapress.com/Volumes/Vol17Issue2/IJRRAS_17_2_03.pdf
158
ELECTROCHEMICAL AND STRUCTURAL CHARACTERIZATION OF
SPENT AND FRESH LITHIUM-ION CELL PHONE BATTERIES
Ricardo Floriano
1*, Adenilson O. dos Santos
2, Alexandre Urbano
1,
Lisandro P. Cardoso3 & Jair Scarminio
1
1Departamento de Física, Universidade Estadual de Londrina, 86051-980, Londrina, PR, Brazil
2Centro de Ciências Sociais, Saúde e Tecnologia, Universidade Federal do Maranhão, 65900-410, Imperatriz, MA,
Brazil 3Departamento de Física Aplicada, Universidade Estadual de Campinas, CP 6165, 13083-970, Campinas, SP, Brazil
ABSTRACT
In this study, we showed the results of the electrochemical characterization of spent and fresh commercial cell phone
lithium-ion (Li-ion) batteries including the detailed crystalline characterization of their electrodes. The charging
current and cell voltage (CC-CV) charging protocol showed charge capacities very close to the nominal capacity (C)
for both batteries, although abnormal charge transference was observed during the CC-CV charging regime for the
spent battery. However, after the current constant (CC) discharging, the batteries showed different discharge
capacities measured at 3,0 V being much lower for the spent battery in comparison with the fresh one. X-ray
diffraction (XRD) patterns followed by Rietveld analysis showed the presence of a single-phase with hexagonal
crystalline structure and the Li1CoO2 composition (Phase I) for the discharged fresh cathode. While for the
discharged cathode of the spent battery, the presence of two-phase lithium-cobalt oxide composed by 11 % of Phase
I and 89 % of a second hexagonal phase characterized by an extended c axes (Phase II) were found as a result of
cycling. No phase changes were observed in the hexagonal lattice of the carbon anodes of these batteries except for
a decrease in relative intensities in the Bragg peaks for the spent anode material in comparison with the fresh anode.
Keywords: Lithium-ion batteries, spent battery, capacity fade, XRD analysis.
1. INTRODUCTION Li-ion rechargeable batteries are currently used as power sources in many portable devices such as cellular phones.
Although conceptually simple, the electrochemical process that drives a Li-ion battery is complex, with side
reactions that unavoidably lead to the battery capacity fading after hundreds of charging-discharging cycles [1-3].
Extensive studies have been carried out in recent decades on the capacity fading mechanisms in Li-ion batteries.
Most of them are performed under controllable conditions on assembled laboratory cells and more scarcely under a
realistic approach, directly on commercial batteries[1-7]. In any case, the charge-discharge process is always
conducted using battery analyzers under very controllable parameters of current, voltage, power, time and
temperature, and the cycles are applied in a continuous sequence until a desirable number of cycles are achieved or
throughout the battery fails.
However, the daily use of a cell phone and consequently of its battery differs considerably from controllable
laboratory procedures. Firstly, the cycles of charging and discharging of the battery are neither continuous nor
regular in time. The charging is usually performed either when the cell phone battery runs down orat the personal
convenience of the user, for example, regularly at night, no matter the real battery state of charge. Discharge current
is variable during phone use, contrary to the constant and well-defined laboratory discharge currents. Furthermore,
the battery operates under no temperature control due to the characteristic mobility of a cell phone. In a few minutes,
it can change from 20 oC (in an acclimatized environment) to 40
oC (outdoors) and should be considered the intrinsic
heating after longer conversation times. In contrast to laboratory battery tests, there is no possibility for an user to
control the battery charging or even to know if it is not working properly or if an overpotential was inadvertently
applied to the battery. In view of these considerations, the capacity fading process of a cell phone operated by a
regular user can be different of fails induced in laboratory testing.
In this paper, we present the results of electrochemical and structural analyses performed on a spent Li-ion cell
phone battery that was discarded by the user. The purpose here was to investigate the electrochemical behavior of
this battery under standard charging and discharging protocols as well as the crystalline phases and lattice
parameters of the cathode and anode electroactive materials by X-ray diffraction (XRD) followed by the Rietveld
refinement. In order to compare, these analyses were also performed on a fresh battery of the same model.

IJRRAS 17 (2) ● November 2013 Floriano & al. ● Characterization of Lithium-Ion Cell Phone Batteries
159
2. EXPERIMENTAL
All studies were performed on prismatic Nokia BLB-3 Li-ion cell phone batteries with nominal charge capacity (C)
of 920 mAh. The spent battery was randomly picked up in a lot of discarded batteries collected by a local cell phone
service company. The selected battery presented no visible case or electrical contact deformations and had the
appearance of a new battery, indicating non-abusive use during its life. The fresh battery was acquired in the formal
market of batteries. Both batteries are similar and coming from the same manufacturer. According to the Nokia
datasheet, this battery model has lithium-cobalt oxide (LixCoO2) as cathode and carbon as anode [8].
The batteries were electrochemically charged under the CC-CV protocol, in which the applied constant current in
the CC regime was kept at a 0.5C rate (460 mA) until the battery voltage reached the cut-off value of 4.2 V, and
then the potential was kept constant at this value (CV regime) until the battery current dropped to 0.02C (18.4 mA).
After being charged, the batteries were kept at open circuit voltage for 20 minutes and then discharged under a low
constant current (CC regime) equal to 0.1C (92.0 mA) until the battery voltage reached 3.0 V. Two sequential
charge-discharge cycles were applied in all batteries. An Arbin Multichannel Battery Cycler (BT 2000) was used to
charge and discharge the batteries. In these measurements, the anode was used as the counter and reference
electrode.
The battery cells were then carefully disassembled in air by removing their plastic covers, followed by immersion in
liquid nitrogen to prevent explosion risk, and then their metallic cases were manually sawn. After warming to room
temperature, the electrolyte was vacuum-pumped out and the electrode-separator set was removed from its case,
separated from each other and vacuum-dried at 60 oC for 40 minutes. The electrode materials were scraped out of
their metallic collectors (Al and Cu foils) and gently ground into powders while avoiding, as much as possible, the
mechanical smashing of the grains. In all four samples, two cathodes and two anodes, coming from the discharged
fresh and spent batteries, were provided.
XRD patterns on powdered electrodes were performed by a Phillips X’Pert Pro MRD X-ray diffractometer operating
at 40 kV / 50 mA using Cu-K radiation (=1.5418 Å) and a pirolytic graphite-diffracted beam monochromator.
The XRD patterns were carried out in a 10o to 55
o angular range (2) with a step size of 0.02
o (2) and a counting
time of 4 s/step. Structural refinements on these patterns were carried out by the Rietveld method, using the GSAS
software with the EXPGUI interface[9,10]. The following parameters were refined: scale factor, background
parameters, lattice parameters, peak shape parameters, atomic coordinates and isotropic displacement parameters
(Uiso). The quality of the Rietveld refinement was evaluated from the reliable factors Rwp and Rp.
3. RESULTS AND DISCUSSION
3.1 Electrochemical Characterization
The electrochemical performances for the fresh and spent batteries in the CC-CV charging protocol are shown in the
Figure 1. As can be seen, their charging behaviors are very different from each other. While in the CC regime the
fresh battery was charged up to 645.7 mAh (70.2% of C) in 84 minutes, when it then reached the cut-off voltage of
4.2 V, the spent battery was charged only to 45 mAh (4.9% of C) in six minutes up to this same voltage. In the CV
regime, the fresh battery was charged over 117 minutes, generating 208.2 mAh more charge (22.6% of C) to the
battery, while the current dropped almost linearly from 460 mA to 18.4 mA. For the spent battery, this charging
regime is characterized by a very slow process, which takes 10 hours to supposedly add 899.8 mAh of charge
(97.8% of C) to the battery, with the current dropping to 18.4 mA. Table 1 summarizes the results from Figure 1.
It can be seen that in the CC regime the time to charge the spent battery up to 4.2 V was much lower than for the
fresh battery, indicating that a high impedance to charge transference was established in the electrodes. Many
studies have shown that the battery impedance dramatically rises upon cycling, particularly for charge transference
in the positive electrode [1,4,11]. The increase in the charge transference resistance is attributed to the layers
developed on the electrode surfaces with cycling [5,11].
A contrary situation is observed in the CV charging regime. For the spent battery, most of transferred charge came
from the CV charging regime, while inversely, it came from the CC regime for the fresh battery. The inverse
behavior between the CC and CV charging regimes is a well-observed phenomenon in Li-ion batteries [4,7], which
is also expected for fully used batteries. After complete the CC-CV charging process, the total charge for the fresh
battery was 92.8% of C, with a total charging time of 3.35 hours. However, for the spent battery, the measured total

IJRRAS 17 (2) ● November 2013 Floriano & al. ● Characterization of Lithium-Ion Cell Phone Batteries
160
charge was 102.7% of C under a total charging time of 10.11 hours, for which most of this charge (97.8%) was
generated in the CV regime in 10 hours, when the current decreased from 460 mA to 18.4 mA.
Figure 1.Charging curves under the CC-CV protocol for fresh and spent batteries.
Table 1. Data for spent and fresh batteries extracted from Figures 1 and 2
Fresh Spent
Charge capacity from CC regime (mAh)
Charging time (h)
645.7
1.40
45.0
0.10
Charge capacity from CV regime (mAh)
Charging time (h)
208.2
1.95
899.8
10.0
Charge capacity from CC-CV protocol (mAh)
Charging time (h)
853.9
3.35
944.8
10.11
Discharge capacity at 3.6 V (mAh)
Discharging time (h)
712.0
7.74
360.0
3.91
Discharge capacity at 3.0 V (mAh)
Discharging time (h)
864.4
9.39
468.7
5.10
Discharge capacity at 3.0 V (%) as a function of C 94 51
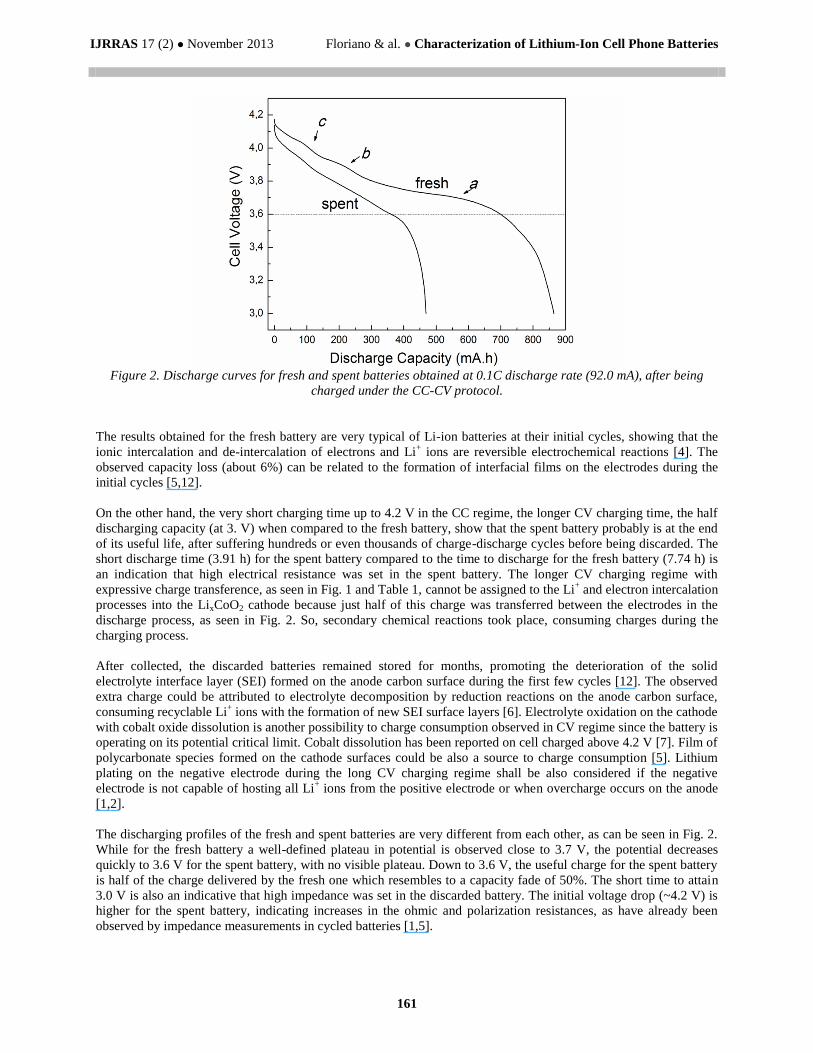
Figure 2 shows the battery discharge profiles measured at 0.1C rate after charging by the CC-CV protocol. The fresh
battery discharge capacity measured at 3.0 V was equal to 864.4 mAh and was attained after 9.4 hours, which
corresponds to 94.0% of C. For the spent battery, just 468.7 mAh was extracted from the discharged battery at 3.0
V, with a discharging time of 5.1 hours which corresponds to 51% of C. Table 1 displays all these results.
IJRRAS 17 (2) ● November 2013 Floriano & al. ● Characterization of Lithium-Ion Cell Phone Batteries
161
Figure 2. Discharge curves for fresh and spent batteries obtained at 0.1C discharge rate (92.0 mA), after being
charged under the CC-CV protocol.
The results obtained for the fresh battery are very typical of Li-ion batteries at their initial cycles, showing that the
ionic intercalation and de-intercalation of electrons and Li+ ions are reversible electrochemical reactions [4]. The
observed capacity loss (about 6%) can be related to the formation of interfacial films on the electrodes during the
initial cycles [5,12].
On the other hand, the very short charging time up to 4.2 V in the CC regime, the longer CV charging time, the half
discharging capacity (at 3. V) when compared to the fresh battery, show that the spent battery probably is at the end
of its useful life, after suffering hundreds or even thousands of charge-discharge cycles before being discarded. The
short discharge time (3.91 h) for the spent battery compared to the time to discharge for the fresh battery (7.74 h) is
an indication that high electrical resistance was set in the spent battery. The longer CV charging regime with
expressive charge transference, as seen in Fig. 1 and Table 1, cannot be assigned to the Li+ and electron intercalation
processes into the LixCoO2 cathode because just half of this charge was transferred between the electrodes in the
discharge process, as seen in Fig. 2. So, secondary chemical reactions took place, consuming charges during the
charging process.
After collected, the discarded batteries remained stored for months, promoting the deterioration of the solid
electrolyte interface layer (SEI) formed on the anode carbon surface during the first few cycles [12]. The observed
extra charge could be attributed to electrolyte decomposition by reduction reactions on the anode carbon surface,
consuming recyclable Li+ ions with the formation of new SEI surface layers [6]. Electrolyte oxidation on the cathode
with cobalt oxide dissolution is another possibility to charge consumption observed in CV regime since the battery is
operating on its potential critical limit. Cobalt dissolution has been reported on cell charged above 4.2 V [7]. Film of
polycarbonate species formed on the cathode surfaces could be also a source to charge consumption [5]. Lithium
plating on the negative electrode during the long CV charging regime shall be also considered if the negative
electrode is not capable of hosting all Li+ ions from the positive electrode or when overcharge occurs on the anode
[1,2].
The discharging profiles of the fresh and spent batteries are very different from each other, as can be seen in Fig. 2.
While for the fresh battery a well-defined plateau in potential is observed close to 3.7 V, the potential decreases
quickly to 3.6 V for the spent battery, with no visible plateau. Down to 3.6 V, the useful charge for the spent battery
is half of the charge delivered by the fresh one which resembles to a capacity fade of 50%. The short time to attain
3.0 V is also an indicative that high impedance was set in the discarded battery. The initial voltage drop (~4.2 V) is
higher for the spent battery, indicating increases in the ohmic and polarization resistances, as have already been
observed by impedance measurements in cycled batteries [1,5].

IJRRAS 17 (2) ● November 2013 Floriano & al. ● Characterization of Lithium-Ion Cell Phone Batteries
162
The discharge curve for the fresh battery exhibits a large plateau around 3.73 V (labeled a in Fig. 2) and two smaller
plateaus at higher voltages (b and c in Fig. 2). The a plateau is attributed to a two-phase region (named here as Phase
I and Phase II) where two hexagonal cells with different lattice parameters coexist. XRD measurements have shown
that this two-phase region extend from x=0.93 to x=0.75 in the LixCoO2 cathode [13]. Below this concentration
range, Phase I turns into the single Phase II that is extended down to very low x. However, around x=0.5, a subtle
monoclinic phase is created, generating the two b and c transitions [13,14]. The b and c transitions are barely
observable in the discharge curve of the spent battery. The stepped voltage in the discharge curve of the fresh battery
should correspond to the hexagonal single Phase I for LixCoO2 with 0.93<x<1.0 [13].
3.2 Crystalline Structure
The crystalline structures and the corresponding lattice parameters for the cathode and anode active materials of the
fresh and spent batteries were obtained from their XRD patterns followed by Rietveld analysis. As stated, these
measurements were performed on the batteries in discharged state.
Figure 3 shows the measured and Rietveld simulated XRD patterns for the cathode materials extracted from the
fresh (a) and spent (b) batteries. From the characteristic Bragg peaks of the measured spectra, it was observed that
the cathode’s electrochemically active material for both batteries is the lithium-cobalt oxide with a hexagonal
structure and a LixCoO2 chemical formula. The Miller indexes for the Bragg peaks were obtained by direct
comparison with the 75-0532 JCPDS card. Rietveld refinement was performed assuming the R-3m space group. The
initial model included lattice parameters and atomic coordinates of the LixCoO2 structure [15]. Both XRD patterns
also include a very small peak at 2 = 26.5o corresponding to graphite phase, which normally appears in the battery
cathodes as an electronic conductor.
A closer inspection of the two most intense Bragg peaks, namely (003) and (104), of both XRD patterns from the
Fig.3 provides useful information. Figure 4 shows in details that for these two Bragg peaks, lower relative intensities
and a shift to the lower Bragg angles are observed for the spent cathode, indicating an increase in the c-axis length
of its hexagonal cell. The decreases in the peak intensities have been justified as due to the partial occupation of
lithium sites by cobalt atoms in the LiCoO2 phase upon cycling [1,7,16]. It was also observed that each of the (003)
and (104) Bragg peaks split into two diffraction peaks for the spent cathode and that the angular position of the right
peak on each split peak coincides with the angular position of the respective single peak in the spectrum of the fresh
cathode. This is a clear indication of the coexistence of two phases in the crystalline structure of the spent cathode,
and it suggests that one of these phases would be the cobalt oxide hexagonal phase of the fresh cathode. The
secondary and lower peak observed together with the main (104) peak for the fresh cathode is just the Cu-K x-ray
diffraction.
Figure 3. Rietveld refinement for fresh (a) and spent (b) cathodes. The measured (open circle) and calculated (solid
line) XRD patterns are shown on the top. The difference between their intensities is shown on the bottom (solid line).

IJRRAS 17 (2) ● November 2013 Floriano & al. ● Characterization of Lithium-Ion Cell Phone Batteries
163
Figure 4. Details of the (003) and (104) Bragg diffraction peaks from the measured cathode XRD pattern showing
the split peaks. Solid line: fresh cathode. Open cycle: spent cathode.
The structural refinement of the fresh cathode x-ray spectrum was done considering a hexagonal cell in a single
phase with a Li1CoO2 composition, as the battery ended in the discharged state [13]. Table 2 shows the lattice
parameters obtained after running the Rietveld refinement until reaching the values of Rwp=3.4% and Rp=2.3%.
These results are in agreement with the literature data [14]. This hexagonal phase is assigned as Phase I.
As expected from the analysis in Fig. 4, the measured x-ray spectrum of the spent cathode cannot be fitted by
Rietveld refinement with just one single hexagonal phase. Thus, by using the same R-3m cell symmetry, the
spectrum was fitted considering two hexagonal LixCoO2 phases, resulting in two cells having almost the same base
lattice parameters but with a higher c parameter. The measured and calculated XRD patterns for the spent cathode
are shown in Fig. 3, for which Rwp and Rp were equal to 3.2% and 2.3%, respectively. In essence, the crystalline
structure of this cathode is composed of the coexistence of two hexagonal phases differing from each other by an
expanded c lattice parameter.
Table 3 shows the lattice parameters for each phase and their relative concentrations in weight after the Rietveld
refinements. The cathode of the discharged spent battery is composed of only 11% by weight of the same Phase I
found for the discharged fresh cathode (Li1CoO2) and 89% of a Phase II (LixCoO2), containing the extended
hexagonal cell. Thus, when discharged, the crystalline structure of the spent cathode recovers just part of the
hexagonal crystalline structure of a discharged fresh cathode (Phase I), but otherwise it is mostly composed of a new
hexagonal cell (Phase II).
Table 2. Cell parameters obtained from Rietveld refinement of the XRD pattern of the fresh cathode.
Phase I Li1CoO2, R-3m symmetry, hexagonal cell
Cell parameter a = b (Å) c (Å) Vol. (Å3)
Rietveld 2.8147(1) 14.052(1) 96.41(2)
Ref. [14] 2.816 14.049 96.48

IJRRAS 17 (2) ● November 2013 Floriano & al. ● Characterization of Lithium-Ion Cell Phone Batteries
164
Table 3. Cell parameters obtained from Rietveld refinement of the XRD pattern of the spent cathode and the relative
concentrations of Phases I and II.
Phase I Li1CoO2, R-3m symmetry, hexagonal cell
Cell parameters a = b (Å) c (Å) Vol. (Å3) Conc.(wt%)
11
Rietveld 2.8150(1) 14.069(2) 96.97(1)
Ref. [14] 2.816 14.049 96.480
Phase II LixCoO2, R-3m symmetry, hexagonal cell
Cell parameters a = b (Å) c (Å) Vol. (Å3) Conc.(wt%)
Rietveld 2.813(2) 14.151(1) 96.98(1) 89
Ref. [17] 2.82 14.19 97.73
As discussed in the discharge curves of Fig. 2, the phase diagram of the compound LixCoO2 is composed of a single
hexagonal phase (I) in the x range of 0.93<x<1.0 and a mixture of the two hexagonal phases (I+II) for 0.75<x<0.93.
For Li-cobalt oxide batteries fully discharged at 3.0 V, one expects that the cathode would be in the Li-rich phase
with a composition close to Li1CoO2. In fact, measurements on half-cells [17,18] as well as on commercial batteries
[1,7] have shown a single hexagonal phase with a Li1CoO2 composition for fresh or cycled cells in the discharged
state, even after hundreds of cycles. These results are consistent with our results for the fresh battery, shown in
Table 2, but for the spent battery discharged at 3.0 V, two hexagonal phases were identified, as shown in Table 3.
The presence of 89% of Phase I and 11% of Phase II in the spent cathode discharged to 3.0 V can be explained by
the increase of overall battery impedance upon cycling, dropping the battery potential in a way that at 3.0 V the
battery is not fully discharged (Phase I) but at the mixed (I+II) phases. This shortens the discharge time and the
battery capacity as observed in Fig. 2. Otherwise, the possibility of permanent Li incorporation into the cobalt oxide
structure of spent battery, indicated by the lowest intensities the (003) and (104) XRD peaks, Fig. 4, decreases the
overall battery potential and the 3.0 V potential can be reached under intercalation of less charge ending in the two
phase (I+II) structure.
Figure 5 shows the measured and calculated XRD patterns of the anodes extracted from fresh and spent discharged
batteries. From the characteristic peaks, particularly the (002) peak, the anode material was identified as graphitized
carbon with a hexagonal structure, by a direct comparison with the 75-1621 JCPDS card. The structure was refined
assuming the P63mc space group, and the model included the atomic coordinates of the carbon structure [19]. The
Rwp and Rp factors resulting from the refinements were, respectively, 8.9% and 6.1% for the fresh battery and 10.4%
and 6.4% for the spent battery. Table 4 shows the cell parameters obtained from Rietveld refinement of the anode x-
ray spectra.
As can be seen in Fig. 5, the (002) and (004) peaks in the XRD pattern of the spent anode are pronouncedly lower
compared with those of the fresh anodes. Otherwise, Bragg peaks like (101), (102), (103) and (112) are higher in the
diffractogram of the spent anode. No displacement in the peak positions was observed between both patterns; thus,
no new phase was produced in the spent anode, in concordance with measurements by others [16]. The differences
in the Bragg peak intensities can be understood considering that in the fresh electrode, the carbon particles are
lamellars (plain and flat) with the basal planes oriented parallel to the surface or with the cell c axis perpendicular to
the grain surface. This explains why the (00ℓ) peaks are more intense in the fresh anode spectrum. With the
successive Li intercalation and de-intercalation, these grains lose their planarity, becoming irregular in shape and
smaller and, therefore, exposing other carbon crystalline faces, generating XRD peaks that are more intense in
directions other than the (00ℓ) direction for spent anodes. We observed this effect in micrographs obtained by
scanning electron microscopy (SEM) analysis (not shown here). Changes in the peak intensities of XRD patterns of
cycled carbon anodes have been cited in the literature [5].

IJRRAS 17 (2) ● November 2013 Floriano & al. ● Characterization of Lithium-Ion Cell Phone Batteries
165
Figure 5. Rietveld refinement for fresh (a) and spent (b) anodes. The measured (open circle) and calculated (solid
line) XRD patterns are shown on the top. The difference between their intensities is shown on the bottom (solid
line).The (002) peaks for the fresh (higher intensity) and spent (lower) anodes are shown in the inset graph.
Table4. Cell parameters obtained from Rietveld refinement of XRD patterns of the anodes.
Anodes Carbon, P63mc symmetry, hexagonal cell
Cell parameters a=b (Å) c (Å) V (Å3)
Fresh 2.4665(8) 6.730 (1) 35.46 (2)
Spent 2.4673(8) 6.731(1) 35.48 (2)
Ref. [18] 2.464(2) 6.711(4) 35.29(5)
4. CONCLUSIONS
Analyses of fresh and discarded commercial Nokia BLB-3 cell phone lithium-ion batteries showed different
electrochemical and crystalline properties. Both batteries were charged by the CC-CV protocol near to their nominal
capacity but the long time took by the spent battery during the CV regime indicated that charges were transferred to
secondary reactions other than Li and electrons intercalation and deintercalation reactions into de electrodes. This
was confirmed by a galvanostatic discharge in which the capacity measured at 3,0 V for the discarded battery was
only 51% against 94% for the fresh battery.
Rietveld analysis showed that the cathode extracted from the fresh battery discharged at 3.0 V was composed by a
single hexagonal crystalline phase (Phase I) of Li1CoO2 composition. However, at this voltage the spent cathode
presented a two-phase structure, composed by 11% of Phase I and 89% of a second hexagonal phase characterized
by an extended c axis (Phase II). These coexisting phases are known in the LixCoO2 phase diagram.
The increase in the battery impedance upon cycling all along its useful life and permanent Li ion incorporation into
LixCoO2 structure are claimed to explain the presence of the mixed Phase I + Phase II observed in the cathode of the
discharged spent battery.
Spent and fresh carbon anodes showed the same hexagonal crystalline structure, with the XRD pattern of the spent
anode presenting lower intensities, indicating that some misalignments and disorder were introduced into the carbon
layers upon cycling.
5. ACKNOWLEDGEMENTS
The authors would like to thanks Sercomtel Celular S.A. for providing battery samples and partial funding, and also
to the Fundação Araucária for complementary funding (PAPPE program). R. Floriano also thanks CNPq for the
fellowship.

IJRRAS 17 (2) ● November 2013 Floriano & al. ● Characterization of Lithium-Ion Cell Phone Batteries
166
6. REFERENCES
[1]. J. Zhou, P.H.L. Notten, Studies on the degradation of Li-ion batteries by the use of microreference electrodes,
Journal of Power Sources, 177, 553-560 (2008).
[2]. S.S. Zhang, K .Xu, T.R. Jow, Study of the charging process of a LiCoO2-based Li-ion battery, Journal of
Power Sources, 160,1349-1354 (2006).
[3]. S.S. Zhang, The effect of the charging protocol on the cycle life of a Li-ion-battery, Journal of Power
Sources, 161, 1385-1391 (2006).
[4]. G. Sikha, P. Ramadass, B.S. Haran,R.E. White, B.N. Popov, Comparison of the capacity fade of Sony US
18650 cells charged with different protocols, Journal of Power Sources, 122, 67-76 (2003).
[5]. D. Aurbach, B. Markovsky, A. Rodkin, M. Cojocaru, E. Levi, H-J.Kim. An analysis of rechargeable lithium-
ion batteries after prolonged cycling, Electrochimica Acta, 47,1899-1911 (2002).
[6]. M. Lu, H. Cheng, Y. Yang, A comparison of solid electrolyte interphase (SEI) on the artificial graphite anode
of the aged and cycled commercial lithium ion cells, Electrochimica Acta, 53:3539-3546 (2008).
[7]. P. Ramadas, B. Haran, R. White, B.N. Popov, Performance study of commercial LiCoO2 and spinel-based Li-
ion cells, Journal of Power Sources,111: 210-220 (2002).
[8]. http://www.nokia.com/manuals. Accessed in: 16/12/2012.
[9]. A. C. Larson, R. B. Von Dreele, General Structure Analysis System (GSAS), Los Alamos National Laboratory
Report LAUR 86-748 (2004).
[10]. Toby B.H. EXPGUI, a graphical user interface for GSAS. Journal of Applied Crystallography. 2001; 34:
210-213.
[11]. G. Nagasubramanian, Two and three-electrode impedance studies on 18650 Li-ions cells. Journal of Power
Sources, 87:226-229 (2000).
[12]. P. Arora, R. E. White, M. Doyle, Capacity fade mechanisms and side reactions in lithium-ion batteries,
Journal of the Electrochemical Society, 145: 3647-3667 (1998).
[13]. J. N. Reimers, J. R. Dahn, Electrochemical an in situ x-ray diffraction studies of lithium intercalation in
LiCoO2, Journal of the Electrochemical Society, 139: 2091-2097 (1992).
[14]. Y. Shao-Horn, S. Levasseur, F. Weill, C. Delmas, Probing lithium and vacancy ordering in O3 layered
LxCoO2 (x 0.5), Journal of the Electrochemical Society, 150: A366-A373 (2003).
[15]. M. A. Rodrigues, D. Ingersoll, D. H. Doughty, Quantitative analysis of Li contents in LixCoO2 cathodes via
Rietveld refinement, Powder Diffraction, 18 (2): 135-139 (2003).
[16]. J. Li, E. Murphy, J. Winnick, P. A. Kohl, Studies on the cycle life of commercial lithium ion batteries during
rapid charge-discharge cycling, Journal of Power Sources, 102: 294-301 (2001).
[17]. T. Ohzuku, A. Ueda, Solid-state redox reactions of LiCoO2 (R3m) for a 4 volt secondary lithium cells,
Journal of the Electrochemical Society, 141(11): 2972-2977 (1994).
[18]. Q. Zhang, R. E. White, Moving boundary model for the discharge of a LiCoO2 electrode, Journal of the
Electrochemical Society, 154(6): A587-A596 (2007).
[19]. P. Trucano, R. Chen, Structure of graphite by neutron diffraction, Nature, 258:136-137 (1975).