Electrical remodelling of the left and right atria due to rheumatic mitral stenosis
35
ELECTRICAL REMODELING OF THE LEFT AND RIGHT ATRIA DUE TO RHEUMATIC MITRAL STENOSIS Short Title: John et al. Atrial Remodeling in Rheumatic Mitral Stenosis Bobby John, MD; 1,2 Martin K. Stiles, MBChB; 1 Pawel Kuklik, BSc; 1 Sunil T. Chandy MD; 2 Glenn D. Young, MBBS; 1 Lorraine Mackenzie PhD; 1 Lukasz Szumowski, MD, PhD; 1 George Joseph, MD; 2 Jacob Jose, MD; 2 Matthew I. Worthley, MBBS, PhD; Stephen G. Worthley, MBBS, PhD; 1 Jonathan M. Kalman, MBBS, PhD; 3 Prashanthan Sanders, MBBS, PhD. 1 From: Cardiovascular Research Center, Department of Cardiology, Royal Adelaide Hospital and the Disciplines of Medicine and Physiology, University of Adelaide, Adelaide, South Australia, Australia; 1 Department of Cardiology, Christian Medical College, Vellore, India; 2 Department of Cardiology, Royal Melbourne Hospital and the Department of Medicine, University of Melbourne, Parkville, Victoria, Australia. 3 Correspondence: Prashanthan Sanders, Cardiovascular Research Centre, Department of Cardiology, Level 5, Mc Ewin Building, Royal Adelaide Hospital, Adelaide, South Australia 5000, AUSTRALIA. Telephone: +61 8 8222 2723; Facsimile: +61 8 8222 2722 Email: [email protected] Previous Presentation: Presented in part by Dr. John at the 2 nd Asia-Pacific AF Symposium, November 2006, Tokyo, Japan and was awarded the best abstract prize. Presented in part at the Heart Rhythm Society’s 27 th Annual Scientific Sessions, May 2006, Boston, USA and published in abstract form (Heart Rhythm 2006; 3: S194).
-
Upload
independent -
Category
Documents
-
view
2 -
download
0
Transcript of Electrical remodelling of the left and right atria due to rheumatic mitral stenosis

ELECTRICAL REMODELING OF THE LEFT AND RIGHT
ATRIA DUE TO RHEUMATIC MITRAL STENOSIS
Short Title: John et al. Atrial Remodeling in Rheumatic Mitral Stenosis
Bobby John, MD;1,2 Martin K. Stiles, MBChB;1 Pawel Kuklik, BSc;1 Sunil T.
Chandy MD;2 Glenn D. Young, MBBS;1 Lorraine Mackenzie PhD;1 Lukasz
Szumowski, MD, PhD;1 George Joseph, MD;2 Jacob Jose, MD;2 Matthew I.
Worthley, MBBS, PhD; Stephen G. Worthley, MBBS, PhD;1 Jonathan M.
Kalman, MBBS, PhD;3 Prashanthan Sanders, MBBS, PhD.1
From: Cardiovascular Research Center, Department of Cardiology, Royal Adelaide
Hospital and the Disciplines of Medicine and Physiology, University of Adelaide,
Adelaide, South Australia, Australia;1 Department of Cardiology, Christian Medical
College, Vellore, India;2 Department of Cardiology, Royal Melbourne Hospital and the
Department of Medicine, University of Melbourne, Parkville, Victoria, Australia.3
Correspondence:
Prashanthan Sanders,
Cardiovascular Research Centre, Department of Cardiology,
Level 5, Mc Ewin Building, Royal Adelaide Hospital,
Adelaide, South Australia 5000,
AUSTRALIA.
Telephone: +61 8 8222 2723; Facsimile: +61 8 8222 2722
Email: [email protected]
Previous Presentation: Presented in part by Dr. John at the 2nd Asia-Pacific AF
Symposium, November 2006, Tokyo, Japan and was awarded the best abstract prize.
Presented in part at the Heart Rhythm Society’s 27th Annual Scientific Sessions, May
2006, Boston, USA and published in abstract form (Heart Rhythm 2006; 3: S194).

2
ABSTRACT
Background
Rheumatic mitral stenosis (MS) is frequently complicated by atrial fibrillation
(AF). However, the electrophysiological substrate that predisposes to AF in MS is
unknown.
Methods and Results
Twenty-four patients with rheumatic MS (valve area 0.9±0.1cm2) undergoing
percutaneous mitral commissurotomy and 24 age-matched controls were studied.
Electrophysiological study was performed by positioning multipolar catheters along the
lateral-right atrium (RA), crista terminalis (CT), coronary sinus, septal-RA, and
sequentially within the left atrium (LA). The following were determined: P-wave
duration (PWD); effective refractory period (ERP) at 10 sites at 600 and 450ms;
conduction time; site-specific conduction delay at the CT; sinus node recovery; and the
vulnerability for AF. Electroanatomic maps of both atria were created to determine
conduction velocity and identify regions of low voltage and electrical silence.
Patients with MS had larger LA (p<0.0001), prolonged PWD (p=0.0007);
prolonged ERP in both LA (p=0.0001) and RA (p<0.0001); reduced conduction velocity
in the LA (p=0.008) and RA (p=0.0001); greater number (p<0.0001) and duration
(p<0.0001) of bipoles along the CT with delayed conduction; prolonged sinus node
recovery (p=0.01); lower atrial voltage in the LA (p<0.0001) and RA (p<0.0001); and
more frequent electrical scar (p=0.001) compared to age-matched controls. 5/12 patients
with MS and none of the controls developed AF with a single extra-stimulus (p=0.02).
Conclusion
Atrial remodeling in MS is characterized by LA enlargement, loss of myocardium
and scarring associated with widespread and site-specific conduction abnormalities and

3
increased ERP. These abnormalities were associated with a heightened inducibility of AF
and may be responsible for the propensity for AF in MS.
4
INTRODUCTION
Rheumatic heart disease (RHD) is a major health problem in developing countries
and in some indigenous populations in developed countries.1, 2 It is estimated that at least
15.6 million people suffer from rheumatic heart disease world-wide.2 In addition, there is
evidence to suggest that the prevalence of this condition will continue to increase with
approximately 2.4 million children aged 5-14 manifesting features of RHD.2
While in developed countries the common causes of atrial fibrillation (AF) are
related to congestive heart failure, hypertension and increasing age,3 in the developing
world, chronic RHD is one of the common forms of structural heart disease associated
with AF, with over 40% of afflicted individuals developing AF.4 The latter population is
largely young and the onset of AF heralds significant morbidity with costs to the
individual and society. In addition, it is well recognized that the risk for stroke due to AF
in this population is increased 17.5-fold5 and accounts for up to 7.5% of all strokes in
less developed countries.2
Despite the profound consequences of AF in this population the
electrophysiological mechanisms by which rheumatic mitral stenosis (MS) predisposes to
the development of AF remain unknown. Chronic MS results in left atrial "stretch" due to
elevated pressure. While left atrial enlargement per se may be sufficient to explain the
increase in AF in this population, we hypothesized that chronic rheumatic MS also results
in significant electrical remodeling, thereby creating the substrate for atrial arrhythmias.
Percutaneous balloon mitral commissurotomy (PBMC) is now the treatment of
choice for patients with severe MS and favorable valve morphology. In patients referred
for PBMC we aimed to characterize the electrophysiological and electroanatomical
abnormalities within the right and left atria that occur as a result of rheumatic MS.

5
METHODS
Study Population
The study comprised 24 patients with rheumatic MS undergoing PBMC. Patients
were selected on the basis of having severe MS with a mitral valve area of <1.5cm2 with
significant symptoms (NYHA class ≥2) and mitral valve morphology suitable for PBMC
as determined by the Wilkins criteria (score <10). Patients were excluded if they had any
suggestion of other structural heart disease (coronary artery disease or left ventricular
dysfunction), hypertension, or amiodarone use. To avoid the potential confounding
influence of rate-related remodeling, patients with a history of atrial arrhythmias were
also excluded. A further 24 age-matched patients having radiofrequency ablation for left
sided accessory pathways without evidence of structural heart disease were studied as the
control population. The technique utilized for PBMC has been detailed elsewhere.6
All patients gave written informed consent to the study, which was approved by
each Institutional Clinical Research and Ethics Committee. All anti-arrhythmic drugs,
including calcium blockers, were ceased at least 5-half lives before the study. In addition,
all patients with MS underwent trans-esophageal echocardiography to exclude the
presence of atrial thrombus. Patients underwent either electrophysiological or
electroanatomical mapping as detailed below.
Electrophysiological Study
Electrophysiological study was performed in the fasting state with sedation
utilizing midazolam and autonomic blockade. Detailed electrophysiological evaluation of
the right (RA) and left atria (LA) was performed before PBMC. The following catheters
were positioned within the RA (Figure 1): (i) 10-pole catheter with 2-5-2 mm inter-

6
electrode spacing (Biosense-Webster or Daig Electrophysiology) in the coronary sinus
(CS) with the proximal bipole positioned at the CS ostium as determined in the best
septal left anterior oblique view; (ii) 20-pole catheter with 2-5-2 mm inter-electrode
spacing (Daig Electrophysiology) placed along the lateral right atrium (LRA); (iii) 4-pole
ablation catheter with 2-5-2 mm inter-electrode spacing (4 mm tip Celsius, Biosense-
Webster) along the high-septal RA (SRA); and (iv) 20-pole “crista” catheter with 1-3-1
mm inter-electrode spacing (Biosense-Webster) positioned with the aid of a long sheath
along the crista terminalis (CT) and standardized such that the second bipole lay at the
junction of the superior vena cava with the RA as determined by fluoroscopy and
intracardiac echocardiography (ICE; Acunav, Siemens Medical). For LA mapping, a
single 10-pole catheter with 2-5-2 mm inter-electrode spacing (Biosense-Webster or Daig
Electrophysiology) was inserted via trans-septal puncture. This catheter was stabilized
with the use of a long sheath (Preface, Biosense-Webster) and sequentially positioned as
follows along (Figure 1): (i) LA-roof; (ii) inferior-LA; (iii) mid-posterior-LA; and (iv)
LA-appendage.
Surface-ECG and bipolar endocardial electrograms were continuously monitored
and stored on a computer-based digital amplifier/recorder system for off-line analysis
(Bard Electrophysiology). Intracardiac electrograms were filtered from 30-500 Hz, and
measured with computer-assisted calipers at a sweep speed of 200 mm/s.
Effective Refractoriness
Atrial effective refractory period (ERP) was evaluated at twice diastolic-threshold
at cycle lengths (CL) of 600 and 450 ms using an 8-beat drive followed by an extra-
stimulus (S2), starting with an S2 coupling interval of 150 ms increasing in 10 ms
increments. ERP was defined as the longest coupling interval failing to propagate to the

7
atrium. At each site the ERP was measured 3 times during each CL and averaged. If ERP
varied by >10ms an additional 2 measurements were made and the total number
averaged. ERP was measured from the following sites: (i) distal-CS; (ii) proximal-CS;
(iii) low-LRA; (iv) high-LRA; (v) high-SRA; (vi) LA-appendage; (vii) posterior-LA;
(viii) RSPV-LA-roof junction; (ix) LSPV-LA-roof junction; and (x) inferior-LA. The
heterogeneity of ERP was determined using the Coefficient of variation (CoV = SD/mean
x 100%).
Atrial Conduction
Local conduction time was assessed along linearly placed catheters by pacing the
distal bipole (1/2) and determining the conduction time to proximal bipole (9/10) at the
LA roof, inferior LA, CS and LRA. Conduction time at each site was averaged over 10
beats during stable capture at CLs of 600 and 450 ms.
P-wave duration (PWD) was averaged over 10 beats as a surrogate marker of
inter-atrial conduction time and measured on lead II of the surface-ECG.
Site-Specific Conduction
Anatomically determined site-specific conduction delay at the CT was determined
during the drive (at 600 and 450 ms) and the shortest coupled conducted extrastimulus
from each pacing site. Conduction delay at the CT was analyzed on each recording bipole
of the crista catheter and defined as the presence of discrete double potentials (DP)
separated by an isoelectric interval or fractionated signals (FS) of ≥50 ms; both the
number of bipoles demonstrating conduction delay and the maximum electrogram
duration were evaluated.

8
Sinus Node Function
The corrected sinus node recovery time (CSNRT) was assessed at CLs of 600 and
450 ms after a 30 second pacing train. The CSNRT was repeated three times at each CL
and averaged.
Inducibility of Atrial Fibrillation
Atrial vulnerability to develop AF by single extra-stimulus was noted during ERP
determination. AF was defined as irregular atrial activity lasting >30 seconds. AF lasting
>5 minutes was considered sustained; when this occurred, no further data was acquired.
Electroanatomic Mapping
Electroanatomic maps were created of both atria during sinus rhythm using the
CARTO mapping system (Biosense-Webster). The electroanatomic mapping system has
been previously described in detail; the accuracy of the sensor position has been
previously validated and is 0.8 mm and 5 degrees.7 In brief, the system records the 12-
lead ECG and bipolar electrograms filtered at 30-400 Hz from the mapping and reference
catheters.
Endocardial contact during point acquisition was facilitated by fluoroscopy, the
catheter icon on the CARTO system, and ICE. Points were acquired in the auto-freeze
mode if the stability criteria in space (≤6 mm) and local activation time (LAT; ≤5 ms)
were met. Mapping was performed using a fill-threshold of 15 mm. Editing of points was
performed off-line. LAT was manually annotated to the peak of the largest amplitude
deflection on bipolar electrograms. In the presence of DPs, the LAT was annotated at the
largest potential. If the bipolar electrogram displayed equivalent maximum positive and
negative deflections, the maximum negative deflection on the simultaneously acquired

9
unipolar electrogram was used to annotate the LAT. Points not conforming to the 12-lead
ECG P-wave morphology or <75% of the maximum voltage of the preceding
electrogram were excluded. Regional atrial bipolar voltage and conduction velocity were
analyzed as previously described and are detailed below.8
Voltage Analysis
For the purposes of evaluating regional voltage differences, each atrium was
segmented using previously validated offline software.9 The RA was segmented as the
high- and low-LRA, high- and low-posterior-RA, high- and low-SRA, and anterior RA.
The LA was segmented as posterior-LA, LA-roof, anterior-LA, septal-LA, inferior-LA,
and lateral-LA. For each region and each atrium the mean voltage was determined by
averaging the bipolar voltage of the points within the given region.
For the purposes of the voltage map, electrically silent areas (scar) were defined
as the absence of recordable activity or a bipolar voltage amplitude ≤0.05 mV (the noise
level of the system) and low voltage areas as contiguous areas of bipolar voltage ≤0.5mV.
The voltage contribution of each point to the surface area of the atria was determined
using previously validated offline software.9
Conduction Velocity Analysis
Isochronal activation maps (5 ms intervals) of the atria were created and regional
conduction velocity determined in the direction of the wave-front propagation (least
isochronal crowding).9 The system determines the conduction velocity between two
points by expressing the distance between the points as a function of the difference in
LAT. For the purposes of evaluating regional conduction differences, each atrium was

10
segmented as above. The CoV determined heterogeneity of conduction velocity between
regions.
The proportion of points demonstrating delayed conduction was determined using
the following definitions: (i) Fractionated signals (FS) - complex activity of ≥50 ms
duration; and (ii) Double potentials (DP) - potentials separated by an isoelectric interval
of ≥50 ms.
Statistical Analysis
All variables are reported as mean±SD and assessed for normality utilizing the
Shapiro-Wilk test. Data that were normally distributed were compared using the paired or
unpaired Student’s t-test. Data that were not normally distributed were compared using
the Wilcoxon Signed-Rank or Rank-Sum tests, for paired and unpaired data respectively.
Group data was analyzed using ANOVA and post-hoc Fisher’s LSD test. Categorical
variables are reported as number and percentage, and compared using the Fisher’s exact
test. Statistical significance was established at p<0.05.
RESULTS
Patient Characteristics
The two groups were age-matched with comparable left ventricular function
(Table 1). Patients with MS had a mitral valve area of 0.9±0.1 cm2 associated with a
mitral valve gradient of 17.3±7.0 mmHg. This was associated with significant LA
enlargement (p<0.0001) and increased LA pressure (p<0.0001) compared to controls. In
addition, these patients demonstrated higher pulmonary artery pressures (p=0.0002)
compared to controls.

11
Prolongation of Atrial Refractoriness
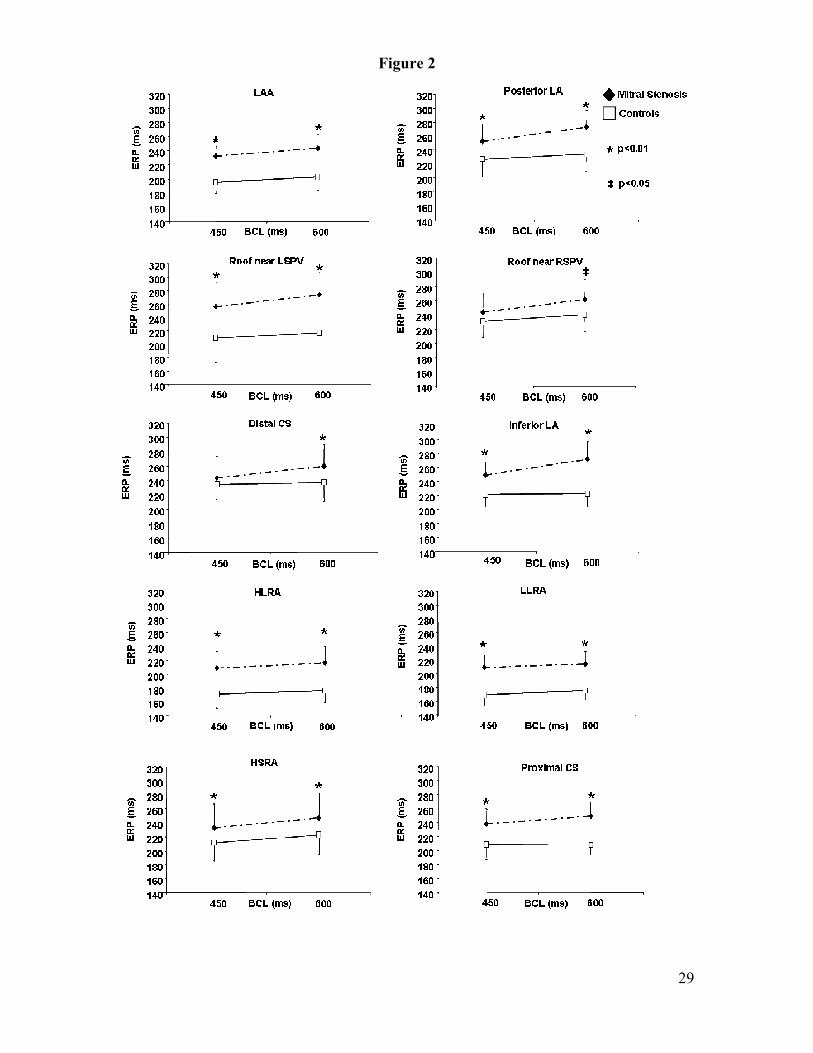
At all 10 sites in both atria and at each CL, ERP was prolonged in patients with
MS compared to controls (Figure 2); at a CL of 600 ms (p<0.0001) and at a CL of 450
ms (p<0.0001). This difference did not reach significance only with a CL of 450 ms at the
RSPV-LA-roof junction and the distal CS. The prolongation of ERP in patients with MS
was associated with no change in the heterogeneity of ERP (LA 8.5±2.3% versus
9.9±2.9%, p=0.2; RA 11.1±3% versus 13.2±4.4%, p=0.2) and with preservation of
physiological rate-adaptation of ERP.
Prolongation of Atrial Conduction Time
The atrial conduction time was significantly prolonged within the LA in patients
with MS compared to controls at 600ms (p<0.0001) and at 450 ms (p=0.0001); at the
inferior-LA (at 600 ms, 47.9±5.0ms versus 33.8±8.6 ms, p=0.0001; and at 450 ms,
49.6±6.0 ms versus 33.7±5.2 ms, p=0.0002) and at the LA-roof (at 600 ms, 41.6±11.9 ms
versus 36.0±6.3 ms, p=0.3; and at 450 ms, 41.7±12.2 ms versus 35.0±6.5 ms, p=0.2).
However, there was no significant difference in conduction time within the CS (at 600
ms, 33.7±12.1 ms versus 33.9±5.2 ms, p=0.5; and at 450 ms, 34.8±12.6 ms versus
35.2±4.8 ms, p=0.5) or the LRA (at 600 ms, 38.1±7.4 ms versus 35.7±4.7ms, p=0.6; and
at 450 ms, 37.9±7.4 ms versus 36.4±5.1 ms, p=0.5).
The PWD was significantly prolonged in patients with MS compared to controls;
139.6±22.4 ms versus 107.8±13.1 ms (p=0.0007).
Site-Specific Conduction Abnormalities
Patients with MS demonstrated significantly greater conduction abnormalities
along the CT compared to controls; with a greater number of bipoles demonstrating

12
DP/FS (at 600 ms, p<0.0001 and with S2 p<0.0001; at 450 ms, p<0.0001 and with S2
p<0.0001) and longer electrogram duration (at 600 ms, p<0.0001 and with S2 p=0.0001;
at 450 ms, p<0.0001 and with S2 p<0.0001) compared to controls (Figure 3). These
abnormalities were observed both during constant pacing and increased further with
extra-stimulus; at 600ms (p=0.0002) and at 450 ms (p=0.0005) for number, and at 600ms
(p<0.0001) and at 450 ms (p<0.0001) for duration. This data highlights the functional
nature of the conduction delay at the CT evidenced by the variation of the extent of
conduction abnormalities by rate and site of stimulation.
Sinus Node Function
The CSNRT was prolonged in patients with MS compared to controls; at 600 ms,
281±101 ms versus 229±92 ms (p=0.4) and at 450 ms, 361±78 ms versus 277±55 ms
(p=0.01), respectively.
Vulnerability for Atrial Fibrillation
Patients with MS developed AF more frequently during electrophysiological
study than controls: 5/12 versus 0/12 (p=0.02). In 3 of these patients AF became
sustained requiring cardioversion.
Electroanatomic Mapping
The mean number of points taken to create maps of the RA was 112±29 and the
LA was 119±32 and was comparable in both groups.

13
Structural and Voltage Abnormalities
The LA volume was significantly greater in patients with MS compared to
controls; 136±46 mls versus 86±29 mls (p=0.005). In contrast, there was no difference in
the RA volume; 74±23 mls versus 69±12 mls (p=0.5). Indeed, in patients with MS, the
marked enlargement of the LA resulted in significant compression of the RA as
demonstrated in Figure 4.
The mean bipolar voltage was reduced in both the LA and RA of patients with
MS compared to controls; LA 1.8±0.6 versus 3.6±0.6 mV (p<0.0001) and RA, 1.9±0.6
versus 3.3±0.5 mV (p<0.0001; Figure 5), respectively. This decrease in voltage persisted
in each region evaluated in the LA (p<0.0001) and RA (p<0.0001; Figure 6). Figure 7
further explores the differences in voltage between the groups demonstrating the surface
area represented by each voltage category. Both atria in patients with MS demonstrated a
greater percentage of the area below 1.5 mV than their age-matched controls; this was
observed to a greater extent in the LA than in the RA. In addition, 8 of the 12 patients
with MS (67%) compared to none of the controls had regions of electrical silence (scar;
p=0.001). Areas of electrical silence in the LA were localized to posterior wall adjacent
to the PVs in 3, anterior-LA in 3 and septal-LA in 1; while in the RA it was localized to
the LRA.
Abnormalities in Conduction Velocity
The total atrial activation time was significantly prolonged in patients with MS
compared to controls (180±36 ms versus 154±18 ms, respectively; p=0.04). This was
associated with significantly slower conduction in patients with MS compared to controls
in both the LA (1.3±0.3 versus 1.7±0.4 mm/ms, respectively; p=0.01) and the RA
(1.0±0.1 versus 1.6±0.3 mm/ms, respectively; p<0.0001). Slower conduction velocity

14
was observed in each region evaluated in the LA (p=0.0006) and RA (p<0.0001) in
patients with MS compared to controls (Figure 8), being statistically significant along the
lateral-LA and LA-roof and most of the RA (except the high-SRA). There was no
difference in the heterogeneity of conduction in the LA between patients with MS and
controls (31±14% versus 42±19%, respectively; p=0.1), however, it was significantly
different in the RA (24±7% versus 36±14%, respectively; p=0.03).
Patients with MS demonstrated a significantly greater number of points with DP
or FS than controls: in the LA this represented 30±10% versus 13±9% of points
respectively (p=0.0005) and in the RA this represented 46±24% versus 10±9% of points
respectively (p<0.0001). These points with DP or FS were distributed throughout the
atria with a clustering along the crista terminalis in the RA and the anterior wall and roof
in the LA. This clustering was consistent with regions of site-specific conduction
abnormalities such as the crista terminalis or in proximity/association with regions of low
voltage and scarring.
DISCUSSION
Major Findings
This study presents new information on the nature of the electrophysiological and
electroanatomical abnormalities within the atria in patients with rheumatic mitral
stenosis. It provides unique characterization of the abnormalities within both the left and
right atria compared to age-matched controls.
First, it demonstrates structural abnormalities characterized by left atrial dilatation
and areas of low voltage and electrical silence suggesting the loss of atrial myocardium.

15
Second, this was associated with conduction abnormalities within the atria
characterized by regions of double potentials, fractionated electrograms, prolonged
conduction times and P-wave duration, and site-specific conduction delay.
Third, patients with mitral stenosis demonstrated a uniform increase in ERP,
which is consistent with prior studies evaluating clinical substrates for AF but in contrast
to the remodeling attributed to AF itself.
Fourth, potentially as a consequence of these abnormalities, patients with MS
developed AF more frequently.
Importantly, while these abnormalities were observed within both atria, their
extent was greater in the LA than the RA. Thus, the present study suggests that the
substrate for AF in patients with MS is related to the structural abnormalities and the
associated widespread and site-specific conduction abnormalities.
Atrial Remodeling in Conditions Predisposed to Atrial Fibrillation
Several experimental studies have evaluated substrates predisposing to AF. Li et
al evaluated the effects on atrial remodeling in a canine model of congestive heart
failure.10 This study demonstrated "atrial remodeling of a different sort" to that seen due
to AF alone. There was no change in ERP at longer CLs. However there was a significant
increase in ERP at shorter CLs associated with an increase in the heterogeneity of
conduction and marked interstitial fibrosis. As a result of these abnormalities in
conduction and atrial structure, these animals demonstrated a significant increase in the
duration of AF despite the increase in ERP. Verheule et al have presented similar
findings in a canine model of mitral regurgitation.11 These investigators also observed an
increase in ERP but a propensity for AF was presumed to be due to the observed
abnormalities in conduction and profound structural remodeling.11 Boyden et al studied

16
23 dogs with spontaneous mitral valve fibrosis and left atrial enlargement (13 with
intermittent and 10 with chronic AF).12 These animals demonstrated no difference in the
action potential duration, but it was noted that there were reduced numbers of muscle cell
layers and an unusually large amount of connective tissue between greatly hypertrophied
cells. All these studies have provided evidence arguing that the predominant contributor
to the substrate for AF may be the structural abnormalities rather than the changes in
ERP.
Clinical studies of the AF substrate have also demonstrated similar observations.
Morton et al studied the RA substrate in patients with atrial septal defects and observed
prolonged ERPs and delayed conduction across the CT compared to controls.13 Similarly,
evaluation of the RA substrate in patients with congestive heart failure and sinus node
disease have demonstrated prolonged ERPs and conduction times, and conduction delay
at the CT associated with areas of low bipolar voltage and electrical silence or scar.8, 14
Recent studies in patients with AF undergoing ablation have also suggested the presence
of areas of low voltage and scar, and have implicated this substrate as a marker of a
worse outcome after a strategy of pulmonary vein isolation alone.15, 16
The present study is the only one to date that has evaluated the abnormalities in
both the LA and RA in any clinical substrate predisposing to AF. In these patients with
MS, we have observed an increase in ERP in both the LA and RA, widespread and site-
specific conduction delay which was more profound in the LA than the RA, and
structural change in the form of LA dilatation, evidence of loss of atrial myocardium and
areas of electrical scar. In addition, these patients more frequently developed AF.

17
Prior Studies on Atrial Remodeling in Mitral Stenosis
Fan et al performed electrophysiological evaluation of the RA in 31 patients with
MS at the time of PBMC.17 Of these 19 were in chronic AF and 12 in sinus rhythm at the
time of the procedure. Following cardioversion of AF, these patients were found to
demonstrate significantly shorter ERPs, sinus node dysfunction and no significant
difference in atrial conduction delay to extra-stimuli compared to patients in sinus
rhythm. At repeat study 3 months following PBMC the ERPs had increased significantly
compared to those who were in sinus rhythm. Soylu et al evaluated the RA ERPs before
and after PBMC in 25 patients with MS in sinus rhythm.18 This study observed an acute
increase in ERP immediately after PBMC. However, neither of these studies included a
normal control group to determine the effects of MS independent of the effects of the
arrhythmia itself or provided LA data. With the exception of these two studies, there has
been no evaluation of the electrophysiological properties of the atrium in patients with
MS.
Atrial Structural Changes in Mitral Stenosis
Structural change and its electrophysiological consequences are emerging as
important determinants of atrial arrhythmias.19, 20 While these changes may be a
consequence of atrial arrhythmias,21 they may also occur as a result of a primary
structural abnormality. Changes in cellular coupling due to interstitial fibrosis may result
in spatial non-uniformity of propagation that can contribute to local conduction block and
re-entry even in small regions of atrial tissue.22
In rheumatic MS a number of factors could result in structural abnormalities. It
may be expected that in patients with rheumatic heart disease the primary disease process
18
could potentially have a direct myocardial effect and that the mechanical consequences of
the valvular disease may contribute to forming the substrate for AF. Several studies have
documented the occurrence of ultrastructural changes resulting in fibrosis in the atria of
patients with rheumatic MS.23, 24 A pathognomonic feature of rheumatic carditis is the
Aschoff bodies; areas of fibrinoid necrosis surrounded by inflammatory cells.25 Such
inflammatory tissue can arise during the acute episode of carditis and remain
immunologically active for years. They have been associated with the local release of a
variety of cytokines, including many that are implicated in fibrogenesis.26 Several other
immunoactive cytokines have also been observed to be increased in plasma in patients
with RHD.27 In addition, recent studies have suggested remodeling of the matrix
metalloproteinases as a result of mitral valve disease.28
In the present study, in patients with MS both the LA and RA demonstrated
significant reduction of bipolar voltage and some had evidence of areas of electrical scar.
These changes were associated with the electrograms demonstrating DP and FS that
result in inhomogeneous conduction, a necessary prerequisite for reentry.
Study Limitations
To control for the potential of arrhythmia related remodeling of the atria, this
study necessarily excluded patients with prior atrial arrhythmia. Thus, whether the
electrophysiological abnormalities observed in patients with MS in this study are
responsible for the propensity for clinical AF remains speculative.
Conclusion
This study demonstrates that patients with rheumatic MS have significant bi-atrial
remodeling characterized by atrial enlargement, loss of myocardium, and areas of

19
electrical scarring that result in widespread and site-specific conduction abnormalities
and increased refractoriness. These abnormalities were associated with a heightened
vulnerability for AF and may in part be responsible for the propensity for AF in patients
with MS.

20
CONFLICT OF INTEREST
Dr Sanders reports having served on the advisory board of and having received lecture
fees and research funding from Biosense-Webster, Bard Electrophysiology and St Jude
Medical.
ACKNOWLEDGEMENT OF SUPPORT
Dr John is supported by the Biosense-Webster Electrophysiology Scholarship from the
University of Adelaide. Dr Stiles is supported by the National Heart Foundation of New
Zealand and the Dawes Scholarship from the Royal Adelaide Hospital. Dr Mackenzie is
supported by the Peter Doherty Fellowship from the National Health and Medical
Research Council of Australia. Dr Sanders is supported by the National Heart Foundation
of Australia.

21
REFERENCES
(1) Agarwal BL. Rheumatic heart disease unabated in developing countries. Lancet
1981; 2:910-911.
(2) Carapetis JR, Steer AC, Mulholand EK, Weber M. The global burden of group A
streptococcal diseases. Lancet Infect Dis 2005; 5: 685-694
(3) Benjamin EJ, Levy D, Vaziri SM, D'Agostino RB, Belanger AJ, Wolf PA.
Independent risk factors for atrial fibrillation in a population-based cohort. The
Framingham Heart Study. JAMA 1994; 271:840-844.
(4) Selzer A, Cohn KE. Natural history of mitral stenosis: a review. Circulation 1972;
45:878-90.
(5) Wolf PA, Dawber TR, Thomas HE, Jr., Kannel WB. Epidemiologic assessment of
chronic atrial fibrillation and risk of stroke: the Framingham study. Neurology
1978; 28:973-977.
(6) Joseph G, Chandy S, George P, George O, John B, Jose V, Pati P. Evaluation of a
simplified transeptal mitral valvuloplasty technique using over-the-wire single
balloons and complementary femoral and jugular venous approaches in 1,407
consecutive patients. Journal of Invasive Cardiology 2005; 17:132-138.
(7) Gepstein L, Hayam G, Ben Haim SA. A novel method for nonfluoroscopic
catheter-based electroanatomical mapping of the heart. In vitro and in vivo
accuracy results. Circulation 1997; 95:1611-1622.
(8) Sanders P, Morton JB, Davidson NC, Spence SJ, Vohra JK, Sparks PB, Kalman
JM. Electrical remodeling of the atria in congestive heart failure:
electrophysiological and electroanatomic mapping in humans. Circulation 2003;
108:1461-1469.

22
(9) Kuklik P, Szumowski L, Zebrowski JJ, Walczak F. The reconstruction and
analysis of the interior surface of the heart chamber from a set of points. Physiol
Meas 2004; 25:617-627.
(10) Li D, Fareh S, Leung TK, Nattel S. Promotion of atrial fibrillation by heart failure
in dogs: atrial remodeling of a different sort. Circulation 1999; 100:87-95.
(11) Verheule S, Wilson E, Everett T, Shanbhag S, Golden C, Olgin J. Alterations in
atrial electrophysiology and tissue structure in a canine model of chronic atrial
dilatation due to mitral regurgitation. Circulation 2003 May 27;107:2615-2622.
(12) Boyden PA, Tilley LP, Pham TD, Liu SK, Fenoglic JJ, Jr., Wit AL. Effects of left
atrial enlargement on atrial transmembrane potentials and structure in dogs with
mitral valve fibrosis. Am J Cardiol 1982;49:1896-1908.
(13) Morton JB, Sanders P, Vohra JK, Sparks PB, Morgan JG, Spence SJ, Grigg LE,
Kalman JM. Effect of chronic right atrial stretch on atrial electrical remodeling in
patients with an atrial septal defect. Circulation 2003; 107:1775-1782.
(14) Sanders P, Morton JB, Kistler PM, , Spence SJ, Davidson NC, Hussin A, Vohra
JK, Sparks PB, Kalman JM. Electrophysiological and electroanatomic
characterization of the atria in sinus node disease. Evidence of diffuse atrial
remodeling. Circulation 2004; 109: 1514-1522
(15) Marcus GM, Yang Y, Varosy PD, Ordovas K, Tseng ZH, Badhwar N, Lee BK,
Lee RJ, Scheinman MM, Olgin JE. Regional left atrial voltage in patients with
atrial fibrillation. Heart Rhythm 2007; 4:138-144.
(16) Verma A, Wazni OM, Marrouche NF, Martin DO, Kilicaslan F, Minor S,
Schweikert RA, Saliba W, Cummings J, Burkhardt JD, Bhargava M, Belden WA,
bdul-Karim A, Natale A. Pre-existent left atrial scarring in patients undergoing

23
pulmonary vein antrum isolation: an independent predictor of procedural failure. J
Am Coll Cardiol 2005; 45:285-292.
(17) Fan K, Lee KL, Chow WH, Chau E, Lau CP. Internal cardioversion of chronic
atrial fibrillation during percutaneous mitral commissurotomy: insight into
reversal of chronic stretch-induced atrial remodeling. Circulation 2002; 105:2746-
52.
(18) Soylu M, Demir AD, Ozdemir O, Topaloglu S, Aras D, Duru E, Sasmaz A,
Korkmaz S. Evaluation of atrial refractoriness immediately after percutaneous
mitral balloon commissurotomy in patients with mitral stenosis and sinus rhythm.
Am Heart J 2004; 147:741-745.
(19) Jais P, Shah DC, Haissaguerre M, Hocini M, Peng JT, Takahashi A, Garrigue S,
Le MP, Clementy J. Mapping and ablation of left atrial flutters. Circulation 2000;
101:2928-2934.
(20) Kall JG, Rubenstein DS, Kopp DE, Burke MC, Verdino RJ, Lin AC, Johnson CT,
Cooke PA, Wang ZG, Fumo M, Wilber DJ. Atypical atrial flutter originating in
the right atrial free wall. Circulation 2000; 101:270-279.
(21) Ausma J, Wijffels M, Thone F, Wouters L, Allessie M, Borgers M. Structural
changes of atrial myocardium due to sustained atrial fibrillation in the goat.
Circulation 1997; 96:3157-63.
(22) Spach MS, Dolber PC. Relating extracellular potentials and their derivatives to
anisotropic propagation at a microscopic level in human cardiac muscle. Evidence
for electrical uncoupling of side-to-side fiber connections with increasing age.
Circ Res 1986; 58:356-371.
(23) Thiedemann KU, Ferrans VJ. Left atrial ultrastructure in mitral valvular disease.
Am J Pathol 1977; 89:575-604.

24
(24) Pham TD, Fenoglio JJ, Jr. Right atrial ultrastructural in chronic rheumatic heart
disease. Int J Cardiol 1982; 1:289-304.
(25) Ruebner BH, Boitnott JK. The frequency of Aschoff bodies in atrial appendages
of patients with mitral stenosis. Relationship to age, atrial thrombosis, and season.
Circulation 1961; 23:550-561.
(26) Fraser WJ, Haffejee Z, Jankelow D, Wadee A, Cooper K. Rheumatic Aschoff
nodules revisited. II: Cytokine expression corroborates recently proposed
sequential stages. Histopathology 1997; 31:460-464.
(27) Yamamoto K, Ikeda U, Mito H, Fujikawa H, Sekiguchi H, Shimada K.
Endothelin production in pulmonary circulation of patients with mitral stenosis.
Circulation 1994; 89:2093-2098.
(28) Anne W, Willems R, Roskams T, Sergeant P, Herijgers P, Holemans P, Ector H,
Heidbuchel H. Matrix metalloproteinases and atrial remodeling in patients with
mitral valve disease and atrial fibrillation. Cardiovasc Res 2005; 67:655-666.

25
Table 1: Patient Characteristics
Mitral Stenosis (n=24)
Control (n=24)
P-Value
Age (years) 31.5±8.6 36.2±12.0 0.1
Left Atrial size Longitudinal (mm) Transverse (mm) Volume (mls)
56.2±5.6 50.1±3.9 77.8±14.3
43.7±4.7 31.5±5.1 24.5±4.3
<0.0001 <0.0001 <0.0001
Right Atrial size Longitudinal (mm) Transverse (mm) Volume (mls)
46.6±2.6 26.7±3.1 18.4±8.4
41.3±5.2 31.1±3.1 21.2±5.9
0.8
0.004 0.3
LV ejection fraction (%) 62.8±9.4 65.3±8.2 0.5
LV size (mm) LV end diastolic diameter LV end systolic diameter
40.5±7.2 27.8±5.1
45.6±6.7 28.5±4.2
0.03 0.6
Pressures (mmHg) Left Atrial Pulmonary Artery
24.0±7.6 39.3±15.6
7.0±5.2 17.9±8.7
<0.0001 0.0002

26
FIGURE LEGEND
Figure 1: Fluoroscopic images demonstrating the catheter position for the study protocol.
Each set of panels demonstrates the left anterior oblique (LAO) and anterior-posterior
(AP) projections. The right sided catheters are positioned along the LRA, crista
terminalis, His and the coronary sinus. A single 10-pole catheter in the LA is seen
sequentially positioned at the LA-roof (left panel) and the inferior-LA along the posterior
mitral annulus (right panel).
Figure 2: ERP at CL of 600 and 450 ms in patients with MS and controls at each of the
10 sites evaluated. At each site and at each cycle length the ERP was prolonged in
patients with MS compared to controls.
Figure 3: Number (left) and duration (right) of double potentials or fractionated
electrograms along the crista terminalis during constant pacing at a CL of 600 ms (S1)
and with the earliest captured extra-stimulus (S2). The information presented is from
pacing sites at the LA-appendage (LAA), inferior-LA, low-lateral-RA (LLRA) and the
high-lateral-RA (HLRA).
Figure 4: Electroanatomic map of a patient with MS. Shown is the posterior anterior
projections of both atria. Note the markedly enlarged LA (172 mls) resulted in significant
deforming and compression of the RA (67 mls). In this extreme example observed in our
series, both atria demonstrate extensive regions of low voltage (red) associated with
regions of scar (grey).
Figure 5: Electroanatomic bipolar voltage map of a patient with MS (left) and a
representative age-matched control (right). Both atria are oriented in the posterior-
anterior projection and are of similar scale. The color scale is identical in both images
with red representing low voltage areas (≤0.5 mV) and purple being voltages ≥5 mV. The
patient with MS (left image; LA 120 mls, RA 58 mls) has a much larger atria that the

27
control patient (LA 80 mls, RA 100 mls). In addition to having greater regions of low
voltage (red), the patient with MS has regions of spontaneous scar (grey), and evidence of
conduction abnormalities in the form of fractionated signals (FS; pink tags) and double
potentials (DS; blue tags).
Figure 6: Regional differences in bipolar voltage between patients with MS and controls
for the RA (left panel) and the LA (right panel). Each region is as described in the text.
Figure 7: Voltage in relation to percentage of the total surface area between patients with
MS and controls for the RA (left panel) and the LA (right panel). The area of voltage
<1.5 mV is greater in both LA and RA in patients with MS compared to controls.
Figure 8: Regional differences in conduction velocity between patients with MS and
controls for the RA (left panel) and the LA (right panel). Each region is as described in
the text.

28
Figure 1
29
Figure 2

30
Figure 3

31
Figure 4

32
Figure 5

33
Figure 6
=

34
Figure 7

35
Figure 8


![[Guidelines] | Rheumatic Fever New Zealand - RHD Action |](https://static.fdokumen.com/doc/165x107/6328f1eb2dd4b030ca0c5afa/guidelines-rheumatic-fever-new-zealand-rhd-action-.jpg)