Electrical and Thermal Transport Properties of M2AlC, where M = Ti, Cr, Nb and V
23
1 Electrical and Thermal Transport Properties of M 2 AlC, where M = Ti, Cr, Nb and V J. D. Hettinger*, S. E. Lofland*, P. Finkel * , T. Meehan*, J. Palma*, K. Harrell*, S. Gupta, A. Ganguly, T. El-Raghy and M. W. Barsoum * Department of Physics and Astronomy, Rowan University, Glassboro, NJ 08028 ‡ Department of Materials Engineering, Drexel University, Philadelphia, PA 19104 ‡‡ 3ONE2, Voorhees, NJ Abstract In this paper we report on a systematic investigation, in the 5 to 300 K temperature regime, of the electronic, magneto-transport, thermoelectric, thermal and elastic properties of four M 2 AlC phases: Ti 2 AlC, V 2 AlC, Cr 2 AlC and Nb 2 AlC. The electrical conductivity, Hall coefficient and magnetoresistances are analyzed within a two-band framework assuming a temperature-independent charge carrier concentration. As with other MAX-phase materials, these ternaries are nearly compensated, viz. the densities and mobilities of electrons and holes are almost equal over the temperature regime explored. There is little correlation between the Seebeck and Hall coefficients. With Youngs and shear moduli in the 270 GPa and 120 GPa range, respectively, the phases studied herein are reasonably stiff. With room temperature thermal conductivities in the 25 W/m K range (45 W/m K for V 2 AlC) they are also good thermal conductors. PACS Nos. 72.15.Eb, 72.15.Gd, 71.20.Be *) Current address: Thomson TWW Lancaster R&D Center, Lancaster, PA 17601
-
Upload
independent -
Category
Documents
-
view
4 -
download
0
Transcript of Electrical and Thermal Transport Properties of M2AlC, where M = Ti, Cr, Nb and V

1
Electrical and Thermal Transport Properties of
M2AlC, where M = Ti, Cr, Nb and V
J. D. Hettinger*, S. E. Lofland*, P. Finkel*, T. Meehan*, J. Palma*, K. Harrell*, S. Gupta, A. Ganguly, T. El-Raghy and M. W. Barsoum
* Department of Physics and Astronomy, Rowan University, Glassboro, NJ 08028
‡ Department of Materials Engineering, Drexel University, Philadelphia, PA 19104 ‡‡ 3ONE2, Voorhees, NJ
Abstract
In this paper we report on a systematic investigation, in the 5 to 300 K temperature
regime, of the electronic, magneto-transport, thermoelectric, thermal and elastic
properties of four M2AlC phases: Ti2AlC, V2AlC, Cr2AlC and Nb2AlC. The electrical
conductivity, Hall coefficient and magnetoresistances are analyzed within a two-band
framework assuming a temperature-independent charge carrier concentration. As with
other MAX-phase materials, these ternaries are nearly compensated, viz. the densities and
mobilities of electrons and holes are almost equal over the temperature regime explored.
There is little correlation between the Seebeck and Hall coefficients. With Youngs and
shear moduli in the 270 GPa and 120 GPa range, respectively, the phases studied herein
are reasonably stiff. With room temperature thermal conductivities in the 25 W/m K
range (45 W/m K for V2AlC) they are also good thermal conductors.
PACS Nos. 72.15.Eb, 72.15.Gd, 71.20.Be *) Current address: Thomson TWW Lancaster R&D Center, Lancaster, PA 17601

2
I. INTRODUCTION
Recent interest in an unusual class of 50+ layered ternary carbides and nitrides has
been generated as a result of the densification and characterization of phase-pure samples
with the general chemical formula: Mn+1AXn where n = 1 to 3, M is an early transition
metal, A is an A-group element (mostly IIIA and IVA) and X is either C and or N.1 Most
of these ternaries were first synthesized in powder form more than 35 years ago,2 yet little
was known about their properties until recently. Partially because these materials are
comprised of Mn+1Xn layers interleaved with pure A layers, and partially because of how
they deform they are best described as nanolaminates. As a result of this layered structure
they are readily machinable, despite the fact that some of them are elastically quite stiff,
as well as lightweight.3 They are also excellent electric and thermal conductors.1 When
combined with the low friction coefficients associated with their basal planes,4 and the
excellent oxidation resistances of some of them,5, 6 their potential in applications such as
rotating contacts at elevated temperatures becomes obvious.
To date, by far the most studied of this group of materials is Ti3SiC2.7,8 Some work
has been geared toward understanding the properties of Ti3AlC2 and Ti4AlN39 and, to a
lesser extent, Ti3GeC2.10, 11 Yet much of the interesting physics leading to the properties
of these materials can best be evaluated and understood through systematic investigations
of the materials where the elemental constituents can be varied, while maintaining the
same crystallographic structure. One way to undergo such a systematic study is to
investigate several different phases from the M2AX group of MAX-phase materials. Over
40 M2AX phases are known to exist: they include 11 different A-group elements and 9
different early transition metals. In fact, the structures more extensively studied, M4AX3

3
and M3AX2, are much more of an exception, consisting of only four known compounds.
Recently we reported also on some elastic and electronic properties of some select MAX
phases.12
In this paper - which is a continuation of our efforts in understanding the
chemistry/physical property relationships in these compounds - we report on the 5 to 300
K electrical resistivities, Hall and Seebeck voltages, magnetoresistances, thermal and
elastic properties of the Al-containing phases: Ti2AlC, V2AlC, Cr2AlC and Nb2AlC.
Investigating this series allowed us to look for systematic trends when adding electrons
across three columns of the periodic table (viz. Ti, V, Cr), while also attempting a
comparison between elements in a single column (V and Nb).
II. EXPERIMENTAL DETAILS
Polycrystalline bulk samples of these phases were fabricated by reactively hot
isostatically pressing a stoichiometric mixture of powders of the constituent elements.
Details of the V2AlC and Nb2AlC syntheses are given elsewhere.13,14 The Ti2AlC and
Cr2AlC samples were obtained from 3ONE2, Voorhees, NJ. The latter were made by
pressureless sintering of pre-reacted powders. X-ray diffractometry indicated that the
materials were predominantly phase pure. All samples were greater than 99 % of their
theoretical density.
Polycrystalline parallelepiped shaped specimens with approximate dimensions 1 × 1
× 10 mm3 were cut from the bulk samples. The electrical resistivity ρ, Hall voltage VH,
and magnetoresistance MR = [ρ(B)- ρ(0)]/ρ(0) were measured for temperatures T
ranging between 5 and 300 K and magnetic fields B, up to 9 T with a Quantum Design

4
Physical Properties Measurement System (PPMS). A specially designed sample holder -
with spring-loaded gold-coated contacts - was used to mount the samples for electrical
transport measurements. The voltage sensitivity was roughly 5 nV, and no contact
heating was observed for currents up to 300 mA. Measurements were performed by a
four-probe method to eliminate contact resistance for these low-resistivity materials. This
configuration allowed a simultaneous measurement of the transverse and longitudinal
magnetic-field-dependent voltages. The magnetoresistive component of the measured
voltage and extraction of the Hall signal were achieved by magnetic field reversal and
subtraction of the measured voltages to separate those components even and odd in
magnetic field. Thermal voltages were eliminated from the measured values by use of a
low-frequency ac current technique.
The Seebeck voltages were also measured using the PPMS configured with the
thermal transport option (TTO) from 5 to 300 K in zero magnetic field. The TTO allows
sequential measurements of the thermal conductivity, Seebeck voltage, and electrical
resistivity at each temperature. This measurement was made by attaching four leads, each
with a large thermal conductance, to the sample with conducting silver epoxy. A
temperature gradient was established by applying heat at one end of the specimen while
holding the other end at constant temperature by maintaining good thermal contact with a
low-temperature reservoir. Calibrated Cernox thermometers are attached to the sample
between 4 and 7 mm apart. The temperature difference is monitored and the voltage
measured at the same positions along the sample.
Ultrasonic measurements of elastic moduli were carried out using a RAM 10000
(Ritec) utilizing an echo-pulsed phase-sensitive detection technique for determining the
5
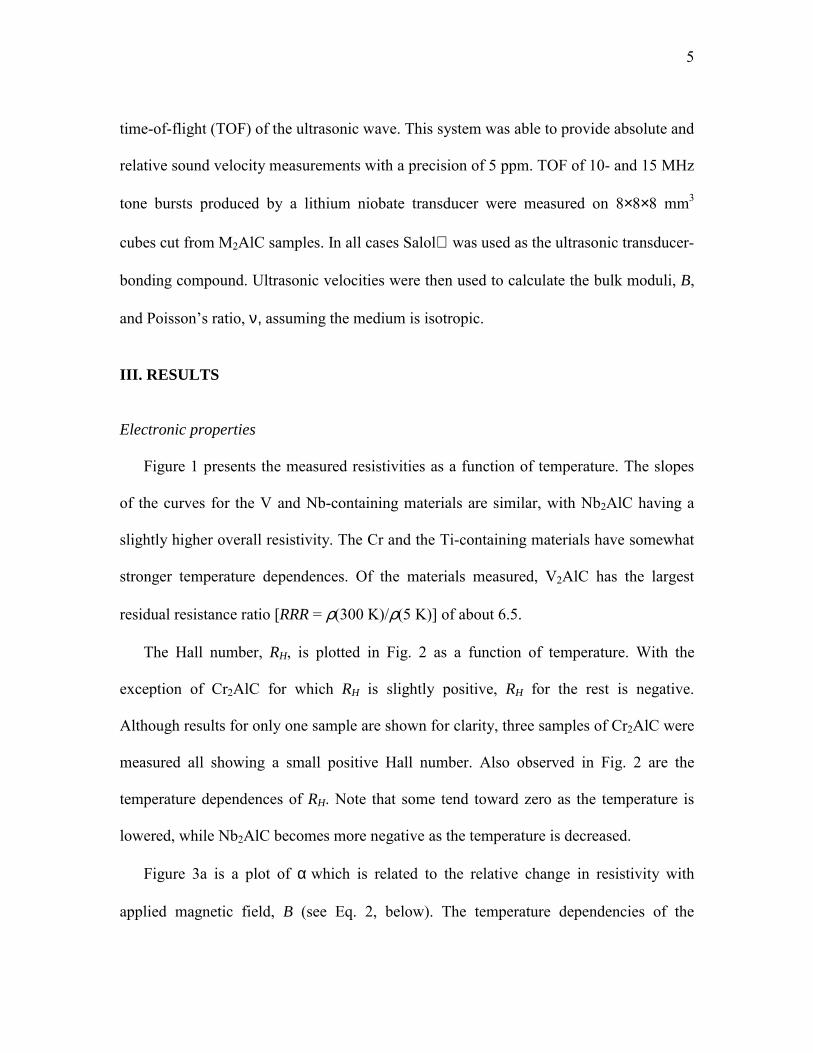
time-of-flight (TOF) of the ultrasonic wave. This system was able to provide absolute and
relative sound velocity measurements with a precision of 5 ppm. TOF of 10- and 15 MHz
tone bursts produced by a lithium niobate transducer were measured on 8×8×8 mm3
cubes cut from M2AlC samples. In all cases Salol was used as the ultrasonic transducer-
bonding compound. Ultrasonic velocities were then used to calculate the bulk moduli, B,
and Poissons ratio, ν, assuming the medium is isotropic.
III. RESULTS
Electronic properties
Figure 1 presents the measured resistivities as a function of temperature. The slopes
of the curves for the V and Nb-containing materials are similar, with Nb2AlC having a
slightly higher overall resistivity. The Cr and the Ti-containing materials have somewhat
stronger temperature dependences. Of the materials measured, V2AlC has the largest
residual resistance ratio [RRR = ρ(300 K)/ρ(5 K)] of about 6.5.
The Hall number, RH, is plotted in Fig. 2 as a function of temperature. With the
exception of Cr2AlC for which RH is slightly positive, RH for the rest is negative.
Although results for only one sample are shown for clarity, three samples of Cr2AlC were
measured all showing a small positive Hall number. Also observed in Fig. 2 are the
temperature dependences of RH. Note that some tend toward zero as the temperature is
lowered, while Nb2AlC becomes more negative as the temperature is decreased.
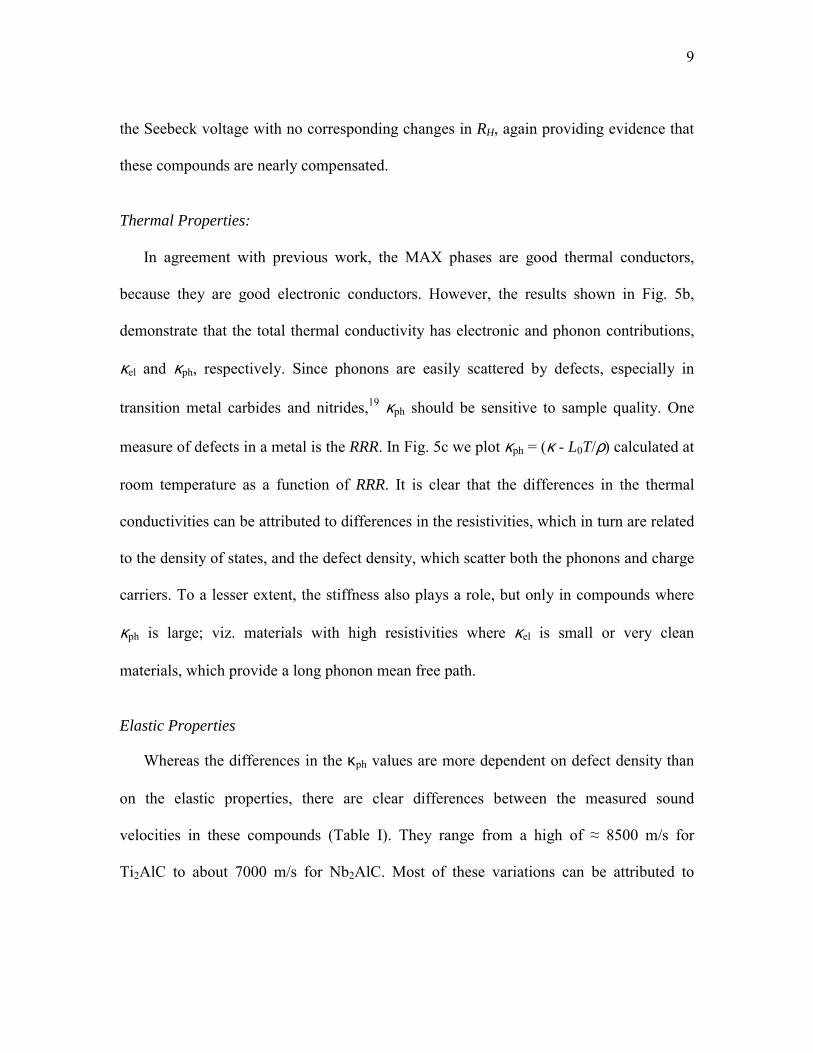
Figure 3a is a plot of α which is related to the relative change in resistivity with
applied magnetic field, B (see Eq. 2, below). The temperature dependencies of the

6
Seebeck voltages are shown in Fig. 4. In general they are low and tend to fluctuate
around zero and change sign with increasing temperatures.
The thermal conductivity results are shown in Fig. 5a. The conductivities rise rapidly
in the 5-100 K temperature range and then tend to plateau. At ≈ 22 W/m K, the room
temperature conductivity κ of Cr2AlC is the lowest measured; at ≈ 48 W/m K, V2AlC is
the highest, with Ti2AlC and Nb2AlC in between. Figure 5b plots the temperature
dependence of the Lorenz number L = ρκ/T. Note that at higher temperatures, the Lorenz
number for Nb2AlC asymptotically approaches the horizontal line drawn at L0 = 2.45 ×
10-8 WΩ/K2, which represents the value of the Lorenz number when the phonon
contribution to the total thermal conductivity is negligible.
IV. DISCUSSION
The resistivities for all materials investigated herein drop linearly with decreasing
temperatures (Fig. 1). This metal-like behavior, characteristic of all MAX phases
explored to date,15,10 results from the large density of states at the Fermi level N(EF) of
these solids.12,16
To shed further light on the mechanisms of electronic conduction in these solids, it is
useful to analyze the magneto- and electro-transport results. A temperature-dependent
Hall number requires at least a two-band model to explain the results. Within a two-band
framework, the expression used to describe the Hall number RH is:
2
22
)()-(
npenp
Rnp
npH µµ
µµ+
= (1)

7
This expression contains four unknowns: µp, µn, p, and n which are the hole and electron
mobilities and the hole and electron concentrations, respectively. To solve completely for
each unknown, three additional constraints are required. In the two-band model the
magnetoresistance ∆ρ/ρ = [ρ(H)-ρ(H=0)/ρ(H=0)] and the electrical conductivity σ are
described by:
22
22
)()(
Bpn
npB
pn
pnpn
µµµµµµ
αρρ
++
==∆ (2)
)(1pn pne µµ
ρσ +== (3)
To solve the problem an additional constraint is required. Given the small Seebeck and
Hall coefficients it is reasonable to choose carrier concentrations that are temperature
independent (a reasonable assumption for metals) and, as important based on previous
work, roughly equal numbers for the densities of the electrons and holes.
Thus solving the above expressions, assuming the n = p, we find that at all
temperatures, for the three materials with negative Hall coefficients, µp ~ 0.8-0.9 µn. In
Cr2AlC, with its positive RH, µp ~1.02 µn. The temperature dependence of RH is imbedded
in the mobility. The required temperature dependent mobilities are shown in Fig. 3b.
The carrier concentrations for Ti2AlC and Cr2AlC are 1.0 × 1027 and 1.2 × 1027 m-3,
respectively; those for V2AlC and Nb2AlC are identical at 2.7 × 1027 m-3. These values
are quite reasonable and are comparable with those determined for the M3AX2
compounds, Ti3SiC2 and Ti3GeC2 (≈ 2.0 × 1027 m-3)10 and Ti3AlC2 (≈ 1.5 to 2 × 1027
m-3).9 Not surprisingly, there is no correlation between n and p and N(EF).12, 18

8
The results to date strongly suggest that the electronic properties of the MAX phases
are dominated by the d orbitals of the M-elements and that these properties are, in turn,
comparable to those of the transition metals. With this in mind, it is thus useful to briefly
summarize what is known about the transition metal electronic transport. According to
Kulikov,17 the resistivity of transition metals can be written in a fashion similar to the
Bloch-Grüneisen by:
)/()(15
5
TTn
ENn
F Θ
ΘΘ∝∝ !
λτ
ρ (4)
where τ is the scattering time, N(EF) the density of states at the Fermi level, λ the
electron-phonon coupling factor, and Θ the Debye temperature. According to Eq. (4) and
assuming Matthieusens rule, µ(Τ=0) ∂ λ(RRR-1)/N(EF) where (RRR-1) relates to the
intrinsic resistivity. Plotting the electronic mobilities at 5 K as a function of
(RRR-1)/N(EF) (Fig. 3c) for the compounds tested in this work, together with previously
reported corresponding values of other MAX phases9,10 we find that there is a linear
relationship, indicating that the electron-phonon coupling is more or less constant for all
materials.
The sign of the Seebeck voltage is often used to qualitatively determine the sign of
the dominant charge carrier. With this in mind, it may be expected that the Seebeck
voltages should roughly reflect the sign and shape of RH as a function of temperature.
Comparing the Hall (Fig. 2) and the Seebeck (Fig. 4) coefficients it is clear there are no
obvious correlations between them. Three of the materials have clearly changing signs of
9
the Seebeck voltage with no corresponding changes in RH, again providing evidence that
these compounds are nearly compensated.
Thermal Properties:
In agreement with previous work, the MAX phases are good thermal conductors,
because they are good electronic conductors. However, the results shown in Fig. 5b,
demonstrate that the total thermal conductivity has electronic and phonon contributions,
κel and κph, respectively. Since phonons are easily scattered by defects, especially in
transition metal carbides and nitrides,19 κph should be sensitive to sample quality. One
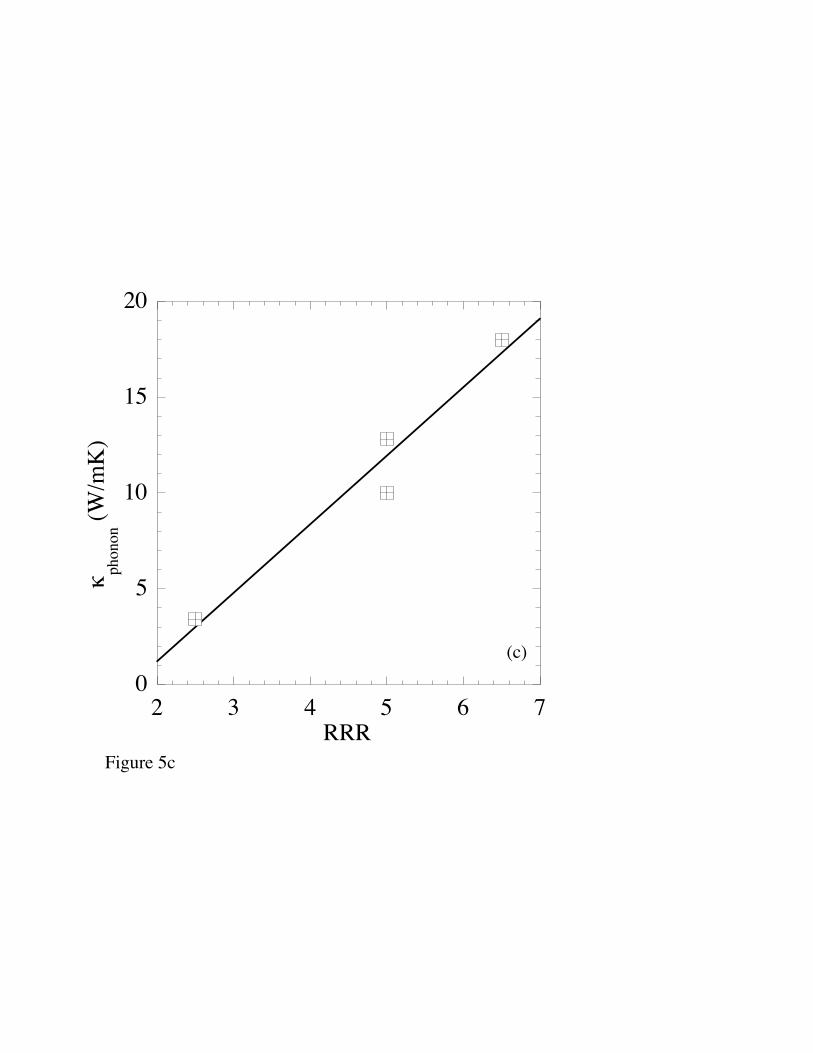
measure of defects in a metal is the RRR. In Fig. 5c we plot κph = (κ - L0T/ρ) calculated at
room temperature as a function of RRR. It is clear that the differences in the thermal
conductivities can be attributed to differences in the resistivities, which in turn are related
to the density of states, and the defect density, which scatter both the phonons and charge
carriers. To a lesser extent, the stiffness also plays a role, but only in compounds where
κph is large; viz. materials with high resistivities where κel is small or very clean
materials, which provide a long phonon mean free path.
Elastic Properties
Whereas the differences in the κph values are more dependent on defect density than
on the elastic properties, there are clear differences between the measured sound
velocities in these compounds (Table I). They range from a high of ≈ 8500 m/s for
Ti2AlC to about 7000 m/s for Nb2AlC. Most of these variations can be attributed to

10
differences in density. The bulk moduli calculated in this work (column 8, Table 1) are
≈ 25 % lower than those recently directly measured in a diamond anvil cell.20
Also included in Table 1 are recent ab initio calculations on the same compounds.
With the notable exception of Cr2AlC, the agreement between the calculated and
measured elastic constants is quite good. This structural destabilization of Cr2AlC was
thus unexpected. It is in line, however, other recent observations. As noted above it is
seen in direct measurements of B.20 It is also manifested in a 7% drop in the energy of the
highest energy Raman vibrational mode involving the motion of the A and M atoms
along the c axis - of Cr2AlC relative to the Ti and V-containing structures. Lastly, at ≈ 12
× 10-6 K-1, the thermal expansion coefficient of Cr2AlC21 is ≈ 50 % higher than that of
either Ti2AlC22 or Nb2AlC.23
V. Conclusions:
By measuring the electrical and thermal conductivities, Hall and Seebeck coefficients
between 5 and 300 K of the Ti, V, Cr and Nb-containing M2AlC phases, we have shown
that, like other MAX phases, the electrical conductivities in these solids is compensated,
with n ≈ p ≈ 2 × 1027 m-3, and µn ≈ µp over the entire temperature range examined.
Examining the mobility at 5 K, it was shown that the electron-phonon coupling of all
studied MAX phases is more or less the same, irrespective of d element or structure. ON
the other hand, the phonon contribution to the total thermal conductivity was shown to be
proportional to the defect concentration. We also measured the longitudinal and shear
velocities of sound in these materials and shown them to be elastically quite stiff.
Acknowledgements

11
Partial support for this work from the National Science Foundation (DMR 0072067)
is gratefully acknowledged. SEL and JDH acknowledge support from the New Jersey
Commission on Higher Education and NSF Grant DMR 0114073.

12
References:
1 M. W. Barsoum, Prog. Solid State Chem 28, 201 (2000).
2 H. Nowotny, Prog. Solid State Chem. 2, 27 (1970).
3 P. Finkel, M. W. Barsoum, and T. El-Raghy, J. Appl. Phys. 87, 1701 (2000).
4 S. Myhra, J. W. B. Summers, and E. H. Kisi, Materials Letters 39, 6 (1999).
5 M. Sundberg, G. Malmqvist, A. Magnusson, et al., Ceramics International 30,
1899 (2004).
6 M. W. Barsoum, L. H. Ho-Duc, M. Radovic, et al., J. Electrochem. Soc. 150,
B166 (2003).
7 H. I. Yoo, M. W. Barsoum, and T. El-Raghy, Nature 407, 581 (2000).
8 M. W. Barsoum, H. I. Yoo, and T. El-Raghy, Phys. Rev. B 62, 10194 (2000).
9 P. Finkel, M. W. Barsoum, J. D. Hettinger, et al., Phys. Rev. B 67, 235108
(2003).
10 P. Finkel, B. Seaman, K. Harrell, et al., Phys. Rev. B, 70, 085104 (2004).
11 A. Ganguly, T. Zhen, and M. W. Barsoum, J. of Alloys and Compounds (2004).
12 S. E. Lofland, J. D. Hettinger, K. Harrell, et al., Appl. Phys. Letts. 84, 508 (2004).
13 S. Gupta and M. W. Barsoum, J. Electrochem. Soc. 151, D24 (2004).
14 I. Salama, T. El-Raghy, and M. W. Barsoum, J. Alloys Compds. 347, 271 (2002).
15 P. Finkel, J. D. Hettinger, S. E. Lofland, et al., Phys. Rev. B 65, 035113 (2001).
16 J. C. Ho, H. H. Hamdeh, M. W. Barsoum, et al., J. Appl. Phys. 86, 3609 (1999).
17 N I Kulikov, J. Phys. F: Met. Phys. 8 L137 (1978).
18 M. K. Drulis, H. Drulis, S. Gupta, et al., (Submitted for pub.).

13
19 W. S. Williams, Prog. Solid State Chem. 6, 57 (1971).
20 B. Manoun, R. Gulve, S. K. Saxena, et al., Submitted for publication.
21 T. El-Raghy, Private Comminucation.
22 M. W. Barsoum, M. Ali, and T. El-Raghy, Met Mater Trans 31A, 1857 (2000).
23 M. W. Barsoum, I. Salama, T. El-Raghy, et al., Metallurgical and Materials
Transactions 33a, 2779 (2002).
24 Z. Sun, S. Li, R. Ahuja, et al., Solid State Communications 129, 589 (2004).

14
Table 1. Youngs, E, shear, G, and bulk B, moduli of the M2AlC phases. B and B* are determined from velocity of sound and directly from diamond anvil cell. Also listed are the longitudinal vl and shear vs sound velocities and Poisson ratio, ν. Θe
D corresponds to the Debye temperature calculated from the mean sound velocity, while ΘD
T to that determined from low temperature heat capacity measurements.
Solid Density
g/cm3 vl
(m/s)
vs (m/s)
G (GPa)
E (GPa)
ν
B (GPa)
B*
(GPa)Θe
D
(K)ΘD
T
(K) N(EF)
(1/eV.unit cell)Refs.
Ti2AlC
Theory
4.1
4.03
8525
9133
5298
5627
118
127
277
305
0.19
0.19
144
166
186a 732
770
672b
619c
4.9b
4.3c This work
Ref. 2424
V2AlC
Theory
4.81
4.81
7989
8863
4913
5087
116
124
277
308
0.20
0.24
152
196
201a 696
731
625b
658c
7.5b
8.0c This work
Ref. 24
Cr2AlC
Theory
5.24
5.24
7215
8939
4450
5255
102
145
245
358
0.20
0.24
138
226
166a 644
774
589b
673c
14.5b
12.9c This work
Ref. 24
Nb2AlC
Theory
6.34
6.34
7125
7573
4306
4329
117
119
286
299
0.21
0.26
165
205
208a 577
585
NA
540c
NA
5.1c This work
Ref. 24 a Ref. 20. 20 b Ref. 18. 18 c Ref. 12. 12

15
Figure Captions:
Figure 1: Temperature dependence of resistivity.
Figure 2: Temperature dependence of Hall coefficients.
Figure 3: a) Semi-log plot of α as a function of temperature for several M2AlC materials.
The parameter α was extracted assuming ∆ρ/ρ(Β=0)= αB2. b) Temperature dependence
of electron (solid symbols) and hole (open symbols) mobilities. c) Mobilities at 4 K
versus (RRR-1)/N(EF). The linear relationship indicates the electron-phonon coupling is
similar in all studied MAX phases.
Figure 4: Plot of Seebeck coefficients as a function of temperature.
Figure 5: a) Temperature dependence thermal conductivities, κ. b) Temperature
dependence of Lorenz number. Note line near 2.5 × 10⁻⁸ WΩ/K2, is theoretical value for
thermal conduction by charge carriers only. c) Phonon conductivity, κph = (κ - L0T/ρ)
versus residual resistivity ratio, indicating that κph is dominated by scattering.

0
0.1
0.2
0.3
0.4
0.5
0.6
0.7
0.8
0 50 100 150 200 250 300
Resit
ivity
(µΩ
m)
Temperature (K)
Nb2AlC
V2AlCTi2AlC
Cr2AlC
Figure 1:

-4 10-10
-3 10-10
-2 10-10
-1 10-10
0 100
1 10-10
2 10-10
0 50 100 150 200 250 300 350
R H (m
3 /C)
Temperature (K)
Ti2AlC
V2AlC
Cr2AlC
Nb2AlC
Figure 2:
10-5
10-4
10-3
0 50 100 150 200 250 300
α (
T-2)
Ti 2AlC
V2AlC
Cr2AlC
Nb2AlC
Temperature (K)
(a)
0
0.01
0.02
0.03
0.04
0.05
0 50 100 150 200 250 300
µ (m
2 /Vs)
Temperature (K)
Ti 2AlC
V2AlC
Cr2AlC
Nb2AlC
(b)

Ti2AlC
V2AlC
0
0.01
0.02
0.03
0.04
0.05
0.06
0 0.5 1 1.5
Ele
ctro
n M
obili
ty (
m2 /V
s)
(RRR - 1)/N(EF)
Ti3SiC
2
Nb2AlC
Cr2AlCTi
3AlC
2
Ti4AlN
3
R2 > 0.95
(c)
Figure 3:

-6
-4
-2
0
2
4
0 50 100 150 200 250 300 350
Seeb
eck
Coe
f. (µ
V/K
)
Temperature (K)
V2AlC
Nb2AlC
Ti2AlC
Cr2AlC
Figure 4.

0
10
20
30
40
50
0 50 100 150 200 250 300
Cond
uctiv
ity (W
/K-m
)
Temperature (K)
(a)
Ti2AlC
V2AlC
Cr2AlC
Nb2AlC
Figure 5a:

0.0 100
1.0 10-8
2.0 10-8
3.0 10-8
4.0 10-8
5.0 10-8
6.0 10-8
0 50 100 150 200 250 300 350
Lore
nz N
umbe
r (WΩ
/K)
Temperature (K)
Cr2AlC
V2AlC
Ti2AlC
Nb2AlC
0
5
10
15
20
2 3 4 5 6 7
κ phon
on (W
/mK
)
RRR
(c)
Figure 5c


![Flux growth and low temperature dielectric relaxation in piezoelectric Pb[(Zn 1/3 Nb 2/3 ) 0.91 Ti 0.09 ]O 3 single crystals](https://static.fdokumen.com/doc/165x107/631a68c3d43f4e1763046f01/flux-growth-and-low-temperature-dielectric-relaxation-in-piezoelectric-pbzn-13.jpg)