Composition dependent structural modulations in transparent poly(vinyl alcohol) hydrogels
1772 J. Mahmoudi et al.: Electrical and Mechanical Characterization of High-density Polyethylene/Ethylene
1070-9878/13/$25.00 © 2013 IEEE
Electrical and Mechanical Characterization of High-density Polyethylene/Ethylene
Vinyl Acetate/Organoclay Nanocomposite
Javad Mahmoudi Sharif University of Technology, Center of Excellence on Control and Management of Power System,
Department of Electrical Engineering, Tehran, Iran
Mostafa Eesaee Sharif University of Technology,
Department of Chemical Engineering, Tehran, Iran
and Mehdi Vakilian Sharif University of Technology, Center of Excellence on Control and Management of Power System,
Faculty of Electrical Department, Tehran, Iran
ABSTRACT A ternary dielectric is made of high density polyethylene (HDPE) and organoclay (OC) nanocomposites, through mixing granuls of ethylene vinyl acetate (EVA). The morphological properties of nanocomposites are examined using X-ray diffraction (XRD) spectra and transmission electron microscopy (TEM) which intercalate/exfoliate morphology of clay particles. It is shown that the electrical and mechanical properties of HDPE/EVA binary blend will be enhanced significantly when OC was treated with EVA compound. The insulation material which is developed in this work can be employed to insulate the adjacent core steel sheets of a high voltage transformer.
Index Terms — High density polyethylene, EVA, OrganoClay nanocomposite, electrical/mechanical properties.
1 INTRODUCTION
POLYMERIC nanocomposites have shown enhanced optical, electrical, dielectric, modulus and strength, barrier, solvent and heat resistant properties and debilitated flammability for application in different industries such as electric machines, electrical and electronics, cabling, etc [1-7]. The polymers have great dielectric properties for insulating materials used in a wide variety of high voltage applications. The lifetime and reliability of electrical distribution systems are highly influenced by the mechanical and electrical strength of their insulation materials. In past decades, polymer/clay nanocomposites have motivated vigorous research to be carried out on polymer industries due to requirement of concurrent dramatic enhancements of their material properties, which resulted in achievement of the goal by the nano-dispersion of clay layers [8-11]. Clay has a layered structure in which rings of six tetrahedral silicones are surrounded by oxygen at its vertices sharing vertices with the octahedral aluminum sharing alternate edges. The sharing of alternate edges
leads to rings of six octahedral aluminum in a ring or an alternative description being that two out of three octahedral sites being occupied by aluminum with the third octahedral site being vacant. The sheets of six-membered silicon tetrahedral are located on both sides of the octahedral aluminum sheet. The gap between two of these triple sheets is called interlayer spacing. Substitution of Al3+ for Si4+ results in a need for charge compensation which is accomplished by an external positive ion such as calcium ion or sodium ion [12-14]. On the basis of the published works on the subject, it is still a challenge to fabricate polyolefin based nanocomposites due to their non-polar backbone. This can be overcome by introducing polar group functionalized polyolefin, such as maleic anhydride grafted polyethylene (MAPE) or polypropylene (MAPP) [15, 16]. It is known that beside MAPE and MAPP, ethylene vinyl acetate (EVA) is commonly used as a compatibilizer for polyolefin and particulate fillers [17, 18]. The use of a polar system, like EVA, in combination with high density polyethylene (HDPE) has another advantage in enhancing the insulation lifetime [19]. It is expected the ternary phase nanocomposites consisting of a HDPE matrix, EVA inclusion and organically-modified clay can be obtained by melt intercalation. Manuscript received on 12 November 2012, in final form 27 June 2013.
IEEE Transactions on Dielectrics and Electrical Insulation Vol. 20, No. 5; October 2013 1773
This paper explores the effect of organoclay (OC) loading on the dielectric properties of a HDPE/EVA blend. There is a great body of publications dealing with the various characterizations of HDPE/EVA blend. For example, Khonakdar et al [20] studied the morphological behavior of low density polyethylene (LDPE) and EVA as well as HDPE/EVA blends. Two phase morphology was observed for both systems and EVA domains were smaller in the LDPE/EVA blend than those in the HDPE/EVA. Furthermore, the mechanical properties of LDPE/EVA blends have been intensively investigated by Takidis et al [21]. They found that the tensile strength (TS) and elongation at break (EB) of the prepared blends lay between the corresponding values of the parent polymers.
Accordingly, several investigations have been devoted to the PE/EVA based nanocomposites. For example, Hui et al [22] studied the mechanical properties of LDPE/EVA nanocomposites filled with silica nanoparticles and showed that high and low strain moduli as well as TS of the prepared nanocomposites were improved over the neat system. The gas barrier properties of HDPE/EVA/OC ternary nanocomposites were highlighted by Dadfar et al. [23]. More recently, Riahinezhad et al [24] investigated the morphology of nanocomposite foams based on LDPE/EVA/OC. They found that OC nanoparticles acted as a nucleating agent and consequently reduced the foam cell sizes. Furthermore, studies have shown that the addition of EVA in nanocomposites of LDPE and HDPE with OCs improved the polymer intercalation into the clay’s platelets [25-26].
The high voltage transformer is an important device in power system. Magnetic core insulation of this element should rise as the voltage level of power grid increases. This requires the procurement of a high voltage dielectric with a ternary nano-composite material. Therefore to evaluate the mechanical and electrical stresses in transformer core insulation, the mechanical and electrical properties of the nano-composite material used should be analyzed. OC particles act as a tenacious part which withstands against treeing phenomena in dielectric and enhance the dielectric strength of material.
In this paper several composition of HDPE/EVA with OC were prepared and tested. At first, morphology and microstructure of nanocomposites were investigated by XRD spectra and TEM. Then the dielectric strength and surface discharge characteristics of nanocomposites materials were compared against HDPE/EVA blends in terms of their electrical parameters. Finally, mechanical properties were also measured to determine the effects of nanoparticles on tensile, flexural and impact characteristics of the samples.
2 EXPERIMENTAL
2.1 MATERIAL
High density polyethylene (HDPE 44005, MFI=0.55 g/10 min, d=0.944 g/cm3) was obtained from Bandar Imam Petrochemical Co., (Iran). Ethylene-vinyl acetate (18% vinyl acetate and MFI=2.85 g/10 min) supplied from the Formosa plastics corporation (Taiwan). Cloisite 30B (quaternary ammonium salt modified montmorillonit, CEC of 90 meq/100 g, spacing of 1.85 nm) was supplied by Southern Clay Co. (United States).
2.2 PREPARATION OF SAMPLES
A series of samples in form of granule, with and without OC, were prepared based on melt mixing method through application of laboratory scale bra-bender, counter-rotating twin screw extruder with L/D of 40. The screw speed was 50 rpm with a barrel temperature range of 145-185 °C. OC was dried at 70 ˚C in a vacuum oven (using a water pump, which was able to develop a vacuum of up to 9.3×10³ Pa for 12 h.
Polymers were fed through main feeder and OC was added via side feeder located at the melting zone of the extruder. The outcome of extrudate was cooled in water, and then granulated by cutter. The polymer weight ratio for both binary blend and ternary nanocomposites were 90/7.5 for HDPE/EVA, 82.5/15 for HDPE/EVA and 67.5/30 for HDPE/EVA. For all ternary nanocomposites, the content of OC was the same, i.e. 2.5 wt% of total polymeric components (weighted). For example, the nanocomposites could be abbreviated as HDPE/EVA/OC 90/7.5/2.5, HDPE/EVA/OC 82.5/15/2.5 and HDPE/EVA/OC 67.5/30/2.5 and some other OC percentages.
2.3 PHYSICAL PROPERTIES AND SIMULATION OF TEST CONDITIONS OF THE SAMPLES
The electrical samples were made from granules prepared in the extruder by Hot Press Molding (HPM). Granules were inserted above lower plate of the mold with 175 °C temperature. After a short duration (of about 5 min) granules were melted homogeneously and pressurized under the upper plate with the temperature of 165 °C to shape the final samples. They were prepared in disk shape with a diameter of 17 cm and a thickness of 2 mm. The lower plate has a higher temperature in order to melt the granules quickly. This temperature difference of the two plates avoids trapping of air in the sample and formation of the bubbles.
The specimens for mechanical and physical tests were prepared by injection molding machine (Weissenburg/Bayern, type mono80, Germany). The tensile test was carried out on dumbbell shaped specimens of dimensions 165 mm × 13 mm × 3 mm. The flexural tests were applied on samples developed from specimens having dimensions of 130 mm × 12.6 mm × 6 mm. The impact strength tests were carried out on samples, the same as those employed in flexural tests, however with a notch angle of 45˚ and a “V” notch depth of 2.54 mm.
2.4 CHARACTERIZATION
X-ray diffraction (XRD) patterns were recorded using a Philips diffractometer (40kV, 40mA, λ=15.4nm, within the 2θ angles of 1˚-10˚ at a scanning rate of 0.04˚/s. Transmission electron microscopy (TEM) was carried out with a Philips CM-200 operating with an acceleration voltage of 200 kV on ultra-thin section of the sample. The sectionalizing of this sample was performed via a diamond knife and was cut using OmU3 microtome (C. Reichert, Austria).
Dielectric strength of new material is measured according to ASTM D149 standard. The average of three readings should be reported. The brass electrode faces are kept parallel and held opposite to each other, precisely. Each sample should be kept between two electrodes, and the breakdown voltage is measured at 25±2 °C. This measurement is performed while the needle-
1774 J. Mahmoudi et al.: Electrical and Mechanical Characterization of High-density Polyethylene/Ethylene
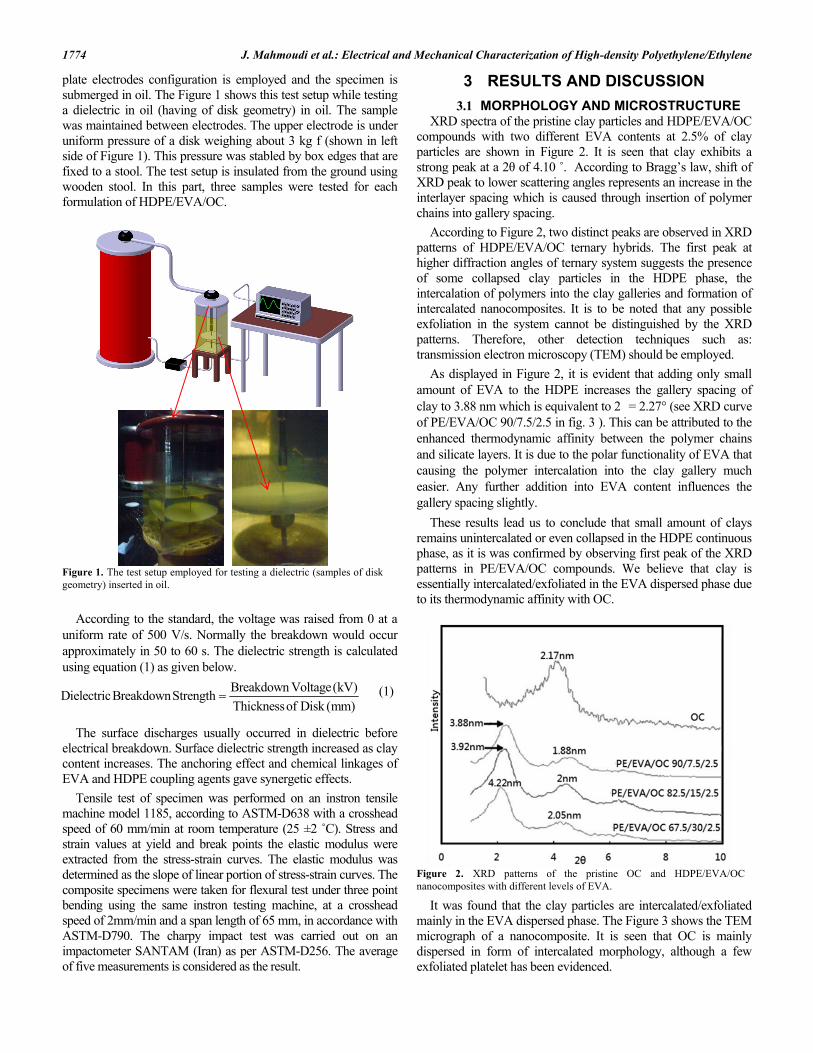
plate electrodes configuration is employed and the specimen is submerged in oil. The Figure 1 shows this test setup while testing a dielectric in oil (having of disk geometry) in oil. The sample was maintained between electrodes. The upper electrode is under uniform pressure of a disk weighing about 3 kg f (shown in left side of Figure 1). This pressure was stabled by box edges that are fixed to a stool. The test setup is insulated from the ground using wooden stool. In this part, three samples were tested for each formulation of HDPE/EVA/OC.
According to the standard, the voltage was raised from 0 at a
uniform rate of 500 V/s. Normally the breakdown would occur approximately in 50 to 60 s. The dielectric strength is calculated using equation (1) as given below.
The surface discharges usually occurred in dielectric before
electrical breakdown. Surface dielectric strength increased as clay content increases. The anchoring effect and chemical linkages of EVA and HDPE coupling agents gave synergetic effects.
Tensile test of specimen was performed on an instron tensile machine model 1185, according to ASTM-D638 with a crosshead speed of 60 mm/min at room temperature (25 ±2 ˚C). Stress and strain values at yield and break points the elastic modulus were extracted from the stress-strain curves. The elastic modulus was determined as the slope of linear portion of stress-strain curves. The composite specimens were taken for flexural test under three point bending using the same instron testing machine, at a crosshead speed of 2mm/min and a span length of 65 mm, in accordance with ASTM-D790. The charpy impact test was carried out on an impactometer SANTAM (Iran) as per ASTM-D256. The average of five measurements is considered as the result.
3 RESULTS AND DISCUSSION
3.1 MORPHOLOGY AND MICROSTRUCTURE XRD spectra of the pristine clay particles and HDPE/EVA/OC
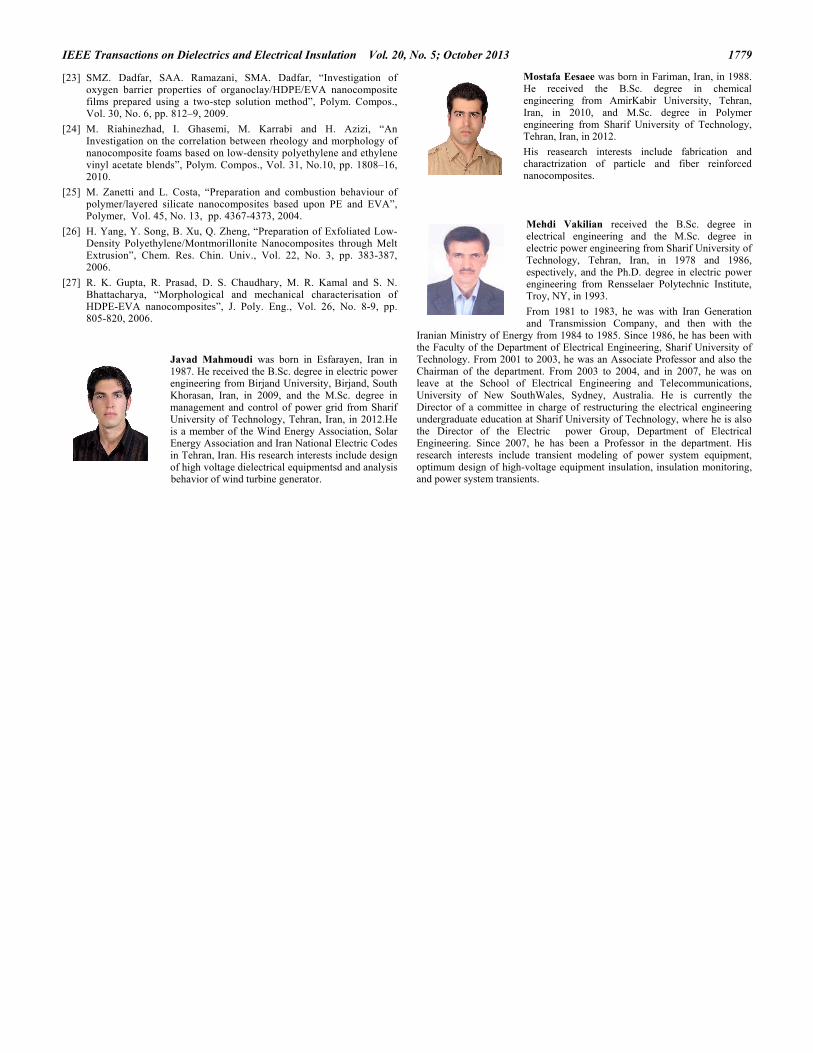
compounds with two different EVA contents at 2.5% of clay particles are shown in Figure 2. It is seen that clay exhibits a strong peak at a 2θ of 4.10 ˚. According to Bragg’s law, shift of XRD peak to lower scattering angles represents an increase in the interlayer spacing which is caused through insertion of polymer chains into gallery spacing.
According to Figure 2, two distinct peaks are observed in XRD patterns of HDPE/EVA/OC ternary hybrids. The first peak at higher diffraction angles of ternary system suggests the presence of some collapsed clay particles in the HDPE phase, the intercalation of polymers into the clay galleries and formation of intercalated nanocomposites. It is to be noted that any possible exfoliation in the system cannot be distinguished by the XRD patterns. Therefore, other detection techniques such as: transmission electron microscopy (TEM) should be employed.
As displayed in Figure 2, it is evident that adding only small amount of EVA to the HDPE increases the gallery spacing of clay to 3.88 nm which is equivalent to 2 = 2.27° (see XRD curve of PE/EVA/OC 90/7.5/2.5 in fig. 3 ). This can be attributed to the enhanced thermodynamic affinity between the polymer chains and silicate layers. It is due to the polar functionality of EVA that causing the polymer intercalation into the clay gallery much easier. Any further addition into EVA content influences the gallery spacing slightly.
These results lead us to conclude that small amount of clays remains unintercalated or even collapsed in the HDPE continuous phase, as it is was confirmed by observing first peak of the XRD patterns in PE/EVA/OC compounds. We believe that clay is essentially intercalated/exfoliated in the EVA dispersed phase due to its thermodynamic affinity with OC.
It was found that the clay particles are intercalated/exfoliated
mainly in the EVA dispersed phase. The Figure 3 shows the TEM micrograph of a nanocomposite. It is seen that OC is mainly dispersed in form of intercalated morphology, although a few exfoliated platelet has been evidenced.
Figure 2. XRD patterns of the pristine OC and HDPE/EVA/OCnanocomposites with different levels of EVA.
Figure 1. The test setup employed for testing a dielectric (samples of diskgeometry) inserted in oil.
Breakdown Voltage(kV)DielectricBreakdownStrength
Thicknessof Disk (mm) (1)

IEEE Transactions on Dielectrics and Electrical Insulation Vol. 20, No. 5; October 2013 1775
3.2 DIELECTRIC STRENGTH
Variation of dielectric strength versus different compositions of under study materials (HDPE, EVA and all the nanocomposite compositions) are plotted in Figures 4 to 7. Average of dielectric strengths of these materials are also summarized in Tables 1 to 4.
The data on each composite sample dielectric strength are plotted, using box plot software of MATLAB, in Figures 4 to 7 to represent the distribution of data. These demonstrate the uncertainty of dielectric strength. Each box has lines at the lower quartile, median and upper quartile values. Whiskers extend from each (upper and lower) end of the box to the adjacent values in the data; by default, the most extreme values are within 1.5 times the interquartile range (from the two upper and lower sides of the box). Outliers are data with values beyond the ends of the whiskers.
For example, in Figure 4 which is related to the first composition (with 0% OC), the lower and upper values of measurements are 51.2 (kV/mm) and 54.4 (kV/mm), respectively. These are shown by outliers. While, the lower, the median and the upper values are 52 (kV/mm), 52.7 (kV/mm) and 53.1 (kV/mm), respectively. Using a red dash-point line, the medium value is shown in each box.
At first step, the optimum percentage of EVA coupling agent must be determined. The dielectric strength of the HDPE increases when its EVA contents is raised up to 7.5 wt%. However, if the percentage increases more than this value, the dielectric strength of this compound will decrease.
The dielectric strength of the nanocomposite increases significantly when the clay content increases up to 5 wt%. Upon further addition of clay, the dielectric strength reduces slightly. The exfoliated and intercalated structures might be responsible for this improvement. Exfoliated and intercalated clay platelets distribute the electric stress uniformly and increase the path length of discharge. They act as a barrier against the break down [1]. Therefore the strength of OC particles bond with HDPE/EVA improves the dielectric properties of nanocomposites [1]. For a nanocomposite including 7.5 wt% of modified OC, the dielectric strength is lower than that in nanocomposite having 5 wt% of it. The reason of this comparison can be explained as follows: on higher loading, exfoliated/intercalated structure decreases and flocculated platelets of clay increases. Flocculated clay stacks provide weak interface sites which are responsible for the decrease in the dielectric strength. Break down of the nanocomposite with higher clay loading might be happening due to such weak interface sites of the flocculated clay stacks. Furthermore, the treatment of OC with EVA coupling agents strengthens this interface by chemical linkages and anchoring effects of the organic groups of EVA and OC with HDPE molecules.
Clay particles act as a barrier for breakdown by electrical stress. Therefore, the strength of this polymer bonding is an important factor for the improvement of the dielectric properties of the nanocomposite. The treeing channel effect will increase the path length of discharge due to the clay platelets.
Table 4. Dielectric breakdown strength of HDPE-based OC nanocomposites containing 7.5% EVA
Composition The percentage of Clay in
nanocomposite Dielectric Strength
(kV/mm)
1 0% 56.7 2 2.5% 66.3 3 5% 77.2 4 7.5% 70.5
Table 3. Dielectric breakdown strength of HDPE-based OC nanocomposites containing 15% EVA.
Composition The percentage of Clay
in nanocomposite Dielectric Strength
(kV/mm)
1 0% 52.1 2 2.5% 60.5 3 5% 68.5 4 7.5% 64.7
Table 2. Dielectric breakdown strength of HDPE-based OC nanocomposites containing 30% EVA.
Composition The percentage of Clay in
nanocomposite Dielectric Strength
(kV/mm)
1 0% 47.3 2 2.5% 55.4 3 5% 60.6 4 7.5% 57.1
Table 1. Dielectric breakdown strength of HDPE/OC nanocomposites.
Composition The percentage of Clay in
nanocomposite Dielectric Strength
(kV/mm)
1 0% 52.7 2 2.5% 60.2 3 5% 64.1 4 7.5% 62.0
Figure 3. TEM micrograph of HDPE/EVA/OC 82.5/15/2.5

1776 J. Mahmoudi et al.: Electrical and Mechanical Characterization of High-density Polyethylene/Ethylene
Figure 5. Dielectric breakdown strength of HDPE-based OC nanocomposites containing 30% EVA
.
3.3 SURFACE DISCHARGE
When OC is added to HDPE and EVA compound (with any percentage of EVA and OC nanocomposites), the surface strength against breakdown will increase. This electrical property is an important parameter for the dielectric material used between core steel sheets of a high voltage transformer. Figures 8 to 11 show the improvement of surface breakdown strength, when OC is added to blends. The captured partial discharge signals of Figures 8, 9, 10, and 11 are related to the pre-discharges over the surface and before occurrence of a breakdown. These captured signals are selected from the PD signals that are recorded by oscilloscope during the tests.
Table 5 presents the computed average energy of partial discharge (PD) signals for comparison purpose. The surface discharge duration is decreased by blending them with clays as shown in the recorded measurements of the following figures. In Figure 10 (HDPE/EVA signal) for example, the dielectric discharge oscillations over a duration which is approximately 3 times the surface discharge time in blends of HDPE/EVA. Adding OC to produce nanocomposites HDPE/EVA/OC, results in recorded PD signal with produced discharge time by two thirds of its value in the blend.
Figure 9. Surface discharge of HDPE/EVA 92.5/7.5 and HDPE/EVA/OC 87.5/7.5/5.
Figure 8. Surface discharge of neat HDPE and HDPE/OC 95/5.
Figure 7. Dielectric breakdown strength of HDPE-based OC nanocomposites containing 7.5% EVA.
Figure 6. Dielectric breakdown strength of HDPE-based OC nanocomposites containing 15% EVA.
Figure 4. Dielectric breakdown strength of HDPE/OC nanocomposites.

IEEE Transactions on Dielectrics and Electrical Insulation Vol. 20, No. 5; October 2013 1777
Another way to compare the surface resistance of HDPE/EVA
blends against HDPE/EVA/OC nanocomposites is to determine the average energy of PD signals as shown in Table 5. It can be seen that the PD energy is decreased extremely when OC particles are added to HDPE/EVA composite. For example, in third sample, HDPE/EVA 80/15, the PD energy is 0.3461 J in absence of OC particles whereas it is decreased to 0.1476 J when OC particles are added to the combination.
It is nice to remind that all captures have been taken before breakdown. These captures are selected from PD signals recorded by an oscilloscope.
3.4 MECHANICAL PROPERTIES
The main result of tensile testing are listed in Table 6. The elastic modulus and tensile strength of HDPE/EVA blends show almost a linear decrease by increasing in EVA content. Addition of 7.5 wt% EVA to HDPE causes modulus to be reduced by 6% and tensile strength by 4%. Further incorporation of EVA reduces these parameters severely. For example, adding 30 wt% EVA, the tensile
strength is reduced by 21% and the elastic modulus becomes half of its amount in neat HDPE. It can be explained that due to the increased content EVA, the amount of molecules forming microfibers is decreased. Thus the tensile strength declines as EVA content is increased in HDPE/EVA. This decrease can be attributed to the biphasic nature of the blend. Three samples are prepared to represent the different mechanical properties. The related results are presented in Tables 6 and 7. For example, in Table 6, the elastic modulus of pure HDPE samples are 401 MPa, 410 MPa and 419 MPa which are demonstrated by 410±9 MPa in the tables.
The tensile strength and elastic modulus were increased by addition of OC. It is clear that enhancement of interfacial contact between polymer and OC generated by high ratio of the dispersed clay particles is the main reason of the improved mechanical properties. This leads the interface between the HDPE/EVA matrix and the clay particles to better stress transfer. On the other hand, although EVA has been used to improve the dispersion of OC in HDPE phase, but it has been a negative effect on improving the mechanical properties.
The influence of EVA and OC contents on the stress and the elongation (strain) at the breakage point is shown in Table 6, too. For HDPE/EVA blends, increasing EVA content decreases stress and increases strain at the breakage point. Although adding OC dose not result in any specific trend on variation of the break strain, but it increases the values of stress at the breakage point.
It is clear from Table 7 that incorporation of EVA in HDPE
could result in the reduction of flexural strength and flexural modulus. For example, with the addition of 15 wt% EVA, the flexural strength and flexural modulus decreased from 25 MPa and 405 MPa to 22.15 MPa and 297 MPa, respectively. These reductions in strength and modulus are expected and are mainly due to the lower strength and modulus of EVA.
Addition of 2.5 wt% of OC to HDPE/EVA blend increases the flexural modulus and flexural strength. This increase is higher at the lower amount of EVA so that in a sample with 2.5 wt% of OC and 7.5 wt% of EVA, the values of flexural modulus and flexural strength are increased by 30% and 13% respectively.
According to Table 7, addition of OC nanoparticles to HDPE decreases the impact strengths. Presence of clay particles in HDPE increases the ability of nanocomposites to absorb impact energy and act as stress concentrations points. Therefore its failure may initiate at lower stresses and strains.
Table 6. Tensile properties of HDPE/EVA blends and nanocomposites
Sample HDPE/EVA/OC
Elastic Modulus [MPa]
Yield Stress [MPa]
Strain at Yield [%]
Stress at Break [MPa]
Strain at Break [%]
Neat HDPE 410±9 22.3±1.1 12.3±1.5 12.2±0.6 210 ±14
92.5/7.5/0 385±11 21.4±1.5 13.7±1.3 12.3±1.0 135 ±11
85/15/0 305±11 21.0±1.2 15.3±1.2 11.9±1.0 148 ±12
70/30/0 205±14 17.6±1.6 16.7±1.3 11.6±0.9 248 ±21
90/7.5/2.5 430±17 26.1±2.0 15.0±1.5 14.3±1.4 133 ±13
82.5/15/2.5 395±12 24.1±1.5 24.2±2.3 13.9±1.3 173 ±16
67.5/30/2.5 290±13 21.2±1.5 17.2±1.7 14.4±1.4 195 ±17
Table 5. The average energy of PD for different combination of HDPE/EVA/OC nanocomposite.
Sample Average energy (J)
with OC 5% Average energy (J)
without OC
Neat HDPE 0.1326 0.4350 HDPE/EVA 87.5/7.5 0.1095 0.2702
HDPE/EVA 80/15 0.1476 0.3641 HDPE/EVA 65/30 0.1043 0.2246
Figure 11. Surface discharge of HDPE/EVA 70/30 and HDPE/EVA/OC 65/30/15.
Figure 10. Surface discharge of HDPE/EVA 85/15 and HDPE/EVA/OC 80/15/5.

1778 J. Mahmoudi et al.: Electrical and Mechanical Characterization of High-density Polyethylene/Ethylene
The improvement in impact strength of HDPE/EVA is attributed to the rubbery nature of minor phase that absorbs a part of the impact energy and undergoes deformation. The effect of adding EVA is much higher than clay particles and effect of decreasing OC overcomes the EVA function, especially in lower EVA content. The presence of OC in samples with 7.5 and 15 wt% of EVA decreases the impact strength in lower contents if compared with pure HDPE. However, a sample with 30 wt% of EVA increases the impact strength significantly. It is likely found that the EVA phase controls the impact behavior in this composition of nanocomposite.
4 CONCLUSION In this work, the influence of clay particles on the electrical and
mechanical properties of HDPE/EVA/OC ternary nanocomposites fabricated by melt blending method was investigated. The morphological properties of nanocomposites carried out by the XRD spectra and TEM showed that the clay particles were mainly intercalated/exfoliated in the EVA phase. Addition of OC along with the coupling agents improved dielectric strength and surface resistance significantly. Optimum dielectric strength was achieved by adding 5% of OC to HDPE with a combination of 7.5% of EVA. The coupling agents formed chemical linkages between the organic and inorganic phases. The use of EVA provided synergistic effect for improving the dielectric strength of the interfaces. Contrary to HDPE/EVA binary blend, mechanical properties of HDPE/EVA/OC increased by increasing EVA at low concentration (7.5 percentage of EVA). Study of OC nanocomposites in this research demonstrated that the morphological, electrical and mechanical properties of this material are improved with a consistent trend.
5 REFRENCES [1] K. S. Shah, R. C. Jain, V. Shrinet, A. K. Singh and D. P. Bharambe,
“High Density Polyethylene (HDPE) Clay Nanocomposite for Dielectric Applications”, IEEE Trans. Dielectr. Electr. Insul., Vol. 16, No. 3, pp. 853–861, 2009.
[2] T. Tanaka, G. C. Montanari and R. Mülhaupt, “Polymer nanocomposites as dielectrics and electrical insulation-perspectives for processing technologies, material characterization and future applications”, IEEE Trans. Dielectr. Electr. Insul., Vol. 11, No. 5, pp. 763–784, 2004.
[3] G. C. Montanari, D. Fabiani, F. Palmieri, D. Kaempfer, R. Thomann and R. Mulhaupt, “Modification of electrical properties and performance of EVA and PP insulation through nanostructure by organophilic silicate”, IEEE Trans. Dielectr. Electr. Insul., Vol. 11, No. 5, pp. 754–762, 2004.
[4] C. D. Green, A. S. Vaughan, G. R. Mitchell and T. Liu,” Structure Property Relationships in Polyethylene/Montmorillonite Nanodielectrics”, IEEE Trans. Dielectr. Electr. Insul., Vol. 15, No. 1, pp. 134–143, 2008.
[5] L.H. Meyer, E. A. Cherney and S. H. Jayaram, “The role of inorganic fillers in silicone rubber for outdoor insulation-alumina tri-hydrate or silica”, IEEE. Electr. Insul. Mag., Vol. 20, No. 4, pp. 13-21, 2004.
[6] C. Green and A. Vaughan, “Nanodielectrics- How much do we really understand?”, IEEE Electr. Insul. Mag., Vol. 24, No. 4, pp.6- 16, 2008.
[7] B. A. Parviz, D. Ryan and G. M. Whitesides, “Using self-assembly for the fabrication of nano-scale electronic and photonic devices”, IEEE Trans. Adv. Packag., Vol. 26, No. 3, pp. 233-241, 2003.
[8] Y. Hu, R. C. Smith, J. K. Nelson and L. S. Schadler, “Some mechanistic understanding of the impulse strength of nanocomposites”, IEEE Conf. Electr. Insul. Dielectr. Phenomena (CEIDP), pp. 31-34, 2006.
[9] T. Tanaka, G. C. Montanari and R. Mulhaupt, “Polymer nanocomposites as dielectrics and electrical insulation-perspectives for processing technologies, material characterization and future applications”, IEEE Trans. Dielectr. Electr. Insul, Vol.11, pp. 763-784, 2004.
[10] S. Ray, K. Yamada, M. Okamoto, A. Ogami and K. Ueda, ”New Polylactide/Layered Silicate Nanocomposites. 3. High-performance Biodegradable Materials”, Chem. Mater., Vol. 15, No. 7, pp. 1456-1465, 2003.
[11] M. Roy, C. W. Reed, R.K. MacCrone, L.S. Schadler, J.K. Nelson, R. Keefe and W. Zenger, “Evidence for the role of interface in polyolefin nanocomposites”, Int’l.. Sympos. Electr. Insul. Materials (ISEIM), pp. 223-226, 2005.
[12] M. Krook, G. Morgan and M.S. Hedenqvist, “Barrier and mechanical properties of injection molded montmorillonite/polyesteramide nanocomposites”, Polym. Eng. Sci., Vol 45, No. 1, pp. 135-41, 2005.
[13] E. Hackett, E. Manias and E. P. Giannelis, “Computer Simulation Studies of PEO/Layer Silicate Nanocomposites”, Chem. Mater., Vol. 12, No. 8, pp. 2161–2167, 2000.
[14] E. P. Giannelis, R. Krishnamoorti and E. Manias, Polymer-silicate Nanocomposite: Model Systems for Confined Polymers and Polymer Brushes, Advances Polymer Sci., Pub. Springer Berlin Heidelberg, pp. 107-147, 1999.
[15] K.H. Wang, M.H. Choi, C.M. Koo, Y.S. Choi and I.J. Chung, ”Synthesis and characterization of maleated polyethylene/clay nanocomposites”, Polymer, 42-9819, 2001.
[16] T.G. Gopakumar, J.A. Lee, M. Kontopoulou and J.S. Parent, “Influence of clay exfoliation on the physical properties of montmorillonite/ polyethylene composites”, Polymer, 43-5483, 2002.
[17] X. Almeras, F. Dabrowski, Bras, M.L. R. Delobel, S. Bourbigot, G. Marosi and P. Anna, “Using polyamide-6 as charring agent in intumescent polypropylene formulationsI. Effect of the compatibilising agent on the fire retardancy performance”, Polymer Degradation and Stability, Vol. 77, No. 2, pp. 305-313, 2002.
[18] Ko, J.W., K.S. Suh, and S.H. Lee, Water treeing, AC breakdown, and dielectric loss characteristics of EVA‐OH as a function of conversion rate. Journal of applied polymer science, Vol. 101, No. 1, pp. 420-424, 2006.
[19] J. W. Ko, K. S. Suh and S. H. Lee, "Water treeing, AC breakdown, and dielectric loss characteristics of EVA-OH as a function of conversion rate", J. Appl. Polym. Sci, Vol. 101, No. 1, pp. 420-424, 2006.
[20] H.A. Khonakdar, U. Wagenknecht, S.H. Jafari, R. Hassler and H. Eslami, “Dynamic mechanical properties and morphology of polyethylene/ethylene vinyl acetate copolymer blends”, Advances Polymer Technology, Vol. 23, No. 4, pp. 307–315, 2004.
[21] G. Takidis, DN. Bikiaris, GZ. Papageorgiou, DS. Achilias and I. Sideridou, “Compatibility of low-density polyethylene/poly(ethylene-co-vinyl acetate) binary blends prepared by melt mixing”, J. Appl. Polym. Sci., Vol. 90, No. 3, pp. 841–852, 2003.
[22] S. Hui, TK. Chaki, S. Chattopadhyay, “Effect of silica-based nanofillers on the properties of a low-density polyethylene/ethylene vinyl acetate copolymer based thermoplastic elastomer”, J. Appl. Polym. Sci., Vol. 110, No. 2, pp. 825–836, 2008.
Table 7. Flexural and impact properties of HDPE/EVA blends and nanocomposite.
Sample HDPE/EVA/OC
Flexural Modulus
[MPa]
Flexural Strength [MPa]
Impact Strength [KJ/m2]
Neat HDPE 405±23 26.7±1.4 4.2±0.4
92.5/7.5/0 39 ±19 25.0±1.1 6.7±0.5
85/15/0 297±16 22.1±1.2 9.2±0.8
70/30/0 191±19 16.2±1.0 30.1±2.6
90/7.5/2.5 523±26 28.4±1.3 3.3±0.4
82.5/15/2.5 402±24 34.9±1.4 3.8±0.4
67.5/30/2.5 288±19 20.8±1.2 10.9±1.0
IEEE Transactions on Dielectrics and Electrical Insulation Vol. 20, No. 5; October 2013 1779
[23] SMZ. Dadfar, SAA. Ramazani, SMA. Dadfar, “Investigation of oxygen barrier properties of organoclay/HDPE/EVA nanocomposite films prepared using a two-step solution method”, Polym. Compos., Vol. 30, No. 6, pp. 812–9, 2009.
[24] M. Riahinezhad, I. Ghasemi, M. Karrabi and H. Azizi, “An Investigation on the correlation between rheology and morphology of nanocomposite foams based on low-density polyethylene and ethylene vinyl acetate blends”, Polym. Compos., Vol. 31, No.10, pp. 1808–16, 2010.
[25] M. Zanetti and L. Costa, “Preparation and combustion behaviour of polymer/layered silicate nanocomposites based upon PE and EVA”, Polymer, Vol. 45, No. 13, pp. 4367-4373, 2004.
[26] H. Yang, Y. Song, B. Xu, Q. Zheng, “Preparation of Exfoliated Low-Density Polyethylene/Montmorillonite Nanocomposites through Melt Extrusion”, Chem. Res. Chin. Univ., Vol. 22, No. 3, pp. 383-387, 2006.
[27] R. K. Gupta, R. Prasad, D. S. Chaudhary, M. R. Kamal and S. N. Bhattacharya, “Morphological and mechanical characterisation of HDPE-EVA nanocomposites”, J. Poly. Eng., Vol. 26, No. 8-9, pp. 805-820, 2006.
Javad Mahmoudi was born in Esfarayen, Iran in 1987. He received the B.Sc. degree in electric power engineering from Birjand University, Birjand, South Khorasan, Iran, in 2009, and the M.Sc. degree in management and control of power grid from Sharif University of Technology, Tehran, Iran, in 2012.He is a member of the Wind Energy Association, Solar Energy Association and Iran National Electric Codes in Tehran, Iran. His research interests include design of high voltage dielectrical equipmentsd and analysis behavior of wind turbine generator.
Mostafa Eesaee was born in Fariman, Iran, in 1988. He received the B.Sc. degree in chemical engineering from AmirKabir University, Tehran, Iran, in 2010, and M.Sc. degree in Polymer engineering from Sharif University of Technology, Tehran, Iran, in 2012.
His reasearch interests include fabrication and charactrization of particle and fiber reinforced nanocomposites.
Mehdi Vakilian received the B.Sc. degree in electrical engineering and the M.Sc. degree in electric power engineering from Sharif University of
Technology, Tehran, Iran, in 1978 and 1986, espectively, and the Ph.D. degree in electric power engineering from Rensselaer Polytechnic Institute,
Troy, NY, in 1993.
From 1981 to 1983, he was with Iran Generation and Transmission Company, and then with the
Iranian Ministry of Energy from 1984 to 1985. Since 1986, he has been with the Faculty of the Department of Electrical Engineering, Sharif University of
Technology. From 2001 to 2003, he was an Associate Professor and also the Chairman of the department. From 2003 to 2004, and in 2007, he was on leave at the School of Electrical Engineering and Telecommunications,
University of New SouthWales, Sydney, Australia. He is currently the Director of a committee in charge of restructuring the electrical engineering
undergraduate education at Sharif University of Technology, where he is also the Director of the Electric power Group, Department of Electrical Engineering. Since 2007, he has been a Professor in the department. His research interests include transient modeling of power system equipment,
optimum design of high-voltage equipment insulation, insulation monitoring, and power system transients.
Copyright © 2022 FDOKUMEN


![Astrocytic tracer dynamics estimated from [1-11C]-acetate PET measurements](https://static.fdokumen.com/doc/165x107/6334cca03e69168eaf070c95/astrocytic-tracer-dynamics-estimated-from-1-11c-acetate-pet-measurements.jpg)