Genome Engineering to Improve Acetate and Cellulosic ...
148
Genome Engineering to Improve Acetate and Cellulosic Hydrolysate Tolerance in E. coli for Improved Cellulosic Biofuel Production By Nicholas Richard Sandoval A thesis submitted to the Faculty of the Graduate School of the University of Colorado in partial fulfillment of the requirement for the degree of Doctor of Philosophy Department of Chemical Engineering 2011
-
Upload
khangminh22 -
Category
Documents
-
view
0 -
download
0
Transcript of Genome Engineering to Improve Acetate and Cellulosic ...

Genome Engineering to Improve Acetate and Cellulosic Hydrolysate Tolerance in E. coli for Improved Cellulosic
Biofuel Production
By
Nicholas Richard Sandoval
A thesis submitted to the Faculty of the Graduate School of the
University of Colorado in partial fulfillment
of the requirement for the degree of Doctor of Philosophy
Department of Chemical Engineering 2011

This thesis entitled:
Genome Engineering to Improve Acetate and Cellulosic Hydrolysate Tolerance in E. coli
for Improved Cellulosic Biofuel Production
written by Nicholas Richard Sandoval
has been approved for the Department of Chemical Engineering
___________________________________
Ryan T. Gill
___________________________________
James W. Medlin
Date __________
The final copy of this thesis has been examined by the signatories, and we find that
both the content and the form meet acceptable presentation standards of scholarly work
in the above mentioned discipline.
ii

Sandoval, Nicholas Richard (Ph.D., Chemical Engineering)
Genome Engineering To Improve Acetate and Cellulosic Hydrolysate Tolerance in E.
coli for Improved Cellulosic Biofuel Production
Thesis directed by Associate Professor Ryan T. Gill
Abstract
Engineering organisms for improved performance using lignocellulose feedstocks is an
important step toward a sustainable fuel and chemical industry. Cellulosic feedstocks
contain carbon and energy in the form of cellulosic and hemicellulosic sugars.
Pretreatment processes that hydrolyze lignocellulose into its component sugars often
also result in the accumulation of growth inhibitory compounds, such as acetate and
furfural among others. Engineering tolerance to these inhibitors is a necessary step for
the efficient production of biofuels and biochemicals. For this end we use multiple
genome-wide and targeted tools to alter the genetic makeup of E. coli so we can obtain
the desired trait of growth on lignocellulosic hydrolysate and tolerance to inhibitory
concentrations of acetate. Each of these tools used introduces mutations within a
population. These populations are placed in a selection environment where the fittest
survive. The change in population genotypes is then analyzed. We applied a recently
reported strategy for engineering tolerance towards the goal of increasing Escherichia
coli growth in elevated acetate concentrations (Lynch, Warnecke et al. 2007). We
performed selections upon an E. coli genome library using a moderate selection
iii

pressure. These studies identified a range of high-fitness genes that are normally
involved in membrane and extracellular processes, are key regulated steps in
pathways, and are involved in pathways that yield specific amino acids and nucleotides.
Supplementation of the products and metabolically-related metabolites of these
pathways increased growth rate in acetate.
Directed evolution has been used successfully to increase tolerance to a variety of
inhibitors on a variety of microorganisms. However, the number of unique and non-
neutral mutations searched has been limited. With recent advances in DNA synthesis
and recombination technologies, new advanced tools can be used. We report a two
step strategy that can search a very large number of mutations that are more likely to
improve the tolerance of the organism. First, the trackable multiplex recombineering
(TRMR) tool searches a genome-wide library for single mutations which have a
mutation which either turns up or down gene expression. Based on microarray
analysis, a small number of targets are selected for recursive multiplex recombineering.
We constructed and searched a library of mutations in the ribosomal binding site of
targeted genes, including clones which have multiple mutations. We conducted this
strategy in two inhibitory environments (acetate and lignocellulosic hydrolysate). For
both cases, we successfully found single mutants from the first step, but in the second
step, we found no tolerant mutants for acetate and multiple tolerant single mutants for
the hydrolysate. A model was applied to predict the outcome of these selections with
varying epistatic effects. This strategy is capable of searching a very large mutational
space, but without prior knowledge of epistatic interaction, successful multiple mutants
are not guaranteed.
iv

Dedication
This thesis is dedicated to JMJ.
v

Acknowledgements
I am blessed to have so many people help me with the work here presented.
First, I thank my advisor, Prof. Ryan Gill, for all the help and encouragement over the
years I have known him. I would also like to thank the rest of my thesis committee for
their time and advice: Prof. Bryant, Prof. Demmig-Adams, Prof. Kaar, Prof. Medlin, and
Dr. Zhang.
Tirzah Y. Glebes (formerly Mills) contributed to chapters two, three, and four both
experimentally and in help producing the written products. She has been the most
dependable lab mate and friend one could ask for.
Dr. Joe Warner contributed to chapter four with help doing TRMR selections and
analyzing TRMR data. Dr. Phillipa Reeder is thanked her contributions to chapter four
based on her previous work with hydrolysate.
I would like to thank Paul Handke, Lauren Woodruff, Eileen Spindler, Joost
Groot, Mike Lynch, Tanya Lipscomb, Sean Lynch, Jamie Prior, Julie Struble, Pernilla
Turner and all other current and former members of the Gill research group that helped
my thought process, gave me good feedback, and taught me so much.
vi

Contents
Chapter
1. Introduction 1
2. Review: Cellulosic hydrolysate toxicity and tolerance mechanisms
in Escherichia coli
2.1. Introduction 6
2.2. Organic acids 11
2.2.1. Modes of toxicity 11
2.2.2. Modes of tolerance 14
2.3. Engineering tolerance 16
2.4. Perspectives 19
3. Elucidating Acetate Tolerance in E. coli Using a Genome-Wide
Approach
3.1. Introduction 20
3.2. Materials and methods 24
3.2.1. Bacteria, plasmids, and media 24
3.2.2. Genomic library, transformation, and selection 24
vii

3.2.3. Sampling and microarray analysis 25
3.2.4. Determination of growth characteristics 26
3.2.5. Determination of individual gene fitness 26
3.3. Results 27
3.3.1. Application of SCALES method and moderate selection pressure to
identify acetate tolerance regions 27
3.3.2. Examination of individual clones and genes 35
3.3.3. Projection of gene fitness onto metabolic maps 40
3.3.4. Media supplement strategies to increase acetate tolerance 41
3.3.5. Genetic strategies to increase acetate tolerance 48
3.4. Discussion 51
3.4.1. Transcriptionally regulated steps key 52
3.4.2. Products of pathways with high fitness genes confer tolerance 53
3.4.3. Extracellular functions important 55
3.4.4. Acetate a complex target 55
4. Using genome-wide and targeted tools to engineer acetate
tolerance in E. coli for improved cellulosic biofuel production
4.1. Introduction 57
4.2. Materials and methods 62
4.2.1. Bacteria plasmids and media 62
4.2.2. TRMR library and selections 62
4.2.3. TRMR sequencing and microarray analysis 63
4.2.4. TRMR clone reconstruction 64
viii

4.2.5. Growth studies 64
4.2.6. Library construction of mutated ribosomal binding site 65
4.3. Results 66
4.3.1. TRMR selections and microarray analysis 68
4.3.2. TRMR clone genotyping, reconstruction, and testing 75
4.3.3. Consideration of practicalities for engineering strains with multiple
mutations 81
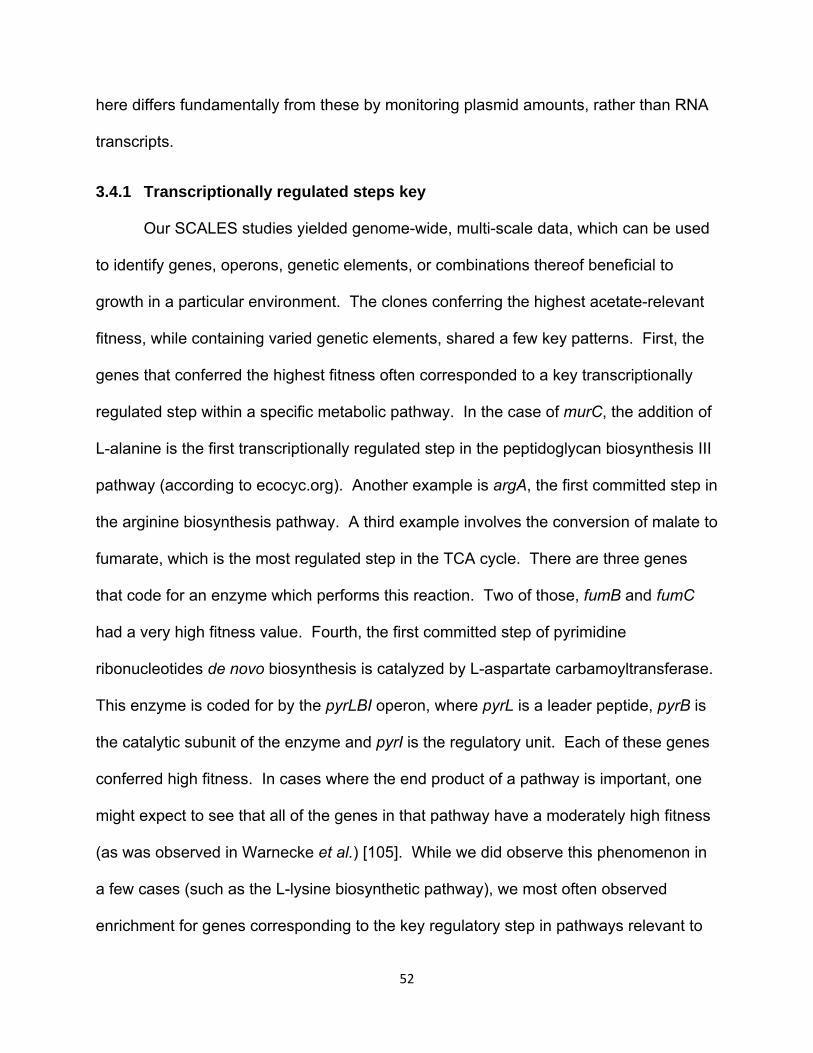
4.3.4. Construction and selection of MAGE libraries 94
4.3.5. Construction and selection of secondary MAGE libraries 103
4.4. Discussion 115
4.4.1. Mutations found in TRMR 116
4.4.2. MAGE selections yields mixed results 117
5. Conclusions 120
6. References 126
ix

Tables
Table 3.1 – Top clones in SCALES selection 32
Table 3.2 – Identification of Inserts from Picked Colonies 49
Table 4.1 – Top Fitness Mutants from TRMR 16 g/L Acetate Selection 70
Table 4.2 – Identification of Picked Clones 76
Table 4.3 – TRMR Clone Reconstruction Primers 79
Table 4.4 – MAGE Oligos for Hydrolysate Library Construction 95-96
Table 4.5 – MAGE Oligos for Acetate Library Construction 102
Table 4.6 – Mutations of Picked Clones from Second Hydrolysate
MAGE Library Selection 111
x

Figures
Figure 2.1 – Hydrolysate inhibitors 10
Figure 3.1 – Overview of selection strategy and SCALES analysis 29
Figure 3.2 – Fitness of clones 33-34
Figure 3.3 – Regions of circle plot in detail 37-39
Figure 3.4 – Supplementation Growth Studies 43-46
Figure 3.5 – Combination of supplements 47
Figure 3.6 – Growth rate of selected picked clones 50
Figure 4.1 – Overview of two step mutation and selection strategy 61
Figure 4.2 – Fitness of Mutants 69
Figure 4.3 – TRMR Clone confirmation 80
Figure 4.4 – Model Describing MAGE Selections 89-93
Figure 4.5 – MAGE library 40% hydrolysate selection 97
Figure 4.6 – 44 hour growth of post selection isolates in 40% hydrolysate 99
xi

xii
Figure 4.7 – Sequence of mutated RBS 100
Figure 4.8 – Chromatograph of lpp RBS region from end selection population 100
Figure 4.9 – Model Describing Second MAGE Library and Selections 105-109
Figure 4.10 – Sequence of mutated RBS 112
Figure 4.11 - 20 hour growth of post selection isolates in 40% hydrolysate 114
Lynch, M. D., T. Warnecke, et al. (2007). "SCALEs: multiscale analysis of library enrichment." Nat Meth 4(1): 87‐93.
Wang, H. H. and G. M. Church (2011). "Multiplexed genome engineering and genotyping methods applications for synthetic biology and metabolic engineering." Methods Enzymol 498: 409‐26.
Warner, J. R., P. J. Reeder, et al. (2010). "Rapid profiling of a microbial genome using mixtures of barcoded oligonucleotides." Nat Biotechnol 28(8): 856‐62.

Chapter 1
Introduction
This thesis will discuss in general, two goals. The first is of immediate practical
consideration: the increased tolerance of E. coli to acetate stress and lignocellulosic
hydrolysate stress for better fermentation of biofuels and biochemicals. The second
concerns the relatively general question of how best to effect positive change on
microorganisms via mutation to engineer a desired trait.
The process of generating genetic diversity within a population of organisms with
a selective pressure, generating a fitter organism is not a new one. Nature has
provided over a very long period of time the basis for all of these tools that will be
described here: evolution. We will use the basic principle of survival of the fittest in
order to achieve our goals.
Natural evolution is not as single-minded and thoroughly product-oriented as the
engineer, so while nature has given us the framework to engineer traits, we must direct
the mutations and the selection to yield the desired trait. Mutations occurring in nature
occur slowly and not in a manner directed toward changes in phenotype. In the past, it
1

was common to put a microorganism in selective conditions for a very long period of
time, and allow mutations to arise independent of the researcher, yielding a tolerant, but
uncharacterized strain. Discovering what mutations were made and which of those
made the strain tolerant was often deemed too difficult to do, so it was often left undone.
Even when mutations were found, determining a causal link between the mutation and
the change in phenotype was difficult since most random mutations are neutral or
deleterious.
A better strategy is to build a library with very specific mutations that have a high
likelihood of changing the strain’s phenotype. This can be best achieved by introducing
mutations that affect gene expression. By introducing specific mutations, it is possible
to identify these mutations much more easily later on. However, until recently, this has
been impossible or difficult to do.
Recent advances in both the introduction of mutations and finding out what those
mutations are allow researchers now to explore new areas with great return. Advances
in synthetic DNA production allow researchers to order DNA with custom sequences,
making possible Trackable Multiplex Recombineering (TRMR) and Multiplex Automated
Genome Engineering (MAGE), since both of these methods use synthetic DNA for site-
specific recombination. The advent of DNA microarrays has allowed the genotyping of
an entire population. This advance allows a quantifiable value to be assigned to the
various types of mutations. These recent advances in technology have opened the
door to both engineering traits in strains and elucidating how mutations confer
tolerance. Both the Scalar Analysis of Library Enrichments (SCALES) and TRMR tools
have utilized this technology to make the processes high throughput.
2
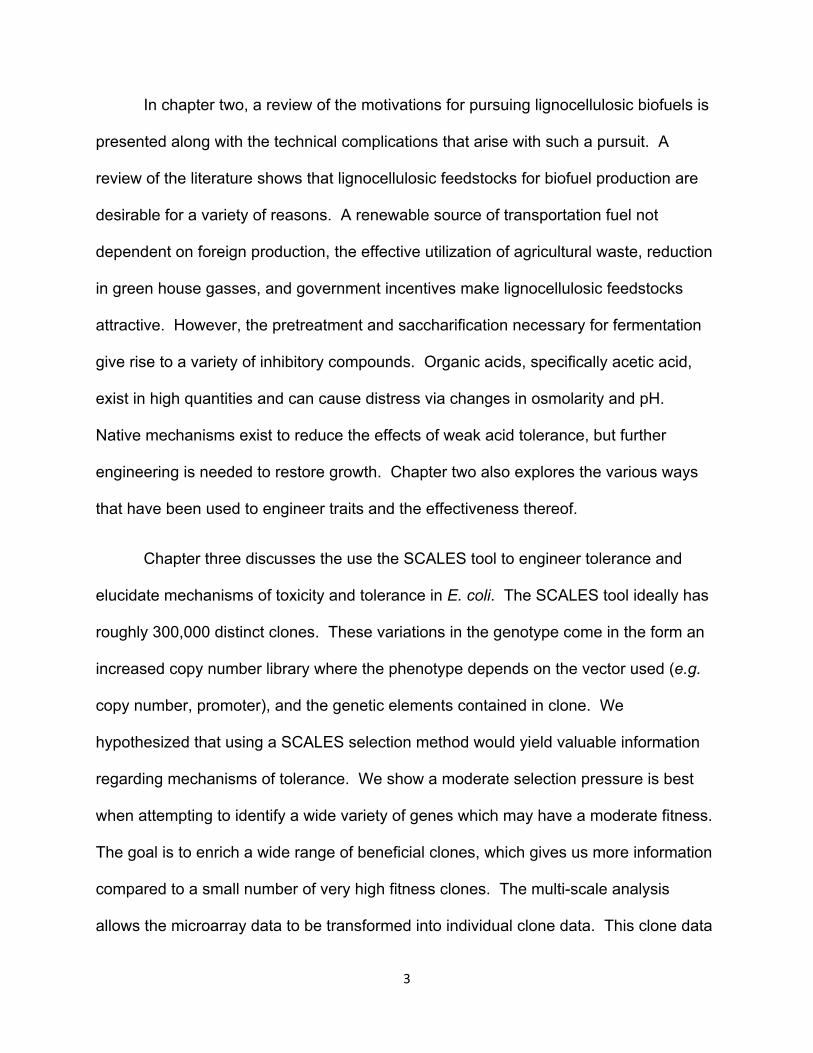
In chapter two, a review of the motivations for pursuing lignocellulosic biofuels is
presented along with the technical complications that arise with such a pursuit. A
review of the literature shows that lignocellulosic feedstocks for biofuel production are
desirable for a variety of reasons. A renewable source of transportation fuel not
dependent on foreign production, the effective utilization of agricultural waste, reduction
in green house gasses, and government incentives make lignocellulosic feedstocks
attractive. However, the pretreatment and saccharification necessary for fermentation
give rise to a variety of inhibitory compounds. Organic acids, specifically acetic acid,
exist in high quantities and can cause distress via changes in osmolarity and pH.
Native mechanisms exist to reduce the effects of weak acid tolerance, but further
engineering is needed to restore growth. Chapter two also explores the various ways
that have been used to engineer traits and the effectiveness thereof.
Chapter three discusses the use the SCALES tool to engineer tolerance and
elucidate mechanisms of toxicity and tolerance in E. coli. The SCALES tool ideally has
roughly 300,000 distinct clones. These variations in the genotype come in the form an
increased copy number library where the phenotype depends on the vector used (e.g.
copy number, promoter), and the genetic elements contained in clone. We
hypothesized that using a SCALES selection method would yield valuable information
regarding mechanisms of tolerance. We show a moderate selection pressure is best
when attempting to identify a wide variety of genes which may have a moderate fitness.
The goal is to enrich a wide range of beneficial clones, which gives us more information
compared to a small number of very high fitness clones. The multi-scale analysis
allows the microarray data to be transformed into individual clone data. This clone data
3

is then compiled to yield one fitness value for each gene. These gene fitnesses were
compiled in a variety of ways, and the most useful was projection onto metabolic maps.
These maps show that some genes which encode for proteins that catalyze key steps in
the production of certain metabolites have a high fitness. The supplementation of these
and related metabolites increased the growth rate significantly. The difficulty of
obtaining a genetic solution to acetate tolerance is also discussed.
Chapter four describes a multi-tool strategy to make genetic changes that will
confer a beneficial trait change. In this strategy, two systems are each used on two
conditions. Improved growth in both hydrolysate and acetate are desired. The first step
is to do a wide, but shallow search over the entire genome using the TRMR tool. It is
said to be shallow because it only searches the up and down mutations contained in the
library. The TRMR library consists of two mutations for just about every gene in E. coli
(2 x ~4,000 = ~8,000). Each clone has an integration within the chromosome that has
either a construct to encourage gene expression (‘up’) or discourage gene expression
(‘down’). An acetate selection in high concentration is employed because only the best
clones are desired for the next step. The hydrolysate TRMR data was obtained from
the work of Dr. Phillipa Reeder, which was published in the original TRMR article [1].
The second step of the process described in chapter four is to choose as targets those
genes which appear with top fitness from the TRMR data analysis for further study. The
MAGE process will be used to generate a library of clones that have mutated ribosomal
binding sites which will affect the level of expression of the targeted genes. The
mutations are either totally degenerate (for those TRMR clones with a high ‘down’
fitness) or partially degenerate (for those with a high ‘up’ fitness). Each target has
4
~65,000 (down) or ~2000 (up) permutations per target. The phenotype will depend on
the location and number of mutations and the strength of the mutated ribosomal binding
site. This process is done recursively with a mixed pool of ssDNA oligonucleotides for
recombination so that a single clone can accumulate multiple mutations.
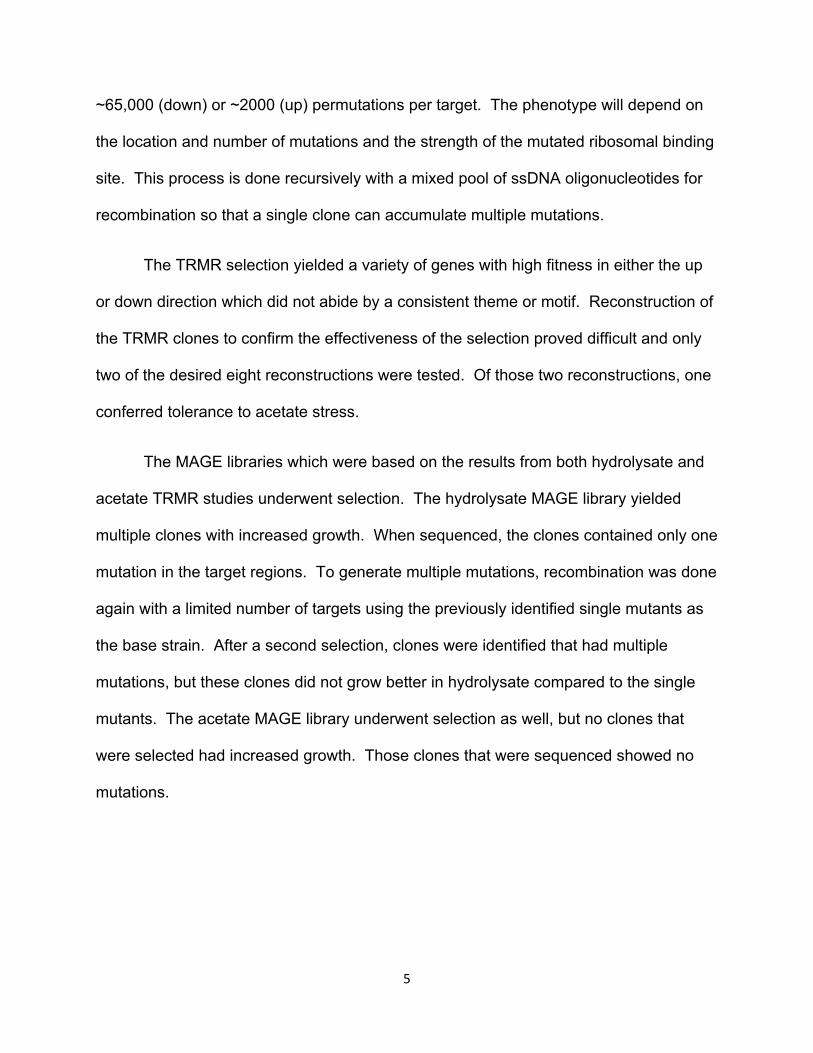
The TRMR selection yielded a variety of genes with high fitness in either the up
or down direction which did not abide by a consistent theme or motif. Reconstruction of
the TRMR clones to confirm the effectiveness of the selection proved difficult and only
two of the desired eight reconstructions were tested. Of those two reconstructions, one
conferred tolerance to acetate stress.
The MAGE libraries which were based on the results from both hydrolysate and
acetate TRMR studies underwent selection. The hydrolysate MAGE library yielded
multiple clones with increased growth. When sequenced, the clones contained only one
mutation in the target regions. To generate multiple mutations, recombination was done
again with a limited number of targets using the previously identified single mutants as
the base strain. After a second selection, clones were identified that had multiple
mutations, but these clones did not grow better in hydrolysate compared to the single
mutants. The acetate MAGE library underwent selection as well, but no clones that
were selected had increased growth. Those clones that were sequenced showed no
mutations.
5

Chapter 2
Review: Cellulosic hydrolysate toxicity and tolerance
mechanisms in Escherichia coli
Journal: Biotechnology for Biofuels
Authorship:
Sandoval, N.R.
Mills, T.Y.
Gill, R.T.
2.1 Introduction
World governments are calling for increased production of renewable
transportation fuels in light of increases in energy consumption [2-6]. The United
States has mandated the production of 36 billion gallons of biofuels by 2022, with even
greater increases of up to 60 billion gallons by 2030 proposed by the current
administration [2, 7]. However, corn ethanol production, the predominant method of
biofuel production currently in U.S., is limited to 10-15 billion gallons per year [8].
Moreover, corn ethanol has come under criticism for its potential to increase
greenhouse gas (GHG) emissions when compared to fossil fuels, its negative impact on
food markets, and other environmental concerns [9-11]. In light of these facts, new
6

feedstocks and processes capable of producing 20-50 billion gallons of biofuel per year,
while not increasing GHG emissions or otherwise negatively affecting the environment,
must be responsibly developed and commercialized within the next two decades.
Biofuels derived from lignocellulosic biomass hold promise for making up a significant
fraction of this market.
Lignocellulosic feedstocks, such as switchgrass, poplar, and corn stover, are
comprised of polymerized sugars, mainly glucose and xylose, which can be used as a
carbon source for biofuel production. These feedstocks are attractive because they are
often now regarded as waste and no value is being produced from them. Use of
cellulosic feedstocks have the potential to provide GHG savings of 65-100% in
comparison to gasoline [12]. When land-use changes are considered, cellulosic ethanol
still has the ability to reduce overall GHG emissions depending on the source of
biomass and associated land-use change [9]. Feedstocks that do not require a
substantial change in land use include crop and municipal wastes and fall grass
harvests[9]. Other potential feedstocks include waste from pulp and paper mills and
construction debris [2]. These feedstocks are of great interest because they require no
additional land-use conversion [9].
In order to use these feedstocks in fermentation, the sugars contained within the
polymer chains must be released. To achieve this, very violent processes (generally
referred to as pretreatment) must take place to produce hydrolysate, the sugary liquid
product of pretreatment. Many types of processes exist and have been recently
reviewed for the pretreatment of lignocellulosic biomass to produce a fermentable
7

hydrolysate [13-17]. The overall goal of pretreatment is to produce glucose from
cellulose, convert hemicellulose to pentoses, and to remove lignin [14].
The necessarily harsh conditions used in pretreatment create a variety of
compounds that inhibit the fermentation performance. Inhibitors have been categorized
previously by Olsson and Hahn-Hägerdal [18]. Specifically, acetic acid is released from
acetylxylan decomposition, furan derivatives result from sugar dehydration, and
phenolic compounds are derived from lignin. Furan derivatives include 2-furaldehyde
(furfural) and 5-hydroxymethylfurfural (HMF), which result from pentose and hexose
dehydration, respectively [19, 20]. Subsequent degradation of furfural and HMF
introduces formic acid and levulinic acid, respectively, into the hydrolysate. Lignin
degradation produces phenolic compounds of interest which include acids, alcohols,
aldehydes, and ketones [21].
Although many fermentative microorganisms exist, Escherichia coli,
Saccharomyces cerevisiae, and Zymomonas mobilis are the most promising for
industrial biofuel production [22]. Each microorganism has limitations in native
substrate utilization, production capacity, and tolerance. Unlike S. cerevisiae or Z.
mobilis, E. coli natively ferments both hexose and pentose sugars (the others can only
natively ferment hexoses). E. coli on the other hand, has no native ethanol production
pathway, so heterogeneous genes must be supplemented to produce the biofuel [23].
Ethanologenic E. coli also has higher tolerance to lignocellulosic inhibitors than its
fermentative counterparts [24-26]. In 2007, Jarboe et al., compared ethanol production
between these three microorganisms, determining that E. coli is comparable with or
surpasses other reported production levels, despite its low membrane tolerance to
8

ethanol [27]. These qualities along with advanced knowledge about the E. coli genome
and regulation make this bacterium a good candidate for further development.
As depicted in Figure 2.1, generally accepted categories of antimicrobial activity
for inhibitors in lignocellulosic hydrolysate include: (a) compromising the cell membrane,
(b) inhibiting essential enzymes, or (c) negative interaction with DNA or RNA [28-33].
These compounds often act by inhibiting multiple targets. Although efforts are
underway to limit the amount and types of inhibitors created during pretreatment, at the
present time, economically viable processes still fall short. Regardless of pretreatment
optimization, inhibitors such as acetic acid, released directly from hemicellulose
decomposition, will remain in the hydrolysate. Thus, the need to engineer more tolerant
fermentative microorganisms exists. In this work, known modes of acetate toxicity and
tolerance pertaining to E. coli will be reviewed, in addition to new technologies that are
aimed at engineering the bacterium for various traits.
9

Figure 2.1 - Hydrolysate inhibitors
Lignocellulosic biomass is processed into component sugars, lignin solids, and inhibitory compounds. These inhibitors can affect microbial growth in various ways including DNA mutation, membrane disruption, intracellular pH drop, and other cellular targets.
10

2.2 Organic Acids
Organic acids derived from lignocellulosic biomass pretreatment and subsequent
saccharification inhibit the growth and metabolism of E. coli (Figure 2.1). This, in turn,
reduces the yield, titer, and productivity of biofuel fermentation. Various organic acids
are created in pretreatment steps: acetic acid is derived from the hydrolysis of
acetylxylan, a main component of hemicellulose; others (formic, levulinic, etc.) are a
result from degraded sugars [34].
Acetic acid is usually found at the highest concentration in the hydrolysate [35-
41]. Levels of acetate depend on the type of cellulosic biomass and the pretreatment
method. Concentrations typically range from 1 to >10 g/L in the hydrolysate. Formic
acid, while more toxic to E. coli than acetic acid, is typically present at much lower
concentrations than acetic acid (commonly a tenth of acetic acid concentrations) [24,
36, 37]. Other toxic weak acids, whose hydrolysate concentrations are rarely reported,
are present at an even lower concentration than formic acid [36, 38, 39, 42].
2.2.1 Modes of Toxicity
Weak organic acids have been shown to primarily inhibit the production of cell
mass, but not the fermentation itself [24]. Acetate is the most studied organic acid
inhibitor in E. coli. Acetate is a natural fermentation product that is known to
accumulate due to “overflow metabolism” and inhibit cell growth. Acetate
concentrations as low as 0.5 g/L have been shown to inhibit cell growth by 50% in
minimal media [43, 44]. However, in E. coli KO11, concentrations of acetate up to 12
g/L did not significantly affect ethanol yield, although ethanol titer decreased with high
levels of acetate [45]. Attempts have been made to mathematically describe the
11

relationship between growth rate and acetate concentration, with varying results. Koh
et al. (1992) proposed the following equation for specific growths (µ) in a batch reactor:
][11
max Ack ⋅+=
μμ
Eq. 2.1.
The value of the constant, k, ranged from 0.125 L/g to 0.366 L/g depending on the strain
and media [46]. Luli and Strohl (1990) reported an exponential decay model of
inhibition [47]:
[ ]e Ack⋅−=maxμμ
Eq. 2.2.
The value of the constant was calculated as 0.06 L/g of acetate. In both shake flasks
and a fermentor, Nakano et al. (1997) report a linear inhibition trend. Specific growth
rates in shake flasks were four times as low for any given concentration of acetate as
compared to the fermentor. This difference in toxicity was attributed to the controlled
dissolved oxygen in the fermentor [48]. The IC50, the concentration of acetate that
inhibits growth by 50%, ranges from 2.75 to 8 g/L depending on the strain and media
[24, 46, 47].
Weak acids, in the undissociated form can permeate the cell membrane, and
once inside, dissociate to release the anion and the proton. These “uncoupling agents”
disrupt the transmembrane pH potential (or, proton motive force) since, effectively, a
proton is allowed to cross the membrane without the generation of ATP [49]. This
dissociation of the weak acid in the cytoplasm is due to the fact the intracellular pH, pHi,
is naturally at a pH of ~7.8, which is much higher than the weak acid’s pKa [43]. As
12

these acids dissociate inside the cell, the pHi decreases, which can inhibit growth [43].
External pH has a large affect on the toxicity of the weak acids. E. coli KO11 in LB
media with 5.0 g/L acetate reached an ethanol titer twice as fast at an initial pH of 7.0
compared to an initial pH of 6.0, and thrice as fast compared to an initial pH of 5.5 [45].
When E. coli LY01 was subjected, at a starting pH of 6.0, to acetic, formic, or levulinic
acid at the IC50 observed at a neutral pH, the growth rate decreased to 0, 35, and 10
percent, respectively, that of control growth [24]. Formic acid may be more toxic due to
the fact it has an extraordinarily high membrane permeability [50]. This external pH
effect is, in part, due to the fact that the acid exists in its undissociated form at higher
concentrations, allowing for higher permeation of the cell membrane.
The anion also has an inhibitory effect. The anion accumulates inside the cell,
which can affect the cell turgor pressure [43]. Inhibition has been shown to be anion
specific [24, 43, 44]. When E. coli inhibition from acetate was compared to that of
benzoate, the same growth rate was observed for differing pHi (7.26 for benzoate and
7.48 for acetate) [43]. Zaldivar and Ingram (1999) reported that the toxicity of weak
acids depended highly on the hydrophobicity of the acid [24]. The more hydrophobic
the acid, the more toxic it is.
The modes of toxicity of weak acids are not easily elucidated. Formic and
propionic acid have been shown to inhibit the synthesis of macromolecules, as the cells
stop growing after addition of the acids [51]. More so than other macromolecules, DNA
synthesis was slowed [51]. DNA repair-deficient strains were shown to be more
sensitive to weak acids when tested in stationary phase [52]. However, repair deficient
strains were not overly sensitive to organic acids in growth phase [53]. This plus the
13

lack of an observed SOS response suggests that the DNA was not damaged by these
acids [53]. The hypothesis of membrane disruption has also been investigated.
Leakage of cell contents in the presence of weak organic acids was small when
compared to the leakage associated with a membrane disrupting antibiotic (polymyxin
B) or even ethanol, and thus is not likely to be the primary cause of weak acid inhibition
[24, 54]. Weak acids have been shown to reduce the intracellular pools of some amino
acids. Glutamate and aspartate, precursors to many other amino acids, were shown
to be at a significantly lower concentration in the cytoplasm when E. coli was grown in
the presence of weak acid [43]. Glutamate has been shown to be important during
growth as a protective osmolyte [55, 56]. Lysine, arginine, glutamine, and methionine
were also found at lower concentrations when E. coli was incubated with weak acid [43,
44]. The addition of methionine to the incubation mixture has been shown to alleviate
much of the toxicity associated with acetate [44].
2.2.2 Modes of Tolerance
E. coli acid resistance mechanisms are thought to increase E. coli survival when
passing through the low pH environment in the stomach. It has long been known that
cells can sense and regulate intracellular pH [57]. Also, it has been shown that
treatment of bacteria to moderately low levels of pH (5.0) before exposure to very low
pH (3.0-3.5) increases the tolerance more than 50-fold [58].
E. coli naturally has several known mechanisms to combat acid stress. One
mechanism for acid tolerance requires the presence of an amino acid decarboxylase
coupled with an antiporter that exports the decarboxylated product and imports the
amino acid used [59-61]. It is widely thought that tolerance is due to the fact that the
14

decarboxylation and antiporter reactions consume and export one intracellular proton
across the cell membrane. This raises the pHi of the cell, which is beneficial for survival
and growth [59-63]. The transmembrane potential is also affected by these acid
resistance mechanisms. E. coli, which normally has a negative transmembrane
potential, had a positive potential during acid stress when either the arginine- or
glutamine-dependent systems were activated. This mimics what is seen in acidophiles
[62]. These mechanisms of tolerance have also been reviewed and depicted by
Warnecke et al. (2004) [64].
All acid resistance mechanisms, however, are not equally effective. The
glutamate-dependent acid resistance mechanism is the most studied and the most
robust, the arginine-dependent mechanism provides a moderate level of resistance, and
the lysine-dependent mechanism confers a minimal level of tolerance [60-63, 65, 66].
The levels of tolerance are highly dependent on the strain, treatment before shock, the
media used, growth phase, and the strength and length of acid stress [59-63, 65, 66].
The differences in efficacy among the mechanisms may lie in the optimal pH for the
amino acid decarboxylase. The optimum pH for the glutamate, arginine, and lysine
decarboxylases is 4, 5, and 5.7, respectively [62]. The lower the optimal pH of the
enzyme, the more efficient it is during times of acid stress.
These acid resistance mechanisms exhibit complex regulation. Low pH can
induce heat and oxidative shock regulons, genes coding for membrane-proteins, and
acid consumption [67]. It is known that the rpoS regulon is induced by exposure to
weak acids [65, 68, 69]. Once induced, the rpoS response leads to higher survival rates
at low pH, oxidative stress, and heat stress [69]. However, the rpoS response alone is
15

not sufficient for acid tolerance. Cultures exposed to NaCl, which also induces the rpoS
response, failed to increase acid survival [69]. RpoS has also been implicated in
glutamine-dependent acid resistance [63]. This system has been shown to involve at
least two sigma factors (σS and σ70) and at least five regulatory proteins (coded by crp,
ydeO, gadE, gadX, and gadW) in the expression of the decarboxylases (gadA and B)
and the antiporter (gadC) [70-72].
Other modes of tolerance to weak acids are also known. DNA stabilization via
dps protein interactions has been shown to be beneficial at low pH [73]. Acetate
treatment was shown to increase expression of many other genes; these genes were
mostly involved in general metabolism of the cell as well as outer membrane protein
production [69]. In a genomic library selection with 3-hydroxyproionic acid, genes
coding for inner membrane proteins and certain genes involved in cell metabolism were
found to be most enriched [74, 75].
2.3 Engineering Tolerance
Engineering tolerance to hydrolysate byproducts is an attractive method for
improving lignocellulosic biomass based biofuel production in E. coli. Several
methodologies have been used for this purpose. The conventional approach is to
perform long-course adaptation studies. This method has been used to generate the
ethanologenic E. coli LY01 strain. Over a three month period, E. coli KO11 was grown
recursively in ethanol-containing media and plated on chloramphenicol-containing solid
media (on which large colonies indicated good ethanol production) [76]. The LY01
strain showed 50% relative growth rate (µ) at 30 g/L ethanol, whereas the parent KO11
16

showed 50% relative growth rate (µ) in 20 g/L [25]. The resultant E. coli LY01 strain
was not only more tolerant to ethanol than KO11, but showed a decreased sensitivity to
toxic aldehydes as well [25]. Gonzalez et al. (2003) showed that expression levels of
genes involved in producing protective osmolytes, antibiotic resistance proteins, and cell
envelope components were significantly different in LY01 and KO11 [77]. Using
chemical mutagens can, over a short period of time, achieve similar results as long-
course adaptation. Randomly mutating E. coli using NTG mutagenesis has been used
to increase the complete inhibition concentration of vanillin from 3 to 4 g/L [78].
Genomic library selection is a powerful tool that can discover genes or operons
that, with increased copy number, confer a desired phenotype. The advent of DNA
microarrays has made it easier to identify these beneficial genes. SCALEs (Scalar
Analysis of Library Enrichments), and its predecessor PGTM (Parallel Gene Trait
Mapping), have used E. coli genomic library selection and microarrays to engineer
tolerance to Pine-Sol antibiotic, antimetabolites, 3-hydroxypropionic acid, and naphthol
[74, 79-82]. Genomic selections employing libraries of heterologous genes have also
been used to engineer tolerance. A genomic library of Sphingomonas sp. 14DN61 was
used in E. coli to find the PhnN enzyme, which converts aromatic aldehydes, such as
vanillin, to their milder corresponding carboxylic acid [83]. Other methods of creating
tolerant strains include engineering sigma factors, which alter the transcription of the
cell. Global transcription machinery engineering (GTME) utilizes random mutagenesis
of sigma factor genes to create libraries of mutated sigma factors. These mutants are
then selected for improved tolerance. As a proof of concept, a 40% increase in growth
rate at 40 g/L ethanol tolerance was reported [84]. Furthermore, mutants identified via
17

GTME selection using high levels of acetate (30 g/L) exhibited increased growth rate (µ)
by a factor of five [85].
Rational design (i.e. mutation for tolerance based on a priori knowledge) of E.
coli to better cope with toxins in hydrolysate has yielded mixed results. After
determining methionine biosynthesis was inhibited in the presence of acetate, Roe et al.
(2002) overexpressed the metE gene, which converts homocysteine to methionine, and
the glyA gene, which is necessary for 5N-methyltetrahydrofolate regeneration (a part of
methionine synthesis). However, no decrease in acetate sensitivity was found with
either clone [44]. Heterologous cloning of potentially beneficial genes has also been
attempted. Aldehyde oxidoreductase from a Nocardia species reduces aromatic
carboxylic acids to the corresponding aldehydes that are subsequently natively
converted to the milder corresponding alcohol. This gene was cloned into E. coli, but a
50-fold lower specific activity was seen [86]. When incubated with a cofactor and the
Nocardia sp. post-translation enzyme, heterologous expression produced a specific
activity 20-fold higher than before [86]. In another effort, Pseudomonas putida
benzaldehyde dehydrogenase was cloned into E. coli. Coupled with a NahR reporter
system, catalytically active enzyme was selected for using a tet-based host [87]. The
fungus Coniochaeta ligniaria was found by selection of various microorganisms
sampled from soil in media containing furfural and HMF. It was later shown to degrade
both furfural and HMF [88]. The genes responsible for such degradation may be
attractive metabolic engineering targets. In a novel fermentation strategy, Eiteman et al.
(2008) propose using E. coli strains designed to only be able to use a single substrate
as a carbon source [89]. In a two part fermentation, a strain designed to only consume
18
acetate acts first, then, the detoxified hydrolysate would undergo simultaneous
fermentation by a glucose-consuming strain and a xylose-consuming strain [89, 90].
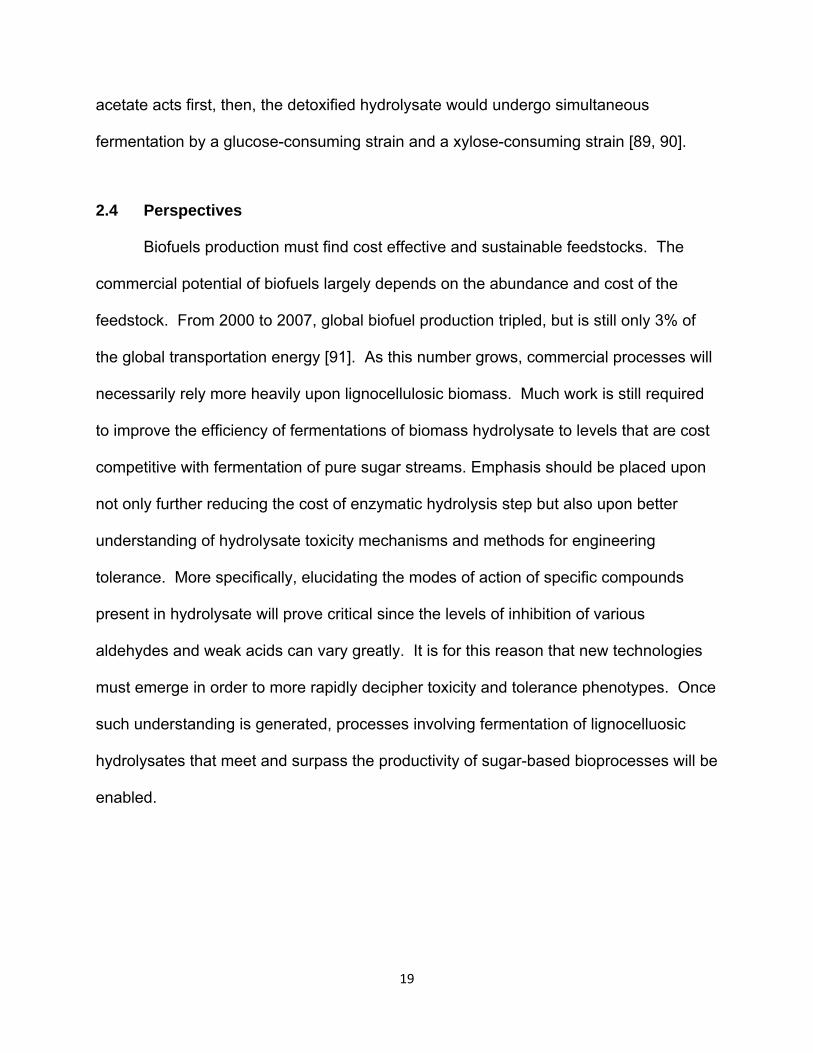
2.4 Perspectives
Biofuels production must find cost effective and sustainable feedstocks. The
commercial potential of biofuels largely depends on the abundance and cost of the
feedstock. From 2000 to 2007, global biofuel production tripled, but is still only 3% of
the global transportation energy [91]. As this number grows, commercial processes will
necessarily rely more heavily upon lignocellulosic biomass. Much work is still required
to improve the efficiency of fermentations of biomass hydrolysate to levels that are cost
competitive with fermentation of pure sugar streams. Emphasis should be placed upon
not only further reducing the cost of enzymatic hydrolysis step but also upon better
understanding of hydrolysate toxicity mechanisms and methods for engineering
tolerance. More specifically, elucidating the modes of action of specific compounds
present in hydrolysate will prove critical since the levels of inhibition of various
aldehydes and weak acids can vary greatly. It is for this reason that new technologies
must emerge in order to more rapidly decipher toxicity and tolerance phenotypes. Once
such understanding is generated, processes involving fermentation of lignocelluosic
hydrolysates that meet and surpass the productivity of sugar-based bioprocesses will be
enabled.
19
Chapter 3:
Elucidating Acetate Tolerance in E. coli Using a
Genome-Wide Approach
Journal: Metabolic Engineering Authorship: Sandoval, N.R. Mills, T.Y. Zhang, M. Gill, R.T.
3.1 Introduction
Cellulosic biofuel production is a key priority in the effort to reduce fossil fuel
consumption and convert to a sustainable transportation fuel economy. Ethanol
produced from sugar (dextrose), a first generation biofuel, has the capacity to produce
10 to 15 billion gallons of fuel per annum [Department of Energy, 8]. However, the
United States consumes 140 billion gallons of fuel in the same period, leaving a large
gap to fill [Energy Information Administration, 92]. Moreover, the Energy Independence
and Security Act of 2007 mandates the production of 36 billion gallons of biofuels by
20

2022. In order to meet that demand, cellulosic ethanol and other next-generation
biofuels are required.
Various feedstocks like corn stover, switchgrass, wood, municipal waste, or any
number of plant products contain carbon and energy in the form of cellulosic and
hemicellulosic sugars. Benefits from using such feedstocks include a reduction in
greenhouse gas emissions, reduced land-use change, and a smaller effect on food
markets when compared to corn ethanol [9, 12]. However, there are significant barriers
associated with commercial use of cellulosic feedstock.
A key obstacle involves the pretreatment of cellulose and hemicellulose polymers
in order to generate mono- and disaccharide sugars for consumption by microbial
catalysts. Several of the most attractive pre-treatment processes, however, result in the
accumulation of compounds that inhibit downstream conversion processes (see review
of Sun and Cheng) [14]. To address these problems, common industrial strains are
being engineered with increasingly sophisticated technologies to be tolerant to the
offending toxins and more alternative production strains with native tolerance are being
considered [93-95].
In particular, acetic acid is produced from acetylxylan decomposition; furfural and
hydroxymethylfurfural are dehydration products of five and six-carbon sugars [18].
Other toxins such as formic acid, levulinic acid, and phenolic compounds are formed
from further degradation of feedstock components [96]. Acetic acid is typically the
inhibitory compound present at the highest concentration after pretreatment with
concentrations from 1 to 10 g/L [35-41]. Acetate concentrations of 0.5 g/L have been
21

shown to significantly retard growth of E. coli [43, 44]. In order for use of lignocellulosic
biomass as biofuel feedstocks to become economically viable, the fermenting
microorganism must be able to tolerate higher concentrations of acetic acid and other
toxins [96]. The goal of this research was to identify genetic elements and pathways
that play an important role for acetate tolerance in E. coli.
Conventional methods for engineering tolerance involve recursive iterations of
mutagenesis and selection or phenotypic screening. While these methods have been
shown to be effective, the identification of beneficial mutations is difficult. The frequency
of total mutations within the genome after such a selection or screen is often low (e.g.
hundreds of point mutations in a genome millions of base pairs long). Of those, most
will be harmful or neutral. Mutations that are beneficial are typically less than one
percent [97]. The result is that even with next generation sequencing or resequencing
technologies methods for increasing the frequency of mutations within the analyzed
DNA pool are required. Another option is transcriptional profiling, but the resultant data
suffer from the same frequency problems (changes in the expression of dozens to
hundreds of genes), the data is correlative not causative between genotype and
phenotype, and many phenotypes are caused by physiological alterations that do not
include changes in the expression of relevant genes. Indeed, a cellular response to a
toxin, which can be seen by transcriptional profiling, may not lead to protection of the
cell from that toxin [98]. Rational engineering of phenotypes is also an attractive option.
However, in order for this approach to be effective, the targeted phenotype must be well
understood at the genetic level. In the case of acetate, and many other toxic
compounds, such knowledge does not exist.
22

In this study, a genomic library selection method is employed. Specifically, the
high-throughput, genome-wide tool Scalar Analysis of Library Enrichements (SCALES)
was used to elucidate mechanisms of tolerance to acetic acid in E. coli [81]. SCALES is
not the only advanced method to engineer beneficial phenotypes; transcription
machinery engineering, directed and accelerated evolution using recombination,
genome shuffling are all methods that can rapidly generate large varieties in phenotype
via genotypic alterations [84, 99-101]. SCALES was used here since we have
previously successfully applied this method to identify genes promoting growth in a
variety of contexts [79, 102-105]. The SCALES method uses plasmid-based genomic
libraries with four different insert sizes, with each library covering the entire genome at
125 NT resolution. The libraries were mixed together, subjected to growth selection, and
tracked using DNA microarray technology on plasmid-library DNA.
The particular advantage to the SCALES approach is that it enables the genome-
scale mapping of causal relationships between genes and desired phenotypes. Here,
we applied this method to identify genes conferring acetate tolerance to E. coli. Based
on the function of such genes, we hypothesized that acetate tolerance could be further
increased through supplementation of specific amino acids and/or pyrimidine
ribonucleotides to the minimal growth medium. Testing of this hypothesis revealed a
significant increase in growth rate and even a restoration of the growth rate in the
absence of acetate stress.
23

3.2 Materials and Methods
3.2.1 Bacteria, plasmids, and media
E. coli K12 (ATCC #29425) was used to obtain genomic DNA. Genomic library
selection used pBTL-1 vector [106]. Clones that were based on SCALES data were
constructed in pEZseq HC-Amp (Lucigen, Middleton, WI). Overnight cultures used
Luria-Bertani (LB) medium. Sampling was done with solid LB medium with agar.
Selections and growth testing was done with MOPS minimal medium [107]. All cultures
were incubated at 37°C and used 100 µg/mL carbenicillin.
3.2.2 Genomic library, transformation, and selection
Genomic libraries were prepared in the Gill laboratory previous to this study.
Genomic libraries were prepared in the same method as described in Warnecke et al.
(2008) with the use of pBTL-1 vector for the genomic library [104]. Genomic library
insert sizes of 1, 2, 4, and 8 kb were used in this study. Purified genomic library
plasmid DNA from each of the four libraries was transformed via electroporation into E.
coli BW25113 ∆recA::Kan obtained from the Keio collection [108]. The
electrocompetent cells were made such via glycerol wash method [109]. A sample of
each transformation reaction was plated on solid media to ensure each library had
greater than 106 transformants, ensuring complete genomic representation at 125 NT
resolution.
After transformation and recovery in TB media, library transformation cultures
were mixed together and inoculated into a 50 mL MOPS minimal medium culture in a
shake flask. When this starter culture reached an optical density at 600 nm (OD600) of
24

0.2, a 0.5 mL aliquot was inoculated into the selection environment. The selection
environment was a shake flask with 50 mL of MOPS minimal medium with carbenicillin
supplemented with 1.75 g/L acetate titrated to neutral pH with 10 M KOH. The OD600
was monitored throughout the selection period. In order to maintain the culture in
exponential phase, serial transfers were done at 24, 48, and 60 hours after the start of
the selection. Each selection culture medium was identical to the previous batch.
3.2.3 Sampling and microarray analysis
After 72 hours of selection, samples of individual clones were obtained by taking
an aliquot from the selection culture and plating a 1/10,000 dilution onto LB plus
carbenicillin solid media. Ten clones were isolated for sequencing and growth rate
testing. In order to obtain sample DNA for use with microarrays, a total aliquot of 1 mL
from each of two time points, t=0 and 72 hours, was plated onto 20 LB plus carbenicillin
solid media plates. After 24 hours, the colonies were harvested by scraping the plates
into LB media and spinning them down to obtain a cell pellet. A portion of the pellet was
taken to harvest its plasmid DNA via the Qiagen Hi-Speed Midi Kit per manufacturer’s
instructions.
The plasmid DNA was prepared for microarray in the same method as described
in Warnecke et al. (2008) [104]. Data analysis of the resulting .cel file was done with
the SCALES software created by Lynch et al. in accordance with the authors’
instructions [81]. A median filter was used in order to remove fitness spikes under 750
bp. Signals were normalized using the total amount of plasmid DNA applied to the
microarray.
25

3.2.4 Determination of Growth Characteristics
Stock acetic acid solution was prepared by titrating 5 mL of an HPLC-grade 50%
acetic acid solution (Fluka) on ice with 10 M KOH to neutral pH. Overnight cultures
were prepared from freezer stocks using 5 mL LB plus carbenicillin media in a 15 mL
centrifuge tubes. Stationary phase overnight cultures were used for a 2.5% inoculation
of 5 mL MOPS minimal medium plus carbenicillin in a 15 mL centrifuge tube. The
OD600 was monitored until the culture reached an OD600 = 0.200 ± 0.01. Growth curves
were constructed by introducing a 5% inoculation into 5 mL MOPS minimal medium
plus carbenicillin supplemented with prepared acetic acid solution to a final
concentration 1.75 g/L in a 15 mL centrifuge tube or with 50 mL of media in a 250 mL
shake flask. All cultures were incubated at 37°C and were shaken at 225 rpm. OD600
was monitored over the course of exponential growth and final measurements were
taken after 24 hours. Specific growth rate was calculated by linear regression on the
natural logarithm of the exponential phase OD600 over time. Amino acid and nucleotide
base supplementation studies were done by preparing stock solutions of amino acids
and bases and supplementing the media to a final concentration of 10 mM and 0.4 mM,
respectively.
3.2.5 Determination of Individual Gene Fitness
Individual gene fitnesses were determined by analyzing the clones found in the
SCALES data. Multiple clones may contain the same gene or part of a gene. To
calculate the gene fitness per clone, the clone fitness (W) was multiplied by the fraction
of the gene contained in the clone; this was then divided by the length of the gene.
Once this was done for all clones that contained the gene, these were summed to yield
26

the total gene fitness. This process was repeated for every gene in the ecocyc.org
database for E. coli K12 MG1655.
3.3 Results
The overarching goal of this study was to identify strategies for increasing
tolerance to acetate in E. coli. For this effort, a genomic library selection using
microarray analysis in the method of SCALES was performed. We identified a number
of regions in the genome that conferred high fitness to E. coli in the presence of
elevated acetate concentrations. We then analyzed this data by summarizing individual
gene data at the level of metabolic pathways [105]. Based on this analysis, we
developed hypotheses regarding metabolites that could be used to improve growth in
the presence of acetate.
3.3.1 Application of SCALES method and moderate selection pressure to identify
acetate tolerance regions
The SCALES method was employed here in order to look at the acetate anion
specific mechanisms of tolerance (Figure 3.1). Organic acids, such as acetate, are
known to inhibit as a result of pH- and anion-related effects. Acids enter the cell and
dissociate to form a proton and an anion. This lowers the intracellular pH and allows
protons to enter the cell without the production of ATP [96]. Mechanisms of tolerance
related strictly to low pH have been well studied [96]. The inhibition caused by the
27

anion, which is specific to the type of anion, is not well understood. Thus, selections
were performed at neutral pH to emphasize anion-related inhibition over proton based
inhibition.
We have previously shown that selection design plays a critical role in dictating
enrichment patterns [103, 104]. Here, we designed selections to focus on growth rate,
as opposed to increased MIC (minimum inhibitory concentration, the lowest
concentration of the toxin that markedly inhibits growth). Our strategy involved repeated
batch selections using a sub-MIC level of acetate. We specifically performed selections
at 1.75 g/L acetate, where the specific growth (exponential growth rate constant) was
20% of the level in the absence of any added acetate. Our use of a moderate selection
pressure is based on a desire to enrich for a broad range of beneficial clones as
opposed to the use of a high selection pressure, which would have eliminated all but the
most tolerant few clones (which can lead to loss of useful information).
28

Figure 3.1 - Overview of selection strategy and SCALES analysis
Plasmid-based genomic libraries of different and defined insert size were transformed into E. coli BW25113 ∆recA, mixed, introduced to a starter culture with minimal media. After the mixed library starter culture reached an OD600 of 0.20, an aliquot was taken and introduced into the selection culture. Sample plasmid DNA was isolated from beginning and end time points and applied to an E. coli Affymetrix gene chip for analysis with the SCALES programs.
29

The SCALES method utilizes multiple genomic libraries of varying sizes so that
the precise genetic element conferring tolerance might be identified. To this end, each
library fully represented the E. coli K12 genome. The selection was performed in a
defined minimal medium to eliminate unknown factors. We chose to do a serial transfer
of batches method to avoid selection of biofilm phenotype that has been seen in
continuous batch cultures [104]. A total of four batches were used over the course of
the 72 hour selection. Samples were taken for microarray use at the beginning and end
of selection.
The relative concentration of each of the ca. 400,000 clones in our mixed
libraries was determined before and after selection (Figure 3.2a). Fitness, defined as
the ratio of relative concentrations of clones between two time points, was then
calculated at a resolution of 125 bp across the entire genome. This data was then
decomposed to produce individual clone fitness values (top clones with associated
genes, gene products, and important pathways associated with gene products are listed
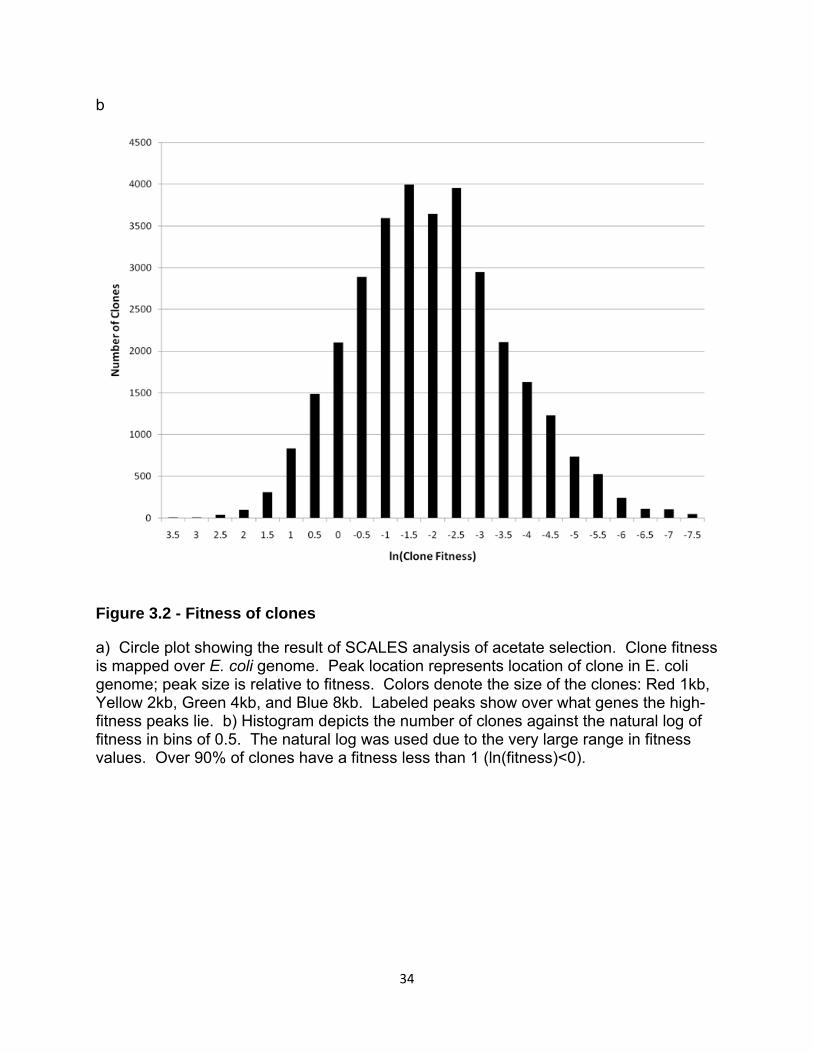
in Table 1). Over 30,000 distinct clones were identified. Only a small fraction of these
clones (<10%) have a fitness greater than 1 (Figure 3.2b). This still leads to a relatively
large number of clones that have either a moderate or high fitness. Although many of
these clones contain overlapping genetic regions, it appears as though there are many
mechanisms to confer a moderate amount of tolerance to acetate (at least at the
moderate level of selection pressure we employed). It is interesting to note that the
distribution of fitness approximates a normal distribution, which is unusual compared to
the results of selections we have previously reported, yet understandable given the
30

moderate selection pressure employed and the fact that the stressor is an E. coli
metabolite [103].
31
Genomic Position Size Fitness Genes in Clone
Gene Product Pathway
Start Stop
1 100625 101875 1250 22.8 murC‡, murG
UDP-N-acetylmuramate-alanine ligase
peptidoglycan biosynthesis III
2 4353125 4354625 1500 15.2 yjdL‡, cadA dipeptide transporter -
3 4352875 4354625 1750 12.3 yjdL*, cadA dipeptide transporter -
4 2947500 2948750 1250 11.4 argA*, recD N-acetylglutamate synthase
arginine biosynthesis
5 4051625 4053375 1750 9.75 glnG*, glnL NtrC transcriptional dual regulator
-
6 4283500 4285500 2000 9.47 acs* acetyl-CoA synthetase acetate conversion to acetyl-CoA
7 269000 271500 2500 9.40 insI-1*, insN-1*, insO-1*, perR
transposase of IS30, CP4-6 prophage (insN-1 and insO-1)
-
8 483000 485000 2000 9.14 acrA*, acrB, acrR
membrane fusion protein AcrA(B or D)-TolC multidrug efflux transport system
9 1679000 1680250 1250 8.91 folM*, ydgC*, rstA
dihydrofolate reductase, hypothetical protein
tetrahydrofolate biosynthesis
10 4344000 4345750 1750 8.29 fumB*, dcuB fumarase B TCA cycle
*Gene fully contained within the clone. ‡Gene most prevalent in clone. Function and Pathway columns are referring to either fully contained or most prevalent genes.
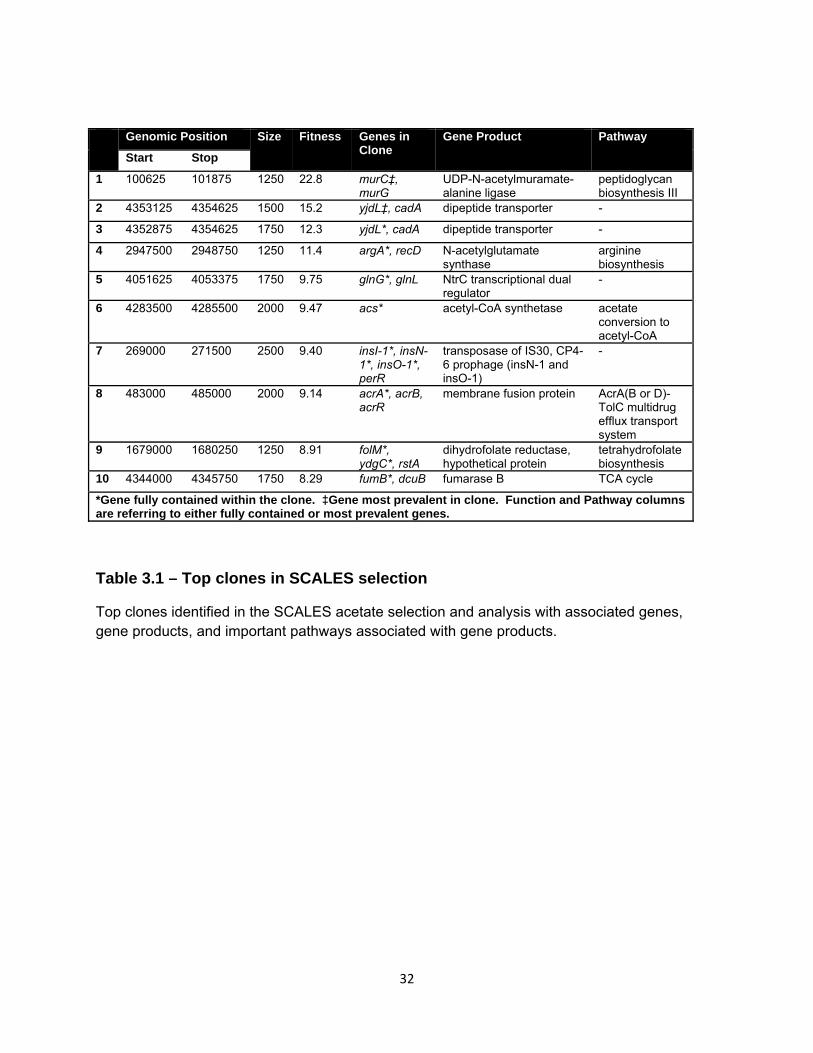
Table 3.1 – Top clones in SCALES selection
Top clones identified in the SCALES acetate selection and analysis with associated genes, gene products, and important pathways associated with gene products.
32

a
33
b
Figure 3.2 - Fitness of clones
a) Circle plot showing the result of SCALES analysis of acetate selection. Clone fitness is mapped over E. coli genome. Peak location represents location of clone in E. coli genome; peak size is relative to fitness. Colors denote the size of the clones: Red 1kb, Yellow 2kb, Green 4kb, and Blue 8kb. Labeled peaks show over what genes the high-fitness peaks lie. b) Histogram depicts the number of clones against the natural log of fitness in bins of 0.5. The natural log was used due to the very large range in fitness values. Over 90% of clones have a fitness less than 1 (ln(fitness)<0).
34

3.3.2 Examination of individual clones and genes
The SCALEs method provides a list of clones that appear to have increased
fitness in a particular environment. In our acetate selections, the fittest clone (W=22.8)
corresponds to increased copy number of the majority of the coding region for the gene
murC (see Figure 3.3a). The MurC protein (UDP-N-acetylmuramate-alanine ligase) is
an essential enzyme in the production of peptidoglycan and thus has been the target of
antimicrobial research [110]. In E. coli, it catalyzes the ligation of the first amino acid in
the peptide moiety in peptidoglycan.
The next fittest clone contains the gene yjdL. In fact, multiple clones contained
this gene (the best clones had fitness W=15.2, 12.3, 8.1, 7.2, 5.4 et al.). In total, yjdL
was found with the highest fitness in the selection. The gene encodes a dipeptide
transporter [111]. It is located adjacent in the genome to the gene cadA, which with
yjdL, is included in a clone with high fitness (see green box in Figure 3.3b). The CadA
protein (lysine decarboxylase) has been shown to be a part of the lysine-dependent acid
resistance system. In this system, the product of the CadA-catalyzed reaction,
cadaverine, is pumped out of the cell at the same time lysine is pumped into the cell by
the CadB protein. This process effectively pumps one proton out of the cell in order to
maintain a proper pH gradient. It is of note that a transcriptional activator of cadA,
CadC, is also contained in a clone with a moderately high fitness (W=2.9, data not
shown).
The clone with the next highest fitness primarily contains the gene argA (W=11.4)
(see Figure 3.3c). The argA gene codes for the protein N-acetylglutamate synthase. Of
35

note, the sixth fittest clone contains the gene acs (W=9.5), which codes for acetyl-CoA
synthetase.
As can be seen in each of these cases, a single gene can be contained in
multiple clones. The sum of the fitness of these clones may be large, but if the
individual clones do not have a very large fitness, the gene may not appear in the list of
top clones. In order to consider such genes, we converted the clone fitness into gene
fitness. If a gene was fully contained within a clone, that gene was credited with that
clone’s fitness. If a gene was contained partially in a clone, that gene was ascribed with
a fraction of the clone’s fitness corresponding to the fraction of the gene that was
contained within the clone. These values were then summed over every clone that
included that gene, yielding gene fitness for every gene in the genome.
36

3.3a
37

3.3b
38

3.3c
Figure 3.3 - Regions of circle plot in detail.
Shown are the top three clones found in SCALES: a) murC region, b) fumB with yjdL and cadA region, and c) argA region. On the y-axis is the fitness of the clones with 125 bp resolution. On the x-axis is the position on the E. coli genome. Shown below the genomic position is the cartoon of genetic elements in that region taken from ecocyc.org.
39
3.3.3 Projection of gene fitness onto metabolic maps
In many cases, genes with the highest fitness have products with closely related
functions. While these genes are not close to each other in terms of genomic position in
the E. coli, they may be closely related metabolically. In order to investigate these
interactions, we have constructed metabolic maps with the gene fitness overlaid on
each of the enzymatic steps of a pathway. We were then able to summarize gene
fitness at the level of individual metabolic pathways as well as individual metabolites
(building off the strategy reported previously in Warnecke et al.) [105].
This summary analysis indicated that many of the top genes conferring high
fitness are involved in amino acids biosynthesis (see Figure 3.4a). This is of note in that
acetate addition has been shown to reduce the intracellular pools of the amino acids
glutamate, aspartate, lysine, arginine, and glutamine [43]. Moreover, methionine has
previously been shown to partially restore growth in acetate [44].
A pathway linked to methionine synthesis, the tetrahydrofolate (THF) biosynthetic
process, was also found to have multiple genes conferring high fitness. THF is a
cofactor in many reactions where a single carbon is donated. These reactions are often
times involved in the production of amino acids, such as methionine and glycine, as well
as pyrimidine deoxyribonucleotides. The genes folM, metH, metF, and glyA were all
found to have high fitness values.
Another pathway of interest, the pyrimidine ribonucleotides de novo biosynthesis,
is shown in Figure 3.4c. The first committed step of the pathway, the coupling of
aspartate and carbamoylphosphate, is catalyzed by L-aspartate carbamoyltransferase,
40

is made up of the products of the pyrB and pyrI genes. The pyrL gene codes for the
leader peptide sequence and is normally necessary for the expression of the pyrB and
pyrI genes [112]. The pyrL, pyrB, and pyrI genes were all found with high fitness.
These areas of interest have overlapping metabolites. The biosynthesis of
arginine requires glutamate while the pathways forming lysine, threonine, methionine,
UTP, and CTP all require aspartate; as previously mentioned acetate severely lowers
the intracellular pools of these two amino acids. The synthesis of methionine also
requires the use of the THF pathway. The THF pathway meets the pyrimidine
deoxyribonucleotides de novo biosynthesis pathway (to produce dTMP from dUMP), for
which the precursors are produced via the pyrimidine ribonucleotides de
novo biosynthesis pathway. As can be seen, these pathways that have many genes
with high fitness are interconnected.
3.3.4 Media supplement strategies to increase acetate tolerance
Genes involved in the production of arginine, methionine, and lysine were found
to have high fitness. We hypothesized supplementation of these amino acids in the
growth medium would improve the growth characteristics of the wild type strain in the
presence of acetic acid. To assess this, we tested the growth of the control strain in the
presence of acetate supplemented with 10 mM concentrations of various amino acids.
In addition to those associated with genes exhibiting a high fitness, we chose glutamate
and aspartate because their intracellular pools had previously been shown to decrease
[43]. Threonine was also included because it had been shown to increase growth rate
in a similar weak acid stress condition (3-hydroxypropionic acid) [105]. Also included
41

was a negative control, alanine, which was not expected to be beneficial based on
SCALES fitness data and not found in previous weak acid stress work. As can be seen
in Figure 3.4b, the two amino acids associated with the genes exhibiting the highest
fitness, arginine and methionine, restored 71% and 62% of the growth rate,
respectively. Threonine and lysine restored 29% and 26% of growth, respectively.
Figure 3.4c shows that the first committed step in pyrimidine ribonucleotides de
novo biosynthesis is catalyzed by the product of genes (pyrI, pyrB, pyrL) with high
fitness. Thus, we hypothesized that supplementation of pyrimidines would result in
improved growth characteristics. To assess this, we tested the growth rate of the
control strain in minimal media with 2.5 g/L acetate, supplemented 0.4 mM of each of
the following nucleotide bases: cytosine, guanine, adenine, thymine and uracil. As
seen in Figure 3.4d, two pyrimidines, cytosine and uracil lead to ~30% and ~70%
restoration of specific growth, respectively. The purines and thymine did not
significantly increase growth rate.
We next attempted to find combinations of supplements that would further
increase growth. We combined three amino acids (arginine, methionine, and lysine)
and two pyrimidines (uracil and cytosine) predicted by the data and shown in Figures
3.4b and 3.4d to benefit growth. All ten combinations of two different supplements were
tested. We found that the best combination of supplements was what would be
expected from the individual supplement data (Figure 3.5). The increased specific
growths were 60%-90% of what would be expected if the increase in growth rate of the
combinations were purely additive.
42

a
43

b
44

3.4c
45

3.4d
Figure 3.4 - Supplementation growth studies
a) Metabolic pathways of selected amino acid and related pathways. This metabolic map shows the pathway flow of a part of the E. coli metabolism. Each reaction is represented by an arrow, the gene(s) that code for the enzyme that catalyzes that step is shown alongside its gene fitness. b) Confirmation of findings from metabolic maps. Certain amino acids were supplemented at 10 mM to E. coli cultures under an acetate stress of 2.5 g/L. c) Metabolic pathway of pyrimidine ribonucleotide de novo biosynthesis. Also shown is the side pathway for cytosine and uracil to entire the pathway. Each reaction is represented by an arrow, the gene(s) that code for the enzyme that catalyzes that step is shown alongside its gene fitness. d) Confirmation of findings from metabolic maps. Nucleotide bases were supplemented at 0.4 mM to E. coli cultures under an acetate stress of 2.5 g/L.
46

Figure 3.5 - Combination of supplements
The top five tolerance-conferring supplements were combined in twos. The amino acids were supplemented at 10 mM and the nucleotides were supplemented at 0.4 mM. Meth = methionine, Arg = arginine, Lys = lysine, Ura = uracil, and Cyto = cytosine.
47

3.3.5 Genetic strategies to increase acetate tolerance
In addition to supplement strategies, we constructed 10 clones overexpressing
individual genes assigned high fitness by our summarization procedure described
above. We then tested these clones for an increased growth rate in the presence of
acetate. Interestingly, we found that individual overexpression of any of the genes
produced highly variable increases in growth rate. In fact, while we did observe average
increases in growth rate on the order of 5-15%, the variation was high enough that we
could not conclude that any of the growth rates were significantly different than that of
the control. These clones constructed after SCALEs analysis were tested under
conditions similar to the selection. However, slight variations in initial pH has a large
effect on whether the weak acid is in the associated or dissociated state, so intracellular
concentrations of acetate may vary greatly from test to test. Also, it is important to note
that these reconstructions were made in a different vector than the library (pEZseq for
reconstruction, pBTL-1 for the library). While the features of the vector are similar (both
have a pLac promoter), it is thought that this change may also have had an effect on the
growth rate of these clones in acetate.
In addition to reconstructing the top fitness clones, ten clones were picked
directly from sample plates at the end of the selection. The plasmids in each clone
were sequenced (Table 3.2) and growth was studied under selection conditions (Figure
3.6). Each tolerant clone taken from the selection contained the lpcA gene. While all
these clones contained the same gene, they were not the same clone. Each insert in
the plasmid was a different size.
48

Clone Insert Start on Genome
Insert Stop on Genome
Insert Size Gene in insert
A 2819954 2822492 2538 recA B 2369713 2372768 3055 pmrD C 2818903 2822432 3529 recA D N/A N/A N/A Blank vector E 243415 244229 814 lpcA F 3766534 980620 ? Multiple insert Clone G 243413 244325 912 lpcA H 243429 244951 1522 lpcA I 2857854 3336956 ? Multiple insert Clone J 243418 245587 2169 lpcA
Table 3.2 – Identification of Inserts from Picked Colonies
Post-selection clones were picked and sequenced. Inserts of clones are identified through sequencing. Multiple insert clones are those that contained more than one ligation inserts, so the true insert size could not be determined. N/A = not applicable. ? = unknown.
49

Figure 3.6 – Growth Rate of Selected Picked Clones
Growth rates of selected clones in 1.75 g/L acetate and MOPS minimal media. n=3.
50

3.4. Discussion
Acetate has long been a challenge in the biotechnological processes requiring
fast growth, such as recombinant protein production or chemical production [113]. Initial
efforts focused on reducing the amount of acetate produced by the cell, and were
generally accomplished by deleting genes in acetate producing pathways. The
lignocellulose hydrolysate problem is fundamentally different. The microbe is not
producing the inhibitor, but subjected to it extracellularly at the outset. Thus, in order to
achieve a more efficient process, mechanisms of tolerance must be elucidated and then
engineered into a host organism.
The SCALES method has been used multiple times previously in E. coli in order
to find a variety of desirable phenotypes (e.g. high growth rate, anti-metabolite
tolerance, naphthol tolerance, 3-HP tolerance) [79, 81, 103, 104]. The method has
proved effective in finding clones with improved growth rate properties. The selection
employed here was designed to examine the detrimental effects of the acetate anion
specifically as opposed to low pH in general, which is already reasonably well-studied
[114]. The anions of weak acids are known to inhibit growth, with different anions of
weak acids exhibiting different levels of toxicity [96]. The mechanisms of inhibition by
such anions are not well understood.
This is not the first time that acetic acid stress response has been studied with
microarray technology. In previous studies, transcriptional profiling was performed.
Both studies showed a general stress response, with one showing increased motility
transcripts and decreased carbon uptake transcripts [69, 115]. The method presented
51
here differs fundamentally from these by monitoring plasmid amounts, rather than RNA
transcripts.
3.4.1 Transcriptionally regulated steps key
Our SCALES studies yielded genome-wide, multi-scale data, which can be used
to identify genes, operons, genetic elements, or combinations thereof beneficial to
growth in a particular environment. The clones conferring the highest acetate-relevant
fitness, while containing varied genetic elements, shared a few key patterns. First, the
genes that conferred the highest fitness often corresponded to a key transcriptionally
regulated step within a specific metabolic pathway. In the case of murC, the addition of
L-alanine is the first transcriptionally regulated step in the peptidoglycan biosynthesis III
pathway (according to ecocyc.org). Another example is argA, the first committed step in
the arginine biosynthesis pathway. A third example involves the conversion of malate to
fumarate, which is the most regulated step in the TCA cycle. There are three genes
that code for an enzyme which performs this reaction. Two of those, fumB and fumC
had a very high fitness value. Fourth, the first committed step of pyrimidine
ribonucleotides de novo biosynthesis is catalyzed by L-aspartate carbamoyltransferase.
This enzyme is coded for by the pyrLBI operon, where pyrL is a leader peptide, pyrB is
the catalytic subunit of the enzyme and pyrI is the regulatory unit. Each of these genes
conferred high fitness. In cases where the end product of a pathway is important, one
might expect to see that all of the genes in that pathway have a moderately high fitness
(as was observed in Warnecke et al.) [105]. While we did observe this phenomenon in
a few cases (such as the L-lysine biosynthetic pathway), we most often observed
enrichment for genes corresponding to the key regulatory step in pathways relevant to
52

acetate stress. One explanation is that acetate is a natural E. coli metabolite, which is
different from the non-natural metabolite (3-hydroxypropionic acid) studied by Warnecke
et al (2008) [104]. Given the combination of increased copy number libraries with a
leaky promoter (one that constitutively expresses genes at a low level) upstream of
cloned library insert regions, it is reasonable to speculate we selected for clones that
were deregulated in key pathways for acetate tolerance.
3.4.2 Products of pathways with high fitness genes confer tolerance
It is well known that E. coli is more tolerant to chemical inhibitors when grown in
complex and rich media. The present study shows the components of complex media
may not all aid in toxin tolerance, and those that do aid tolerance do not aid equally.
Genes that consume acetate and are involved in certain metabolite biosyntheses were
found to possess high fitness. First, the product of the gene acs encodes an enzymatic
function that could increase acetate catabolism in E. coli. That is, Acs converts free
acetate into acetyl-CoA, a central metabolite that feeds into various pathways involved
in amino acid biosynthesis, among many others. For example, acetyl-CoA feeds into
the arginine pathway through the activity of another high fitness gene (argA). Similarly,
acetyl-CoA can enter the TCA cycle, which connects pathways for biosynthesis of
lysine, threonine, and methionine. These pathways all also contain high-fitness genes.
Based on the latter findings, we devised supplementation strategies using amino acids
as well as pyrimidines.
We observed that addition of arginine, methionine, threonine, lysine, uracil or
cytosine was sufficient to offset the growth inhibition resulting from acetate addition to
minimal medium. Based on prior efforts [105], and the SCALES studies described
53

above, this result was expected. A previous study examining the proteomic response
demonstrated increased expression levels of amino acid transporters including ArtI,
which imports arginine [116]. However, it was unexpected that genes associated with
threonine biosynthesis were not found to have high fitness after selection, even though
threonine addition did improve growth. Furthermore, it was surprising that neither
glutamate or aspartate addition significantly increased growth rate, even though both
are key reactants in the synthesis of arginine, threonine, lysine, cytidine-triphosphate,
and uridine-triphosphate and were previously shown to exhibit depleted intracellular
pools [43]. This may occur since these amino acids are metabolically before the key
regulated step in the pathways that produce the tolerance-conferring metabolites.
Supplementation of glutamate and aspartate would thus not alleviate the need for the
tolerance-conferring metabolites if they cannot get past these important, regulated
steps. The THF cycle is of particular interest. It has been seen as an area affected by
weak acids in previous selections [105]. The THF cycle is an important area for further
analysis since it is a part of a large number of metabolic pathways.
The pyrimidine ribonucleotide de novo biosynthesis pathway (PRdnBP) produces
UTP and CTP. The pathway does not directly use a pyrimidine base, but cytosine and
uracil can be converted to uridine-5'-phosphate via the salvage pathways of pyrimidine
ribonucleotides. Supplementation of cytosine and uracil would bypass the aspartate
carbamoyltransferase-catalyzed step, which is regulated. Initially, we were surprised
that addition of thymine to the media did not increase the growth rate similar to cytosine
and uracil, since thymine is also a pyrimidine. However, thymine, unlike the other two,
is not a part of the pyrimidine salvage pathway and thus cannot be incorporated into the
54

PRdnBP. Uracil increases the growth rate much more than cytosine. This may be due
to the extra step necessary for cytosine to enter the PRdnBP, since cytosine must first
be converted to uracil.
3.4.3 Extracellular functions important
The third general area where top-ranked genes were found is membrane
functions. Genes such as yjdL, murC, other membrane-bound proteins, and genes
involved in the production of outer-membrane structures may prove crucial in the
protection of the cell from acetate stress. Another gene of interest that did not appear in
SCALEs data with high fitness, but was isolated from dilution plates at the end of the
selection was lpcA. This gene codes for the enzyme sedoheptulose 7-phosphate
isomerase, which catalyzes the first committed step in ADP-L-glycero-β-D-manno-
heptose biosynthesis, a core component of lipopolysaccharide. This gene is the subject
of further study in the laboratory.
3.4.4 Acetate a complex target
Acetate is a central and highly regulated compound, which functions not only as
a metabolite but also as a regulatory molecule. This complex role complicates our
studies, as well as those of others attempting to identify acetate modes of action. Our
results suggest that acetate inhibition does not happen through a single inhibited target,
rather we observe a broad range of genes capable of mediating at least some of the
acetate based growth defect. These observations were confirmed via our
supplementation studies, where addition of various amino acids and nucleotide bases
into the media led to better growth characteristics. Collectively, these observations
promote the future use of new methods for searching for combinations of genes that
55

further enhance tolerance [99, 100]. The identification of strains that can tolerate high
levels of acetate would be useful not only in cellulosic biofuels production but also in
any biotechnology application where overflow metabolism is a significant challenge.
56

Chapter 4:
Using genome-wide and targeted tools to engineer acetate tolerance
in E. coli for improved cellulosic biofuel production
Authorship:
Sandoval, N.R.
Kim, J.Y.H
Glebes, T.Y.
Reeder, P.
Aucoin, H.A.
Warner, J.R.
Gill, R.T.
4.1 Introduction
Beneficial phenotypic traits in microorganisms arise from changes in the
microorganisms’ genotype. In nature, random mutations occur over time. When the
change in genotype is detrimental (which is more often than not), the mutant is
eliminated from the population; when the mutation is neutral, the mutant is maintained in
the population. In some rare circumstances, the mutation may be beneficial, whereby
57

the mutant increases its proportion in the population [117]. In directed evolution, the
goal is to direct this natural occurrence of trial and error to a beneficial end.
The mutational search space of the E. coli organism (i.e. the entirety of possible
mutations in E. coli) is far too large to effectively search all possible permutations of the
genome (~44,600,000). Laboratory methods are limited to searching roughly ~109 unique
mutants. Strategies for defining and producing a relevant set of mutations and then
exhaustively searching that reduced set are required at the genome scale. These
approaches require high-throughput methods for introducing directed mutations and
then afterwards quantifying the effect of these mutations on the desired trait. New
multiplex synthesis and recombination technologies are enabling the construction of
such methods.
Microarray technology has allowed for fast and inexpensive population-wide
genotyping. Scalar Analysis of Library Enrichment (SCALEs) and a related predecessor
Parallel Gene-Trait Mapping (PGTM) use microarrays to analyze whole genomic library
selection populations [81, 118]. Recent advances in multiplex synthesis of DNA in vitro
and recombination have made recombination with synthetic DNA a viable option for
genome engineering [119-125].
The Multiplex Automated Genome Engineering (MAGE) method does
recombination with pooled single-stranded DNA oligonucleotides (or simply ‘oligos’; 70-
90 nucleotide long ssDNA) with fully or partially degenerate sequences [99]. These
degenerate oligos specifically target the ribosomal binding site (RBS) of previously-
chosen genes, resulting in altered gene expression. The recombination, which can be
58

done with very high efficiency (>20% at times with ssDNA), takes place recursively so
that within the population there exist mutants that have multiple mutations [120, 121,
124]. This automated process allows for the generation of billions of unique
combinations of RBS mutants.
While MAGE is appropriate for a pre-determined set of targets, it is limited in
scope to up to 30 genes. Trackable Multiplex Recombineering (TRMR) was developed
to speedily identify specific genes that have an effect on a certain trait on a genome-
wide scale [1]. TRMR uses those same advances in synthetic DNA production and
recombination technology, but has unique features. TRMR targets nearly every gene in
E. coli K12 with both a double-stranded ‘UP’ or ‘DOWN’ insertion cassette. This
insertion cassette includes a promoter and a strong RBS for the UP cassette and no
promoter and weak RBS for the DOWN. Both versions of the insertion have a
blasticidin resistance marker and a unique 20 bp barcode tag for use with microarrays.
The resistance marker is important due to the fact that recombination efficiency is low
for double stranded DNA recombination.
We propose a strategy where these two approaches, a trackable genome-wide
binary mutation library (TRMR) tool and a tool that generates multiple mutations over
certain targets (MAGE), are combined to effectively search an extremely large
mutational search space. First, a selection is performed on the TRMR library and the
results are analyzed. The fittest mutants from that selection are chosen as targets for
the generation of a MAGE library, thus limiting the scope of further exploration. A
selection is performed on the MAGE library, which explores a much deeper search
space. We describe here the results of our efforts to utilize such a strategy through two
59

model systems with practical implications: acetate tolerance and growth on corn stover
hydrolysate.
60

Figure 4.1 - Overview of two step mutation and selection strategy
a) The TRMR library (middle circle) is generated by introducing mutations into wild type E. coli (inner circle). A selection is performed yielding data on high-fitness mutants. b) A few mutants are chosen to be targets for further study. c) A MAGE library is constructed where mutations are made via recursive recombination, generating a large diversity of clones with one or more mutations. d) A selection is performed on the MAGE library to yield most tolerant clones
61

4.2 Materials and methods
4.2.1 Bacteria Plasmids and Media
E. coli K12 (ATCC #29425) was used for double stranded DNA trackable
multiplex recombineering (TRMR) clone reconstructions. Plasmid pSIM5 was provided
by Donald Court and used for the double stranded DNA recombination [122]. E. coli
strain SIMD 70, derived from a strain called SIMD 50, was provided by Donald Court
and was used for single stranded DNA recombination [126]. Overnight cultures used
Luria-Bertani (LB) medium. Samples on solid media were with LB media and agar
unless the antibiotic blasticidin was used, in which case a low-salt LB media with agar
was used. MOPS minimal media was used as described. Pretreated corn stover
cellulosic hydrolysate was provided by the National Renewable Energy Laboratory
(Golden, CO). Blasticidin was used at a working concentration of 90 µg/mL.
Chloramphenicol was used at a working concentration of 20 µg/mL.
4.2.2 TRMR Library and Selections
The TRMR library had been prepared in the Gill laboratory previous to the
present study [1]. Preparation of the TRMR library for all selections and the sample
populations for microarray analysis were done according to the instructions of the
author [1]. Frozen stocks of the up and down library as well as control strain JWKAN
were thawed and recovered separately in LB medium for over three hours until
exponential growth was observed. All TRMR selections were performed at 37°C in a
shaking incubator rotating at 225 rpm.
62

Selections in acetate were performed in 200 mL of MOPS minimal medium with
0.2% glucose and 16 g/L acetate. Stock acetic acid solution was prepared by titrating
HPLC-grade 50% acetic acid solution (Fluka) on ice with 10 M KOH to neutral pH.
Portions of the up and down libraries were mixed for an equal number of cells. The
JWKAN strain was introduced into the library mix so that the JWKAN strain started with
roughly 20 times the number of the average TRMR mutant present in the library, or in a
ratio of 1:400. This final library mixture was introduced into the selection environment at
a 2.5% inoculation. The acetate selection was performed for 69 hours.
Selections in hydrolysate were performed as described previously [1]. Briefly,
selections were performed in a decreasing concentration of hydrolysate over three
batches (20%, 19%, and 18% in that order).
4.2.3 TRMR Sequencing and Microarray Analysis
Final and pre-selection cultures were harvested for microarray analysis and
aliquots of final selection cultures were sampled onto solid LB plates for colony picking.
One billion cells (109) per sample were taken to ensure a representative population.
TRMR barcodes were amplified from extracted genomic DNA via PCR as described
previously (Promega Wizard Genomic DNA Purification kit or Invitrogen PureLink
Genomic DNA Kit) [1]. The barcode DNA was purified after being run on an agarose gel
via a gel extraction kit (Qiagen). From each sample, 600 ng of the sample barcode tags
were applied to the Geneflex Tag4 16K V2 array (Affymetrix) and the resulting data was
analyzed as described previously [1].
Control tags were supplemented in known quantities so that calculations of the
63

concentration of sample barcode tags might be made from the array signal. The
concentration of each allele was divided by the total amount of sample DNA applied to
the array to calculate the frequency of each allele. The fitness of each allele (W) was
calculated by dividing the post-selection frequency of the allele by the pre-selection
frequency of the allele.
Individual clones were genotyped by amplifying the barcode region of the insert
via PCR and then subsequently sequenced conventionally.
4.2.4 TRMR Clone Reconstruction
TRMR clones were reconstructed in E. coli K12 via recombination using the
pSIM5 plasmid. TRMR up and down inserts were amplified from genomic DNA
extracted from the library population. Fifty base pairs of homology were added to each
end of the insert specific to the desired location of insertion. The homology regions
chosen were identical to those in the original TRMR library. Recombination was
performed at 30°C as previously described [123]. Recombination recovery cultures
were plated onto low-salt LB with agar solid medium with blasticidin. To ensure the
TRMR insert was located in the proper location and orientation in the genome, the
surrounding region was amplified via PCR, purified, and sequenced.
4.2.5 Growth Studies
Stationary phase overnight cultures were used for a 2.5% inoculation of 5 mL
MOPS minimal medium in a 15 mL centrifuge tube. These cultures were monitored
until the optical density at 600 nm (OD600) reached 0.200 ± 0.01. A 4% inoculation was
introduced into the growth test medium. The optical density (OD) was subsequently
64

monitored. For growth studies involving hydrolysate, 1 mL of culture was centrifuged,
decanted, and resuspended in water or minimal media before the OD was observed.
4.2.6 Library Construction of Mutated Ribosomal Binding Site
The mutated ribosomal binding site (RBS) libraries were constructed via λ-red
recombination. The previously-mentioned SIMD 70 was used as the base strain for the
recursive multiplex recombineering.
Single stranded DNA oligonucleotides were designed to replace the RBS of the
previously selected gene target with either a partially or completely degenerate
sequence according to the allele found in the TRMR selection. The oligo pools had an
eight-base degenerate sequence five bases upstream of the target’s start codon. The
up allele oligo pools were designed with the sequence 5’-DDDRDRRD-3’ (where D = A,
G, or T and R = A or G). The down allele oligo pools were designed with the completely
degenerate of sequence 5’-NNNNNNNN-3’ [99]. On either side of the degenerate
sequence a 41-base homology region specific to the target [124]. The first four 5’ bases
are linked with phosphorothioate bonds in order to reduce single stranded exonuclease
activity [124]. The oligonucleotide was designed so that the sequence was that of the
lagging strand, which has been shown to increase recombination efficiency [119-121].
The SIMD 70 strain has a galKtyr145UAG mutation that disables the strain from
metabolizing galactose. An oligonucleotide that corrects this mutation to code for a
functioning galK gene (mutated region 5’-…CAACTATATCACCTA…-3’, corresponding
with oligo 478 in [124]) was used in conjunction with MacConkey agar plates with 1%
galactose to test for recombination efficiency.
65

Multiple rounds of recombination were performed on SIMD 70 with the various
mixed oligo pools. Recombination was performed at 30°C as previously described
[123]. After each round of recombination, the recombined cultures were allowed to
recover for 1-2 hours in adequately prepared Terrific Broth. The recovery culture was
then used to inoculate a Luria Broth culture for the next round of recombination. If the
cells were not immediately recultured, the recovery culture was pelleted and chilled at
4°C until further use. The galK+ oligo was spiked in at a rate of 1:20 so that the
recombination frequency of the final library could be tested on MacKonkey agar with 1%
galactose.
4.3 Results
In order to find solutions to the problem of inhibition due to various conditions, a
proper search must be done. The search space of mutations in the E. coli genome
(~44,600,000) is too large for laboratory methods and time scales. Traditional methods of
directed evolution involve long time course adaptation, where the microorganisms are
grown over many generations for months or years [76, 127]. This process can be
quickened by artificial means of random mutation, but the problem remains that after
screening or selection, a mutant with the desired phenotype may have relatively few
point mutations in various places across the genome, and of those, very few will be
beneficial [97]. This complicates the identification of beneficial mutations [128].
Random mutagenesis and long time course adaptation methods, while producing
successful results, do not have the power to effectively explore a large relevant search
space and allow for large population genotyping.
66

Now, with the advent of genome engineering tools such as TRMR and MAGE,
we are able to search an immense number of relevantly mutated clones. First, a TRMR
selection is performed. A broad (genome-wide) search of relevant mutations (those
which are likely to cause changes in gene expression) over a limited depth (‘UP’ or
‘DOWN’ mutations) is done to limit the number of unique clones (~8,000). Secondly,
those genes with the highest fitness according to TRMR are selected as targets for
MAGE library construction. Lastly, the MAGE library is subjected to a focused (<30
genes) search of relevant mutations (modified RBS to alter gene expression) over a
deep range of sequences (i.e. multiple mutations per clone and degenerate sequences
in the oligo pool).
The present study uses two growth conditions to show this search strategy.
Acetate and corn stover hydrolysate were chosen to demonstrate how the method
works under various metabolic conditions. Acetate is a metabolite that is well known to
the cell, can enter into the central metabolism to be used as a carbon source, and can
affect regulation within the cell. Corn stover lignocellulosic hydrolysate (provided by the
U.S. National Renewable Energy Laboratory) is a complicated mixture of various
hexose and pentose sugars, acids (acetic, formic, etc.), phenolic compounds from
lignin, and aldehydes (furfural, HMF) derived from sugar degradation. Hydrolysate is a
mixture containing a wide variety of sugars and toxins, thus making accurate predictions
of what changes in the genotype might yield better growth very difficult.
67

4.3.1 TRMR Selections and Microarray Analysis
As previously shown, the TRMR tool can be used to identify mutations that effect
tolerance to a variety of environmental stresses. Here, we applied the TRMR strategy
to the previously mentioned three conditions.
The TRMR selection on acetate took place in MOPS minimal media with 0.2%
glucose and 16 g/L acetate over the course of 69 hours. Samples were taken before
the selection and after for microarray analysis (Figure 4.2). It is through barcode
microarray technology that whole population genotyping is possible. Each allele’s
fitness was calculated by dividing its post-selection concentration by its initial
concentration, which was calculated by comparison of control DNA added to the
microarray with known concentrations. The fitness reflects the change in population
over the course of the selection, rather than the end population only. Table 4.1 reports
the top fitness mutants.
68

Figure 4.2 - Fitness of Mutants
Circle plot showing the result of TRMR analysis of acetate selection. Natural log of allele fitness is mapped over E. coli genome. Peak location represents location of clone in E. coli genome; peak size is relative to fitness. Colors denote the type of mutation in the clones: red spikes indicate an ‘up’ mutation, blue spikes represent ‘down’ mutations.
69

Rank Fitness genE:insert Function
1 3980.3 serS:downtag seryl-tRNA synthetase 2 102.7 tap:uptag methyl-accepting chemotaxis protein IV 3 78.5 yahF:downtag predicted acyl-CoA synthetase 4 61.2 yjdM:downtag conserved protein
5 45.9 deoA:downtag Thymidine phosphorylase in pyrimidine salvage pathway
6 42.0 aspS:downtag aspartyl-tRNA synthetase 7 40.8 fabH:downtag β-ketoacyl-acyl carrier protein synthase III
8 31.3 ynfM:downtag member of the major facilitator superfamily (MFS) of transporters
9 30.3 rimL:downtag ribosomal-protein-L12-serine acetyltransferase 10 25.1 ycbS:downtag predicted outer membrane usher protein 11 24.5 ydiA:downtag PEP synthetase regulatory protein (PSRP) 12 24.1 tqsA:downtag quorum signal AI-2 exporter 13 20.9 sdaA:downtag L-serine deaminase I 14 20.8 exuR:uptag DNA-binding transcriptional repressor
Table 4.1 – Top Fitness Mutants from TRMR 16 g/L Acetate Selection
The top 14 mutants (W > 20) from TRMR 16 g/L acetate selection are listed with the type of mutation and function described.
70

In calculating fitness, a few issues may arise that will affect the accuracy of the
fitness value. These mainly stem from the limited range of the signal from the array.
When analyzing the microarray data, a single allele’s signal may fall into three distinct
categories of signal quantity. The signal may be (i) at or below the baseline signal
indicating not enough DNA to quantify, (ii) within the range of the control probe signals,
which allows for a reasonably accurate calculation of concentration, or (iii) above the
maximum control probe signal, which results in an inaccurate calculation of
concentration, usually erring by overestimation. Since this calculation must happen
twice to compute fitness (both final and initial allele concentrations are needed), there
are nine possible outcomes of the fitness calculation, with only one providing an
accurate reading.
Accurate fitness values are obtained when both the final and initial allele
concentration falls within the range of the signal of the control probes. If the final allele
concentration of DNA is too low to read, we assigned a fitness of zero regardless of the
initial value. Since usually only high fitness mutations are imporant, this is no great
loss. In fact, this is to be expected, as a selection surely will reduce the diversity of the
population to the point where detrimental mutations will be eradicated.
When the final allele signal is within an appropriate range, and the initial allele
signal is below the threshold of detectable signals or above the range of control probes,
a fitness calculation cannot be accurately done. In the case where the initial signal is
below threshold, the initial concentration effectively zero, thus preventing division.
Fortunately, in the over 8,000 alleles possible, and over 2,000 alleles with a final
population signal over threshold, this occurs seven times in this acetate selection (<
71

0.4%). In the opposite case (final within range, initial above range), the initial
concentration is set to a maximum value corresponding to half the amount of DNA
added to the microarray. In these cases (20/2078, ~1% of the acetate selection) the
fitness is less than one and these alleles are not considered further.
Now we will consider the case where the final allele concentration is above the
range of the control probes. It is unlikely that there is a case where an allele is below
threshold in the initial population, yet over the course of selection it grows so well that it
is above the upper bounds of the final array. If this were to happen, the fitness could
not be accurately calculated, but the allele would be of great interest. This did not occur
in the acetate selection. It is much more common that when the final population has
alleles that exceed the upper bound, those same alleles were either within or above the
bounds in the initial array. In the case that the initial concentration can be accurately
calculated, the overly high final allele’s concentration is set to a maximum value
corresponding to half the amount of DNA that was added to the microarray. This upper
limit can lead to a fitness value that is lower than what would be calculated had the limit
not been in place (this happened 14 of 2078 times). This particular situation yields
alleles that are often of great interest since these are clearly a large portion of the
population at the end of the selection. In the case where both final and initial allele
concentrations are above the upper limit, an accurate fitness cannot be calculated. In
the acetate selection, this was the case 34 times out of 2078.
In all cases but the ideal scenario, the fitness value is not accurate. Fortunately,
when the final allele concentration is above the lower threshold (2078 times), the initial
allele population is within the proper range 2015 times (97%). In most of the other small
72

number of cases, we are still able to calculate a fitness value that has reduced
accuracy, but can still yield beneficial information.
The TRMR mutants with a high fitness do not fall into a single category of genes,
metabolic functions, or related substrates. Some do, however, group into a few general
categories of interest. To analyze this data, GOEAST (Gene Ontology Enrichment
Analysis Software Toolkit) was used [129]. Gene names of those mutants with a z-
score above 1.0 (log fitness one standard deviation above the mean, 164 gene names)
were input into the GOEAST program. The program was instructed to yield gene
ontology terms that were statistically significantly overrepresented among the top
mutants (p-value < 0.10).
GOEAST yielded only three gene ontology terms that contained more than two
genes in the term and were statistically significantly overrepresented. While it yielded
four additional GO terms that were statistically significant, the latter had only two genes,
which is not desired since the purpose was to try to broadly characterize the function of
the top fitness genes. The broadest category found was simply ‘gene expression’ which
contained seventeen genes (p = 0.071). These genes contained four genes related to
tRNA (three of which had the down allele) and five genes coding for ribosomal proteins
(two down, 3 up). Three other genes which were contained in this GO term were a part
of another GO term, N-methyltransferase activity (p = 0.058). These genes code for
proteins that methylate ribosomal subunits. Each of these was found with the down
mutation in the TRMR selection. The GO term with the smallest p-value (p = 0.008)
was receptor activity. This general term contains all genes that code for proteins that
accept a chemical messenger that affects cell activity.
73

It seems that while GOEAST may be useful to describe genes which are related
in a selection, it may not be the best for the acetate selection described here. Individual
mutants may yield more information on how mutations may have conferred tolerance. It
is interesting to note how thirteen of the top fifteen mutants in terms of fitness contain
the down mutation. The top mutation found was serS down (W = 3098), which encodes
seryl-tRNA synthetase. Its fitness is so high because of a very small starting
concentration and a very high ending concentration taken from the microarray data.
Another mutation within the top ten in fitness (sixth) is related to the serS mutant: aspS
down (W = 42.0, encoding for aspartyl-tRNA synthetase). It is interesting to note that
these two mutations just mentioned would seem to reduce the amount of available
amino acids for protein production by reducing the amount associated with tRNA.
Another top fitness mutation has a relationship to serine: sdaA down (W = 20.9). SdaA
degrades serine into pyruvate and ammonia, such that the down mutation would
presumingly slow this process.
It is interesting to note that the results from this TRMR selection do not correlate
well to the results of a SCALEs selection done to elucidate acetate tolerance [130].
Whereas the SCALEs selection rendered genes with high fitness that contained
metabolically active enzymes related to amino acid and nucleotide base production, the
TRMR selection rendered genes with high fitness that contained genes related to amino
acids (e.g. serS, aspS) and nucleotides (e.g. deoA), but not in their biosynthesis. This
is to be expected when comparing the results of these two tools. Since in the two
different selections we are not searching within the same space, we cannot expect that
74

the same results will be produced. This confirms the idea that search space and
selections are complicated functions requiring further study.
4.3.2 TRMR Clone Genotyping, Reconstruction, and Testing
To evaluate whether the selection, individual clones must be tested for growth
under selection conditions. This was done in two ways. The first was to directly take
clones from the final selection population by picking colonies from sample plates. This
method is facile since it involves little work to obtain the clone. In order to determine
which mutation the clone has, a PCR reaction is performed to amplify the barcode tag
within the insert which is subsequently sequenced. While this method is simple, it may
not result in obtaining the top fitness clones from the selection. Since fitness is based
on the change in proportion of the population (final divided by the initial), and not on the
absolute values, often times the highest fitness mutants are not found picking colonies.
In the acetate selection ten colonies were isolated and sequenced. With the exception
of the prolific elaD up clone (elaD up is found in almost all TRMR selections), all those
sequenced have a fitness value greater than one, meaning they take up a greater
proportion of the population after the selection than before it (Table 4.2). These clones
should be more resistant to acetate stress when compared to the control (a strain with
no effective mutation) and other mutants with a fitness value less than one. While these
clones do have a fitness greater than one, these are not the top fitness clones from the
selection. When tested for growth, no significant increase in growth was observed (data
not shown). Their fitness ranges from 2.2 to 8.3 (putting them between 309th and 53rd in
rank among all clones). Another method must be employed to observe the growth
characteristics of the top performing mutants.
75

Clone Gene ON/OFF Fitness Rank MOPS 69 A elaD ON 1.00 1167 MOPS 69 B yiaW OFF 4.06 144 MOPS 69 C yfbK ON 6.91 65 MOPS 69 D dacB OFF 2.21 309 MOPS 69 E htpX OFF 5.37 92 MOPS 69 F ycjU ON 8.30 53 MOPS 69 G yfbO OFF 3.92 150 MOPS 69 H yciS OFF 3.77 163 MOPS 69 .I. rplI OFF 1.68 443
Table 4.2 – Identification of Picked Clones
Identification of particular clones picked from end point sample plates. The fitness of the particular mutant is shown alongside the rank of that fitness against all other clones.
76

The second method to test selection efficacy is to reconstruct some of the
highest fitness mutants. To do so, the double stranded DNA containing the desired
insert (up or down) and homology regions on either side must first be constructed. The
up or down insert sequence was isolated from the TRMR library via PCR. To generate
the specific insert DNA to be used in recombination, primers were designed to anneal
with the ends of the insert DNA and have ~50 base overhangs on either side that were
specific to the desired insertion site. These insertion sites were chosen to be the same
sites used in the construction of the TRMR library.
Eight clones were chosen to be reconstructed from the acetate TRMR selection
results. The serS down mutant was the clone with the highest fitness from the
microarray data (estimated ln(W) = 8.3). It, along with the yahF down (ln(W) = 4.4),
tqsA down (ln(W) = 3.2) and clcB down (ln(W) = 1.1) mutants, had a chip signal that
exceeded the control probes, so an accurate fitness value cannot be calculated,
although an estimate was made. The deoA down (ln(W) = 3.8) clone rounds out the
mutants chosen with the down version of the mutation. The tap up (ln(W) = 4.6) mutant
had the highest fitness in the acetate selection and was second overall only to the serS
down mutant. Two other up mutants were chosen for reconstruction: ddpA up (ln(W) =
2.7) and znuC up (ln(W) = 2.6). The oligonucleotides that were used to reconstruct
these clones are shown in Table 4.3.
Unfortunately, the TRMR reconstruction was problematic. After a considerable
amount of time, only six of the eight have been constructed: tap, ddpA, and znuC up
and deoA, tqsA, and clcB down.
77

As shown in Figure 4.3, four of the six reconstructed clones tested had
statistically significantly higher growth in 16 g/L acetate after 24 hours, while two of the
nine picked clones had a statistically significantly higher growth. The constructed clone
tap up performed the best, 46% higher growth compared to the control. The tqsA and
clcB down clones grew 31% more than the control. The ddpA up clone grew 21% more
than the control. Disappointingly, the other two tested reconstructed clones performed
no better than the control, especially the deoA down clone, which was in the top five
clones within the selection in terms of fitness. This leads us to conclude that the
selection may have a moderately high false positive rate, meaning there is a significant
portion of the clones listed with a high fitness in the selection that do not increase
resistance to acetate.
The rplI and yiaW down clones, picked from plates after selection, also had a
higher growth, but only 11% and 9% better than the control, respectively. The
remaining picked clones did not significantly increase growth. This shows that fitness is
a better indicator of which clones will grow better under stress conditions compared to
simply picking clones at the end of the selection.
78

Primer Sequence
serS DOWN FOR GTCGCAGGCTGTGGCCACATCTCCCATTTAATTCGATAAGCACAGGATAAGCGTAGCACACGAGGTCTCT
serS DOWN REV TTTTTCAGCGACTGCGTCTGGCTCATTACGCAGCAGATTGGGATCGAGCATGGAGGAGATAACGG
yahF DOWN FOR CTGTATGGCATGGCCGATGGTTGTGCGCTGAGCCAAACCTACGGAGGGAATTGTAGCACACGAGGTCTCT
yahF DOWN REV CGAGACAGAATCAAAATAGGTATTCGGTTTAATGACTATTTTAACTGACATGGAGGAGATAACGG
tqsA DOWN FOR CGGAGCGAAAAAGACATTATTATTAGCAAAGGAAGAAAAAACGGGGACAAGCGTAGCACACGAGGTCTCT
tqsA DOWN REV CAACATAATGACGATTTTTAGGCCATTGAGCGTGATGATCGGCTTTGCCATGGAGGAGATAACGG
deoA DOWN FOR GTAGACGCATCCGGCAAAAGCCGCCTCATACTCTTTTCCTCGGGAGGTTACCGTAGCACACGAGGTCTCT
deoA DOWN REV CAGCGCATGACCATCACGTTTTTTACGAATAATTTCTTGTGCGAGAAACATGGAGGAGATAACGG
clcB DOWN FOR TTGCCCATTTCTGCTCATGCATCATCTACACATCTATCCGGATCTGCGCACTGTAGCACACGAGGTCTCT
clcB DOWN REV AAAGGCCGCGAGAATACCGACGACTGTTGCGATAAGCAGACGGTGGAACATGGAGGAGATAACGG
tap UP FOR ATTTTGACGAGTATTTACTAACGCGGTCATTGCCGCCTGATGGGGAGCGTTGGTAGCACACGAGGTCTCT
tap UP REV GAGAATCAAAATTAAAAACAGCGTGGTCGAAATTCGAATACGATTAAACATTTATCACCTCCTTACG
ddpA UP FOR TCTTGTTTTATATCCCCTGGCACACAGCACGTCAGTTAATCAGGAAACTGTCGTAGCACACGAGGTCTCT
ddpA UP REV GGCAAGGACGAGCGCGAGCAATGTGGGACGAAACGATATCGATCTCTTCATTTATCACCTCCTTACG
znuC UP FOR TGAGAAGTGTGATATTATAACATTTCATGACTACTGCAAGACTAAAATTAACGTAGCACACGAGGTCTCT
znuC UP REV GCGTTGGCCAAAAGAAACCGAGACATTTTCCAGGGAAACCAGACTTGTCATTTATCACCTCCTTACG
Table 4.3 – TRMR Clone Reconstruction Primers
The ssDNA primers used to generate the dsDNA insert to reconstruct TRMR clones found with high fitness in the acetate selection are shown. The italicized portions of the sequence are those common regions that anneal to the TRMR insert. The non-italicized region constitutes the homology region for specific insertion.
79

Figure 4.3 – TRMR Clone confirmation
Growth study of selected clones. TRMR mutants were tested for growth over 24 hours in 16 g/L acetate. The gene name and arrow refer to the location and type of mutation for each clone. The number beneath the mutant name is the natural log of the fitness for that clone.
80

4.3.3 Consideration of Practicalities for Engineering Strains with Multiple
Mutations
With the goal of engineering a strain containing multiple mutations which each
positively affect the growth characteristics, genes which had mutants with high fitness in
TRMR selections were chosen for further study. It is in this section that the practicalities
and mathematics of such a goal must be addressed before moving on to the laboratory
results on the matter. In the grand scheme employed here, this is the middle stage
transitioning from a broad (genome-wide) space in a high-throughput (via microarray)
manner to a deep, but narrow space (multiple mutations, with combinations thereof)
requiring more labor intensive genotyping.
The method employed here to generate multiple mutations is very much like a
previously described method, Multiplex Automated Genome Engineering (MAGE) [99].
It is said to be like MAGE, but not MAGE, in that there is no automated portion of our
method. For convenience, in referring to the method in this work, the term MAGE will
be used with the understanding that we have no automated device. MAGE uses
multiple rounds of single stranded DNA (ssDNA) recombination to replace the native
ribosomal binding sites (RBS) of target genes with degenerate sequences from
synthetic ssDNA.
Like TRMR, MAGE uses recombination to make mutations that are very specific
in location and nature so that these mutations effectively alter the expression of the
targeted gene. There are differences as well. TRMR employs a library of single-
mutation clones that encompasses 97% of the genes in the E. coli genome, while
81

MAGE is limited to a relatively small number of genes (up to ~30). This recusive
multiplex recombineering method (i.e. MAGE) has the ability to generate multiple
mutations per clone.
TRMR clones have a blasticidin resistance cassette, ensuring every clone in the
population has a TRMR mutation. This, however, makes the generation of multiple
mutations difficult since inserting a large cassette that includes an antibiotic resistance
marker requires double stranded DNA (dsDNA) recombination and either the removal of
the antibiotic resistance marker before making multiple mutations or the use of a
different resistance cassette. Single stranded DNA recombination, which is used in
MAGE, has a much higher efficiency of successful recombination when compared to
dsDNA insertions [119, 120, 124]. The much higher efficiency allows for the generation
of multiple mutations if done recursively (i.e. recombination upon an already recombined
population). However, an antibiotic resistance cassette is too large to be inserted with
ssDNA, so MAGE is limited in what mutations it can make since there is no selective
marker. MAGE can be done recursively many times and still a portion of the population
will have no mutations at all.
Determining the genotype of the population is different between TRMR and
MAGE as well. Since TRMR uses microarrays, an entire population can be
characterized at once. Individual clones can be identified via PCR amplification and
sequencing of the insert’s barcode tag. Currently, there is no way to genotype an entire
population of MAGE clones. It requires a PCR reaction for every target chosen, limiting
the number of target genes that are practical to engineer.
82

The type of mutation conferred is also different between the two tools. The
TRMR mutations are binary: an ‘up’ cassette containing a strong promoter and RBS and
a ‘down’ cassette which has no promoter and a weak RBS [1]. Because there are only
two mutations possible and ~4,000 E. coli genes, there are only ~8,000 unique
mutations. MAGE, in comparison, is much more complex. Using degenerate ribosomal
binding site replacement sequences, thousands of unique mutations are possible for
each target chosen. Since multiple mutations are possible and desired, the number of
unique possible mutants gets very large.
The TRMR targets from the hydrolysate and acetate targets were chosen from
the top fitness alleles found in the TRMR selections. It is here we transition from
searching a broad space in a high-throughput manner to a very deep, but narrow space.
In order to search individual clones that contain a significant portion of the population
with multiple mutations in the targeted regions, many rounds of MAGE must be run.
Efficiency of recombination is of paramount importance. A greater efficiency of
recombination means fewer cycles of MAGE are required to achieve the same number
of mutants. More importantly, greater recombination efficiency means more multiple
mutants within single clones. Others have shown recombination efficiency under similar
conditions consistently around 20% [124]. Wang et al. (2011) have generated empirical
formulae predicting the recombination frequency of ssDNA recombination based on
their experience and the type and size of the mutation [99, 131]. Based on their
formula, the recombination work presented here should have a per-round efficiency of
10.1%. Our efficiency, as quantified by using an oligo that restores the operational
sequence of the galK gene in the SIMD70 strain (oligo 478 in Sawitzke et al. 2011), was
83

4.4% in the acetate MAGE recombination library and 5.0% in the hydrolysate library
[124]. While this efficiency is lower than the expected efficiency, it is within an
acceptable range.
Since the efficiencies are relatively low, many rounds of MAGE must be
performed so a significant number of mutations, especially multiple mutations, arise in
the population. To estimate the number of mutations per clone and the number of total
mutants, we base our estimates on the galK+ efficiencies obtained during
recombination. We assume that only one mutation can occur per round of MAGE per
clone (not necessarily true, but accurate for estimating multiple mutation clones since
the efficiency is low and double mutations per round are rare), and that there is no bias
in efficiency whether or not a clone already has a mutation. For example, if the
recombination efficiency per round is 10%, then if two rounds were performed we would
estimate that 1% would be double mutants, 18% would be single mutants, and 81%
would have no mutations. The initial estimated population after the acetate MAGE
process (eleven rounds at 4.4% efficiency) is that 61% of the population have no
mutations, 31% have a single mutation, 7.1% have are double mutants, 1.0% have
triple mutations, and the remainder have more than 3 mutations per clone. The initial
estimate for the hydrolysate library after thirteen rounds of MAGE with 5.0% efficiency is
that 51% of the population has no mutation, 35% are single mutants, 11% have double
mutations, 2.1% are triple mutants, and the rest of the population has more than 3
mutations per clone. While in both these populations there is a large portion of
unmutated clones, we are introducing mutations shown to highly affect fitness under the
selection conditions. Under these same selection conditions the control strain did not
84

grow well (control strain fitness = 0.024 in the acetate selection). It is not unreasonable
that we should be able to apply a selection pressure such that tolerant clones will be
enriched amidst the background of the wild type population.
The populations of these double and triple mutants will vary between the two
libraries by the number of target RBS that are chosen for mutation. In the hydrolysate
library, 27 targets were chosen for recombination by Dr. Reeder. Ignoring for now the
variations in the degenerate RBS mutations, there are a total of 702 distinct mutants
which have a mutation in two of the target regions; there are 17,550 unique
combinations of 3 targets. For the acetate MAGE library, however, a relatively small
number of eight targets were chosen. There are a total of 56 two-target and 336 three-
target combinations. To put these numbers in perspective, a selection will typically start
with over 600,000,000 cells. If 10% of the population are double mutants, then each
combination of the double mutants in the hydrolysate selection would occur in over
90,000 clones each for the hydrolysate library and over 750,000 clones for the acetate
library. The more mutations per clone, the more combinations of targets there are and
a smaller portion of the population that falls into that category. Since the number of
unique combinations of targets increases nearly exponentially with multiple mutants (i.e.
single, double, triple and so on), only the single and double mutant populations can be
well-searched.
The previous mathematical analysis is concerned with the initial library of
mutations. Let us ask if it is reasonable that even after a proper selection we should
expect to find a large portion of double and triple mutants in the final selection
population. An assumption of the MAGE process is that mutations of multiple targets in
85

a single clone can function synergistically to yield a clone which has a higher tolerance
to toxin than clones with only the individual mutations within them. This assumption
may hold for many combinations but may not be true for all. It is difficult to predict this
interaction between mutations.
We can classify double mutants in four general categories: antagonistic, less-
than-additive, additive, and synergistic combinations. A synergistic clone has two
mutations, where the increase in the growth compared to the wild type exceeds the sum
of the increase in fitness of the single mutants from which it is comprised. For example,
if two single mutant clones each yield an increase in growth of 25% when compared to
the wild type, a synergistic clone would have a greater than 50% increase in growth. An
additive clone would be similar, but the increase in growth compared to wild type would
be the sum of the individual growth rate increases. A less-than-additive clone is one
where the double mutant’s growth is superior to the single mutant clones, but less than
additive. Incompatible combinations are those where two individual mutations increase
the fitness compared to the wild type strain, but having both mutations present in one
clone decreases the fitness when compared to the original clones. The type of double
mutants that are actually produced in the process will determine what clones are found
at the end of the selections.
Through a simple model, we can see how some of these scenarios would work in
the context of a selection (Figure 4.4). There are four cases of how multiple mutations
could affect the growth rate. We model a selection based on our recombination
efficiencies. The wild type specific growth rate was set to a value typical for a 90%
growth inhibition (0.05 1/hr). An assumption is made that most mutations will be neutral
86

and a small portion (10%) of mutations will be beneficial (increase in growth rate of
35%, as observed). When multiple beneficial mutations are present in a clone, the
mutations’ benefits may be independent of one another (benefits of single mutations are
compounded additively), or the mutations may interact. Interactions may be synergistic
(benefits are 10% higher than additive), less than additive (10% lower than additive), or
antagonistic (growth 15% less than the single beneficial mutation for every additional
mutation). As can be seen in Figure 4.4, after 200 hours of selection, double and triple
mutants quickly become a significant portion of the population in the synergistic model,
more slowly in the additive model, and then even more so in the less-than-additive
model. In the antagonistic interaction model, the double and triple mutants are depleted
in the population. The model is described mathematically in equation 4.1.
( ) ( )∑ ∑= =
⋅⋅−⎥⎦
⎤⎢⎣
⎡−⎟⎟
⎠
⎞⎜⎜⎝
⎛=
5
1 10 1
n
n
r
tfrnrntot e
rantagr
rn
PP μαα Eq. 4.1
Where Ptot = total population, Pn0 = initial population of those with n mutations (based on
laboratory efficiencies), n = number of mutations in a clone, r = number of beneficial
mutations in a clone, α = fraction of mutations that are beneficial, μr = growth rate with r
beneficial mutations, fantag = antagonistic factor, and t = time. The Calculation of μr is
shown in equation 4.2.
( )1+⋅⋅= rff synergyincreaseWTr μμ Eq. 4.2
Where μWT = wild type growth rate (set to 0.05 1/hr), fincrease = fractional increase
in growth rate of one beneficial mutation (set to 0.35), fsynergy = synergy factor, and r =
87

number of beneficial mutations in a clone. The values for the synergy and antagonistic
factors are as follows. For each condition besides antagonistic, the antagonistic factor
was set to one, effectively eliminating it from the equation. For the antagonistic
condition, the antagonistic factor was set to 0.85. The synergy factor was set to 1.1,
1.0, and 0.9 for the synergistic, additive and the less than additive conditions,
respectively. The antagonistic condition also had a synergistic factor of 0.9.
Using these growth rates, a model selection calculated what clones would be in
the final population after some amount of time. As can be seen in Figure 4, after 200
hours of selection, double and triple mutants quickly become a significant portion of the
population in the synergistic model, more slowly in the additive model, and then even
more so in the less-than-additive model. In the antagonistic interaction model, the
double and triple mutants are depleted in the population. The model points to the idea
that if the selection population starts with a relatively small number of double and triple
mutants and the individual mutations are not at least additive in their increase of growth
rate, it should not be surprising to find at the end of a selection a large number of clones
which have only one or even no mutations.
88

a.
89

b.
90

c.
91

d.
92

e.
Figure 4.4 – Model Describing MAGE Selections
a) Construction of a MAGE library. Shown is the theoretical population distribution of a MAGE library if the recombination efficiency is 5.0%. Each round generates more mutations and the construction of multiple mutations over the 13 rounds. b) Synergistic selection: A theoretical selection where 10% of single mutants are beneficial and the combinations thereof are synergistic (increase in growth rate is more than additive). c) Additive selection: Same as (b) but combinations are additive. d) Less-than-additive selection: Same as (b) but combinations are less than additive. e) Antagonistic selection: more than one mutation causes a decrease in growth rate. Time for (b) – (d) is 200 hours, increase in growth rate for beneficial single mutations is 35%.
93

4.3.4 Construction and Selection of MAGE Libraries
Acetate and hydrolysate MAGE libraries were constructed via the MAGE
recombination method. As previously mentioned, these two libraries vary greatly in their
scope. For the hydrolysate library, 27 targets were chosen from the highest fitness
TRMR alleles. Chosen from top alleles in the up direction were ahpC, ptsI, ygaZ, lpcA,
eutL, ygjQ, ydjG, talA, motA, moeA, ilvM, lolC, agaS, ybaB, tonB, nanC, and yedQ.
From top down alleles were puuE, ugpE, ptsI, lpp, yciV, cyaA, ydjG, rseP, lacZ, ybjN,
ybaB, talB, and ydaG (Table 4.4). As mentioned previously, thirteen rounds of
recombination were done with the mixed pool of oligonucleotides including a portion of
galK+ to track replacement efficiency. Replacement efficiency was estimated to be
5.0% per round, so after all the MAGE rounds we estimate the population to be 35%
single mutants, 11% double mutants, 2.1% triple mutants, 0.3% quadruple mutants and
the rest parent strain SIMD 70.
The hydrolysate library population was subjected to the stress of selection in
40% corn stover hydrolysate in otherwise MOPS minimal medium [107]. The selection
occurred for almost 10 days (232 hours). The culture was serially transferred from one
batch to the next to prevent the culture entering stationary phase. There were eleven
batches total, allowing 59 generations. The growth rate was monitored throughout the
selection and after 11 serial transfers the growth rate doubled compared to the initial
batch growth rate (Figure 4.5). After this time, samples were taken and culture was
plated to obtain individual colonies.
94

MAGE Oligo Sequence
ahpC up
T*T*A*A*AAGGTTTAATTTTGGTGTTAATCAAGGACATCTATAGYYHYYHHHTGTTTTCGATGAGATGTAAGGTAACCAATTTTTGCCGATT
ptsI up
A*C*T*C*GAGTAATTTCCCGGGTTCTTTTAAAAATCAGTCACADDDRRCRRDGGGTTATGATTTCAGGCATTTTAGCATCCCCGGGTATCGC
ygaZ up
T*A*A*G*ATATTCATTCAGTCTATTTATAATATTAACAATCGTDDDRRCRRDACTCTATGGAAAGCCCTACTCCACAGCCTGCTCCTGGTTC
lpcA up
T*C*G*T*TCAGTTCGTTACGAATAAGATCCTGGTACATGAGGAHYYHYYHGHGCATAAATGTAATAGACAAAATGCAGTGTACCGGATACCG
eutL up
G*T*G*A*CAGACGGTCGAATCAAATCTAAAGCTGGCATGATGCHYYGYYHHHGGGTCATGTTGATGCCGGATGCTTTCTGCTCCAGCATACG
ygjQ up
T*T*C*T*TTCTTTAGCGCCTAAAATCGACCTCCCCCCTTTCGTDDDRCDRRDCGACCATGCTGCGCGCATTTGCCCGCCTTCTTCTCCGTAT
ydjG up
G*T*A*A*TATCCGTTGTGCCTAAAGGTATCTTTTTCATTTGCCHYYHYYHHGCTTCGTATTCTTCCAGCAATTGTTCGACCAGCTTTCTGTT
talA up
G*A*A*G*TGTGAATTAACGCACTCATCTAACACTTTACTTTTCDDDRRCRRDTTCCTATGAACGAGTTAGACGGCATCAAACAGTTCACCAC
motA up
C*C*G*A*GAACAACCAGGTAACCTAATAAGATAAGCACGACATGYYHYYHHHACTGTTGACCATGACAGGATGTTCAGTCGTCAGGCGTTAA
moeA up
G*C*G*T*TTTTCTGACATAATAGGCAAATTCGATTTTGCCTCCDDDRRDRRCTTTTCATGGAATTTACCACCGGATTGATGTCGCTCGACAC
ilvM up
A*A*G*C*GAGCCGATACATTGACCTGATGTTGCATCATGATAAHYYGYYHHHCATTTCTGAATTACTGGCGCCAGGCGGCACCAGCGGCCAG
lolC up
C*G*C*A*GGCCAATAAATAGAGCGACAGGTTGGTACATGAAATGYYHYYHHHTGCTGTAGCAAAGACACGAGTATATAAGCGAAAGCAAGAT
agaS up
G*C*A*A*GTGAAAGCGACAACGCCCGACGTCAAGTTCATCAGADDDRRCRRDGAGTTATGCCAGAAAATTACACCCCTGCTGCCGCCGCAAC
ybaB up
T*T*C*A*TCAGGTTACCCAGACCGCCTTTACCAAACATAGGTTHYYHYYHGHATCACGTTAAGGATGACGAACGTAAGCTGTGCTTACGATC
tonB up
G*G*C*C*AGGGGAAGCGGCGAGGTAAATCAAGGGTCATTGAAGHYYHYYHGHTTTCAGTAGAAAAACCAGGTCTCGATTTTAAATGCAAATA
nanC up
A*T*T*G*TTTATGCGGGCTTTGTATTGCTTTCTGTATCCTACADDDRRCRRDAATTTATGAAAAAGGCTAAAATACTTTCTGGCGTATTATT
yedQ up
C*A*G*C*TCTGGTTTTCCATTTTTGTCTCGTGCTGCACCCTGAGYYHYYHHHACCTGCTTTTTTATGATTCTGGCATAACCTGGCGATAGCG
95

puuE down
G*A*A*A*GACGACGCTGATGGAATTCATTGTTGCTCATGTTTCNRRNGRNNNGACTCTTCACGGTTAATCGGAAATTAAACGCCCAGACGAT
ugpE down
C*T*G*A*ATATCGTCAGCCACGGACGGTTCTCAATCATTGGTANRRNRGNNNGCTTTCAACATAGCGGAACTGCACCACCGTCAGCACGATG
lpp down
G*T*G*T*AATACTTGTAACGCTACATGGAGATTAACTCAATCTNNNYCNYYNTAATAATGAAAGCTACTAAACTGGTACTGGGCGCGGTAAT
yciV down
A*G*G*T*CGTAAATCACTGCATAATTCGTGTCGCTCAAGGCGCNRRNGRNNNCTGGATAATGTTTTTTGCGCCGACATCATAACGGTTCTGG
cyaA down
A*G*T*C*TCTGTTTCAGAGTCTCAATATAGAGGTACAAGACGTNRRNGRNNNTTTGCTACCCGTCATGACTGTGATTCCGCCAACATCAACG
rseP down
A*T*G*A*ACGAAGCCAAATCCCAGAGAAAACTCAGCATATTACNRRNGRNNNAAGCGTCCTGAATACCAGTAACAACAAGCAAGCAAAGACC
lacZ down
A*A*A*A*CGACGGCCAGTGAATCCGTAATCATGGTCATAGCTGNRRNGRNNNTGAAATTGTTATCCGCTCACAATTCCACACAACATACGAG
ybjN down
A*G*C*G*TATCCAGACCAGGAACGACCAGCGATGTCATAATTTNRRNGRNNNTCTTTCGATAAAAAGACCGGCACAGCTTACGCAAAAAGCG
talB down
G*T*G*T*ACTGACGAAGGGAGGTCAATTTGTCCGTCATGATAGNRRNRGNNNTTAAACAGCTTGTTAGGGGGATGTAACCGGTCTGCCCTGA
ydaG down
A*A*T*T*TTGCAGTGCAGCAGTTAGTTCCGCCACCCGGCGTTANNNYCNYYNATAAGATGGTGCATTACGAAGTAGTTCAGTATTTGATGGA
Table 4.4 – MAGE Oligos for Hydrolysate Library Construction
The sequences of the MAGE oligos for hydrolysate targets are shown. The “*” symbol represents phosphorothioate bonds which slow the degradation of the oligos within the cell. These oligos were designed by Dr. Reeder. The degenerate region is shown with non-traditional symbols for nucleotide bases: R= A or G, D = A, T, or G, and N = A, T, C, or G.
96
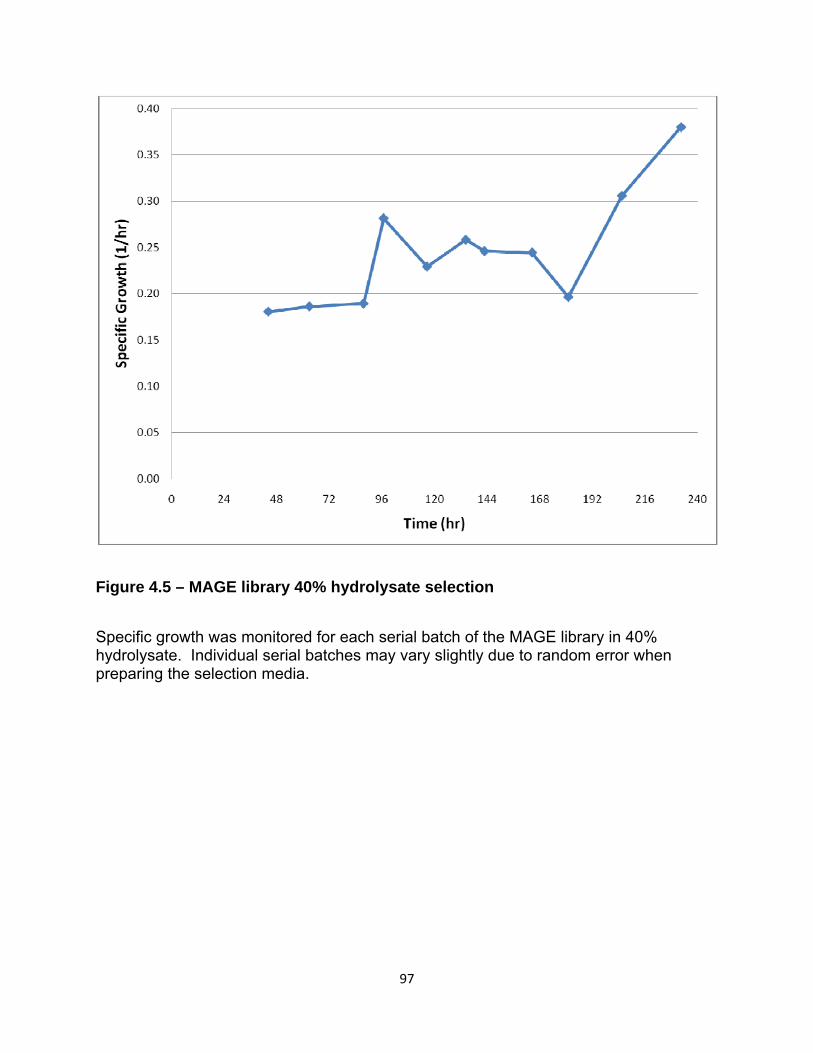
Figure 4.5 – MAGE library 40% hydrolysate selection
Specific growth was monitored for each serial batch of the MAGE library in 40% hydrolysate. Individual serial batches may vary slightly due to random error when preparing the selection media.
97

Ten individual colonies were selected for examination; these were labeled H40 A
through J. As seen in Figure 4.6, after 44 hours of growth in 40% hydrolysate, six of the
ten grew statistically significantly higher than the parent SIMD 70 strain (p-value < 0.05).
In order to fully genotype a single clone, each target must be sequenced to see if the
RBS was mutated. Due to the high cost of sequencing, only two clones were fully
characterized. Clones ‘H40 G’ and ‘H40 I’ had all 27 target regions amplified via culture
PCR and were sent for sequencing. These two clones each had one mutation. The
‘H40 G’ clone has a modified RBS before the tonB gene while the ‘H40 I’ clone has a
mutation in the ilvM RBS as seen in Figure 4.7. Each of the remaining clones had these
two regions amplified and sequenced, but no further mutations were found. This leads
us to believe that the end population was still genotypically diverse, even after a ten day
selection. Furthermore, the mixed population from the end of the selection was used as
template for amplification of the target regions. One region, the lpp RBS, showed
diversity in the RBS sequence, as seen in the chromatograph of Figure 4.8. Although
the end population showed lpp diversity, none of the ten picked colonies had a mutated
lpp RBS.
In order to evaluate the change in the mutated RBS, we employed the RBS
Calculator developed by Salis et al. [132]. The RBS calculator is able to estimate the
relative strengths of two RBS for a gene. Here we see that the calculator reports an
increase in strength for the tonB mutation in H40 G (Figure 4.7). This makes sense
since the tonB TRMR mutant found with high fitness in the hydrolysate
98

Figure 4.6 - 44 hour growth of post selection isolates in 40% hydrolysate
Growth study of 10 selected clones taken from sample plates after the MAGE selection. After 44 hours of growth in 40% hydrolysate, samples were taken from growth cultures and the turbidity was observed after cells had been washed in water. n=3
99
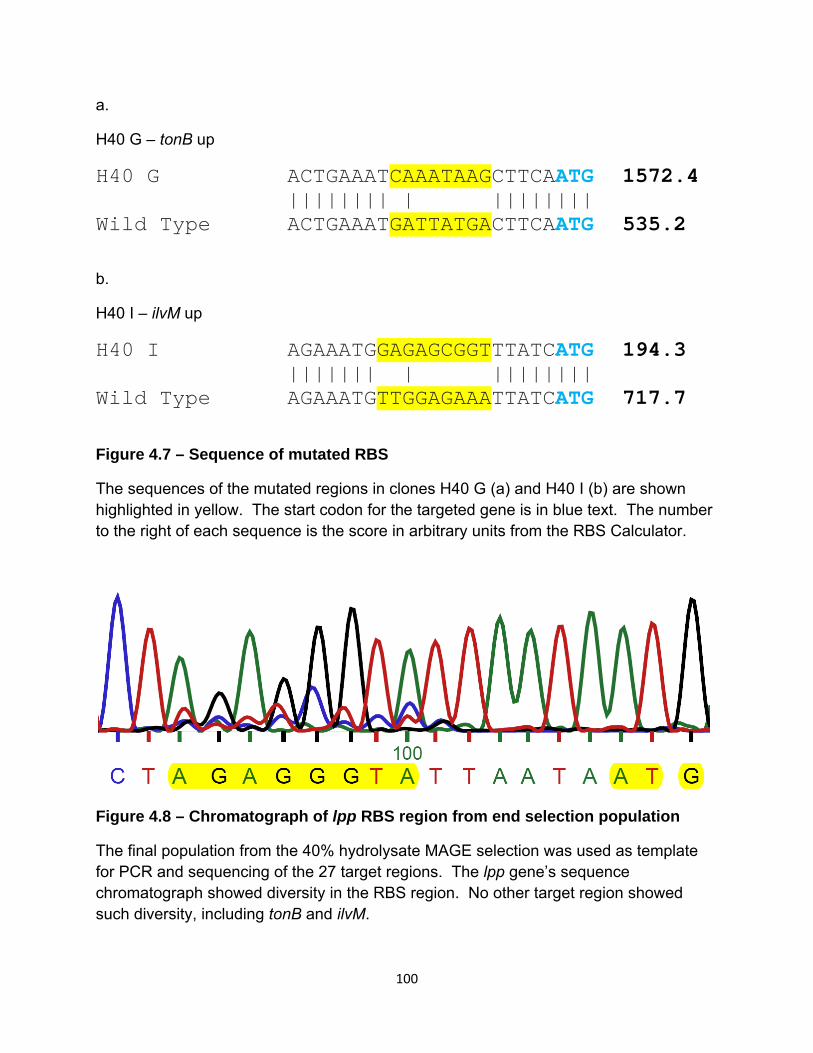
a.
H40 G – tonB up
H40 G ACTGAAATCAAATAAGCTTCAATG 1572.4 |||||||| | |||||||| Wild Type ACTGAAATGATTATGACTTCAATG 535.2
b.
H40 I – ilvM up
H40 I AGAAATGGAGAGCGGTTTATCATG 194.3 ||||||| | |||||||| Wild Type AGAAATGTTGGAGAAATTATCATG 717.7
Figure 4.7 – Sequence of mutated RBS
The sequences of the mutated regions in clones H40 G (a) and H40 I (b) are shown highlighted in yellow. The start codon for the targeted gene is in blue text. The number to the right of each sequence is the score in arbitrary units from the RBS Calculator.
Figure 4.8 – Chromatograph of lpp RBS region from end selection population
The final population from the 40% hydrolysate MAGE selection was used as template for PCR and sequencing of the 27 target regions. The lpp gene’s sequence chromatograph showed diversity in the RBS region. No other target region showed such diversity, including tonB and ilvM.
100

For the acetate library, eight targets were chosen from the highest fitness TRMR
alleles: deoA, prpR, serS, tqsA, tap, ddpA, yahF, and clcB (Table 4.5). All but tap and
ddpA were found in the TRMR selection with the down mutation. In this library
construction, eleven rounds of recombination were performed with the pool of eight
oligonucleotides. The replacement efficiency was estimated to be 4.4% per round,
yielding a population that has 31% single mutants, 7.1% double mutants, and 1.0%
triple mutants.
This library underwent selection in 10 g/L acetate in minimal media for 110 hours,
which comprised 5.25 generations. The culture was serially transferred once to prevent
the culture reaching stationary phase. The growth rate was monitored throughout the
selection and after 100 hours the growth rate increased by 75%. After this time,
samples were taken and culture was plated to obtain individual colonies. Colonies were
picked and their growth was examined. None of the 23 colonies selected, surprisingly
showed an increase in growth rate. Four colonies were selected and had their target
regions genotyped (32 total reactions), but no mutations were found.
101

MAGE Oligo
Sequence
deoA down
T*T*T*T*TACGAATAATTTCTTGTGCGAGAAAcaaGGTAANNNNNNNNGGAAAAGAGTATGAGGCGGCTTTTGCCGGATGCGTCTACGCCTTA
prpR down
A*A*T*T*ATGAAACAAGACTAAACCCAATATTCGGTTTCTTAACNNNNNNNNGCGCTatgGCACATCCACCACGGCTTAATGACGACAAACCG
serS down
G*T*C*T*GGCTCATTACGCAGCAGATTGGGATCGAGcatGCTTANNNNNNNNTTATCGAATTAAATGGGAGATGTGGCCACAGCCTGCGACCA
tqsA down
G*A*C*G*GAGCGAAAAAGACATTATTATTAGCAAAGGAAGAAAANNNNNNNNCAAGCatgGCAAAGCCGATCATCACGCTCAATGGCCTAAAA
tap up A*A*A*C*AGCGTGGTCGAAATTCGAATACGATTAAAcatCAACGHYYHYHHHCAGGCGGCAATGACCGCGTTAGTAAATACTCGTCAAAATGT
ddpA up
T*C*T*C*TTGTTTTATATCCCCTGGCACACAGCACGTCAGTTAADDDRDRRDCTGTCatgAAGAGATCGATATCGTTTCGTCCCACATTGCTC
yahF down
A*T*A*G*GTATTCGGTTTAATGACTATTTTAACTGAcatAATTCNNNNNNNNGGTTTGGCTCAGCGCACAACCATCGGCCATGCCATACAGCA
clcB down
C*A*T*T*GCCCATTTCTGCTCATGCATCATCTACACATCTATCCNNNNNNNNGCACTatgTTCCACCGTCTGCTTATCGCAACAGTCGTCGGT
Table 4.5 – MAGE Oligos for Acetate Library Construction
The sequence of the MAGE oligos for acetate targets are shown. The “*” symbol represents phosphorothioate bonds which slow the degradation of the oligos within the cell. The degenerate region is shown with non-traditional symbols for nucleotide bases: R= A or G, D = A, T, or G, and N = A, T, C, or G. Start codons for the target gene are shown in lowercase.
102

4.3.5 Construction and Selection of Secondary MAGE Libraries
It seems from the hydrolysate selection data that double mutants may be difficult
to find. This may be due to an insufficient selection time where synergistic or additive
double mutants that have a faster growth rate than single mutants started with such a
small initial population size that they would be difficult to find in the final selection
population. It also may be due to antagonistic beneficial mutations, where it would be
unlikely to find any double mutants after any length of selection. A third reason could be
that the double mutants are of the less-than-additive variety, where they may grow
slightly better than the single mutants, but start with a smaller population. To gain more
insight into which of these situations our selection exemplifies, another, more limited,
MAGE experiment was conducted.
Instead of building the library starting with just the SIMD 70 strain, the initial
population was an equal mix of the SIMD70 strain, the H40 G clone (with the tonB
mutation) and the H40 I clone (with the ilvM mutation). Starting with these three clones,
four targets were chosen for recombination: lpcA, lpp, tonB, and ilvM. The lpcA target
was chosen because it had previously been seen to confer resistance to both acetate
and furfural [130]. The lpp target was chosen because its RBS was seen to show
diversity in the end population. The targets of tonB and ilvM were chosen because they
are the targets where mutations were found in clones H40 G and H40 I. The efficiency
reporting galK+ oligo was also added. Six rounds of recombination were performed with
the unusually high efficiency of 7.0%. Because two thirds of the initial population
already had a mutation, the library after six rounds had a much different composition as
the first hydrolysate MAGE library. It is estimated that only 21.5% of the population
103

have no mutations, 52.9% have a single mutation, 21.3% are double mutants, 3.9% are
triple mutants, and the rest have more than three mutations per clone (Figure 4.9a). We
can again speculate on what should be found at the end of this selection just as we did
before based on synergistic, additive, less-than additive, or antagonistic multiple
mutation interactions (Figure 4.9b-e, based on the model as described above and a
different starting population). It is clear that it is more likely to find multiple mutations
after this selection, but if the double mutations are less than additive, it should not come
as a surprise that many of the original mutants (H40 G, H40 I) still persist.
104

a.
105

b.
106

c.
107

d.
108

e.
Figure 4.9 – Model Describing Second MAGE Library and Selections
a) Construction of second MAGE library. Shown is the theoretical population distribution of a MAGE library if the recombination efficiency is 7.0%. Each round generates more mutations and the construction of multiple mutations over the 6 rounds. b) Synergistic selection: A theoretical selection where beneficial single mutants are 35% higher in growth rate compared to no mutations and the combinations thereof are synergistic (increase in growth rate is more than additive). c) Additive selection: Same as (b) but combinations are additive. d) Less-than-additive selection: Same as (b) but combinations are less than additive. e) Antagonistic selection: Time for (b) – (3) is 150 hours.
109

The seconday MAGE library population was subjected to selection in 40%
hydrolysate for 95 hours, constituting 22 more generations of growth. The selection
was serially transferred three times to avoid stationary phase in the culture. In this
selection, no discernable increase in the growth rate was observed. At the end of the
selection, samples were taken and plated to isolate individual colonies. Eight colonies
were picked for further examination. Because there were only four targets in this
selection, it was much easier to sequence many more clones.
All eight colonies had the four target regions sequenced. Four of the eight were
identical to the H40 I clone (i.e. each had the same ilvM RBS mutation), two clones had
single mutations which were different from the H40 G or H40 I seed populations (one
was in the tonB region, the other ilvM). Two of the picked clones were double mutants.
Both had the H40 I clone’s ilvM mutation, presumably the parent of the two, and a
unique tonB mutation as well. The precise nature of these mutations may be seen in
Table 4.6 and Figure 4.10. It seems that a mutation in the ilvM RBS is confers the most
tolerance since seven of eight sequenced clones had either the H40 I mutation or a
novel mutation. It is interesting to note that a single point mutation is present in the two
H40 I-derived double mutant clones in the tonB target region that is not present in the
H40 I clone itself. This shows that unintended mutations may be propagated and
sustained during this process. The relative strengths of the ribosomal binding sites
were again calculated by the RBS Calculator (Figure 4.10) [132]. It does not seem that
there is a consistent trend among the RBS scores and tolerance. The H40 P tonB RBS
score increased, but the tonB RBS for H40 Q and H40 T decreased. The H40 U ilvM
RBS score decreased dramatically.
110

Clone lpcA ilvM tonB lpp
M2 H40 N - H40 I - - M2 H40 O - H40 I - - M2 H40 P - H40 I Novel Mutation - M2 H40 Q - H40 I Novel Mutation - M2 H40 R - H40 I - - M2 H40 S - H40 I - - M2 H40 T - - Novel Mutation - M2 H40 U - Novel Mutation - -
Table 4.6 – Mutations of Picked Clones from Second Hydrolysate MAGE Library Selection
Each sequenced mutant had at least one mutation. A ‘-’ symbol means that the sequence was native. The ‘H40 I’ entry means that the mutation found is identical to the ilvM mutation found in the original H40 I clone. ‘Novel Mutation’ means there was a mutation that had not been previously seen.
111

a.
M2 H40 P – tonB up, double mutant
H40 P ACTTAAAGCAGGAGAGCTTCAATG 802.5 ||| ||| | | |||||||| Wild Type ACTGAAATGATTATGACTTCAATG 535.2
b.
M2 H40 Q – tonB up, double mutant
H40 Q ACTTAAAGCTAGGGGACTTCAATG 273.1 ||| ||| |||||||||| Wild Type ACTGAAATGATTATGACTTCAATG 535.2
c.
M2 H40 T – tonB up, single mutant
H40 T ACTGAAAGCAAGTGAGCTTTAATG 442.0 ||||||| |||||||| Wild Type ACTGAAATGATTATGACTTCAATG 535.2
d.
M2 H40 U – ilvM up, single mutant
H40 U AGAAATGTGTGGCGGGTTATCATG 4.1 |||||||| | |||||||| Wild Type AGAAATGTTGGAGAAATTATCATG 717.7
Figure 4.10 – Sequence of mutated RBS
The sequences of the mutated regions in clones H40 P (a), H40 Q (b), H40 T (c), and H40 U (d) are shown highlighted in yellow. The start codon for the targeted gene is in blue text. Only those regions that have novel mutations are shown. The number to the right of each sequence is the score in arbitrary units from the RBS Calculator.
112

Growth studies of clones selected from the second 40% hydrolysate selection
were performed. Figure 4.11 shows these double mutants do not perform better than
that of the single mutants from which they derive. It is curious to see that any double
mutants were found at all. It would be expected that if they did not confer increased
growth, they should not be found at the end of the selection. Based on this observation,
it seems that it should not have been expected to select for multiple mutations in this
particular situation. While these mutations may have a higher growth rate compared to
the wild type strain, this benefit was not enough to overcome the disadvantage of such
a small starting population in the first MAGE hydrolysate selection.
It is interesting to note the difficulties of studying growth in hydrolysate. In order
to observe an optical density (OD), a sample must be removed from the liquid culture
and centrifuged. The supernatant is decanted carefully with a pipette and the cell pellet
is subsequently resuspended in water or MOPS minimal media. This process requires
that the sample cannot be replaced once the measurement is taken. Since observing
many clones at once requires using smaller volumes of culture (because of material and
space limitations), very few samples can be taken. Furthermore, the hydrolysate is not
a well-defined or consistent substance. Each batch is slightly different in the amount of
inhibition of growth is seen with the clones.
113

Wild Type
Isolates from first selection
Isolates from second selection
Figure 4.11 - 20 hour growth of post selection isolates in 40% hydrolysate
Growth study of single mutants found in the first MAGE hydrolysate selection (H40 G and H40 I), double mutants found in the second MAGE hydrolysate selection (H40 P and H40 Q), and novel single mutants found in the second MAGE hydrolysate selection (H40 T and H40 U). After 20 hours of growth in 40% hydrolysate, samples were taken from growth cultures and the turbidity was observed after cells had been washed in water. Error bars are 1 standard deviation. n=3. Each isolate has a p-value < 0.05 compared to control.
114

4.4 Discussion
In order to engineer a strain with a desired trait, various routes of mutation may
be employed. Because of the near-infinite ways the E. coli genome can be
manipulated, it is important to have a coherent strategy to efficiently engineer strains.
While nature has the advantage of time, researchers in a lab desire methods that allow
such manipulations on the timescale of weeks or even days. A good strategy for
engineering a strain for a certain trait would include introducing directed mutations likely
to affect fundamental characteristics (in our case, the growth under a desired condition).
Ideally, these mutations would be easily identifiable to quickly determine the genotype
of the strain.
Here, we have described a two-step process for producing an engineered strain.
Generally, a broad search is done to find individual mutants that confer tolerance to the
selection conditions. Then, a few of those genes with high-fitness mutants are targeted
specifically for an in-depth, narrower search that includes clones with multiple
mutations. Specifically, the genome-wide tool TRMR was used to identify genes with a
high fitness to lignocellulosic hydrolysate and acetate stress when a mutation, either
increasing or decreasing gene expression, was introduced [1]. The microarray-derived
fitness data from the TRMR selections informed the decision of which targets to choose
when performing a MAGE selection. The ribosomal binding sites of the targeted genes
were mutated via multiplex recombination generating a library of mutants, and then a
selection was performed [99].
115

Growth on cellulosic hydrolysate and acetate was chosen because it exemplifies
two different selection conditions. The acetate condition involves a metabolite which is
connected to various regulatory mechanisms in the cell at very high concentrations.
The hydrolysate condition is a complex mixture of various sugars in high amounts and
various chemicals that are toxic (both metabolites and substances foreign to E. coli).
Both of these conditions are relevant to the ongoing effort to engineer biofuel production
strains that can be grown on hydrolysate feedstock [96].
4.4.1 Mutations found in TRMR
The goal of the first part of the process, the TRMR selection, is to identify a
smaller number of targets. This is desired because we can only use the fittest few
mutations when selecting targets for MAGE. This stands in contrast with a previous
work. In this work, the SCALES tool was used with the goal of having a low frequency
of false-negatives (i.e. mutations which may confer tolerance but are not identified as
such [130]. In the process discussed in this work, false negatives are not considered as
much of a problem as false positives, those mutants which are shown to have a high
fitness, but do not confer tolerance. Since we are limited to only a few targets, it is
desired that our false positive rate is zero or near zero.
The two TRMR selections used in this work were both successful in producing a
limited number of mutants with a high fitness [1]. While these selections greatly
reduced the genotypic diversity (which is desired), there was no general theme or motif
that emerged from the tolerant clones. This stands in contrast to previous work with
acetate using the SCALES technique, where many of the fittest clones involved
116

metabolic genes involved in the production of amino acids [130]. This reinforces the
fact that these two techniques are not searching within the same mutational space. It
should not be expected that these two tools’ results mirror each other.
To properly confirm that the selections were efficacious, the top fitness mutants
of the selection need to be reconstructed. This proved to be problematic in practice,
where six of the desired eight clones from the acetate selection were able to be
constructed. For this method to be used in the future in the quick and efficient manner
that is necessary, this step must be improved. Changing the antibiotic resistance
cassette from blasticidin resistance to a more user-friendly one, such as kanamycin or
carbenicillin, may speed the process of TRMR clone reconstruction.
Of these six reconstructions, four conferred tolerance to acetate. It seems that
the false positive rate in the TRMR selection that yields high-fitness values for non-
tolerant clones may be high.
4.4.2 MAGE selections yields mixed results
The second part of the overall scheme is to focus our efforts on a small number
of genetic targets that we will mutate repeatedly to generate a library of multiple mutants
for subsequent selection. The MAGE process was used here for the purpose of quickly
introducing multiple mutations in individual clones.
In practice, the recombination efficiency of single rounds of mutation was
relatively low compared to what others have reported [124, 131]. Since each MAGE
round takes a minimum of 5 hours (and more often 6-7), performing a dozen rounds
requires a few days of constant labor, or a week of standard work. With these same
117

efficiencies, two dozen rounds of MAGE would only yield one third of the population with
two or more mutations per clone. In order to generate a library with a large portion of
double or more mutants per clone in a reasonable amount of time, recombination
efficiencies must be dramatically increased. One method would be to disable the
natural DNA repair mechanisms that combat recombination, but this would also lead to
an increase in random mutagenesis that could interfere negatively with the rest of the
system.
The number of unique multiple mutants that can exist in a library is dependent on
the number of targets that are chosen for mutation. This leads to a natural trade-off of
benefits. With more targets, for instance the hydrolysate MAGE library, a larger number
of combinations of mutations are in the selection. However, not all combinations may
be present or present in a significant number, meaning the selection may be missing out
on certain possibilities from the start. Increasing the number of targets increases the
number of combinations nearly exponentially. Also, the difficulty of determining which
mutations are present in a tolerant clone increases linearly with the number of targets
chosen. The more targets that must be sequenced in a single clone, the fewer clones
can be sequenced for the same work and cost. Conversely, choosing fewer targets
means many more clones can be genotyped. Also, most combinations of mutations can
be more thoroughly searched in a selection when there are fewer of them. However,
limiting the targets limits the scope of what the selection is able to search. It is entirely
possible that a library is so limited in scope that the best solution to the problem lays
outside the bounds of the experiment.
118

Mathematics aside, selection for multiple mutations is not a straight-forward
process. Because the desired phenotypes are poorly understood, it is not possible to
accurately predict how these individual mutations will interact. From our experiments, it
seems that the combination beneficial mutations are less than the sum of their parts.
This fact makes finding multiple mutant clones unlikely over the course of a selection on
a laboratory time scale.
While finding multiple mutations in a single clone after the initial selection of the
MAGE library is ideal, it seems that a step-wise approach might be the most efficient
path. Using previously identified tolerant single-mutant clones as the basis for further
mutation made finding double mutants much more likely.
It is interesting that no tolerant mutated acetate clone was found from the MAGE
process. One possibility to explain this is that where TRMR and SCALES may be able
to bypass some transcription-based regulation in changing the gene expression levels,
just mutating the ribosomal binding site may not have the same effect. This
underscores the fact that the TRMR and MAGE mutations are not the same, and should
not be expected to yield tolerant clones right away.
119

Chapter 5:
Conclusions
In this work, we have explored the engineering E. coli to be more tolerant to
acetate and to better grow on lignocellulosic hydrolysate for the purpose of the
development of better fermentation strains for the production of biofuels.
Chapter two describes the motivation for exploring E. coli tolerance to
lignocellulosic hydrolysate inhibitory compounds. These cellulosic feedstocks are
renewable and are often derived from agricultural waste, a source that is currently
underutilized. This process is not already the normative method for producing biofuels
because the pretreatment necessary for making the sugars available for fermentation
produces not only those sugars, but also various inhibitory compounds. These
inhibitions must be overcome for efficient production of biofuels. We not only want to
produce a microorganism that is resistant to these toxins, but also to generate
knowledge on the mechanisms of toxicity and tolerance. For these goals, various
engineering tools and applications are needed.
The choice of which genome engineering tools should be used is of great
importance. Before the conclusions derived from the use of these tools can be
120

discussed, we must first articulate how these tools were chosen. Like the tools in a tool
box, the various methods to manipulate, control, or otherwise alter the genetic makeup
of bacteria to bestow some trait have strengths and weaknesses. They should be well
understood on how to properly use them and the limitations should be known so that the
most information and productivity can be gleaned from their use.
To determine the best method to use in our studies, we first describe the ideal
tool. We first want the methods we use to be high-throughput and trackable. High-
throughput means that a large amount of genetic variety can be tested in a short period
of time (i.e. a large library that can undergo selection). A method is trackable if the
genotype of the populations can be easily ascertained (e.g. with DNA microarrays). The
method of introducing genetic diversity should be directed. Directed mutations are
those that are very likely to effect change within the clone (e.g. change in gene
expression). The tool’s results are best if quantifiable and causal. DNA microarrays
yield quantifiable signal data, such that a numerical value can be ascribed to the
mutation. Causal results indicate that the change in phenotype is a direct result of the
reported mutation, and not merely correlative. Ideally, the method used for genetic
engineering would introduce multiple mutations at once to take allow synergistic effects.
Finally, the best methods operate well on a lab time scale. While nature may have
eons, and the duration of graduate school seemingly just as long, it is best when the
entire process can be done in a fortnight or less.
Now that we have described the ideal tools, we examine the tools chosen in this
work. SCALES is high-throughput, trackable, causal, quantifiable, and can be done on
a lab time scale. TRMR is also high-throughput, trackable, causal, quantifiable,
121

directed, and can be done on a lab time scale. MAGE is high-throughput, causal,
directed, can be done on a lab time scale, and multiple mutations in individual clones
can be tested. The choice to use these three methods for these studies has been the
most important choice of all. The use of more rudimentary methods could not have
generated the amount and type of data seen here. We can now discuss the
conclusions of the results of these tools.
In chapter three, SCALES was applied to moderate acetate stress in selection.
Key clones were identified that had a high fitness value. Clone fitness values were
converted to individual gene fitness data ,such that the data could be analyzed in
various ways. When the individual gene data was mapped onto metabolic biochemical
pathways, which show which genes encode for enzymes that carry out certain
reactions, a pattern emerged. Key regulated steps in pathways that produce certain
amino acids and pyrimidine ribonucleotides were catalyzed by the products of high-
fitness genes. This led us to correctly hypothesize that supplementation of the products
or closely related metabolites would alleviate acetate stress. The discovery of this
mechanism of tolerance was not obvious and had not been previously identified in the
literature. Supplementation of amino acids previously identified as osmoprotectants and
affected by acetate did not confer tolerance. These were tested, but the SCALES data
did not predict these to be important.
In chapter four, the combination of two powerful genome engineering tools was
discussed. TRMR selections were performed on high levels of acetate stress to
elucidate the only the very tolerant clones. While troublesome and not fully successful,
six out of eight desired high-fitness mutants were reconstructed. Four of these, tap up,
122

tqsA down, clcB down, and ddpA up performed statistically significantly better than the
control. It was attempted to find a common theme within the high-fitness clones (as in
chapter three), but no pattern emerged. In contrast to the SCALES results, few high-
fitness genes coded for enzymes that catalyze reactions in the central metabolism.
Using the acetate TRMR selection and a previously reported lignocellulosic
hydrolysate TRMR selection, targets were chosen from the top fitness mutants for
further study using MAGE. Eight targets from the acetate work were chosen and 27
targets for the hydrolysate work. About a dozen rounds of recombination were
performed for the construction of both the acetate and hydrolysate libraries at a
replacement efficiency of at or just below 5%. The libraries started with about 50% of
the population containing mutations (80-90% of those being single mutants). Selections
were performed upon the acetate and hydrolysate libraries. Unfortunately, no resistant
clones were identified after the acetate selection. The hydrolysate selection yielded
resistant clones, but only single mutants could be found. To determine why this was the
case, a second round of MAGE recombination (4 targets, 6 rounds with 7% efficiency)
was performed using two of the previously-identified single mutants along with SIMD70
as the basis of the library. After another selection in 40% hydrolysate, clones with
multiple mutations were found, but none were more resistant than their single-mutant
parents. Seeing this, it was reasonable that multiple mutations in a single clone were
not found in the initial selection. Finding clones with multiple mutations that are more
resistant to stress than single-mutant clones may be more difficult to find than
previously supposed.
123

The inability to find double or triple mutant clones that are more tolerant to stress
than their single mutant counterparts from the MAGE selections was unexpected.
However, seen in the light of the antagonistic model of multiple mutation interactions, no
multiple mutants should be expected in this situation. This highlights how complex and
non-intuitive altering the genome can be. A starting assumption of the MAGE method,
as used in this work, was that if two single mutations were good, the combination of
those mutations would be better. This, as it turns out, may not be true for our systems.
Likely this assumption is true under different circumstances.
A search for purely additive mutations may be better done in a step-wise fashion,
much like the second MAGE library described above. However, instead of limiting the
scope of the experiment to a few targets, it may be better to sequentially select upon
genome-wide libraries with the expectation that a generation of a new library would be
required each time an additional mutation was desired. If done with TRMR-like
insertions (i.e. with DNA barcodes for use with microarray and antibiotic resistance
markers), these subsequent libraries may be trackable if the original barcodes from the
initial round of selection are removed. Likewise, removal of the original antibiotic
resistance cassette may be done to avoid the necessity of simultaneous use of multiple
antibiotics.
It would be ideal to search a multiple mutation library for increased tolerance
without requiring prior knowledge of what single mutations confer tolerance. To do so, a
TRMR-like mutation cassette may be better suited compared to the degenerate MAGE-
like approach. To create a library that generated all possible combinations of double
TRMR library mutants (both in the ‘up’ and ‘down’ direction), ~64,000,000 unique
124

mutants would need to be constructed. This number is on the upper limit of what can
be achieved on the bench top. Certain practicalities, such as how to identify double
mutants on an individual clone and population basis, would have to be addressed, but
these issues could be overcome. Such a method would be ideal to identify double
mutants requiring a specific combination of two mutations that individually do not confer
tolerance. This method has not been attempted yet because the generation of the
subsequent TRMR libraries is more difficult and labor intensive compared to the
generation of a MAGE library.
In the end, attempting to thoughtfully introduce changes into the near black box
of the E. coli microorganism is highly complex. Attempting to engineer clones that are
tolerant to acetate and lignocellulosic hydrolysate (each adding its own set of
complexities) has made this work interesting, to say the least. Acetate is a metabolite
connected to various regulatory elements, and it functions as a regulatory molecule as
well as carbon source and inhibitor. Lignocellulosic hydrolysate contains such a wide
variety of inhibitors and sugars that it is futile to attempt to predict what mutations would
make a clone more tolerant.
The use of each of these various methods to do a similar thing recalls the idiom
“There are many ways to skin a cat.” Here we have seen that some ways are more
effective than others, however. The author hopes this work has given the reader some
knowledge on the subject that will help you in the reader’s future endeavors.
CONSUMMATUM EST
125

126

References
1. J.R. Warner, P.J. Reeder, A. Karimpour-Fard, L.B. Woodruff, and R.T. Gill, Rapid profiling of a microbial genome using mixtures of barcoded oligonucleotides. Nat Biotechnol. 28 (2010) 856-862.
2. R.D. Perlack, L.L. Wright, A.F. Turhollow, R.L. Graham, B.J. Stokes, and D.C. Erbach, Department of Agriculture: Biomass as feedstock for a bioenergy and bioproducts industry: The technical feasability of a billion-ton annual supply. Oak Ridge, TN; 2005.
3. European Union: Directive 2003/30/ec of the european parliament and of the counsil, on the promotion of the use of biofuels or other renewable fuels for transport. Brussels, Belgium; 2003.
4. Energy Information Administration: International energy outlook 2000. Washington, DC; 2000.
5. Energy Information Administration: Annual energy outlook 2008: With projections to 2030. Washington, DC; 2008.
6. Energy Information Administration: Short-term energy outlook. Washington, D.C.; 2008.
7. New energy for america [http://my.barackobama.com/page/content/newenergy] 8. Department of Energy: Research advances: Cellulosic ethanol. Golden, CO;
2007. 9. T. Searchinger, R. Heimlich, R.A. Houghton, F. Dong, A. Elobeid, J. Fabiosa, S.
Tokgoz, D. Hayes, and T.H. Yu, Use of u.S. Croplands for biofuels increases greenhouse gases through emissions from land-use change. Science. 319 (2008) 1238-1240.
10. J. Sanchez and J. Junyang, USDA Foreign Agricultural Service: Gain report: China, peoples republic of, bio-fuels annual report. Beijing; 2008.
11. J. Wilson, USDA Foreign Agricultural Service: Gain report: United kingdom, bio-fuels, biofuels under fire. 2008.
12. K. Sanderson, Us biofuels: A field in ferment. Nature. 444 (2006) 673-676. 13. E. Palmqvist and B. Hahn-Hagerdal, Fermentation of lignocellulosic hydrolysates.
I: Inhibition and detoxification. Bioresource Technology. 74 (2000) 17-24.
127

14. Y. Sun and J. Cheng, Hydrolysis of lignocellulosic materials for ethanol production: A review. Bioresour Technol. 83 (2002) 1-11.
15. N. Mosier, C. Wyman, B. Dale, R. Elander, Y.Y. Lee, M. Holtzapple, and M. Ladisch, Features of promising technologies for pretreatment of lignocellulosic biomass. Bioresour Technol. 96 (2005) 673-686.
16. R. Kumar, S. Singh, and O.V. Singh, Bioconversion of lignocellulosic biomass: Biochemical and molecular perspectives. Journal of Industrial Microbiology & Biotechnology. 35 (2008) 377-391.
17. F. Niehaus, C. Bertoldo, M. Kahler, and G. Antranikian, Extremophiles as a source of novel enzymes for industrial application. Appl Microbiol Biotechnol. 51 (1999) 711-729.
18. L. Olsson and B. HahnHagerdal, Fermentation of lignocellulosic hydrolysates for ethanol production. Enzyme and Microbial Technology. 18 (1996) 312-331.
19. R.J. Ulbricht, S.J. Northup, and J.A. Thomas, A review of 5-hydroxymethylfurfural (hmf) in parenteral solutions. Fundamental and Applied Toxicology. 4 (1984) 843-853.
20. A.P. Dunlop, Furfural formation and behavior. Industrial and Engineering Chemistry. 40 (1948) 204-209.
21. S. Larsson, A. Reimann, N.O. Nilvebrant, and L.J. Jonsson, Comparison of different methods for the detoxification of lignocellulose hydrolyzates of spruce. Applied Biochemistry and Biotechnology. 77-9 (1999) 91-103.
22. B.S. Dien, M.A. Cotta, and T.W. Jeffries, Bacteria engineered for fuel ethanol production: Current status. Appl Microbiol Biotechnol. 63 (2003) 258-266.
23. K. Ohta, D.S. Beall, J.P. Mejia, K.T. Shanmugam, and L.O. Ingram, Genetic-improvement of escherichia-coli for ethanol-production - chromosomal integration of zymomonas-mobilis genes encoding pyruvate decarboxylase and alcohol dehydrogenase-ii. Applied and Environmental Microbiology. 57 (1991) 893-900.
24. J. Zaldivar and L.O. Ingram, Effect of organic acids on the growth and fermentation of ethanologenic escherichia coli ly01. Biotechnol Bioeng. 66 (1999) 203-210.
25. J. Zaldivar, A. Martinez, and L.O. Ingram, Effect of selected aldehydes on the growth and fermentation of ethanologenic escherichia coli. Biotechnol Bioeng. 65 (1999) 24-33.
26. J. Zaldivar, A. Martinez, and L.O. Ingram, Effect of alcohol compounds found in hemicellulose hydrolysate on the growth and fermentation of ethanologenic escherichia coli. Biotechnology and Bioengineering. 68 (2000) 524-530.
27. L.R. Jarboe, T.B. Grabar, L.P. Yomano, K.T. Shanmugan, and L.O. Ingram, Development of ethanologenic bacteria. Biofuels. 108 (2007) 237-261.
128

28. N. Banerjee, R. Bhatnagar, and L. Viswanathan, Inhibition of glycolysis by furfural in saccharomyces-cerevisiae. European Journal of Applied Microbiology and Biotechnology. 11 (1981) 226-228.
29. S.M. Hadi, Shahabuddin, and A. Rehman, Specificity of the interaction of furfural with DNA. Mutat Res. 225 (1989) 101-106.
30. L.O. Ingram, Adaptation of membrane lipids to alcohols. Journal of Bacteriology. 125 (1976) 670-678.
31. Q.A. Khan, and S.M. Hadi, Effect of furfural on plasmid DNA. Biochemistry and Molecular Biology International. 29 (1993) 1153-1160.
32. Q.A. Khan and S.M. Hadi, Inactivation and repair of bacteriophage lambda by furfural. Biochem Mol Biol Int. 32 (1994) 379-385.
33. Shahabuddin, A. Rahman, and S.M. Hadi, Reaction of furfural and methylfurfural with DNA: Use of single-strand-specific nucleases. Food Chem Toxicol. 29 (1991) 719-721.
34. M.P. Tucker, J.D. Farmer, F.A. Keller, D.J. Schell, and Q.A. Nguyen, Comparison of yellow poplar pretreatment between nrel digester and sunds hydrolyzer. Applied Biochemistry and Biotechnology. 70-2 (1998) 25-35.
35. A. Aden, M. Ruth, K. Ibsen, J. Jechura, K. Neeves, J. Sheehan, B. Wallace, L. Montague, A. Slayton, and J. Lukas, National Renewable Energy Laboratory: Lignocellulosic biomass to ethanol process design and economics utilizing co-current dilute acid prehydrolysis and enzymatic hydrolysis for corn stover. Golden, Colorado; 2002.
36. M.P. Garcia-Aparicio, I. Ballesteros, A. Gonzalez, J.M. Oliva, M. Ballesteros, and M.J. Negro, Effect of inhibitors released during steam-explosion pretreatment of barley straw on enzymatic hydrolysis. Applied Biochemistry and Biotechnology. 129 (2006) 278-288.
37. C. Martin, B. Alriksson, A. Sjode, N.O. Nilvebrant, and L.J. Jonsson, Dilute sulfuric acid pretreatment of agricultural and agro-industrial residues for ethanol production. Applied Biochemistry and Biotechnology. 137 (2007) 339-352.
38. A.S. Schmidt and A.B. Thomsen, Optimization of wet oxidation pretreatment of wheat straw. Bioresource Technology. 64 (1998) 139-151.
39. D.P. Koullas, E. Lois, and E.G. Koukios, Effect of physical pretreatments on the prepyrolytic behavior of lignocellulosics. Biomass & Bioenergy. 1 (1991) 199-206.
40. C. Tengborg, M. Galbe, and G. Zacchi, Reduced inhibition of enzymatic hydrolysis of steam-pretreated softwood. Enzyme and Microbial Technology. 28 (2001) 835-844.
41. J.J. Fenske, A. Hashimoto, and M.H. Penner, Relative fermentability of lignocellulosic dilute-acid prehydrolysates - application of a pichia stipitis-based toxicity assay. Applied Biochemistry and Biotechnology. 73 (1998) 145-157.
129
42. A.V. Tran and R.P. Chambers, Red oak wood derived inhibitors in the ethanol fermentation of xylose by pichia-stipitis cbs-5776. Biotechnology Letters. 7 (1985) 841-845.
43. A.J. Roe, D. McLaggan, I. Davidson, C. O'Byrne, and I.R. Booth, Perturbation of anion balance during inhibition of growth of escherichia coli by weak acids. J Bacteriol. 180 (1998) 767-772.
44. A.J. Roe, C. O'Byrne, D. McLaggan, and I.R. Booth, Inhibition of escherichia coli growth by acetic acid: A problem with methionine biosynthesis and homocysteine toxicity. Microbiology. 148 (2002) 2215-2222.
45. C.M. Takahashi, D.F. Takahashi, M.L. Carvalhal, and F. Alterthum, Effects of acetate on the growth and fermentation performance of escherichia coli ko11. Appl Biochem Biotechnol. 81 (1999) 193-203.
46. B.T. Koh, U. Nakashimada, M. Pfeiffer, and M.G.S. Yap, Comparison of acetate inhibition on growth of host and recombinant e. Coli k12 strains. Biotechnology Letters. 14 (1992) 1115-1118.
47. G.W. Luli and W.R. Strohl, Comparison of growth, acetate production, and acetate inhibition of escherichia coli strains in batch and fed-batch fermentations. Appl Environ Microbiol. 56 (1990) 1004-1011.
48. K. Nakano, M. Rischke, S. Sato, and H. Markl, Influence of acetic acid on the growth of escherichia coli k12 during high-cell-density cultivation in a dialysis reactor. Appl Microbiol Biotechnol. 48 (1997) 597-601.
49. B.J. Axe D., Transport of lactate and acetate through the energized cytoplasmic membrane of excherichia coli. Biotechnol Bioeng. 47 (1995) 8-19.
50. A. Walter and J. Gutknecht, Monocarboxylic acid permeation through lipid bilayer membranes. J Membr Biol. 77 (1984) 255-264.
51. C.A. Cherrington, M. Hinton, and I. Chopra, Effect of short-chain organic acids on macromolecular synthesis in escherichia coli. J Appl Bacteriol. 68 (1990) 69-74.
52. R.P. Sinha, Toxicity of organic acids for repair-deficient strains of escherichia coli. Applied and Environmental Microbiology. 51 (1986) 1364-1366.
53. C.A. Cherrington, M. Hinton, G.R. Pearson, and I. Chopra, Inhibition of escherichia coli k12 by short-chain organic acids: Lack of evidence for induction of the sos response. J Appl Bacteriol. 70 (1991) 156-160.
54. C.A. Cherrington, M. Hinton, G.R. Pearson, and I. Chopra, Short-chain organic acids at ph 5.0 kill escherichia coli and salmonella spp. Without causing membrane perturbation. J Appl Bacteriol. 70 (1991) 161-165.
55. D. McLaggan, J. Naprstek, E.T. Buurman, and W. Epstein, Interdependence of k+ and glutamate accumulation during osmotic adaptation of escherichia coli. J Biol Chem. 269 (1994) 1911-1917.
56. S.A. Underwood, M.L. Buszko, K.T. Shanmugam, and L.O. Ingram, Lack of protective osmolytes limits final cell density and volumetric productivity of
130

ethanologenic escherichia coli ko11 during xylose fermentation. Appl Environ Microbiol. 70 (2004) 2734-2740.
57. R.G. Kroll and I.R. Booth, The relationship between intracellular ph, the ph gradient and potassium transport in escherichia coli. Biochem J. 216 (1983) 709-716.
58. M. Goodson and R.J. Rowbury, Habituation to normally lethal acidity by prior growth of escherichia-coli at a sub-lethal acid ph value. Letters in Applied Microbiology. 8 (1989) 77-79.
59. J. Lin, I.S. Lee, J. Frey, J.L. Slonczewski, and J.W. Foster, Comparative analysis of extreme acid survival in salmonella typhimurium, shigella flexneri, and escherichia coli. J Bacteriol. 177 (1995) 4097-4104.
60. P.L. Moreau, The lysine decarboxylase cada protects escherichia coli starved of phosphate against fermentation acids. J Bacteriol. 189 (2007) 2249-2261.
61. R. Iyer, C. Williams, and C. Miller, Arginine-agmatine antiporter in extreme acid resistance in escherichia coli. J Bacteriol. 185 (2003) 6556-6561.
62. H. Richard and J.W. Foster, Escherichia coli glutamate- and arginine-dependent acid resistance systems increase internal ph and reverse transmembrane potential. J Bacteriol. 186 (2004) 6032-6041.
63. M.P. Castanie-Cornet, T.A. Penfound, D. Smith, J.F. Elliott, and J.W. Foster, Control of acid resistance in escherichia coli. J Bacteriol. 181 (1999) 3525-3535.
64. T. Warnecke and R.T. Gill, Organic acid toxicity, tolerance, and production in escherichia coli biorefining applications. Microb Cell Fact. 4 (2005) 25.
65. J. Lin, M.P. Smith, K.C. Chapin, H.S. Baik, G.N. Bennett, and J.W. Foster, Mechanisms of acid resistance in enterohemorrhagic escherichia coli. Appl Environ Microbiol. 62 (1996) 3094-3100.
66. S. Gong, H. Richard, and J.W. Foster, Yjde (adic) is the arginine:Agmatine antiporter essential for arginine-dependent acid resistance in escherichia coli. J Bacteriol. 185 (2003) 4402-4409.
67. L.M. Maurer, E. Yohannes, S.S. Bondurant, M. Radmacher, and J.L. Slonczewski, Ph regulates genes for flagellar motility, catabolism, and oxidative stress in escherichia coli k-12. J Bacteriol. 187 (2005) 304-319.
68. H.E. Schellhorn and V.L. Stones, Regulation of katf and kate in escherichia coli k-12 by weak acids. J Bacteriol. 174 (1992) 4769-4776.
69. C.N. Arnold, J. McElhanon, A. Lee, R. Leonhart, and D.A. Siegele, Global analysis of escherichia coli gene expression during the acetate-induced acid tolerance response. J Bacteriol. 183 (2001) 2178-2186.
70. Z. Ma, S. Gong, H. Richard, D.L. Tucker, T. Conway, and J.W. Foster, Gade (yhie) activates glutamate decarboxylase-dependent acid resistance in escherichia coli k-12. Mol Microbiol. 49 (2003) 1309-1320.
131

71. Z. Ma, H. Richard, D.L. Tucker, T. Conway, and J.W. Foster, Collaborative regulation of escherichia coli glutamate-dependent acid resistance by two arac-like regulators, gadx and gadw (yhiw). J Bacteriol. 184 (2002) 7001-7012.
72. H. Richard and J.W. Foster, Sodium regulates escherichia coli acid resistance, and influences gadx- and gadw-dependent activation of gade. Microbiology. 153 (2007) 3154-3161.
73. S.H. Choi, D.J. Baumler, and C.W. Kaspar, Contribution of dps to acid stress tolerance and oxidative stress tolerance in escherichia coli o157:H7. Appl Environ Microbiol. 66 (2000) 3911-3916.
74. T.E. Warnecke, M.D. Lynch, A. Karimpour-Fard, N. Sandoval, and R.T. Gill, A genomics approach to improve the analysis and design of strain selections. Metab Eng. (2008).
75. T. Warnecke, A genomics approach to improve the analysis and design of strain selections. In Metabolic Engineering VII: Health and Sustainability: September 15 2008; Puerto Vallarta, Mexico.
76. L.P. Yomano, S.W. York, and L.O. Ingram, Isolation and characterization of ethanol-tolerant mutants of escherichia coli ko11 for fuel ethanol production. Journal of Industrial Microbiology & Biotechnology. 20 (1998) 132-138.
77. R. Gonzalez, H. Tao, J.E. Purvis, S.W. York, K.T. Shanmugam, and L.O. Ingram, Gene array-based identification of changes that contribute to ethanol tolerance in ethanologenic escherichia coli: Comparison of ko11 (parent) to ly01 (resistant mutant). Biotechnol Prog. 19 (2003) 612-623.
78. S.H. Yoon, E.G. Lee, A. Das, S.H. Lee, C. Li, H.K. Ryu, M.S. Choi, W.T. Seo, and S.W. Kim, Enhanced vanillin production from recombinant e-coli using ntg mutagenesis and adsorbent resin. Biotechnology Progress. 23 (2007) 1143-1148.
79. J. Bonomo, T. Warnecke, P. Hume, A. Marizcurrena, and R.T. Gill, A comparative study of metabolic engineering anti-metabolite tolerance in escherichia coli. Metabolic Engineering. 8 (2006) 227-239.
80. R.T. Gill, S. Wildt, Y.T. Yang, S. Ziesman, and G. Stephanopoulos, Genome-wide screening for trait conferring genes using DNA microarrays. Proceedings of the National Academy of Sciences of the United States of America. 99 (2002) 7033-7038.
81. M.D. Lynch, T. Warnecke, and R.T. Gill, Scales: Multiscale analysis of library enrichment. Nat Meth. 4 (2007) 87-93.
82. S. Gall, M.D. Lynch, N. Sandoval, and R.T. Gill, Parallel mapping of genotypes to phenotypes contributing to overall biological fitness. Metab Eng. (2008).
83. X. Peng, K. Shindo, K. Kanoh, Y. Inomata, S.K. Choi, and N. Misawa, Characterization of sphingomonas aldehyde dehydrogenase catalyzing the
132

conversion of various aromatic aldehydes to their carboxylic acids. Applied Microbiology and Biotechnology. 69 (2005) 141-150.
84. H. Alper and G. Stephanopoulos, Global transcription machinery engineering: A new approach for improving cellular phenotype. Metabolic Engineering. 9 (2007) 258-267.
85. H. Alper and G. Stephanopoulos: Global transcription machinery engineering (application). U.S. Patent and Trademark Office, Editor. 2005: USA.
86. P. Venkitasubramanian, L. Daniels, and J.P.N. Rosazza, Reduction of carboxylic acids by nocardia aldehyde oxidoreductase requires a phosphopantetheinylated enzyme. Journal of Biological Chemistry. 282 (2007) 478-485.
87. S. van Sint Fiet, J.B. van Beilen, and B. Witholt, Selection of biocatalysts for chemical synthesis. Proc Natl Acad Sci U S A. 103 (2006) 1693-1698.
88. M.J. Lopez, N.N. Nichols, B.S. Dien, J. Moreno, and R.J. Bothast, Isolation of microorganisms for biological detoxification of lignocellulosic hydrolysates. Applied Microbiology and Biotechnology. 64 (2004) 125-131.
89. M.A. Eiteman, S.A. Lee, and E. Altman, A co-fermentation strategy to consume sugar mixtures effectively. J Biol Eng. 2 (2008) 3.
90. M.A. Eiteman, A. Lakshmanaswamy, K.C. Reilly, and E. Altman, Substrate selective uptake to remove acetate and convert sugar mixtures. In 30th Symposium on Biotechnology for Fuels and Chemicals: Tuesday, May 6, 2008; New Orleans, LA.
91. W. Coyle, The future of biofuels: A global perspective. Amber Waves. 5 (Nov. 2007) 24-29.
92. Energy Information Administration: Annual energy outlook 2009 with projections to 2030. Washington, D.C.; 2009.
93. D.R. Nielsen, E. Leonard, S.H. Yoon, H.C. Tseng, C. Yuan, and K.L. Prather, Engineering alternative butanol production platforms in heterologous bacteria. Metab Eng. 11 (2009) 262-273.
94. J.R. Borden, S.W. Jones, D. Indurthi, Y. Chen, and E.T. Papoutsakis, A genomic-library based discovery of a novel, possibly synthetic, acid-tolerance mechanism in clostridium acetobutylicum involving non-coding rnas and ribosomal rna processing. Metab Eng. 12 (2010) 268-281.
95. R. Patnaik, Engineering complex phenotypes in industrial strains. Biotechnol Prog. 24 (2008) 38-47.
96. T.Y. Mills, N.R. Sandoval, and R.T. Gill, Cellulosic hydrolysate toxicity and tolerance mechanisms in escherichia coli. Biotechnol Biofuels. 2 (2009) 26.
97. J.D. Bloom and F.H. Arnold, In the light of directed evolution: Pathways of adaptive protein evolution. Proc Natl Acad Sci U S A. 106 Suppl 1 (2009) 9995-10000.
133
98. S.A. Nicolaou, S.M. Gaida, and E.T. Papoutsakis, A comparative view of metabolite and substrate stress and tolerance in microbial bioprocessing: From biofuels and chemicals, to biocatalysis and bioremediation. Metab Eng. 12 (2010) 307-331.
99. H.H. Wang, F.J. Isaacs, P.A. Carr, Z.Z. Sun, G. Xu, C.R. Forest, and G.M. Church, Programming cells by multiplex genome engineering and accelerated evolution. Nature. 460 (2009) 894-898.
100. J.R. Warner, P.J. Reeder, A. Karimpour-Fard, L.B.A. Woodruff, and R.T. Gill, Rapid profiling of a microbial genome using mixtures of barcoded oligonucleotides. Accepted to Nature Biotechnology. (2010).
101. Y.X. Zhang, K. Perry, V.A. Vinci, K. Powell, W.P. Stemmer, and S.B. del Cardayre, Genome shuffling leads to rapid phenotypic improvement in bacteria. Nature. 415 (2002) 644-646.
102. A. Singh, M.D. Lynch, and R.T. Gill, Genes restoring redox balance in fermentation-deficient e. Coli nzn111. Metab Eng. 11 (2009) 347-354.
103. S. Gall, M.D. Lynch, N.R. Sandoval, and R.T. Gill, Parallel mapping of genotypes to phenotypes contributing to overall biological fitness. Metab Eng. 10 (2008) 382-393.
104. T.E. Warnecke, M.D. Lynch, A. Karimpour-Fard, N.R. Sandoval, and R.T. Gill, A genomics approach to improve the analysis and design of strain selections. Metab Eng. 10 (2008) 154-165.
105. T.E. Warnecke, M.D. Lynch, A. Karimpour-Fard, M.L. Lipscomb, P. Handke, T. Mills, C.J. Ramey, T. Hoang, and R.T. Gill, Rapid dissection of a complex phenotype through genomic-scale mapping of fitness altering genes. Metab Eng. 12 (2010) 241-250.
106. M.D. Lynch and R.T. Gill, Broad host range vectors for stable genomic library construction. Biotechnol Bioeng. 94 (2006) 151-158.
107. F.C. Neidhardt, P.L. Bloch, and D.F. Smith, Culture medium for enterobacteria. J Bacteriol. 119 (1974) 736-747.
108. T. Baba, T. Ara, M. Hasegawa, Y. Takai, Y. Okumura, M. Baba, K.A. Datsenko, M. Tomita, B.L. Wanner, and H. Mori, Construction of escherichia coli k-12 in-frame, single-gene knockout mutants: The keio collection. Mol Syst Biol. 2 (2006) 2006 0008.
109. J. Sambrook and D. Russell: Molecular cloning: A laboratory manual. Cold Spring Harbor, NY: Cold Spring Harbor Laboratory Press; 2001.
110. D. Liger, A. Masson, D. Blanot, J. van Heijenoort, and C. Parquet, Over-production, purification and properties of the uridine-diphosphate-n-acetylmuramate:L-alanine ligase from escherichia coli. Eur J Biochem. 230 (1995) 80-87.
134

111. H.A. Ernst, A. Pham, H. Hald, J.S. Kastrup, M. Rahman, and O. Mirza, Ligand binding analyses of the putative peptide transporter yjdl from e. Coli display a significant selectivity towards dipeptides. Biochem Biophys Res Commun. 389 (2009) 112-116.
112. K.L. Roland, F.E. Powell, and C.L. Turnbough, Jr., Role of translation and attenuation in the control of pyrbi operon expression in escherichia coli k-12. J Bacteriol. 163 (1985) 991-999.
113. M.A. Eiteman and E. Altman, Overcoming acetate in escherichia coli recombinant protein fermentations. Trends Biotechnol. 24 (2006) 530-536.
114. J.W. Foster, Escherichia coli acid resistance: Tales of an amateur acidophile. Nat Rev Microbiol. 2 (2004) 898-907.
115. T. Polen, D. Rittmann, V.F. Wendisch, and H. Sahm, DNA microarray analyses of the long-term adaptive response of escherichia coli to acetate and propionate. Appl Environ Microbiol. 69 (2003) 1759-1774.
116. C. Kirkpatrick, L.M. Maurer, N.E. Oyelakin, Y.N. Yoncheva, R. Maurer, and J.L. Slonczewski, Acetate and formate stress: Opposite responses in the proteome of escherichia coli. J Bacteriol. 183 (2001) 6466-6477.
117. S.F. Elena and R.E. Lenski, Evolution experiments with microorganisms: The dynamics and genetic bases of adaptation. Nat Rev Genet. 4 (2003) 457-469.
118. R.T. Gill, S. Wildt, Y.T. Yang, S. Ziesman, and G. Stephanopoulos, Genome-wide screening for trait conferring genes using DNA microarrays. Proc Natl Acad Sci U S A. 99 (2002) 7033-7038.
119. H.M. Ellis, D. Yu, T. DiTizio, and D.L. Court, High efficiency mutagenesis, repair, and engineering of chromosomal DNA using single-stranded oligonucleotides. Proc Natl Acad Sci U S A. 98 (2001) 6742-6746.
120. N. Costantino and D.L. Court, Enhanced levels of lambda red-mediated recombinants in mismatch repair mutants. Proc Natl Acad Sci U S A. 100 (2003) 15748-15753.
121. X.T. Li, N. Costantino, L.Y. Lu, D.P. Liu, R.M. Watt, K.S. Cheah, D.L. Court, and J.D. Huang, Identification of factors influencing strand bias in oligonucleotide-mediated recombination in escherichia coli. Nucleic Acids Res. 31 (2003) 6674-6687.
122. S. Datta, N. Costantino, and D.L. Court, A set of recombineering plasmids for gram-negative bacteria. Gene. 379 (2006) 109-115.
123. S.K. Sharan, L.C. Thomason, S.G. Kuznetsov, and D.L. Court, Recombineering: A homologous recombination-based method of genetic engineering. Nat Protoc. 4 (2009) 206-223.
124. J.A. Sawitzke, N. Costantino, X.T. Li, L.C. Thomason, M. Bubunenko, C. Court, and D.L. Court, Probing cellular processes with oligo-mediated recombination
135
136
and using the knowledge gained to optimize recombineering. J Mol Biol. 407 (2011) 45-59.
125. K.A. Datsenko and B.L. Wanner, One-step inactivation of chromosomal genes in escherichia coli k-12 using pcr products. Proc Natl Acad Sci U S A. 97 (2000) 6640-6645.
126. S. Datta, N. Costantino, X. Zhou, and D.L. Court, Identification and analysis of recombineering functions from gram-negative and gram-positive bacteria and their phages. Proc Natl Acad Sci U S A. 105 (2008) 1626-1631.
127. T.F. Cooper, D.E. Rozen, and R.E. Lenski, Parallel changes in gene expression after 20,000 generations of evolution in escherichiacoli. Proc Natl Acad Sci U S A. 100 (2003) 1072-1077.
128. M.A. Harper, Z. Chen, T. Toy, I.M. Machado, S.F. Nelson, J.C. Liao, and C.J. Lee, Phenotype sequencing: Identifying the genes that cause a phenotype directly from pooled sequencing of independent mutants. PLoS One. 6 e16517.
129. Q. Zheng and X.J. Wang, Goeast: A web-based software toolkit for gene ontology enrichment analysis. Nucleic Acids Res. 36 (2008) W358-363.
130. N.R. Sandoval, T.Y. Mills, M. Zhang, and R.T. Gill, Elucidating acetate tolerance in e. Coli using a genome-wide approach. Metab Eng. 13 (2010) 214-224.
131. H.H. Wang and G.M. Church, Multiplexed genome engineering and genotyping methods applications for synthetic biology and metabolic engineering. Methods Enzymol. 498 (2011) 409-426.
132. H.M. Salis, E.A. Mirsky, and C.A. Voigt, Automated design of synthetic ribosome binding sites to control protein expression. Nat Biotechnol. 27 (2009) 946-950.


![Astrocytic tracer dynamics estimated from [1-11C]-acetate PET measurements](https://static.fdokumen.com/doc/165x107/6334cca03e69168eaf070c95/astrocytic-tracer-dynamics-estimated-from-1-11c-acetate-pet-measurements.jpg)