Elderly Asian and Hispanic Foreign- and Native-Born Living Arrangements: Accounting for Differences
23
Elderly Asian and Hispanic Foreign- and Native-Born Living Arrangements: Accounting for Differences Douglas T. Gurak 1 and Mary M. Kritz 1 1 Cornell University, Ithaca, NY, USA Abstract This study examines the relative importance of demographic, resource, and assimilation statuses in explaining the living arrangements of foreign- and native-born Asian and Hispanic elders from 11 origins in 2000 and accounting for why these groups have higher levels of extended living than native-born Whites. Drawing on the 2000 Public Use Microdata 5% Sample (PUMS) files and using logistic regression, the findings show that demographic characteristics are the major determinants of elderly extended living, followed by resource availability, assimilation, and group origin. Assimilation, on the other hand, is the major determinant of group differences between native White and Asian and Hispanic elders. While findings provide support for assimilation theory, the persistence of differentials across Asian and Hispanic groups after controlling for model covariates, and modest increases in extended living for most native-born Asian and Hispanic groups as well as native Whites in the 1990s underscores the enduring nature of ethnic diversity in living arrangements. Keywords elderly living arrangements; Asian elders; Hispanic elders; elderly immigrants Increasing U.S. immigration after passage of the 1965 Immigration Act led not only to growth in the productive age population but also to growth in the numbers of elderly immigrants from non–European origins, particularly in those from Asia and Latin America. As researchers started to study the living arrangements of these new ethnic elders, they found that Asian and Hispanic elders were considerably more likely to live in extended households than non–Hispanic Whites. However, the important questions raised by researchers, namely, why are Asian and Hispanic elders more likely than native White elders to live in extended households and will the differences in living arrangements between Asian and Hispanic elders and native Whites converge as assimilation proceeds, have not been settled. Although several studies found that Asian and Hispanic differences with native Whites in extended living diminished after controlling for demographic characteristics, social and economic resources, and assimilation, large differences remained unaccounted for (Blank and Torrecilha 1998; Burr and Mutchler 1992, 1993; Kamo and Zhou 1994; Lubben and Becerra 1987; Mutchler and Frisbie 1987; Wilmoth, DeJong, and Himes 1997). This study addresses those questions anew by looking at patterns of extended living among foreign- and native-born Asian and Hispanic elders from 11 different origins. © The Author(s) 2010 Corresponding Author: Douglas T. Gurak, Department of Development Sociology, Cornell University, Ithaca, NY 14850, USA [email protected]. Declaration of Conflicting Interests The author(s) declared no conflicts of interest with respect to the authorship and/or publication of this article. NIH Public Access Author Manuscript Res Aging. Author manuscript; available in PMC 2012 September 13. Published in final edited form as: Res Aging. 2010 September ; 32(5): 567–594. doi:10.1177/0164027510377160. NIH-PA Author Manuscript NIH-PA Author Manuscript NIH-PA Author Manuscript
-
Upload
independent -
Category
Documents
-
view
1 -
download
0
Transcript of Elderly Asian and Hispanic Foreign- and Native-Born Living Arrangements: Accounting for Differences

Elderly Asian and Hispanic Foreign- and Native-Born LivingArrangements: Accounting for Differences
Douglas T. Gurak1 and Mary M. Kritz1
1Cornell University, Ithaca, NY, USA
AbstractThis study examines the relative importance of demographic, resource, and assimilation statuses inexplaining the living arrangements of foreign- and native-born Asian and Hispanic elders from 11origins in 2000 and accounting for why these groups have higher levels of extended living thannative-born Whites. Drawing on the 2000 Public Use Microdata 5% Sample (PUMS) files andusing logistic regression, the findings show that demographic characteristics are the majordeterminants of elderly extended living, followed by resource availability, assimilation, and grouporigin. Assimilation, on the other hand, is the major determinant of group differences betweennative White and Asian and Hispanic elders. While findings provide support for assimilationtheory, the persistence of differentials across Asian and Hispanic groups after controlling formodel covariates, and modest increases in extended living for most native-born Asian andHispanic groups as well as native Whites in the 1990s underscores the enduring nature of ethnicdiversity in living arrangements.
Keywordselderly living arrangements; Asian elders; Hispanic elders; elderly immigrants
Increasing U.S. immigration after passage of the 1965 Immigration Act led not only togrowth in the productive age population but also to growth in the numbers of elderlyimmigrants from non–European origins, particularly in those from Asia and Latin America.As researchers started to study the living arrangements of these new ethnic elders, theyfound that Asian and Hispanic elders were considerably more likely to live in extendedhouseholds than non–Hispanic Whites. However, the important questions raised byresearchers, namely, why are Asian and Hispanic elders more likely than native White eldersto live in extended households and will the differences in living arrangements betweenAsian and Hispanic elders and native Whites converge as assimilation proceeds, have notbeen settled. Although several studies found that Asian and Hispanic differences with nativeWhites in extended living diminished after controlling for demographic characteristics,social and economic resources, and assimilation, large differences remained unaccounted for(Blank and Torrecilha 1998; Burr and Mutchler 1992, 1993; Kamo and Zhou 1994; Lubbenand Becerra 1987; Mutchler and Frisbie 1987; Wilmoth, DeJong, and Himes 1997). Thisstudy addresses those questions anew by looking at patterns of extended living amongforeign- and native-born Asian and Hispanic elders from 11 different origins.
© The Author(s) 2010
Corresponding Author: Douglas T. Gurak, Department of Development Sociology, Cornell University, Ithaca, NY 14850, [email protected].
Declaration of Conflicting Interests The author(s) declared no conflicts of interest with respect to the authorship and/or publicationof this article.
NIH Public AccessAuthor ManuscriptRes Aging. Author manuscript; available in PMC 2012 September 13.
Published in final edited form as:Res Aging. 2010 September ; 32(5): 567–594. doi:10.1177/0164027510377160.
NIH
-PA Author Manuscript
NIH
-PA Author Manuscript
NIH
-PA Author Manuscript
The early studies carried out on Asian and Hispanic living arrangements drew on 1980 and1990 census data but we have not found any studies that update findings using 2000 censusdata. This is surprising given that sample numbers of elderly foreign- and native-born fromdifferent origins are considerably larger in the 2000 census than they were in the twoprevious censuses due to continued immigration and population aging of foreign- andnative-born cohorts. While the numbers of non–Hispanic native White elders (hereafternative Whites) aged 60 and older increased by 6% in the 1990s, Asian foreign- and native-born elders increased by 28% and 114%, respectively, and Hispanic foreign- and native-born elders increased by 42% and 81%, respectively. These increases greatly augmentedsample numbers of ethnic elders in the 2000 census, which permits study of a larger numberof Asian and Hispanic groups than was previously possible. This article takes advantage of2000 Public Use Microdata 5% Sample (PUMS) data to examine 11 groups of Asian andHispanic elders, including their foreign- and native-born components. In addition todescribing trends in extended living between 1990 and 2000, the article addresses twoquestions: What is the relative importance of demographic, resource, and assimilationstatuses in explaining the living arrangements of foreign- and native-born Asian andHispanic elders from different origins, and what is the relative importance of thesedimensions for explaining differentials between native White and Asian and Hispanic eldersin levels of extended living? By addressing anew the issue of what accounts for ethnic levelsof extended living and for group differences between native Whites and Asian and Hispanicelders, insights can be gleaned about likely future trends in living arrangements as thenumbers of foreign- and native-born elders from Asia and Latin America increase in theyears ahead (Terrazas 2009).
Conceptual FrameworkMost native White elders in America live alone or with a spouse and no other adult relativespresent. This has evolved as the preferred living norm in a social context where elders haveeconomic alternatives to extended living (Soldo, Wolf, and Agree 1990; Wolf 1990).However, the living arrangements of Asian and Hispanic foreign- and native-born eldersdiffer considerably from this norm. Figure 1 shows that both foreign- and native-born Asianand Hispanic elders were much more likely than native Whites to reside in extendedhouseholds in 2000 and that there is considerable variation among ethnic groups from eachregion in extended living propensity. Foreign-born elders from Mexico, the DominicanRepublic, Philippines, Vietnam, and India are about four or more times as likely as nativeWhites to live in extended households. For the other groups, the differentials with nativeWhites persist but are smallest for Japanese foreign born and native-born Chinese, Cubans,and Colombians.
Efforts to explain the living arrangements of Asian and Hispanic elders usually draw ontheoretical perspectives that emphasize the roles of demographic characteristics, social andeconomic resources, assimilation, and group values. All studies show that demographiccharacteristics have robust relationships to elder living arrangements. Indeed, while maritalstatus, age, and sex are important predictors of extended living, group differences indemographic characteristics do not account for ethnic differentials with native Whites. Mostresearchers who have studied immigrant groups or the foreign- and native-born componentsof Asians and Hispanics conclude that group differences stem from more than demographiccharacteristics (Wilmoth 2001; Wilmoth et al. 1997).
A second theoretical approach focuses on economic need and resource availability, andviews extended living as a coping response to limited income, lack of resources, and hostsociety discrimination. As supporting evidence, scholars point to higher poverty rates amongethnics (McLaughlin and Jensen 1993) and survival strategies of pooling income and other
Gurak and Kritz Page 2
Res Aging. Author manuscript; available in PMC 2012 September 13.
NIH
-PA Author Manuscript
NIH
-PA Author Manuscript
NIH
-PA Author Manuscript
resources pursued by low-income families (Angel and Tienda 1982; Blank and Torrecilha1998). According to this perspective, multigenerational households in segregatedneighborhoods are encouraged by poverty and race rather than reflecting ethnic groupcultural preferences. Resource access is usually indexed by income and education based onthe assumption that they underlie elders’ ability to control their living environment andobtain needed goods and services. Since a large share of the immigrant population hasrelatively low educational attainment and income, it is reasonable to expect that groupdifferences in resources may play a role in the varied levels of extended living observed forAsian and Hispanic elders (Terrazas 2009). However, the resource explanation iscomplicated by the reality that some immigrant groups, such as Indians, have high levels ofboth resources and extended living, suggesting that something more than demographics andresources account for the large differences shown in Figure 1.
The additional element most commonly considered is immigrant assimilation. Proponents ofthis approach (Burr and Mutchler 1992; Kamo and Zhou 1994) assert that ethnic groupdifferences stem from origin group cultural preferences, the disruptions of the immigrationprocess, or challenges and obstacles encountered in the host society. Previous studies haveidentified several assimilation measures that are associated with group differences, includingduration of exposure to host society culture, English language ability, and citizenship (Albaand Nee 2003; Wilmoth 2001). A variant on the assimilation approach focuses moreexplicitly on the origin society cultures that Asian and Hispanic immigrants bring with themand calls attention to their deeply rooted normative attitudes and behaviors toward thefamily, particularly the practice in some societies of assigning children the responsibility ofcaring for elderly parents (De Vos 1990; Hirschman and Teerawichitchainan 2003; Martin1988; Ruggles and Heggeness 2008). While the assimilation and resource perspectives seegroup differences as temporal patterns that diminish as immigrants and their descendantsassimilate into mainstream America, the group culture variant focuses on normative patternsand institutional structures believed to be deeply rooted in cultural belief systems that endureacross time and generations. Ethnic groups can actively work to preserve traditionalbehavioral patterns or be constrained from changing by barriers to integration in the hostsociety. In the United States, the Amish are an example of an established ethnic group thathas maintained a separate way of life for centuries. Across generations, Amish culturalpreferences have been consciously maintained and are expressed today in the form ofdistinct familial and other behaviors. African American family patterns provide anotherexample and are often cited as having been strongly shaped by the barriers and challengespresented by American society in earlier centuries (Peek et al. 2004; Ruggles 1994).
Census data are not well suited to determining the extent to which origin culture contributesto behavioral outcomes since they include no measures of values, preferences, or organizedcultural activities. Even augmenting destination society data with origin society data, a taskbeyond the scope of the current article, cannot easily sort out the complexity of originsociety heterogeneity and diverse migration selection processes that operate both within andacross societies. As such, in most studies, origin culture is measured as a residual effect orthe component left unexplained by the model. This residual conceptualization of culture isunsatisfactory for several reasons. First, inadequate measurement of resources orassimilation, the competing concepts, may contribute to the residual group effect. Second,origin societies in Asia and Latin America are complex and heterogeneous, making itdifficult to conceptualize and measure the overall culture. Third, migration is a selectiveprocess rendering questionable the assumption that immigrants in America arerepresentative of origin society cultures. Finally, migration and the subsequent processes ofsettlement and adaptation are disruptive and different behaviors may result from thesedisruptions. This is illustrated in a recent study by Van Hook and Glick (2007), which usedcensus data from the United States and Mexico to compare living arrangements of Mexicans
Gurak and Kritz Page 3
Res Aging. Author manuscript; available in PMC 2012 September 13.
NIH
-PA Author Manuscript
NIH
-PA Author Manuscript
NIH
-PA Author Manuscript
aged 25 and older in sending and receiving contexts. They found marked differencesbetween the living arrangements of Mexican immigrants and non-immigrants in the twocountries and concluded that the immigration process disrupts family structures, leading inturn to living arrangements that are not solely dependent on group culture.
We draw on these frameworks to examine the determinants of extended living for foreign-and native-born Asian and Hispanic elders from six Asian (China, India, Japan, Korea,Philippines, and Vietnam) and five Hispanic origins (Colombia, Cuba, Dominican Republic,Mexico, and Puerto Rico) and to identify the sources of differences in extended livingbetween native Whites and Asian and Hispanic elders. Overall, 85.4% and 78.5%,respectively, of Asian and Hispanic elders came from one of these origins in 2000.However, only five of these origin groups (Mexicans, Cubans, Chinese, Japanese, andIndians) have been examined in other studies of ethnic elders (Wilmoth 2001). By looking ata larger number of ethnic groups than previous studies and differentiating between theirnative- and foreign-born components, we can provide a broader overview of livingarrangement differences both within and across regions and assess whether ethnic groupsrespond differently to resource and assimilation conditions.
To account for group differences in extended living between native White and Asian andHispanic elders from different origins, we evaluate the following four hypotheses:
Hypothesis 1: Assimilation—measured by nativity status, English language ability,age at immigration, and spatial dispersion—accounts for a significant share ofAsian and Hispanic group differences with native Whites in extended living.
Hypothesis 2: Social and economic resources—measured by education, ownincome, Social Security income, and disability status—account for a significantshare of ethnic group differences with native Whites in extended living levels butdo so less for Asian than Hispanic elders because Asians have higher resourcelevels.
Hypothesis 3: Demographic characteristics are significant determinants of elderlyextended living arrangements but not an important source of Asian and Hispanicgroup differences with native Whites because group differences in demographicsare relatively small compared to those for resources and assimilation.
Hypothesis 4: Net of assimilation, social and economic resources, and demographiccharacteristics, other unmeasured origin group characteristics remain as significantsources of Asian and Hispanic group differences with native Whites in extendedliving.
Although most of the indicators used in this study to measure covariate subsets arecomparable to those examined in other studies, we look at two understudied assimilationdimensions, namely, age at immigration and geographic dispersion. Research indicates thatrecent elderly immigrants from most origins are likely to live in extended households andalso suggests that life course stage is important for living arrangements (Blank andTorrecilha 1998; Wilmoth 2001). To assess the life course effect, we look at differences forsix age cohorts, expecting to find lower levels of extended living among immigrants whoarrive at younger ages since they will have had greater exposure to U.S. society. In contrast,foreign born arriving at older ages probably come to join family members who immigratedearlier and thus will be more likely to live in extended households.
Spatial factors have been ignored in ethnic elder studies, but there is reason to expect thatthey too may be important. Although most immigrants settle in concentrated ethnicsettlements in large metropolitan areas after they arrive (Gordon 1964; Massey and Mullan1984; Yancey, Ericksen, and Juliani 1976), immigrant groups differ greatly not only in
Gurak and Kritz Page 4
Res Aging. Author manuscript; available in PMC 2012 September 13.
NIH
-PA Author Manuscript
NIH
-PA Author Manuscript
NIH
-PA Author Manuscript
terms of which metropolitan areas they select but also in their subsequent internal dispersionrates (Kritz and Gurak 2001). Cuban elders, for instance, concentrate in Miami and otherparts of South Florida while Dominicans and Puerto Ricans favor the New York region.Mexicans are concentrated in California, Texas, and other southwestern states, butsignificant numbers of them have recently settled in metropolitan areas in the Midwest,Southeast, and Mid-Atlantic regions. Similar settlement differences occur among Asians.Whereas Filipinos and Vietnamese tend to live in Los Angeles and other western areas,Indians locate mainly in New York, New Jersey, or Chicago. Chinese and Koreans splitmore evenly between east and west coast locations. If immigrants and their descendantsremain settled in large ethnic enclaves, the social norms and behaviors of their culturalgroup are easier to reinforce and may endure longer than they would for elders who disperseto communities where fewer co-ethnics reside. Recent research shows that immigrants havebeen moving beyond gateway areas during the past two decades but that rates and patternsof dispersion vary by origin (Massey 2008). Thus, increasing numbers of Asian andHispanic elders now live in places where there are fewer co-ethnics. The forces shaping thisrecent dispersion process remain poorly understood, but research suggests that dispersedresidence is positively correlated with other assimilation indicators such as English languagefluency, duration of U.S. residence, and citizenship (Leach and Bean 2008).
Data and Measurement of Living ArrangementsTo assess why Asian and Hispanic elders differ in their living arrangements, one needs datafor several different groups that have large foreign- and native-born components. Of the 11study groups, 5 fully met this criterion in 2000, namely, Mexicans, Puerto Ricans, Japanese,Chinese, and Filipinos, since they have immigration roots in the nineteenth and earlytwentieth centuries and are the largest of the study groups. The other groups—Koreans,Indians, Vietnamese, Cubans, Dominicans, and Colombians—had small but sufficientnative-born sample sizes for study purposes in the 2000 Public Use Microdata 5% Sample.While our analysis draws mainly on 2000 census data, to assess change in livingarrangements from 1990 to 2000 we also use the 1990 PUMS 5% file. The harmonizedcensus files from IPUMS (Ruggles et al. 2009) were used for both decades.
Respondents were assigned to country of origin categories using multiple indicators.Country of birth alone identifies the foreign born, exclusive of persons born abroad to U.S.citizens, but several indicators were used to identify their native-born counterparts. Asiannative born were identified using elder’s detailed race, first and second ancestry measures,and language spoken at home and an origin assignment made if a positive result occurred onany item. Hispanic native born, in contrast, were identified by their responses to theHispanic identity item and two census ancestry questions. Spanish language was not used toassign Hispanics to an origin country since it is a common language for all Hispanic groups.A small number of native-born persons specified more than one Hispanic or Asian origin.To handle this ambiguity, we first classified all native-born ethnics whose origins were clearand rank-ordered the specified groups by size. Then we classified the mixed race/ ancestry/language cases by assigning them to the study group that had the smallest sample size. Thismeans, for example, that if an elder indicated they were Japanese on the race item andVietnamese on an ancestry or language question, they were classified as Vietnamesebecause the native-born Vietnamese elder population size was smaller than that of Japaneseelders. This procedure is arbitrary in that we could have given priority to a single measuresuch as race for Asians or Hispanic identity for Hispanics. While such a priority assignmentmight be defensible, it would also be arbitrary and have produced slightly lower native-bornsample sizes for the smaller groups, namely, Vietnamese, Indians, Colombians, andDominicans. We opted to maximize the native-born sample sizes so that a larger number ofgroups could be studied. The number of ambiguous assignments, in any case, is small.
Gurak and Kritz Page 5
Res Aging. Author manuscript; available in PMC 2012 September 13.
NIH
-PA Author Manuscript
NIH
-PA Author Manuscript
NIH
-PA Author Manuscript
Finally, although Puerto Ricans are native born, they are included in our analysis sample toadd further diversity to the Hispanic category. Puerto Ricans born in Puerto Rico areclassified as foreign born and those born in the mainland United States as native born.
The analysis focuses on elders (60 or older) living in extended versus other types of livingarrangements in 2000. Elders living in group quarters are not included in the sample. In2000, only 1.2% of foreign-born Hispanics and 0.8% of foreign-born Asians lived in groupquarters. In contrast, 5% of native White elders lived in group quarters. A person isclassified as living in an extended household if at least one adult relative other than a spouseor a relatively young child also lived in the household. A child was considered young if heor she was unmarried or married but with no spouse present and younger than 40 years ofage, or he or she was married with a spouse present but younger than 30 years of age. Theseage constraints reduce the possibility of classifying households as extended that might beconsidered nuclear, such as a case of a 60 year old with a younger spouse and children intheir 20s and 30s.
Although the analysis focuses only on the contrast between elders living in extendedhouseholds versus those living in all other types of living arrangements, we generated adetailed classification of elderly living arrangements. From the 2000 IPUMS 5% files,household data were obtained for all persons 60 or older and all other persons living in thehousehold regardless of age. We then used both IPUMS (Ruggles et al. 2009) detailedhousehold relationship codes and other information generated by counting specificcombinations of relationship and age for all persons present in 2000 to create a summarymeasure of each elder’s household type. Details of the measurement criteria and householdcompositions can be obtained from the authors. Among elders 60 or older in 2000 who didnot reside in an institution or group home, 15.5% lived in extended households. Another26.6% lived alone, 47.1% lived with spouse only, and 8.7% were in mixed relativehouseholds with a young child, grandchild, niece, or nephew present but no other adultrelative (except possibly a spouse). An additional 2.1% of elders lived in some other type ofhousehold including ones with boarders or other unrelated persons. For the total foreign-born population, the corresponding percentages were: 30.3% “extended,” 19.2% “alone,”33.3% with “spouse only,” 13.7% “mixed relative,” and 3.5% “other.” We estimated modelsemploying the adult relative constraint along with other models employing differentconstraints for age of relatives and marital status and find only small differences inestimated coefficients. The basic findings described in the following remain robustregardless of the extended living specification.
Extended living arrangements of Asian and Hispanic elders from different origins showedboth continuity and change in the 1990s (see Table 1). In 1990 and 2000, foreign- andnative-born Asians and Hispanics from all origins were more likely than native Whites tolive in extended households. Moreover, extended living increased among all Hispanicforeign-born groups in the 1990s although those increases were modest except for Mexicanswhose 1990 level of 36.4% increased to 45.9% by 2000. While several foreign-born Asiangroups (Japanese, Koreans, Filipinos, and Indians) had lower levels of extended living in2000 than in 1990, extended living increased among all the native-born Asian groups exceptIndians, and native Whites also showed an increase. Nonetheless for all groups, levels ofextended living were lower for the native born than they were for the foreign born in bothdecades, which is consistent with a convergence tendency.
Figure 1 illustrates the convergence pattern more clearly. The bars show ratios of thepercentage extended among Asian and Hispanic elders to the percentage extended amongnative Whites by ethnic origin and generational status. Differentials with native Whites werelargest for the foreign born: Mexican, Dominican, Filipino, Vietnamese, and Indian foreign
Gurak and Kritz Page 6
Res Aging. Author manuscript; available in PMC 2012 September 13.
NIH
-PA Author Manuscript
NIH
-PA Author Manuscript
NIH
-PA Author Manuscript

born had the largest ratios (3.9 to 4.7) and Japanese the lowest (2.0), but drop sharply for thenative born from all origins. Among the native born, Filipinos and Vietnamese have thehighest ratios but those for other groups fall between 1.8 (Colombians and Chinese) and 2.4(Dominicans). The high levels of heterogeneity within both regions underscores theimportance of examining ethnic groups from specific origin countries rather than usingregional averages, which are affected by origin composition and thus tend toward theaverages of the larger groups. Mexicans, for instance, form 49% of the Hispanic eldercategory, which means that descriptive statistics for Hispanics largely reflect the Mexicanpattern.
Asian and Hispanic Elders: Group HeterogeneityWe use multiple indicators to measure assimilation, resource, and demographiccharacteristics to determine whether they account for why Asian and Hispanic elders differfrom native Whites in their levels of extended living. Assimilation is measured by threeEnglish language dummy variables (speaks English only, speaks English well or very well,or speaks English poorly or not at all [referent]), three spatial measures (lives in each origingroup’s top five gateways [referent], lives in each origin group’s top 6th to 20th largestareas, or lives in a dispersed area beyond top 20 gateways), and six age at immigrationvariables. Although the dispersed category includes most of the country, further refinementis not possible given that most foreign-born elders live in one of their group’s top 10metropolitan areas and thus sample sizes are small for dispersed areas. For instance, lessthan 10% of Cubans and Dominicans and only 11% to 20% of Chinese and Colombianslived in dispersed areas in 2000. Cutoffs for the dispersion categories had to assure adequatecell sizes for all origin groups. Rather than using an indicator variable for nativity, we treatnative-born persons as the reference category for the age at immigration dummies. Thus, thecoefficients for the age at immigration indicator variables (arrived at ages: 0-15, 16-29,30-44, 45-59, or 60 and older) represent deviations from native-born persons.
Elders’ economic, social, and physical resources are measured by indicators of education,income, and physical limitations. There are three education dummy variables, namely,whether the respondent has less than a high school degree (referent), a high school degree orsome college, or a college degree or higher. Two measures of income are used: receipt ofSocial Security income (coded 1 if there was no income from this source) and the natural logof total income received from all sources. A higher incidence of extended living is expectedamong elders who have no Social Security and lower own income and education resources.Physical limitations can also affect elders’ ability to live on their own and are measured by acount index of the number of disabilities or limitations an elder had. The 2000 censusdisability and limitation measures provide information about work disabilities, mobilitydisabilities, personal care limitations, memory problems, seeing and hearing limitations, andgeneral physical difficulties. A seven-category measure was constructed that ranges from 0for elders with no limitations to 6 for those with all six limitations. We expect physicallimitations to be positively related to living in extended households.
Several demographic measures are included in the analysis and expected to have comparablerelationships for all elders regardless of their generational status and group origin. Studiesshow that age generally has a negative relationship to extended living but this effect isnonlinear and increases among the very old. Therefore, the models include a quadratic ageterm. Research also shows that marital status is an important determinant of elderly livingarrangements. Four categories of marital status are differentiated: married (referent),divorced or separated, widowed, and never married. Married elders are expected to be lesslikely than those in other marital statuses to live in extended households. Both men andwomen are included in the sample but differentiated by a dummy variable (female = 1).
Gurak and Kritz Page 7
Res Aging. Author manuscript; available in PMC 2012 September 13.
NIH
-PA Author Manuscript
NIH
-PA Author Manuscript
NIH
-PA Author Manuscript
Given that women live longer than men and have lower resource levels, they should be morelikely to live in extended households.
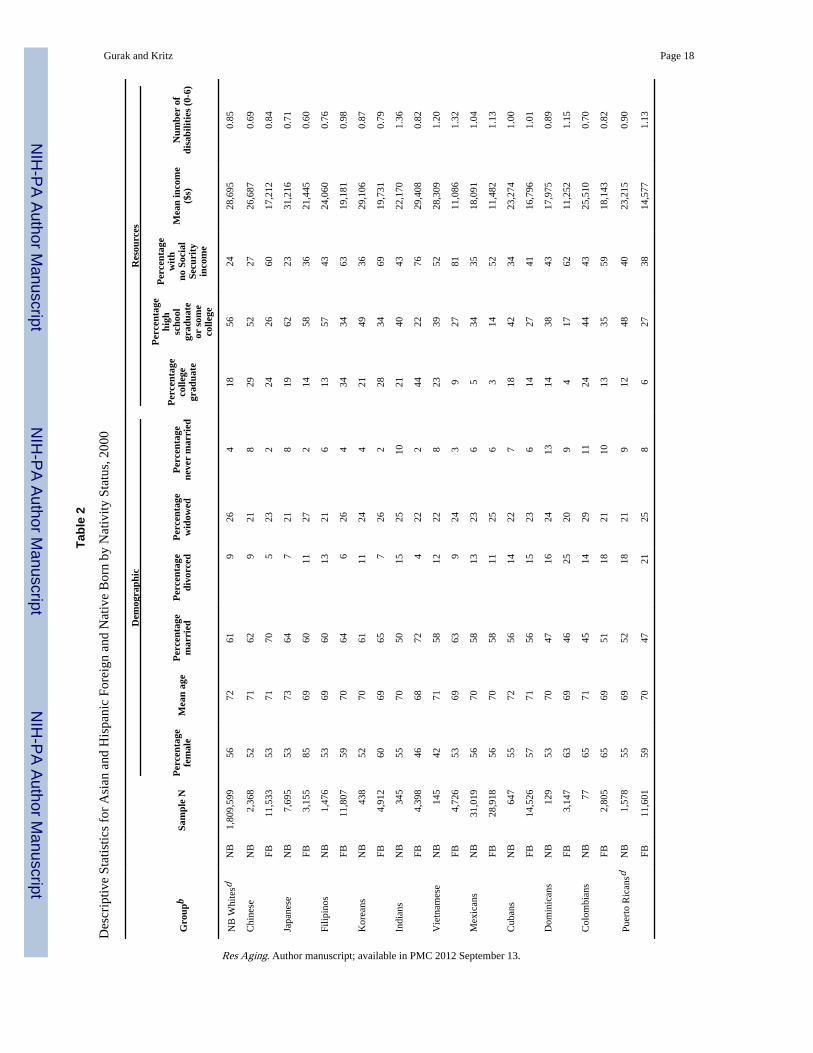
Demographic characteristics, social and economic resources, and assimilation levels differconsiderably for Asians and Hispanics from different origins and by generational status (seeTable 2). Among foreign-born Asians, the percentage female ranges from 46% for Indians to59% for Filipinos and 85% for Japanese. The foreign-born Japanese sex imbalance is likelydue to the large number of Japanese women who came to the United States as “war brides”during the late 1940s and 1950s. Among Asians, the percentage currently married rangesfrom 50% for native-born Indians to 70% for foreign-born Chinese. Among Hispanics therange extends from 45% for native-born Dominicans and Colombians to 58% for Mexicans.Despite these substantial ranges, the demographic profiles of most groups are quite similar.
For most groups, native-born elders were more likely to be college graduates than theirforeign-born counterparts but that pattern does not hold for Indians, Koreans, and Filipinos.The contrast is most dramatic for Indian elders—44% of the foreign born but only 21% ofthe native born had college degrees. While high-skilled immigration has characterizedIndian, Korean, and Filipino migrations for decades, other groups had lower educationallevels. A similar pattern occurs for income. Native-born elders from all groups exceptIndians had, as expected, considerably higher incomes than their foreign-born counterparts.While Vietnamese foreign born had the lowest income of the groups, Vietnamese native-born income was exceeded only by that of native-born Japanese, Koreans, and nativeWhites. Both generations of Mexican and Dominican elders, in contrast, had low incomes.Compared to native Whites, native-born and particularly foreign-born Asian and Hispanicelders were less likely to receive Social Security income. That pattern undoubtedly occursbecause many foreign born arrive in the United States at older ages and thus do not havetime to accumulate sufficient work experience to qualify for Social Security.
Group heterogeneity also characterizes the assimilation indicators, especially those forgeographic dispersion. The expected pattern of greater dispersion for native-born ethnicsobtains for all groups but Japanese, which is also consistent with the “war bride” idea sincemany American soldiers returned to small urban or rural areas with their foreign-born wives.Overall, Asian foreign and native born from different origins tend to be more dispersed thanHispanics, but there is considerable group variation within both regions. For instance, thepercentage of Hispanic foreign-born elders residing in dispersed areas ranges from 7% forDominicans to 32% for Mexicans and rises to 47% for native-born Puerto Ricans. The rangefor foreign-born Asian elders is also considerable. Namely, 40% of foreign-born Indians and48% of foreign-born Japanese reside in dispersed areas but only 16% of Chinese and 25% ofKoreans. Chinese native born are the least likely (23%) of native-born Asians to reside indispersed regions.
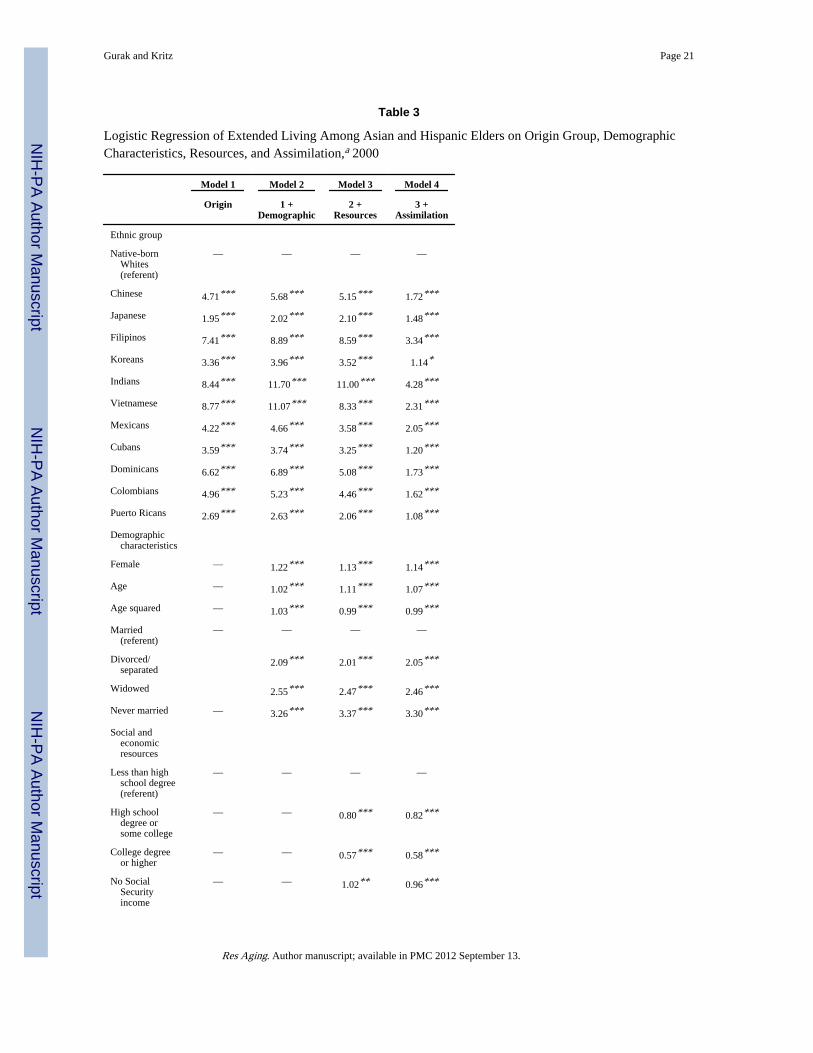
Modeling the Sources of Group Differences in Extended LivingWe use nested logistic regression models to address the question of whether ethnic origin,demographic characteristics, social and economic resources, and assimilation explain higherlevels of extended living among Asian and Hispanic elders (Table 3). The nested modelsalso permit an assessment of the relative importance of demographic characteristics,resources, and assimilation in accounting for group differences with native Whites inextended living. Model 1 shows the considerable range among Asian and Hispanic elders inextended living and establishes the zero-order relationship against which the effects of othercovariate subsets on group differences can be evaluated. After controlling for demographiccharacteristics (Model 2), extended living increases for all groups except Puerto Ricans, andas expected, the log odds of extended living are higher for women and older seniors and
Gurak and Kritz Page 8
Res Aging. Author manuscript; available in PMC 2012 September 13.
NIH
-PA Author Manuscript
NIH
-PA Author Manuscript
NIH
-PA Author Manuscript
lower for married elders. Controlling for resources (Model 3), on the other hand, has mixedeffects on origin group odds ratios. For Asians, the odds ratios tend to be larger than theywere after controlling for origin alone but among Hispanics, the ratios show only modestchange. Social and economic resources have the expected effect on extended living—elderswith more education and income and fewer disabilities have lower log odds of extendedliving.
After controlling for group differences in assimilation (Model 4), sharp reductions occur inextended living differences with native Whites. Since native Whites as well as native-bornAsians and Hispanics are the reference group for the age at immigration dummy variables,this model also shows the importance of generational status. Immigrants who arrive aschildren (younger than 16) have similar levels of extended living as the native born andthose who arrive before 30 have only modest differences. Indeed, after controlling forgenerational status in addition to age at immigration, English language fluency, andgeographic dispersion, only four groups—Filipinos, Indians, Vietnamese, and Mexicans—have odds of extended living greater than twice those of native Whites, and net of othercovariates, the odds of extended living for Korean, Puerto Rican, and Cuban elders are onlyslightly greater than those for native Whites. As expected, English language fluencydecreases the log odds of extended living, and arrival in the United States at an older ageincreases it. The dispersion indicators also have the expected effects on extended living.Compared to gateway elders, the odds that elders lived in extended households was 11%lower if they lived in a mini-gateway and 29% lower if they lived in a dispersed area.
Since the models in Table 3 are nested, the relative importance of covariate subsets forpredicting extended living levels can be assessed using log likelihood ratio tests that contrastdifferences in model fit when models are estimated without a particular covariate set andcompared to the full model (Table 3, note b). Larger test scores indicate which covariate sethas the greatest effect in the model. The likelihood ratio tests are reported in the last row ofTable 3 and indicate that demographic characteristics are the most important source of elderextended living, followed by social and economic resources, assimilation, and group origin.Whether elders reside in extended households is also strongly conditioned by their age, sex,and marital status as well as by available resources—elders with no Social Security income,less own income and educational resources, and more physical limitations are more likely tobe in extended arrangements. In addition, elders who are more assimilated in terms ofEnglish language ability, geographic dispersion, native-born status, and age at arrival areless likely to live in extended households.
Although differences among Asian and Hispanic groups in levels of extended livingdiminish after controlling for demographic, resource, and assimilation covariates, there is asignificant unexplained component of the relationship. Moreover, the regression analysisindicates that the covariate subsets that are most important for extended living differ fromthose that account for group differentials. Figure 2 highlights this point more clearly thanTable 3 models do by displaying a histogram with each group’s odds ratios from fourmodels that include only two sets of indicators, group origin and another covariate subset.Since the first bar for each group specifies the zero-order odds ratios and the second barspecifies the odds ratios when demographic factors are included in the model, the odds ratiosfor those two bars are the same as those in Models 1 and 2, Table 3. The third bar, however,shows the resource effect from a new model (not shown) that included only group origin andelderly resources and the fourth bar shows the odds ratios from a new model (not shown)that included only group origin and assimilation indicators.
As discussed earlier, controlling for demographic characteristics actually increases extendedliving differentials between native Whites and Asian and Hispanic groups, which is why the
Gurak and Kritz Page 9
Res Aging. Author manuscript; available in PMC 2012 September 13.
NIH
-PA Author Manuscript
NIH
-PA Author Manuscript
NIH
-PA Author Manuscript
second bar is higher than the first bar in almost all the group histograms (except PuertoRicans). In contrast, the bars from the third model, which included only group origin andresources, show three different patterns—a decrease in extension, an increase in extension,and no effect. For the five Hispanic groups and Vietnamese, the inclusion of resourcesreduces their differential with native Whites, a finding likely due to the fact that thesegroups have relatively low income levels. For two groups, Indians and Filipinos, theinclusion of resources increases their differential with native Whites, a finding that likelystems from their high education levels. In fact, 44% of Indian foreign-born elders and 34%of Filipino foreign-born elders had completed at least four years of college, and educatedadults have lower levels of extended living. For Chinese, Koreans, and Japanese, resourceshave no effect on the magnitude of the odds ratio that contrasts their odds of extended livingwith those of native Whites.
Assimilation has the greatest substantive impact on ethnic group differentials with nativeWhites in extended living. That effect is seen by the sharp drop in the height of the fourthbar, which captures the assimilation effect. This is not surprising since the study groups andnative Whites differ more systematically on the assimilation measures—English languageability, age at immigration, and dispersion—than they do on the demographic measures. Sexratios, age, and marital status do not differ markedly across elderly groups and thosemeasures have comparable effects on extended living regardless of elders’ origins. Theassimilation measures, in contrast, reflect differences that stem both from origin societycultural systems as well as immigration selectivity processes that give immigrant groupstheir distinctive education, skill, and income profiles. The relatively high education profilesof Indian and other Asian foreign born, for instance, differ considerably from the educationprofiles of their origin societies.
But the assimilation effect may also stem from how it is measured. Since native Whites arealways in the age at immigration reference category in our models, along with the native-born components of the Asian and Hispanic groups, this undoubtedly contributes to the largereduction in group differentials associated with the assimilation measures. Although nothingcan be done about this since by definition native Whites have no foreign-born component,we used sensitivity analysis to determine if the assimilation effect is a measurement artifact.The full model for the fourth bar, Figure 2, and the full model, Table 3 (not shown), werereestimated using only geographical dispersion to measure assimilation while keeping therest of the model unchanged. While recent foreign born are less likely to be geographicallydispersed than native Whites, there is nothing in the measurement procedure that dictatesthis outcome. In the sensitivity models compared to the original models, the size of theassimilation effects and the associated odds ratio reduction were smaller for all groupsexcept Japanese and Puerto Ricans. Nevertheless, assimilation significantly reducedextended living differentials between the ethnic groups and native Whites, and the heights ofthe fourth bars in Figure 2 remained lower than those associated with demographics andresources.
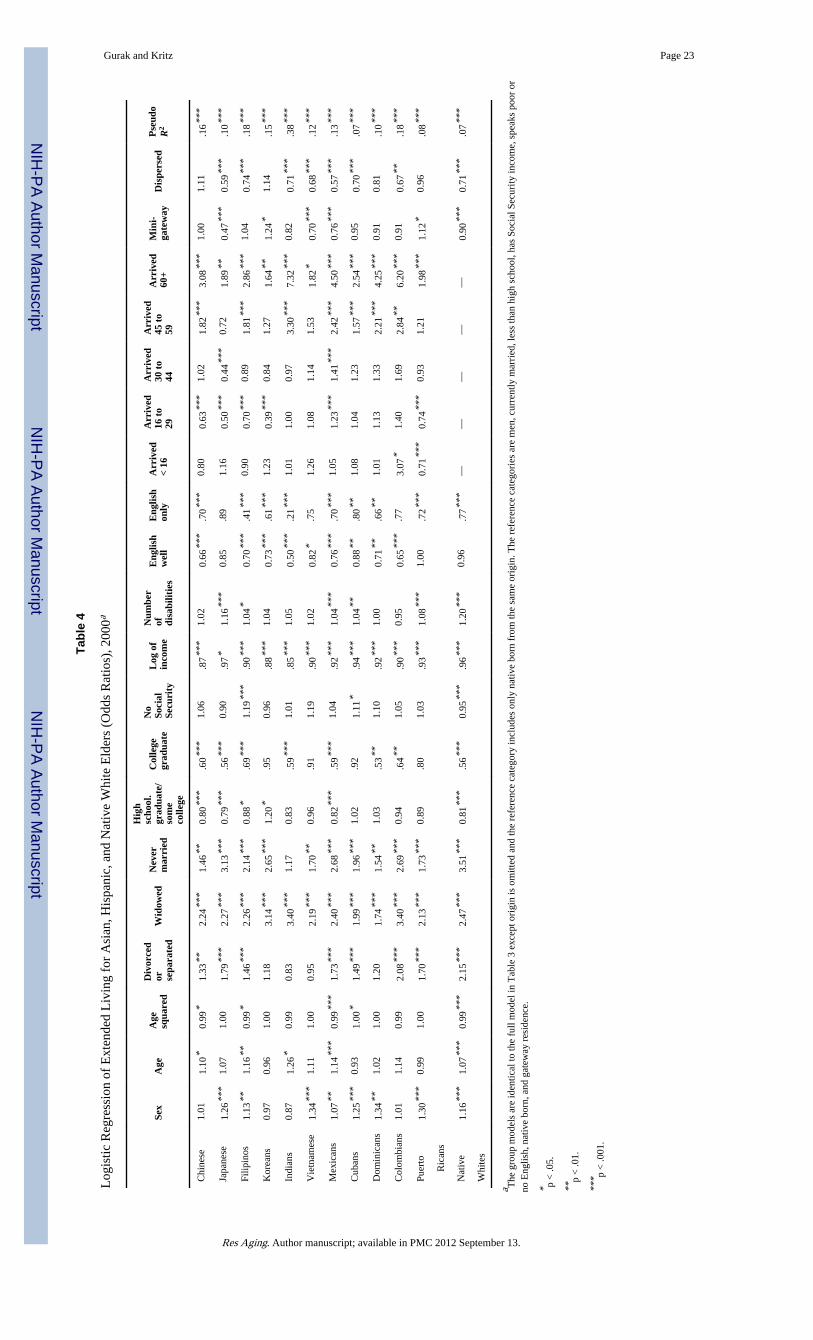
Given the heterogeneity observed for Asian and Hispanic elders in levels of extended livingand on many other covariates, we performed tests for group interactions with all covariates.These interaction tests were indeed significant, which is not surprising given that theanalytic sample has close to 2 million cases. Therefore, separate group models wereestimated for native Whites and the 11 Asian and Hispanic groups to assess the extent towhich origin determinants of extended living differed (Table 4). While the group-specificmodels show some variation in the magnitude and significance of relationships, they arehighly consistent with the overall findings from the pooled full model (Table 3, Model 4).Most relationships, even if insignificant, are in the expected direction. Moreover, the oddsratios for the demographic measures are highly consistent across groups, and those for
Gurak and Kritz Page 10
Res Aging. Author manuscript; available in PMC 2012 September 13.
NIH
-PA Author Manuscript
NIH
-PA Author Manuscript
NIH
-PA Author Manuscript

resources are comparable. The assimilation relationships vary the most across groups, butthe differences are generally in degree rather than direction with some exceptions. Forinstance, contrary to the expectation of no significant difference, Colombian elders whoimmigrated as youths have higher log odds of extended living than their native-borncounterparts. However, the small size of the native-born component of the Colombian eldersample suggests caution in interpreting that coefficient. The results for key covariates suchas income, arrival in the United States after age 59, and residence in dispersed regions alsohave expected effects in most cases. All 12 coefficients for income are negative andsignificant; 11 coefficients for immigration after age 59 are positive and significant; and 8 of12 coefficients for dispersed residence are negative and significant. All of the exceptions arestatistically insignificant. Although interactions can influence estimates of the magnitude ofreductions in group differentials in extended living, these influences appear to be small. Theoverall consistency of the findings for the pooled and group models suggests that it isreasonable to use the more parsimonious pooled models. Nothing in the group modelssuggests that assimilation levels are not important for understanding differentials with nativeWhites or that demographic and resource covariates account for observed group differences.
DiscussionTwo questions were addressed in this article: What is the relative importance ofdemographic, resource, and assimilation statuses for predicting extended living amongforeign- and native-born Asian and Hispanic elders and in explaining the living arrangementdifferentials of these elders with native Whites. To address these questions we examined theliving arrangements of the six Asian and five Hispanic groups with the largest numbers ofnativeborn elderly in 2000. Four hypotheses framed the analysis. The first expectation wasthat assimilation would be strongly related to reductions in extended-living groupdifferences with native Whites, and the analysis confirmed this expectation. Controlling forgroup differences in age at immigration, English language fluency, and spatial dispersionsignificantly reduced gaps between native Whites and Asian and Hispanic elders in extendedliving. The second expectation was that social and economic resources would account for asignificant share of Hispanic group differences with native Whites in extended living levelsbut be less important for Asian elders because of their relatively high resource levels. Theseexpectations were supported by the analysis. Among groups characterized by low resourcelevels, namely, Vietnamese and Hispanic elders, controlling for resources did reducedifferentials with native Whites in extended living, although the reductions were smallerthan those for assimilation. For Chinese, Koreans, and Japanese, resource availability wasunrelated to group differences with native Whites, and for two groups, Indians and Filipinos,controlling for resource differences increased differentials with native Whites.
While we expected demographic characteristics to be important determinants of extendedliving, we did not expect them to be important predictors of group differences in extendedliving because those characteristics do not differ much across groups. These expectationswere borne out by the analysis. Demographic characteristics were indeed the most importantdeterminants of whether an elder lived in an extended household, but they had little effect onthe gaps between native Whites and Asian and Hispanic groups. Finally, we expected that aresidual group effect would remain after taking into account demographic, resource, andassimilation statuses. The analysis confirmed this expectation, although the residual effectwas relatively small for several groups albeit significant. Indians, Filipinos, Vietnamese, andMexicans had the largest residuals.
The findings for the effect of resource availability on extended living raise several issuesthat require further investigation. The resource perspective emphasizes the impact ofconstrained access to education and income and suggests that extended living serves as a
Gurak and Kritz Page 11
Res Aging. Author manuscript; available in PMC 2012 September 13.
NIH
-PA Author Manuscript
NIH
-PA Author Manuscript
NIH
-PA Author Manuscript
means of coping with these constraints. Our analysis indicates that this reasoning applieswithin groups: In the group models, lower levels of resources were positively associatedwith extended living. However, for explaining group differences with native Whites, theimpact of resources was mixed. When the focus was on groups with generally low resourcelevels, namely, Hispanics and Vietnamese, controlling for resources did reduce thedifferentials with native Whites. However, for high resource groups (all Asian groups exceptVietnamese), controlling for resource levels either had no effect on group differentials orincreased them. What is happening in terms of the statistical estimation is clear: Controllingfor resource levels for a high resource group means that it is assigned a lower resource levelthan it actually has. This applies upward pressure on the adjusted group coefficient. Whatneeds further consideration is the set of reasons why some high resource groups have highlevels of extended living. One possibility is that the availability of more economic resourcesallows immigrants to fulfill their preferences to form extended households and makeimmigration arrangements for parents to join them in the United States after they naturalize.Under U.S. immigration policy, parents are considered immediate relatives of citizens andnot subject to numeric limitations. Further research is needed to determine whetherimmigration of elders is an articulation of strong group norms favoring extended householdsor simply a means of reuniting families separated by migration that is more available toethnic groups with high resource levels. We can only say with certainty that for groups withboth high levels of extended living and high resource levels, extended living is notpredominantly due to efforts to cope with resource constraints.
What implications do study findings have for future living arrangement trends? Willconvergence in living arrangements continue to proceed among Asians and Hispanics, orwill large ethnic differentials among the native born persist? Some speculation can beoffered based on study findings. The results for the assimilation measures indicate that theconvergence process is well underway. Levels of extended living among native-born Asianand Hispanic elders are dramatically lower than among the foreign born and also loweramong foreign born who immigrate at younger ages. Ethnics more adept at English havereduced levels of extended living, and most ethnics are learning English. Residence indispersed areas is also strongly linked to lower levels of extended living, and that processtoo is underway. And, the longer immigrants live in the United States, the lower the oddsthat they live in extended households as elders. Still, caution is in order. Between 1990 and2000, levels of extended living increased modestly for most native-born Asian and Hispanicelders and native Whites and an argument can be made that the forces encouraging elderlyextended living remain strong since even under the hypothetical condition of equalizeddemographic, resource, and assimilation conditions, the analysis shows that significantdifferentials persist for most groups.
The extent of convergence is likely to be linked to the magnitude of immigration in thefuture and to the robustness of assimilation processes through time. Immigration of Asiansand Hispanics continues at a high level and the passage of time is providing the opportunityfor the offspring of earlier immigrants to age and for growth in native-born Asian andHispanic populations. As ethnic populations grow, cultural contacts and networks are easierto maintain. Since there are already differences among Asians and Hispanics from differentorigins in extended living levels and trends, one possible scenario is that those patterns willpersist in the years ahead, albeit at levels lower than currently. It is also possible thatextended living may increase in importance as an adaptation to problems posed bypopulation aging. However, until more becomes known about the long-term assimilationtrajectories of Asians and Hispanics, it is difficult to draw this conclusion without furtherresearch. In the future, when data from a larger number of annual American CommunitySurveys can be aggregated, it will be possible to extend this analysis to additional groupsand examine in greater detail not only trends in ethnic group living arrangement but also the
Gurak and Kritz Page 12
Res Aging. Author manuscript; available in PMC 2012 September 13.
NIH
-PA Author Manuscript
NIH
-PA Author Manuscript
NIH
-PA Author Manuscript
effects of assimilation, resources, and demographic composition on elderly livingarrangements.
AcknowledgmentsFunding This research was supported by a grant from the Polson Institute for Global Development.
BiosDouglas T. Gurak is a professor of development sociology and director of the PolsonInstitute for Global Development at Cornell University. His main interests concern the linksbetween the social, historical, and economic forces shaping international and internalmigration. He is currently involved in studies of the internal migration and dispersion of theforeign born to new U.S. destinations and the determinants of changing living arrangementsof ethnic elders.
Mary M. Kritz is a senior research associate in the Department of Development Sociology,Cornell University. She has written extensively on global migration trends, includinginternational student mobility, international migration governance, and migration anddevelopment. She is currently involved in studies of the internal migration and dispersion ofthe foreign born to new U.S. destinations and the determinants of African internationalstudent mobility.
ReferencesAlba, Richard D.; Nee, Victor. Remaking the American Mainstream: Assimilation and Contemporary
Immigration. Harvard University Press; Cambridge, MA: 2003.
Angel, Ronald J.; Tienda, Marta. Determinants of Extended Household Structure: Cultural Pattern orEconomic Need? American Journal of Sociology. 1982; 87:1360–383.
Blank, Susan; Torrecilha, Ramon. Understanding the Living Arrangements of Latino Immigrants: ALife Course Approach. International Migration Review. 1998; 32:3–19. [PubMed: 12321471]
Burr, Jeffrey A.; Mutchler, Jan E. The Living Arrangements of Unmarried Elderly Hispanic Females.Demography. 1992; 29:93–112. [PubMed: 1547905]
Burr, Jeffrey A.; Mutchler, Jan E. Nativity, Acculturation, and Economic Status: Explanations ofAsian American Living Arrangements in Later Life. Journal of Gerontology: Social Sciences. 1993;48:S55–S63.
De Vos, Susan. Extended Family Living Among Older People in Six Latin American Countries.Journal of Gerontology: Social Sciences. 1990; 45:S87–S94.
Gordon, Milton M. Assimilation in American Life: The Role of Race, Religion, and National Origins.D.C. Health; Lexington, MA: 1964.
Hirschman, Charles; Teerawichitchainan, Bussarawan. Cultural and Socio-economic Influences onDivorce During Modernization: Southeast, 1940s to 1960s. Population and Development Review.2003; 29:215–53.
Kamo, Yoshinori; Zhou, Min. Living Arrangements of Elderly Chinese and Japanese in the UnitedStates. Journal of Marriage and the Family. 1994; 56:544–58.
Kritz, Mary M.; Gurak, Douglas T. The Impact of Immigration on the Internal Migration of Nativesand Immigrants. Demography. 2001; 38:133–45. [PubMed: 11227841]
Leach, Mark A.; Bean, Frank D. The Structure and Dynamics of Mexican Migration to NewDestinations in the United States. In: Massey, DS., editor. New Faces in New Places: TheChanging Geography of American Immigration. Russell Sage Foundation; New York: 2008. p.51-74.
Lubben, J.; Becerra, RM. Social Support Among Black, Mexican, and Chinese Elderly. In: Gelfand,DE.; Barresi, CM., editors. Ethnic Dimensions of Aging. Springer; New York: 1987.
Martin, Linda G. The Aging of Asia. Journal of Gerontology: Social Sciences. 1988; 43:S99–S113.
Gurak and Kritz Page 13
Res Aging. Author manuscript; available in PMC 2012 September 13.
NIH
-PA Author Manuscript
NIH
-PA Author Manuscript
NIH
-PA Author Manuscript
Massey, Douglas S. New Faces in New Places: The Changing Geography of American Immigration.Russell Sage Foundation; New York: 2008.
Massey, Douglas S.; Mullan, Brendan P. Processes of Hispanic and Black Spatial Assimilation.American Journal of Sociology. 1984; 89:836–73.
McLaughlin, Diane K.; Jensen, Lief. Poverty Among Older Americans: The Plight of NonmetropolitanElders. Journal of Gerontology: Social Sciences. 1993; 48:S44–S54.
Mutchler, Jan E.; Frisbie, W. Parker Household Structure Among the Elderly: Racial/EthnicDifferentials. National Journal of Sociology. 1987; 1:3–23.
Peek, Chuck W.; Koropeckyj-Cox, Tanya; Zsembik, Barbara A.; Coward, Raymond T. RaceComparisons of the Household Dynamics of Older Adults. Research on Aging. 2004; 26:179–201.
Ruggles, Steven. The Origins of African-American Family Structure. American Sociological Review.1994; 59:136–51.
Ruggles, Steven; Heggeness, Misty. Intergenerational Coresidence in Developing Countries.Population and Development Review. 2008; 34:253–81. [PubMed: 21562612]
Ruggles, Steven; Sobek, Matthew; Alexander, Trent; Fitch, Catherine A.; Goeken, Ronald; Hall,Patricia Kelly; King, Miriam; Ronnander, Chad. Integrated Public Use Microdata Series: Version4.0. 2009. http://usa.ipums.org/usa
Soldo, Beth J.; Wolf, Douglas A.; Agree, EM. Family, Households, and Care Arrangements of FrailOlder Women: A Structural Analysis. Journal of Gerontology: Social Sciences. 1990; 45:S-238–49.
Terrazas, Aaron. Older Immigrants in the United States. 2009.http://www.migration information.org/USFocus/display.cfm?ID=727
Van Hook, Jennifer; Glick, Jennifer E. Immigration and Living Arrangements: Moving BeyondEconomic Need Versus Acculturation. Demography. 2007; 44:225–49. [PubMed: 17583303]
Wilmoth, Janet M. Living Arrangements Among Older Immigrants in the United States. TheGerontologist. 2001; 41:228–38. [PubMed: 11327489]
Wilmoth, Janet M.; DeJong, Gordon F.; Himes, Christine L. Immigrant and Non-Immigrant LivingArrangements Among America’s White, Hispanic, and Asian Elderly Population. InternationalJournal of Sociology and Social Policy. 1997; 17:57–81.
Wolf, Douglas A. Household Patterns of Older Women: Some International Comparisons. Research onAging. 1990; 12:463–86. [PubMed: 2277858]
Yancey, William L.; Ericksen, Eugene P.; Juliani, Richard N. Emergent Ethnicity: A Review andReformulation. American Sociological Review. 1976; 41:391–403.
Gurak and Kritz Page 14
Res Aging. Author manuscript; available in PMC 2012 September 13.
NIH
-PA Author Manuscript
NIH
-PA Author Manuscript
NIH
-PA Author Manuscript

Figure 1.Ratios of percentage extended among Asian and Hispanic elders to native White percentageextended by origin and nativity, 2000.Note: For each group, the top bar provides the ratio for the foreign born and the bottom barprovides the ratio for the native born.
Gurak and Kritz Page 15
Res Aging. Author manuscript; available in PMC 2012 September 13.
NIH
-PA Author Manuscript
NIH
-PA Author Manuscript
NIH
-PA Author Manuscript
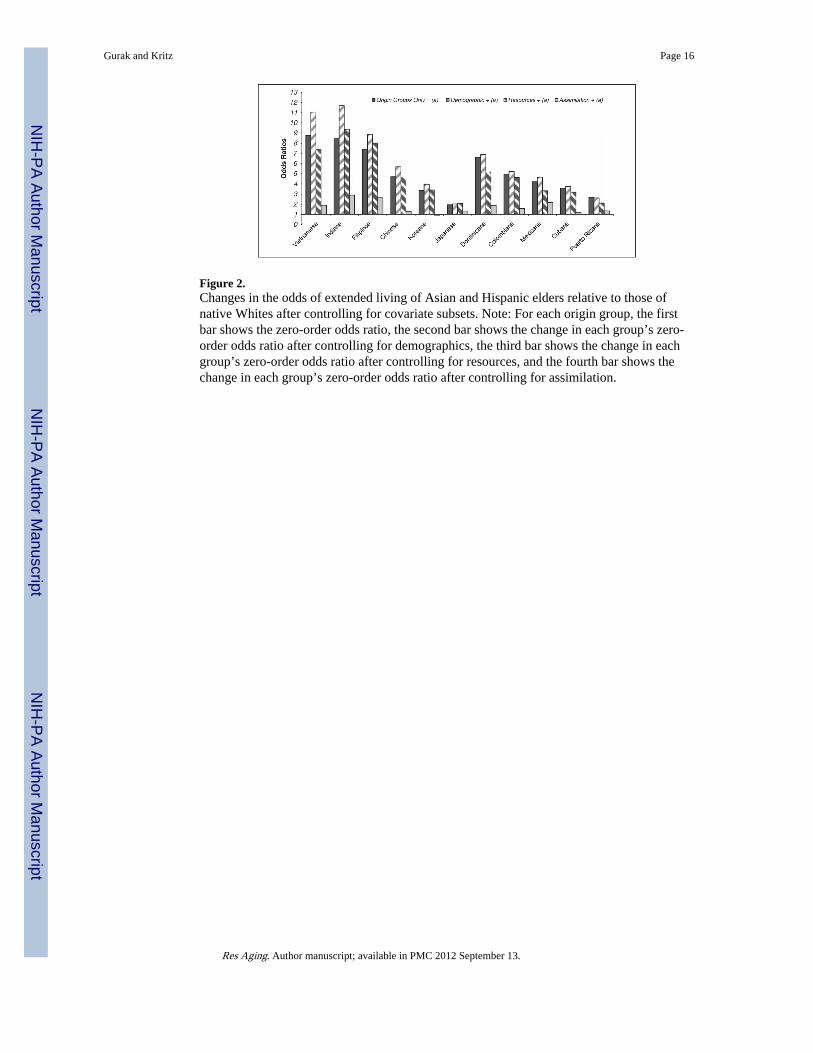
Figure 2.Changes in the odds of extended living of Asian and Hispanic elders relative to those ofnative Whites after controlling for covariate subsets. Note: For each origin group, the firstbar shows the zero-order odds ratio, the second bar shows the change in each group’s zero-order odds ratio after controlling for demographics, the third bar shows the change in eachgroup’s zero-order odds ratio after controlling for resources, and the fourth bar shows thechange in each group’s zero-order odds ratio after controlling for assimilation.
Gurak and Kritz Page 16
Res Aging. Author manuscript; available in PMC 2012 September 13.
NIH
-PA Author Manuscript
NIH
-PA Author Manuscript
NIH
-PA Author Manuscript

NIH
-PA Author Manuscript
NIH
-PA Author Manuscript
NIH
-PA Author Manuscript
Gurak and Kritz Page 17
Table 1
Percentage of Foreign- and Native-Born Asian and Hispanic Elders in Extended Living Arrangements, 2000and 1990
Foreign born Native born
1990 2000 1990 2000
Native-born Whites — — 10.8 11.9
All Asians 45.4 44.2 19.6 25.2
Japanese 17.4 13.9 18.6 23.7
Chinese 39.8 42.2 17.5 21.2
Koreans 47.5 31.8 16.7 23.3
Vietnamese 51.3 54.6 14.7 38.7
Filipinos 52.6 51.9 25.0 33.0
Indians 63.0 55.2 26.2 26.2
All Hispanics 33.8 39.4 19.1 24.6
Puerto Ricans 24.2 26.9 20.6 24.1
Cubans 31.9 33.0 18.4 22.7
Mexicans 36.4 45.9 21.3 27.1
Colombians 38.8 40.5 33.5 21.2
Dominicans 45.7 47.8 30.8 28.2
Note: Elders living in group quarters are not included in calculations.
Res Aging. Author manuscript; available in PMC 2012 September 13.
NIH
-PA Author Manuscript
NIH
-PA Author Manuscript
NIH
-PA Author Manuscript
Gurak and Kritz Page 18
Tabl
e 2
Des
crip
tive
Stat
istic
s fo
r A
sian
and
His
pani
c Fo
reig
n an
d N
ativ
e B
orn
by N
ativ
ity S
tatu
s, 2
000
Dem
ogra
phic
Res
ourc
es
Gro
upb
Sam
ple
NP
erce
ntag
efe
mal
eM
ean
age
Per
cent
age
mar
ried
Per
cent
age
divo
rced
Per
cent
age
wid
owed
Per
cent
age
neve
r m
arri
ed
Per
cent
age
colle
gegr
adua
te
Per
cent
age
high
scho
olgr
adua
teor
som
eco
llege
Per
cent
age
wit
hno
Soc
ial
Secu
rity
inco
me
Mea
n in
com
e($
s)N
umbe
r of
disa
bilit
ies
(0-6
)
NB
Whi
tesd
NB
1,80
9,59
956
7261
926
418
5624
28,6
950.
85
Chi
nese
NB
2,36
852
7162
921
829
5227
26,6
870.
69
FB11
,533
5371
705
232
2426
6017
,212
0.84
Japa
nese
NB
7,69
553
7364
721
819
6223
31,2
160.
71
FB3,
155
8569
6011
272
1458
3621
,445
0.60
Filip
inos
NB
1,47
653
6960
1321
613
5743
24,0
600.
76
FB11
,807
5970
646
264
3434
6319
,181
0.98
Kor
eans
NB
438
5270
6111
244
2149
3629
,106
0.87
FB4,
912
6069
657
262
2834
6919
,731
0.79
Indi
ans
NB
345
5570
5015
2510
2140
4322
,170
1.36
FB4,
398
4668
724
222
4422
7629
,408
0.82
Vie
tnam
ese
NB
145
4271
5812
228
2339
5228
,309
1.20
FB4,
726
5369
639
243
927
8111
,086
1.32
Mex
ican
sN
B31
,019
5670
5813
236
534
3518
,091
1.04
FB28
,918
5670
5811
256
314
5211
,482
1.13
Cub
ans
NB
647
5572
5614
227
1842
3423
,274
1.00
FB14
,526
5771
5615
236
1427
4116
,796
1.01
Dom
inic
ans
NB
129
5370
4716
2413
1438
4317
,975
0.89
FB3,
147
6369
4625
209
417
6211
,252
1.15
Col
ombi
ans
NB
7765
7145
1429
1124
4443
25,5
100.
70
FB2,
805
6569
5118
2110
1335
5918
,143
0.82
Puer
to R
ican
sdN
B1,
578
5569
5218
219
1248
4023
,215
0.90
FB11
,601
5970
4721
258
627
3814
,577
1.13
Res Aging. Author manuscript; available in PMC 2012 September 13.

NIH
-PA Author Manuscript
NIH
-PA Author Manuscript
NIH
-PA Author Manuscript
Gurak and Kritz Page 19
Ass
imila
tion
% I
mm
igra
ted
at a
gea
Gro
upb
Sam
ple
NP
erce
ntag
eE
nglis
h on
lyP
erce
ntag
e E
nglis
hw
ell o
r ve
ry w
ell
< 16
16 t
o 29
30 t
o 45
46 t
o 59
60 o
rol
der
Per
cent
age
inga
tew
ayP
erce
ntag
ein
min
i-ga
tew
ayc
Per
cent
age
indi
sper
sed
area
NB
Whi
tesd
NB
1,80
9,59
996
3—
——
——
815
77
Chi
nese
NB
2,36
854
40—
——
——
3542
23
FB11
,533
628
415
2034
2760
2416
Japa
nese
NB
7,69
561
34—
——
——
5618
26
FB3,
155
2058
350
339
427
2548
Filip
inos
NB
1,47
666
30—
——
——
4220
38
FB11
,807
674
216
2433
2543
3027
Kor
eans
NB
438
4844
——
——
—18
3646
FB4,
912
634
012
3237
1950
2525
Indi
ans
NB
345
6728
——
——
—19
2061
FB4,
398
1059
113
2633
2727
3340
Vie
tnam
ese
NB
145
2265
——
——
—21
2158
FB4,
726
424
12
1948
3147
2726
Mex
ican
sN
B31
,019
1870
——
——
—25
3243
FB28
,918
929
929
2821
1337
3132
Cub
ans
NB
647
4347
——
——
—46
1737
FB14
,526
735
120
4424
1077
149
Dom
inic
ans
NB
129
3442
——
——
—56
1034
FB3,
147
923
218
3133
1679
147
Col
ombi
ans
NB
7744
42—
——
——
3929
32
FB2,
805
640
221
3525
1753
2918
Puer
to R
ican
sdN
B1,
578
4454
——
——
—32
2147
FB11
,601
955
1650
1710
751
2326
a “Bor
n in
the
Uni
ted
Stat
es”
is th
e re
fere
nce
cate
gory
for
age
at i
mm
igra
tion.
Ref
eren
ce c
ateg
orie
s fo
r m
arita
l sta
tus,
edu
catio
n, a
nd E
nglis
h la
ngua
ge a
bilit
y ar
e: m
arri
ed, l
ess
than
hig
h sc
hool
, and
no
Eng
lish
lang
uage
abi
lity.
b NB
ref
ers
to n
ativ
e bo
rn a
nd F
B to
for
eign
bor
n.
c All
met
ropo
litan
are
as w
ere
rank
ed b
y th
e po
pula
tion
size
of
each
eth
nic
grou
p (n
ativ
e bo
rn a
nd f
orei
gn b
orn)
to id
entif
y th
e to
p 5
met
ropo
litan
are
as th
at h
ad th
e la
rges
t sha
re o
f ea
ch g
roup
’s n
atio
nal
popu
latio
n (g
atew
ay m
etro
polit
an a
reas
). M
ini-
gate
way
s co
nsis
t of
the
next
15
larg
est a
reas
, and
dis
pers
ed a
reas
are
the
rem
aind
er.
Res Aging. Author manuscript; available in PMC 2012 September 13.

NIH
-PA Author Manuscript
NIH
-PA Author Manuscript
NIH
-PA Author Manuscript
Gurak and Kritz Page 20d N
B W
hite
s ar
e na
tive-
born
non
–His
pani
c no
n–A
sian
Whi
tes.
Nat
ive-
born
Pue
rto
Ric
ans
wer
e bo
rn o
n th
e U
.S. m
ainl
and
whi
le F
B P
uert
o R
ican
s w
ere
born
in P
uert
o R
ico.
Res Aging. Author manuscript; available in PMC 2012 September 13.
NIH
-PA Author Manuscript
NIH
-PA Author Manuscript
NIH
-PA Author Manuscript
Gurak and Kritz Page 21
Table 3
Logistic Regression of Extended Living Among Asian and Hispanic Elders on Origin Group, DemographicCharacteristics, Resources, and Assimilation,a 2000
Model 1 Model 2 Model 3 Model 4
Origin 1 +Demographic
2 +Resources
3 +Assimilation
Ethnic group
Native-born Whites (referent)
— — — —
Chinese 4.71*** 5.68*** 5.15*** 1.72***
Japanese 1.95*** 2.02*** 2.10*** 1.48***
Filipinos 7.41*** 8.89*** 8.59*** 3.34***
Koreans 3.36*** 3.96*** 3.52*** 1.14*
Indians 8.44*** 11.70*** 11.00*** 4.28***
Vietnamese 8.77*** 11.07*** 8.33*** 2.31***
Mexicans 4.22*** 4.66*** 3.58*** 2.05***
Cubans 3.59*** 3.74*** 3.25*** 1.20***
Dominicans 6.62*** 6.89*** 5.08*** 1.73***
Colombians 4.96*** 5.23*** 4.46*** 1.62***
Puerto Ricans 2.69*** 2.63*** 2.06*** 1.08***
Demographic characteristics
Female — 1.22*** 1.13*** 1.14***
Age — 1.02*** 1.11*** 1.07***
Age squared — 1.03*** 0.99*** 0.99***
Married (referent)
— — — —
Divorced/ separated
2.09*** 2.01*** 2.05***
Widowed 2.55*** 2.47*** 2.46***
Never married — 3.26*** 3.37*** 3.30***
Social and economic resources
Less than high school degree (referent)
— — — —
High school degree or some college
— — 0.80*** 0.82***
College degree or higher
— — 0.57*** 0.58***
No Social Security income
— — 1.02** 0.96***
Res Aging. Author manuscript; available in PMC 2012 September 13.

NIH
-PA Author Manuscript
NIH
-PA Author Manuscript
NIH
-PA Author Manuscript
Gurak and Kritz Page 22
Model 1 Model 2 Model 3 Model 4
Origin 1 +Demographic
2 +Resources
3 +Assimilation
Log of total income
— — 0.94*** 0.94***
Number disabilities (0-6)
1.17*** 1.17***
Assimilation — —
Speaks English poorly/not at all (referent)
— — — —
Speaks English well or very well
— — — 0.82***
Speaks English only
— — — 0.68***
Native born (referent)
— — — —
Immigrated aged 0 to 15
0.96
Immigrated aged 16 to 29
1.06*
Immigrated aged 30 to 44
1.32***
Immigrated aged 45 to 59
2.39***
Immigrated aged 60 plus
4.37***
Gateway metro area (referent)
— — — —
Mini-gateway metro area
— — — 0.89***
Dispersed area — — — 0.71***
Log likelihood −751,489*** −714,104*** −706,367*** −700,243***
Pseudo R2 .04 .08 .10 .11
N 1,957,049 1,957,049 1,957,049 1,957,049
Likelihood ratio
testb5,147*** 51,214*** 22,870*** 10,808***
aBoth native- and foreign-born Asians and Hispanics are included in the estimated models. For Puerto Ricans, the foreign born are persons born in
Puerto Rico. The reference group for the ethnic categories is native Whites.
bThe likelihood ratio test calculates the relative importance of the set of covariates introduced in each model against the full model (Model 4) based
on a reestimation of the full model that excluded the covariate set added in each column and contrasted the log likelihood for the reestimated modelwith that of the full model. The likelihood ratio test statistics are given at the bottom of each column and represent the tests, sequentially, of origin,demographic characteristics, resources, and assimilation.
*p < .05.
**p < .01.
***p < .001.
Res Aging. Author manuscript; available in PMC 2012 September 13.
NIH
-PA Author Manuscript
NIH
-PA Author Manuscript
NIH
-PA Author Manuscript
Gurak and Kritz Page 23
Tabl
e 4
Log
istic
Reg
ress
ion
of E
xten
ded
Liv
ing
for
Asi
an, H
ispa
nic,
and
Nat
ive
Whi
te E
lder
s (O
dds
Rat
ios)
, 200
0a
Sex
Age
Age
squa
red
Div
orce
dor se
para
ted
Wid
owed
Nev
erm
arri
ed
Hig
hsc
hool
.gr
adua
te/
som
eco
llege
Col
lege
grad
uate
No
Soci
alSe
curi
ty
Log
of
inco
me
Num
ber
of disa
bilit
ies
Eng
lish
wel
lE
nglis
hon
lyA
rriv
ed<
16
Arr
ived
16 t
o29
Arr
ived
30 t
o44
Arr
ived
45 t
o59
Arr
ived
60+
Min
i-ga
tew
ayD
ispe
rsed
Pse
udo
R2
Chi
nese
1.01
1.10
*0.
99*
1.33
**2.
24**
*1.
46**
0.80
***
.60*
**1.
06.8
7***
1.02
0.66
***
.70*
**0.
800.
63**
*1.
021.
82**
*3.
08**
*1.
001.
11.1
6***
Japa
nese
1.26
***
1.07
1.00
1.79
***
2.27
***
3.13
***
0.79
***
.56*
**0.
90.9
7*1.
16**
*0.
85.8
91.
160.
50**
*0.
44**
*0.
721.
89**
0.47
***
0.59
***
.10*
**
Filip
inos
1.13
**1.
16**
0.99
*1.
46**
*2.
26**
*2.
14**
*0.
88*
.69*
**1.
19**
*.9
0***
1.04
*0.
70**
*.4
1***
0.90
0.70
***
0.89
1.81
***
2.86
***
1.04
0.74
***
.18*
**
Kor
eans
0.97
0.96
1.00
1.18
3.14
***
2.65
***
1.20
*.9
50.
96.8
8***
1.04
0.73
***
.61*
**1.
230.
39**
*0.
841.
271.
64**
1.24
*1.
14.1
5***
Indi
ans
0.87
1.26
*0.
990.
833.
40**
*1.
170.
83.5
9***
1.01
.85*
**1.
050.
50**
*.2
1***
1.01
1.00
0.97
3.30
***
7.32
***
0.82
0.71
***
.38*
**
Vie
tnam
ese
1.34
***
1.11
1.00
0.95
2.19
***
1.70
**0.
96.9
11.
19.9
0***
1.02
0.82
*.7
51.
261.
081.
141.
531.
82*
0.70
***
0.68
***
.12*
**
Mex
ican
s1.
07**
1.14
***
0.99
***
1.73
***
2.40
***
2.68
***
0.82
***
.59*
**1.
04.9
2***
1.04
***
0.76
***
.70*
**1.
051.
23**
*1.
41**
*2.
42**
*4.
50**
*0.
76**
*0.
57**
*.1
3***
Cub
ans
1.25
***
0.93
1.00
*1.
49**
*1.
99**
*1.
96**
*1.
02.9
21.
11*
.94*
**1.
04**
0.88
**.8
0**
1.08
1.04
1.23
1.57
***
2.54
***
0.95
0.70
***
.07*
**
Dom
inic
ans
1.34
**1.
021.
001.
201.
74**
*1.
54**
1.03
.53*
*1.
10.9
2***
1.00
0.71
**.6
6**
1.01
1.13
1.33
2.21
***
4.25
***
0.91
0.81
.10*
**
Col
ombi
ans
1.01
1.14
0.99
2.08
***
3.40
***
2.69
***
0.94
.64*
*1.
05.9
0***
0.95
0.65
***
.77
3.07
*1.
401.
692.
84**
6.20
***
0.91
0.67
**.1
8***
Puer
to1.
30**
*0.
991.
001.
70**
*2.
13**
*1.
73**
*0.
89.8
01.
03.9
3***
1.08
***
1.00
.72*
**0.
71**
*0.
74**
*0.
931.
211.
98**
*1.
12*
0.96
.08*
**
R
ican
s
Nat
ive
1.16
***
1.07
***
0.99
***
2.15
***
2.47
***
3.51
***
0.81
***
.56*
**0.
95**
*.9
6***
1.20
***
0.96
.77*
**—
——
——
0.90
***
0.71
***
.07*
**
Whi
tes
a The
gro
up m
odel
s ar
e id
entic
al to
the
full
mod
el in
Tab
le 3
exc
ept o
rigi
n is
om
itted
and
the
refe
renc
e ca
tego
ry in
clud
es o
nly
nativ
e bo
rn f
rom
the
sam
e or
igin
. The
ref
eren
ce c
ateg
orie
s ar
e m
en, c
urre
ntly
mar
ried
, les
s th
an h
igh
scho
ol, h
as S
ocia
l Sec
urity
inco
me,
spe
aks
poor
or
no E
nglis
h, n
ativ
e bo
rn, a
nd g
atew
ay r
esid
ence
.
* p <
.05.
**p
< .0
1.
*** p
< .0
01.
Res Aging. Author manuscript; available in PMC 2012 September 13.