Elaboration and characterization of new conductive porous graphite membranes for electrochemical...
8
Elaboration and characterization of new conductive porous graphite membranes for electrochemical advanced oxidation processes Saloua Ayadi a , Ilyes Jedidi a , Matthieu Rivallin b , Frédéric Gillot b , Stella Lacour b , Sophie Cerneaux b , Marc Cretin b,n , Raja Ben Amar a a Laboratoire Sciences des Matériaux Environnement, Faculté des Sciences de Sfax, Rte. de Soukra Km 4, 3000 Sfax, Tunisie b IEM (Institut Europeen des Membranes), UMR 5635 (CNRS-ENSCM-UM2), Université de Montpellier 2, Place E. Bataillon, F-34095 Montpellier, cedex 5, France article info Article history: Received 29 March 2013 Received in revised form 30 May 2013 Accepted 8 June 2013 Available online 24 June 2013 Keywords: Graphite powder Phenolic resin Extrusion Tubular porous support Electro-Fenton process abstract Three different graphite powders with different particles sizes were tested to synthesize tubular monochannel carbon supports for micro and ultrafiltration membranes using a new process. Carbon graphite powders and organic additives were mixed with an ethanolic solution of Resol s type phenolic resin. The extruded tubes were firstly consolidated by curing the resin at 150 1C then carbonized under nitrogen stream (1 mL min -1 ) for graphitization and pores opening. Supports with optimal properties were obtained using a mixture of Resol s resin and a 44 mm particle size graphite powder, carbonized at 1000 1C. They showed a porosity value of 37%, an average pore size diameter of 3 mm, high mechanical and chemical resistances and an average conductivity of 190 Ω -1 cm -1 . The Raman spectroscopy results show that graphitization degree of the material is closely related to the carbonization temperature, which explains the increase of conductivity with temperature. Acid Orange 7 (AO7), a common dye, was finally used as a model molecule to demonstrate the ability of the graphitic membranes to mineralize organic pollutants by electro-Fenton process. Spectrophoto- metric measurements were conducted on the treated solutions as a function of chemical and electrochemical conditions to determine the degradation kinetic of AO7. Decolorization rate was also measured as a function of time. & 2013 Elsevier B.V. All rights reserved. 1. Introduction One of the most pervasive problems afflicting people through- out the world is the inadequate access to clean water. The industry of textile is a major consumer of water and wastewater from textile processing plants are highly loaded in organic pollutants, mainly synthetic colorants. Azo-dyes form the largest group among these synthetic colorants (60–70%) [1]. The chromophoric system consists of azo groups (–NQN–) in association with aromatic systems and oxochromes (–OH, –NH 2 , etc.). Since azo-dyes are intentionally designed to resist degradation, it is very difficult to degrade them by conventional wastewater treatment methods. In addition, the toxicity, mutagenicity and carcinogeni- city of azo-dye degradation by-products are of great environmen- tal concern [2]. To solve this problem, some research groups have reported that electro-Fenton oxidation offers significant advantages, without requirement for special equipment, and high efficiency in organic pollutants removal [3,4]. Electro-Fenton process is a promising technology that combines electrochemical reactions and Fenton process. In this hybrid process, the electrical current induces the reduction of oxygen to form hydrogen peroxide on graphite based electrodes, which are needed for the Fenton reaction (i.e. the reaction between H 2 O 2 and Fe 2+ to form highly oxidative ● OH radicals). Thus, H 2 O 2 is generated in situ by the electrical current externally applied to the carbon electrode, avoiding its transport and continuous addition throughout the process due to its decomposition in the medium [5]. Therefore, in the electro- Fenton process, the continuous electro-generation of H 2 O 2 is achieved by the reduction of dissolved O 2 in the presence of Fe 2+ . The propagation of the Fenton's reaction is obtained via a catalytic cycle involving the reverse conversion of Fe 3+ formed by the Fenton reaction to Fe 2+ by direct reduction at the cathode or other reduction processes, involving H 2 O 2 or organic inter- mediate radicals [6]. Contents lists available at SciVerse ScienceDirect journal homepage: www.elsevier.com/locate/memsci Journal of Membrane Science 0376-7388/$ - see front matter & 2013 Elsevier B.V. All rights reserved. http://dx.doi.org/10.1016/j.memsci.2013.06.005 n Corresponding author. Tel.: þ33467149194. E-mail addresses: [email protected], [email protected] (M. Cretin). Journal of Membrane Science 446 (2013) 42–49
Transcript of Elaboration and characterization of new conductive porous graphite membranes for electrochemical...
Journal of Membrane Science 446 (2013) 42–49
Contents lists available at SciVerse ScienceDirect
Journal of Membrane Science
0376-73http://d
n CorrE-m
marc.cr
journal homepage: www.elsevier.com/locate/memsci
Elaboration and characterization of new conductive porous graphitemembranes for electrochemical advanced oxidation processes
Saloua Ayadi a, Ilyes Jedidi a, Matthieu Rivallin b, Frédéric Gillot b, Stella Lacour b,Sophie Cerneaux b, Marc Cretin b,n, Raja Ben Amar a
a Laboratoire Sciences des Matériaux Environnement, Faculté des Sciences de Sfax, Rte. de Soukra Km 4, 3000 Sfax, Tunisieb IEM (Institut Europeen des Membranes), UMR 5635 (CNRS-ENSCM-UM2), Université de Montpellier 2, Place E. Bataillon, F-34095 Montpellier, cedex 5,France
a r t i c l e i n f o
Article history:Received 29 March 2013Received in revised form30 May 2013Accepted 8 June 2013Available online 24 June 2013
Keywords:Graphite powderPhenolic resinExtrusionTubular porous supportElectro-Fenton process
88/$ - see front matter & 2013 Elsevier B.V. Ax.doi.org/10.1016/j.memsci.2013.06.005
esponding author. Tel.: þ33467149194.ail addresses: [email protected],[email protected] (M. Cretin).
a b s t r a c t
Three different graphite powders with different particles sizes were tested to synthesize tubularmonochannel carbon supports for micro and ultrafiltration membranes using a new process. Carbongraphite powders and organic additives were mixed with an ethanolic solution of Resols type phenolicresin. The extruded tubes were firstly consolidated by curing the resin at 150 1C then carbonized undernitrogen stream (1 mL min−1) for graphitization and pores opening.
Supports with optimal properties were obtained using a mixture of Resols resin and a 44 mm particlesize graphite powder, carbonized at 1000 1C. They showed a porosity value of 37%, an average pore sizediameter of 3 mm, high mechanical and chemical resistances and an average conductivity of190 Ω−1 cm−1.
The Raman spectroscopy results show that graphitization degree of the material is closely related tothe carbonization temperature, which explains the increase of conductivity with temperature.
Acid Orange 7 (AO7), a common dye, was finally used as a model molecule to demonstrate the abilityof the graphitic membranes to mineralize organic pollutants by electro-Fenton process. Spectrophoto-metric measurements were conducted on the treated solutions as a function of chemical andelectrochemical conditions to determine the degradation kinetic of AO7. Decolorization rate was alsomeasured as a function of time.
& 2013 Elsevier B.V. All rights reserved.
1. Introduction
One of the most pervasive problems afflicting people through-out the world is the inadequate access to clean water. The industryof textile is a major consumer of water and wastewater fromtextile processing plants are highly loaded in organic pollutants,mainly synthetic colorants. Azo-dyes form the largest groupamong these synthetic colorants (60–70%) [1]. The chromophoricsystem consists of azo groups (–NQN–) in association witharomatic systems and oxochromes (–OH, –NH2, etc.). Sinceazo-dyes are intentionally designed to resist degradation, it is verydifficult to degrade them by conventional wastewater treatmentmethods. In addition, the toxicity, mutagenicity and carcinogeni-city of azo-dye degradation by-products are of great environmen-tal concern [2].
ll rights reserved.
To solve this problem, some research groups have reported thatelectro-Fenton oxidation offers significant advantages, withoutrequirement for special equipment, and high efficiency in organicpollutants removal [3,4]. Electro-Fenton process is a promisingtechnology that combines electrochemical reactions and Fentonprocess. In this hybrid process, the electrical current induces thereduction of oxygen to form hydrogen peroxide on graphite basedelectrodes, which are needed for the Fenton reaction (i.e. thereaction between H2O2 and Fe2+ to form highly oxidative ●OHradicals).
Thus, H2O2 is generated in situ by the electrical currentexternally applied to the carbon electrode, avoiding its transportand continuous addition throughout the process due to itsdecomposition in the medium [5]. Therefore, in the electro-Fenton process, the continuous electro-generation of H2O2 isachieved by the reduction of dissolved O2 in the presence of Fe2+.The propagation of the Fenton's reaction is obtained via acatalytic cycle involving the reverse conversion of Fe3+ formedby the Fenton reaction to Fe2+ by direct reduction at the cathodeor other reduction processes, involving H2O2 or organic inter-mediate radicals [6].
S. Ayadi et al. / Journal of Membrane Science 446 (2013) 42–49 43
To get efficient degradation of organic molecules, high oxygenreduction rates have to be reached. For this purpose, conductiveporous materials such as carbon mates [7–15] are good candidates.The main drawback of carbon mates or polymeric porous film istheir necessity to be supported for filtration applications.
Carbon membranes offer a better alternative for applicationsunder flux because of their high mechanical [16], chemical [17]and thermal stabilities [18], along with their good permeabilityand selectivity. They are largely used for the separation ofpesticides [19] and gas mixtures [20,21] because they provide abetter control of pore dimensions in the vicinity of the molecularsize ranges of interest. This has become possible due to theavailability of a variety of pore-forming organic precursors andfilm-making processes.
Nowadays, a lot of researchers have used different polymericprecursors to prepare carbon membrane. The polymeric precursorneeds to have thermosetting property in order to avoid meltingwhen heated and thus retain its structural shape during heatingand pyrolysis.
Carbon membranes are produced through the pyrolysis ofcarbon containing precursors (carbonization) either natural, suchas wood, coal, lignite, seeds and peat [22] or chemically synthe-sized such as polyimide [23–26], polyacrylonitrile [27], phenolicresins [28–30], polyfurfuryl alcohol (PFA) [31–33] or poly-vinyl-pyrrolidone (PVP) [34].
Phenolic resin, which can be obtained from various combina-tions of phenols and aldehydes by using either a base or acid ascatalyst, is one of the well-used synthetic precursors, due to theirlow cost and high carbon yield, for the production of carbon fibers[31], porous carbons [32,33], carbon nanotubes (CNTs) [34] andcarbon membranes [35–39]. Their use is made easier by the largevariety of presentation (in solution or powdered) and of types,Novolacs and Resols, thermosetting respectively in the presenceor absence of a crosslinking agent.
During the last decade, tubular carbon supports have beenproduced by extrusion using a Novolacs type phenolic resin [40–42]. The resin was semi-cured then ground in fine powder, whichwas mixed (or not) with different additives. Sometimes anothersource of carbon was added to better control the porositycharacteristics of the final material. Water was the solventused to prepare the paste to be extruded and a curing step ofthe obtained extrudate was done to consolidate the shape. Acarbonization step under nitrogen atmosphere enabled the poresopening to generate the membrane porosity. In this process,phenolic resin served as carbon source and as binder due tothe non-cured part in the powder. Nevertheless, it can be con-sidered complicated since a semi-curing step followed by agrinding step is needed with all the associated controls. One ofour objectives is therefore to propose an alternative to avoidsuch steps.
Chengwen Song et al. used mineral coal as a major carbonsource, instead of the semi-cured phenolic resin, to preparesymmetric tubular microfiltration membranes [43]. In this case,the support was used directly as the filtrating medium. The binderused to consolidate the extruded tubular forms was not specifiedby the author. Results showed the effect of coal particle size on theporosity of the final product (pore size and pore volume %).
The present work proposes the development of a new processto prepare conductive macroporous tubular carbon supports usingResols type phenolic resin. This resin was dissolved in ethanol as asolvent and mixed with binder, carbon source, porogen agentand graphite powders, which are used to procure electronicconductive properties to the material. These supports have beentested as cathode for the degradation and the mineralization of theAO7 dye using the electro-Fenton (EF) process under standardconditions.
2. Experimental
2.1. Raw materials
Three different graphite powders from TIMCAL Group (Switzer-land) were used as the main carbon source in the elaboration ofsupports. They are identified in the text as KS25s, KS44s, KS150s
and their particles sizes are 25 mm, 44 mm and 150 mm, respec-tively. The wide range of particle sizes tested in the pasteformulation aimed to evidence the influence of particle size onthe porosity, the pores distribution and the mechanical andelectrical properties of the final material.
Resols type phenolic resin used in the elaboration of carbonmembranes was kindly supplied by Sumitomo Bakelite Europe(Barcelona). The resin was used as carbon precursor, binder andporosity agent. The resin curing temperature was recommendedby the manufacturer to be 150 1C.
Organic additives were dry mixed with the graphite powder.Some of them, such as the corn starch powder (RG 03408, Cerestar,France), were used to enhance the total porosity of the finalmaterial (since it totally degrades during carbonization), whileothers, such as ethylene glycol, amijels (Cplus 12072, Cerestar,France) and methyl cellulose (Dow Chemical Company) were usedas lubricants and plasticizers, respectively, in the paste formation.
2.2. Characterization techniques
Thermogravimetric (TGA) analyses were performed using aSETARAM TG-DTA 92 apparatus. The temperature ramp was10 1C min−1 from room temperature to 1000 1C under nitrogenstream.
The presence of possible defects in the carbonized supports aswell as their surface morphology was evidenced by ScanningElectron Microscopy (SEM, HITACHI S-4800).
The porosity and pores size of the final carbonized materialwere measured by mercury intrusion analysis (Micromeritics,AutoPore IV 9500).
Electrical conductivity measurements were carried out on flatsupports using the four points method. The equipment used wasthe “HL 5500 Hall system” from Nanometrics Company. Resultscorresponded to an average of five measurements performed invarious areas of the material surface.
Raman spectroscopy measurements were carried out at roomtemperature at ambient atmosphere using an argon-ion laser(Perx 1877 triple meet Spectrometer, USA) tuned to 514.5 nm.The resolution of this instrument is approximately 1.7 cm−1.
The mechanical resistance of the carbonized supports withdifferent graphite powder sizes was measured by the three-pointbending method (universal LLOYD Instruments, LRX apparatus).All experiments were carried out on series of at least 5 membranesto report an average strength for each series, following Interna-tional Standard (IS) specifications. To estimate the chemicalresistance of the carbonized supports, they were kept at 80 1Cfor 7 days in both acidic and basic media at a pH of 1 and 12,respectively.
2.3. Membrane support elaboration
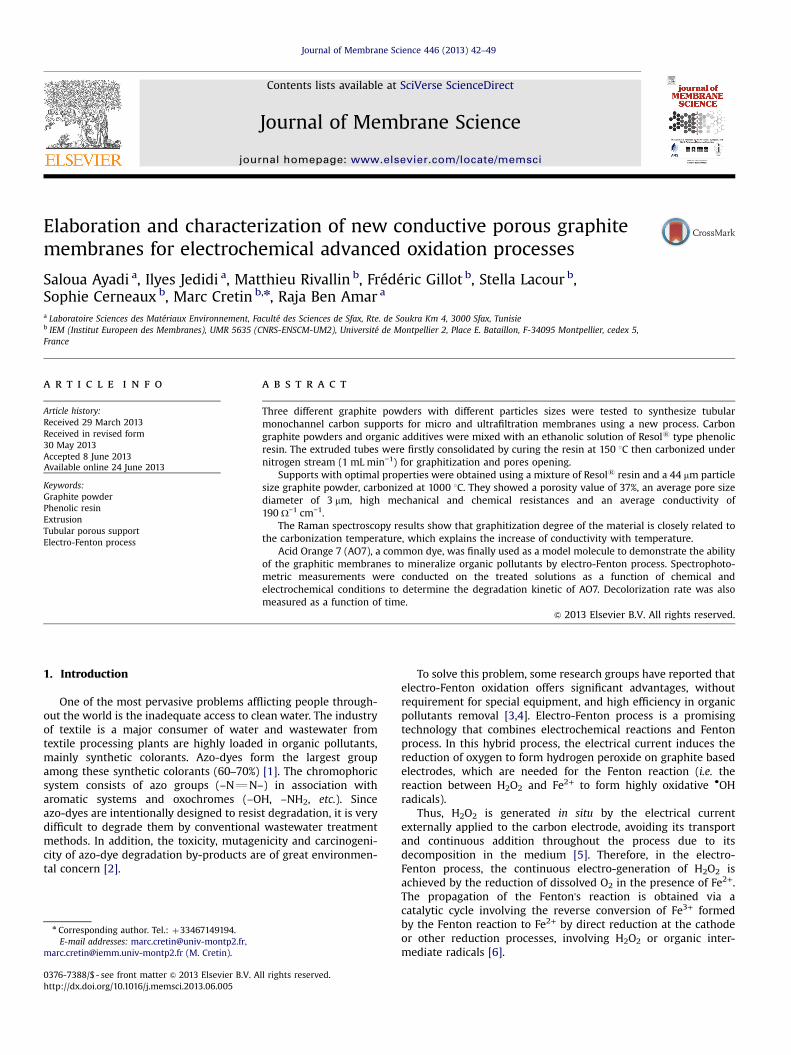
As described in Fig. 1, the elaboration of the membranesupports involved three steps: (i) the paste preparation, (ii) thesupports shaping by extrusion and (iii) the thermal treatment ofthe tubes for solidification and carbonization.
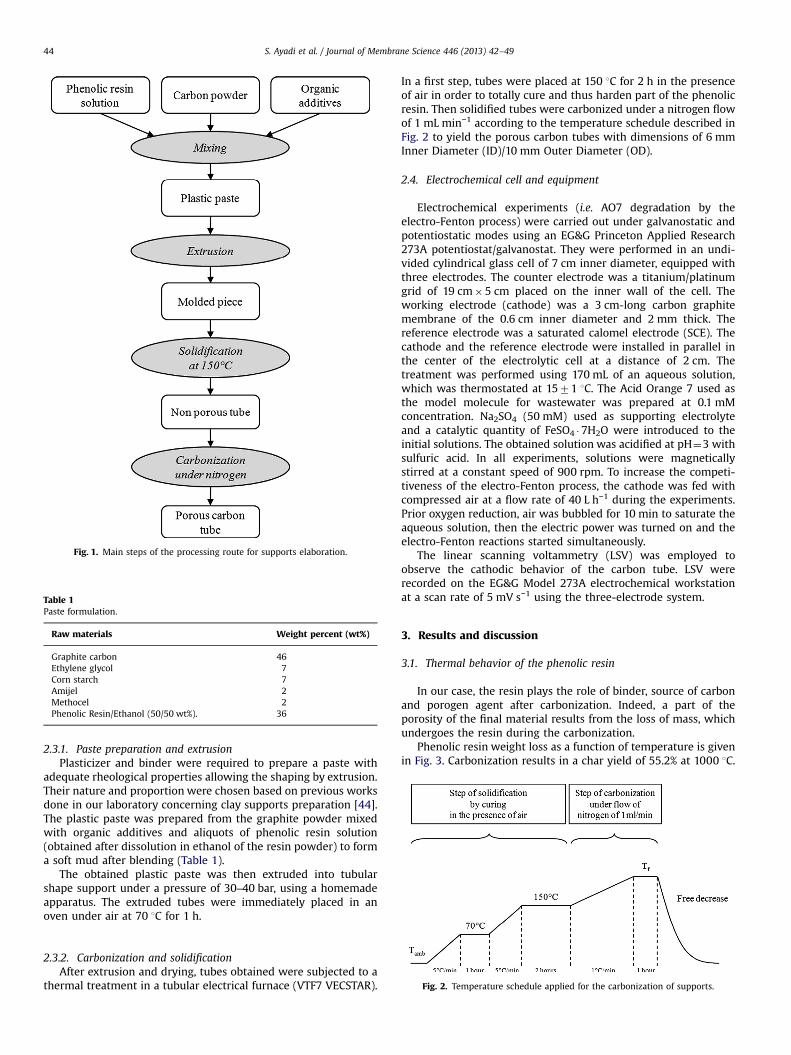
Fig. 1. Main steps of the processing route for supports elaboration.
Table 1Paste formulation.
Raw materials Weight percent (wt%)
Graphite carbon 46Ethylene glycol 7Corn starch 7Amijel 2Methocel 2Phenolic Resin/Ethanol (50/50 wt%). 36
S. Ayadi et al. / Journal of Membrane Science 446 (2013) 42–4944
2.3.1. Paste preparation and extrusionPlasticizer and binder were required to prepare a paste with
adequate rheological properties allowing the shaping by extrusion.Their nature and proportion were chosen based on previous worksdone in our laboratory concerning clay supports preparation [44].The plastic paste was prepared from the graphite powder mixedwith organic additives and aliquots of phenolic resin solution(obtained after dissolution in ethanol of the resin powder) to forma soft mud after blending (Table 1).
The obtained plastic paste was then extruded into tubularshape support under a pressure of 30–40 bar, using a homemadeapparatus. The extruded tubes were immediately placed in anoven under air at 70 1C for 1 h.
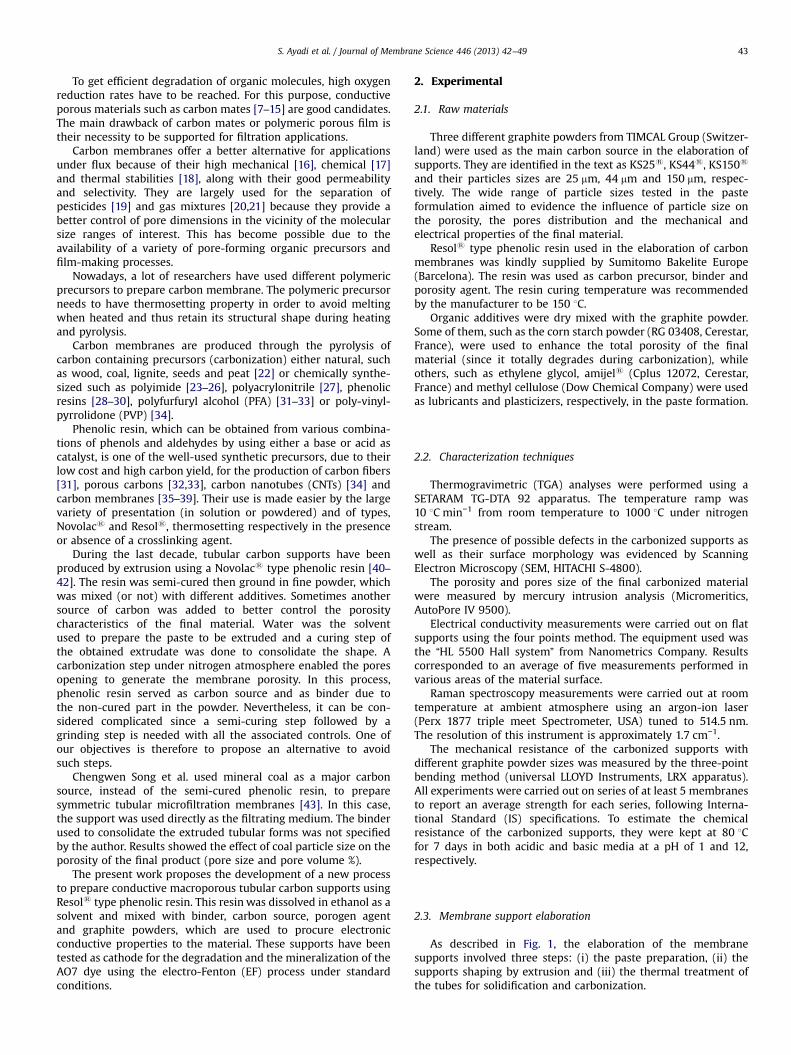
Fig. 2. Temperature schedule applied for the carbonization of supports.
2.3.2. Carbonization and solidificationAfter extrusion and drying, tubes obtained were subjected to a
thermal treatment in a tubular electrical furnace (VTF7 VECSTAR).
In a first step, tubes were placed at 150 1C for 2 h in the presenceof air in order to totally cure and thus harden part of the phenolicresin. Then solidified tubes were carbonized under a nitrogen flowof 1 mL min−1 according to the temperature schedule described inFig. 2 to yield the porous carbon tubes with dimensions of 6 mmInner Diameter (ID)/10 mm Outer Diameter (OD).
2.4. Electrochemical cell and equipment
Electrochemical experiments (i.e. AO7 degradation by theelectro-Fenton process) were carried out under galvanostatic andpotentiostatic modes using an EG&G Princeton Applied Research273A potentiostat/galvanostat. They were performed in an undi-vided cylindrical glass cell of 7 cm inner diameter, equipped withthree electrodes. The counter electrode was a titanium/platinumgrid of 19 cm�5 cm placed on the inner wall of the cell. Theworking electrode (cathode) was a 3 cm-long carbon graphitemembrane of the 0.6 cm inner diameter and 2 mm thick. Thereference electrode was a saturated calomel electrode (SCE). Thecathode and the reference electrode were installed in parallel inthe center of the electrolytic cell at a distance of 2 cm. Thetreatment was performed using 170 mL of an aqueous solution,which was thermostated at 1571 1C. The Acid Orange 7 used asthe model molecule for wastewater was prepared at 0.1 mMconcentration. Na2SO4 (50 mM) used as supporting electrolyteand a catalytic quantity of FeSO4 �7H2O were introduced to theinitial solutions. The obtained solution was acidified at pH¼3 withsulfuric acid. In all experiments, solutions were magneticallystirred at a constant speed of 900 rpm. To increase the competi-tiveness of the electro-Fenton process, the cathode was fed withcompressed air at a flow rate of 40 L h−1 during the experiments.Prior oxygen reduction, air was bubbled for 10 min to saturate theaqueous solution, then the electric power was turned on and theelectro-Fenton reactions started simultaneously.
The linear scanning voltammetry (LSV) was employed toobserve the cathodic behavior of the carbon tube. LSV wererecorded on the EG&G Model 273A electrochemical workstationat a scan rate of 5 mV s−1 using the three-electrode system.
3. Results and discussion
3.1. Thermal behavior of the phenolic resin
In our case, the resin plays the role of binder, source of carbonand porogen agent after carbonization. Indeed, a part of theporosity of the final material results from the loss of mass, whichundergoes the resin during the carbonization.
Phenolic resin weight loss as a function of temperature is givenin Fig. 3. Carbonization results in a char yield of 55.2% at 1000 1C.
50
60
70
80
90
100
0 200 400 600 800 1000
Wei
gnt (
%)
Temperature (°C)
1.762%(0.2191mg) 10.03%
(1.247mg)
32.98%(4.100mg)
A B
C
D
Fig. 3. Thermogravimetric analysis of phenolic resin under N2 atmosphere withheating rate of 10 1C min−1.
S. Ayadi et al. / Journal of Membrane Science 446 (2013) 42–49 45
These results are consistent with the literature that suggests charyields for phenol formaldehyde resins between 30% and 60%,although higher yields are generally associated with more massivesamples, where loss of volatiles is more restricted [45,46].
The weight loss during carbonization takes place predomi-nantly in the temperature range from 300 to 700 1C and occurs infour zones. The weight losses (zones A and B) are due toevaporation of retained water from the production process whilstthe majority of chemicals decomposition takes place in zones Cand D. From 700 1C, the phenolic resin is stable under nitrogen,which is consistent with the use of this precursor as binder to getsintered conductive membrane at high temperature.
3.2. Membrane support characterizations
For the development of high-quality supports, the followingproperties are of major importance: pore size distribution, poros-ity, surface texture, mechanical properties and chemical stability.
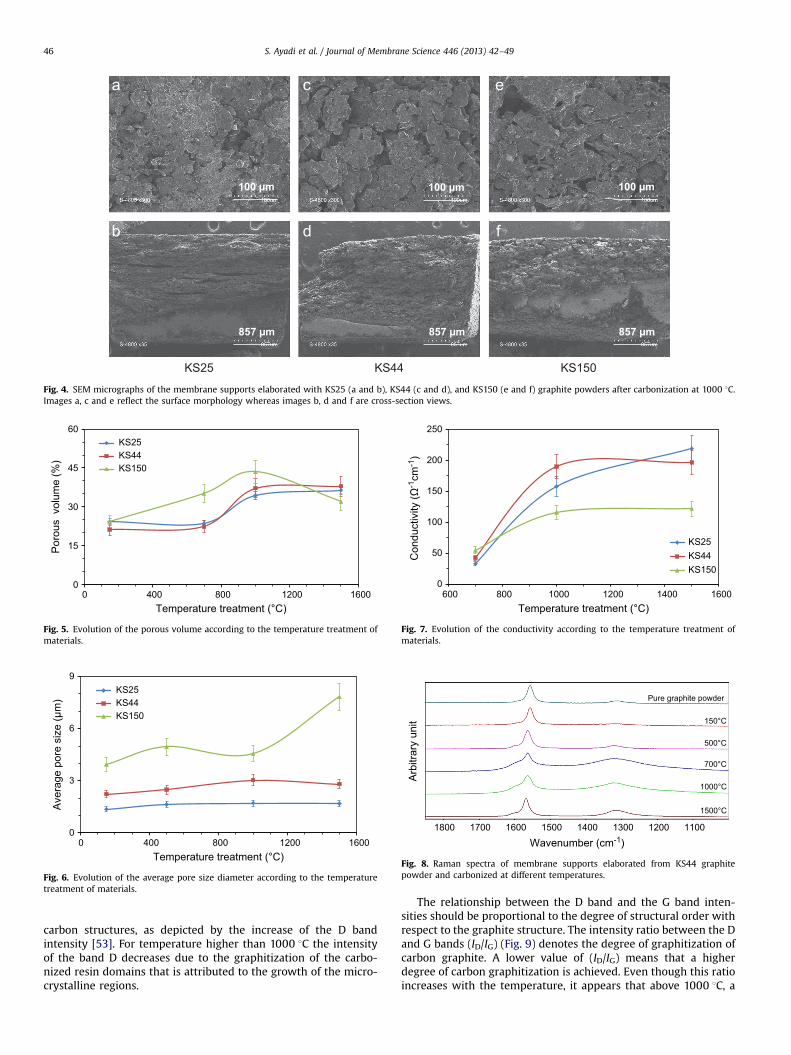
3.2.1. Morphology of membrane support3.2.1.1. Effect of the particle size of the graphite powder. Carbonsupports have homogenous and smooth surface structure and donot present any macrodefects (cracks, etc.). Fig. 4 shows SEMmicrographs of membrane supports elaborated from KS25 (Fig. 4aand b), KS44 (Fig. 4c and d) and KS150 (Fig. 4e and f) carbonized at1000 1C. Dense areas resembling vitreous carbon material wereobserved especially for the membrane synthesized from the KS25graphite powder. Jedidi et al. concluded that these areas areattributed to an accumulation of resin from the pastepreparation steps, which gave rise to a vitreous carbon domainwhen carbonized [44]. These kinds of defects may be due to theheterogeneity of the KS25 prepared paste. Moreover, themacrostructure of the material elaborated from the graphitepowder KS25 presented defects in the form of cracks mainly inthe extrusion direction contrary to the material elaborated fromKS44 graphite powder that presented the best morphologicalproperties.
3.2.2. Pores characterizationThe porous texture of the obtained tubular support is not the
result of a sintering phenomenon as observed during the forma-tion of conventional ceramic porous materials. The material is notconsolidated due to a grain boundary or any other phenomenonrelated to the sintering of inorganic materials such as clay, apatiteor metallic oxides [44,36,47,48]. In fact, the elaborated paste maybe assimilated to a composite polymer in which the resin repre-sents the polymer matrix and the carbon particle the mineral
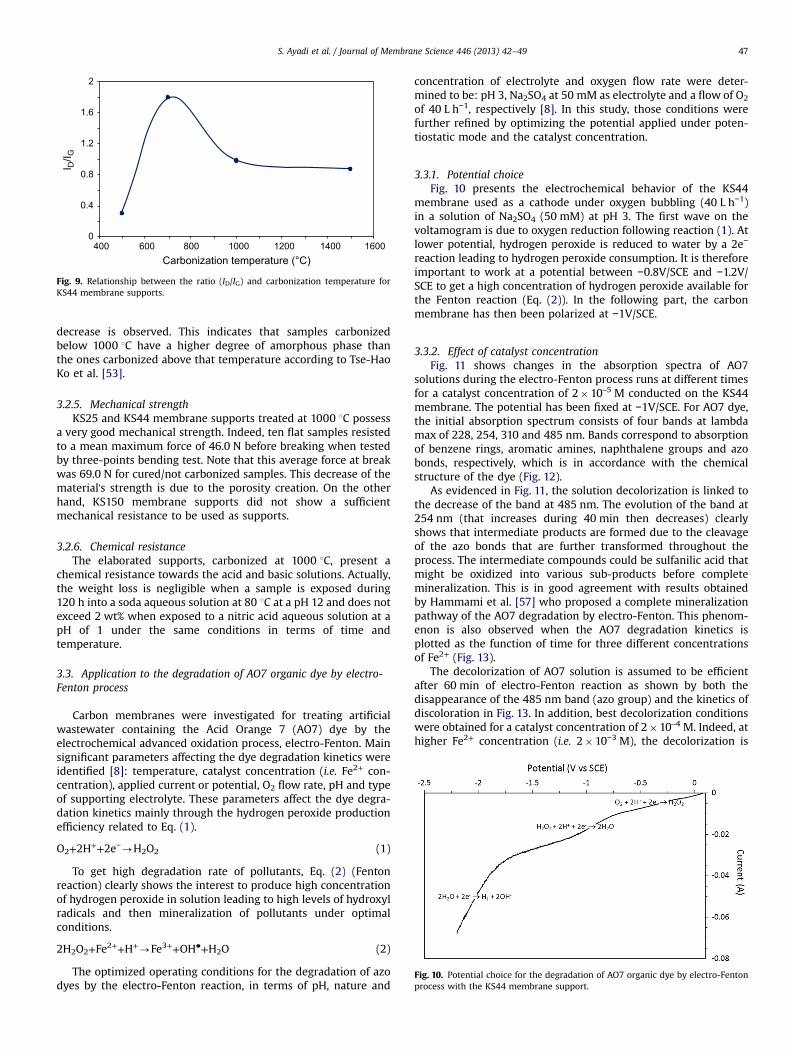
charge. The total porosity (Fig. 5) is thus the result of the mass lossof the resin matrix besides the burning out of organic additives(amijel, methocel, ethylene glycol and corn starch).
Average pores' size increases with particles size as shown inFig. 6. Average pore diameters were 1.7 mm, 3.0 mm and 4.6 mm formaterials prepared from graphite powders having particles size of25 mm (KS25), 44 mm (KS44) and 150 mm (KS150), respectively,after carbonization at a temperature of 1000 1C. Similar resultswere obtained by Song et al. when using coal particles in place ofgraphite [43,49]. It is then possible, from the same preparation, toadjust the porosity and the average diameter of pores by modify-ing the temperature of carbonization.
3.2.3. Electronic conductivityFig. 7 represents the evolution of the conductivity according to
the temperature treatment of the material. We can note aremarkable evolution of the conductivity as a function of bothcarbonization temperature increase and particles size of thegraphite powders used in the paste formulation. For small particlesizes (44 and 25 μm), the conductivity is the higher. This is mainlydue to a higher degree of percolation of smaller particles com-pared to bigger ones. At the same time, applying a highertemperature yielded to a more important amount of graphitizedresin, which lead thus to a better conductivity of the final material.This was confirmed by the structural analysis of the carbonmembranes.
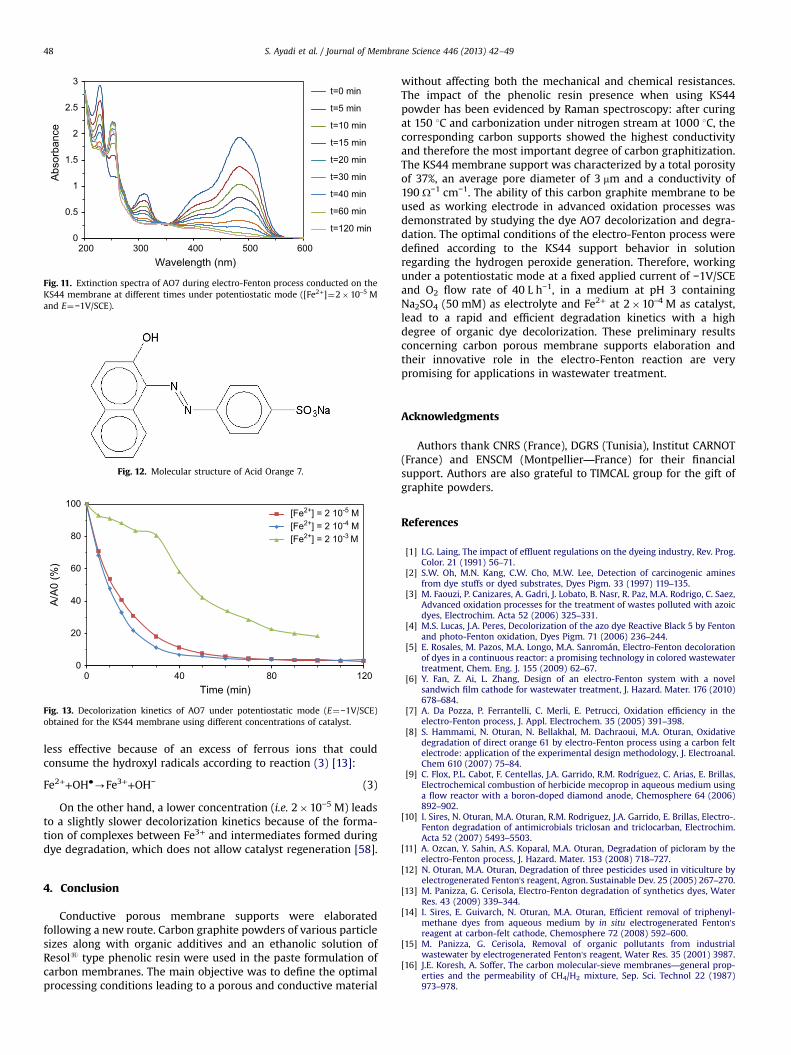
3.2.4. Structural morphology of supports characterized by Ramanspectroscopy
Fig. 8 shows the Raman spectra of pure KS44 graphite powderand carbon porous support materials prepared from KS44 graphitepowder and carbonized at different temperatures. The study hasbeen conducted on the membrane prepared from KS44 powderbecause of the good extrusion properties of the paste and theadequate porous and electrical properties.
Two main strong peaks are observed in the region comprisedbetween 1200 cm−1 and 1700 cm−1. The first band located at1563 cm−l is due to the “G mode” of the graphite structure,assigned to “in plane” displacement of the carbon strongly coupledin hexagonal sheets [50,51]. The second band located at 1320 cm−1
is due to a disordered structure in the carbon named “D mode”.This mode is usually called the “disorder-induced mode”. The Dband, which has a low intensity in graphite and well-organizedmaterials, becomes equivalent or even more intense than the Gband for more disordered solids [52].
At 150 1C, no significant difference was found between thecomposite materials and the pure graphite powder spectra sincethe resin was not yet fully carbonized at this temperature. Only thegraphite contained in the resin/graphite composite is responsibleof the observed D and G bands at 1320 cm−1 and 1563 cm−1,respectively.
The TGA analysis of the material has shown that the resin startsto carbonize at 400 1C. In fact, for samples carbonized at atemperature higher than 400 1C (i.e. 500 1C), a band at1600 cm−1 appeared. This band was assigned to regions ofmicro-crystalline order formed when the resin is carbonized[54,55]. The “G mode” band, located at 1563 cm−1 on the spectraof the pure graphite and samples treated at 150 1C, shifts to higherfrequencies with an increasing carbonization temperature. Thisshift of the G band position is due to the increase of order incarbon directly related to the temperature increase [56]. The Dband intensity does not change for temperatures lower than500 1C but increases from this temperature because of the resincarbonization and the creation of a glassy carbon phase. At 700 1C,the resin is totally transformed to random and disordered glassy
KS25 KS44 KS150
100 µm 100 µm 100 µm
857 µm 857 µm 857 µm
Fig. 4. SEM micrographs of the membrane supports elaborated with KS25 (a and b), KS44 (c and d), and KS150 (e and f) graphite powders after carbonization at 1000 1C.Images a, c and e reflect the surface morphology whereas images b, d and f are cross-section views.
0
15
30
45
60
0 400 800 1200 1600
Por
ous
vol
ume
(%)
Temperature treatment (°C)
KS25KS44KS150
Fig. 5. Evolution of the porous volume according to the temperature treatment ofmaterials.
0
3
6
9
0 400 800 1200 1600
Ave
rage
por
e si
ze (μ
m)
Temperature treatment (°C)
KS25KS44KS150
Fig. 6. Evolution of the average pore size diameter according to the temperaturetreatment of materials.
0
50
100
150
200
250
600 800 1000 1200 1400 1600
Con
duct
ivity
(Ω-1
cm-1
)
Temperature treatment (°C)
KS25KS44KS150
Fig. 7. Evolution of the conductivity according to the temperature treatment ofmaterials.
1800 1700 1600 1500 1400 1300 1200 1100
Wavenumber (cm-1)
Arb
itrar
y un
it
1500°C
1000°C
700°C
500°C
150°C
Pure graphite powder
Fig. 8. Raman spectra of membrane supports elaborated from KS44 graphitepowder and carbonized at different temperatures.
S. Ayadi et al. / Journal of Membrane Science 446 (2013) 42–4946
carbon structures, as depicted by the increase of the D bandintensity [53]. For temperature higher than 1000 1C the intensityof the band D decreases due to the graphitization of the carbo-nized resin domains that is attributed to the growth of the micro-crystalline regions.
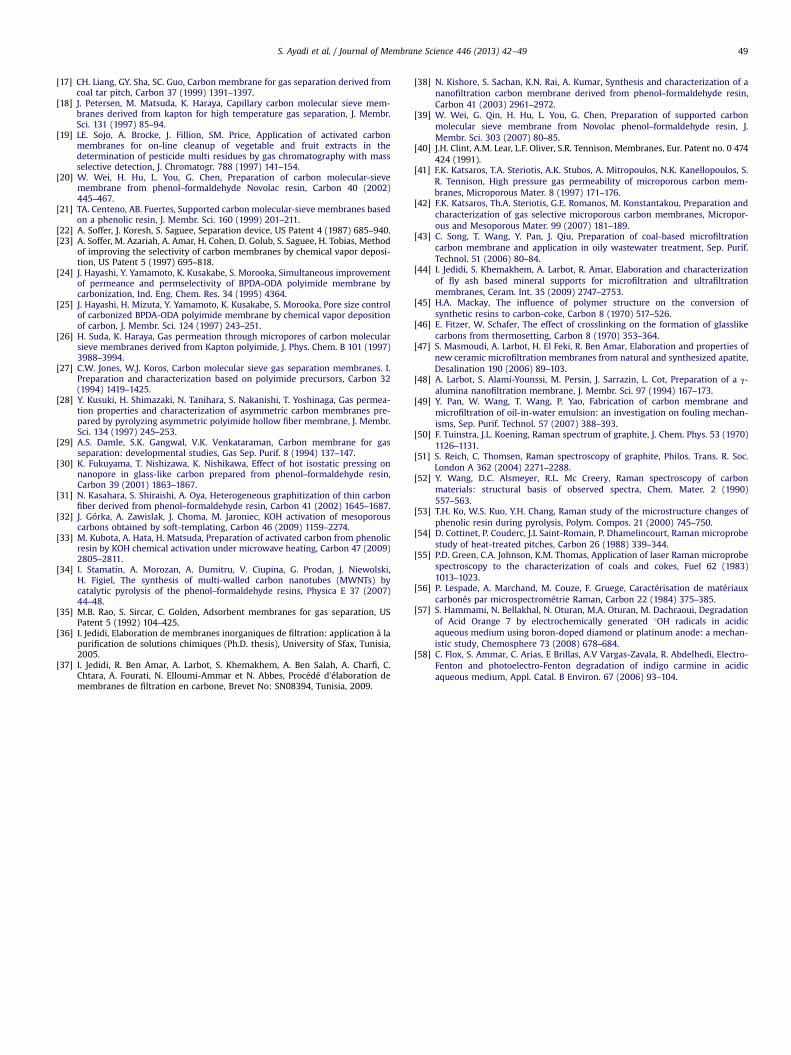
The relationship between the D band and the G band inten-sities should be proportional to the degree of structural order withrespect to the graphite structure. The intensity ratio between the Dand G bands (ID/IG) (Fig. 9) denotes the degree of graphitization ofcarbon graphite. A lower value of (ID/IG) means that a higherdegree of carbon graphitization is achieved. Even though this ratioincreases with the temperature, it appears that above 1000 1C, a
400 600 800 1000 1200 1400 16000
0.4
0.8
1.2
1.6
2I D
/I G
Carbonization temperature (°C)
Fig. 9. Relationship between the ratio (ID/IG) and carbonization temperature forKS44 membrane supports.
Fig. 10. Potential choice for the degradation of AO7 organic dye by electro-Fentonprocess with the KS44 membrane support.
S. Ayadi et al. / Journal of Membrane Science 446 (2013) 42–49 47
decrease is observed. This indicates that samples carbonizedbelow 1000 1C have a higher degree of amorphous phase thanthe ones carbonized above that temperature according to Tse-HaoKo et al. [53].
3.2.5. Mechanical strengthKS25 and KS44 membrane supports treated at 1000 1C possess
a very good mechanical strength. Indeed, ten flat samples resistedto a mean maximum force of 46.0 N before breaking when testedby three-points bending test. Note that this average force at breakwas 69.0 N for cured/not carbonized samples. This decrease of thematerial's strength is due to the porosity creation. On the otherhand, KS150 membrane supports did not show a sufficientmechanical resistance to be used as supports.
3.2.6. Chemical resistanceThe elaborated supports, carbonized at 1000 1C, present a
chemical resistance towards the acid and basic solutions. Actually,the weight loss is negligible when a sample is exposed during120 h into a soda aqueous solution at 80 1C at a pH 12 and does notexceed 2 wt% when exposed to a nitric acid aqueous solution at apH of 1 under the same conditions in terms of time andtemperature.
3.3. Application to the degradation of AO7 organic dye by electro-Fenton process
Carbon membranes were investigated for treating artificialwastewater containing the Acid Orange 7 (AO7) dye by theelectrochemical advanced oxidation process, electro-Fenton. Mainsignificant parameters affecting the dye degradation kinetics wereidentified [8]: temperature, catalyst concentration (i.e. Fe2+ con-centration), applied current or potential, O2 flow rate, pH and typeof supporting electrolyte. These parameters affect the dye degra-dation kinetics mainly through the hydrogen peroxide productionefficiency related to Eq. (1).
O2+2H++2e−-H2O2 (1)
To get high degradation rate of pollutants, Eq. (2) (Fentonreaction) clearly shows the interest to produce high concentrationof hydrogen peroxide in solution leading to high levels of hydroxylradicals and then mineralization of pollutants under optimalconditions.
2H2O2+Fe2++H+-Fe3++OH�+H2O (2)
The optimized operating conditions for the degradation of azodyes by the electro-Fenton reaction, in terms of pH, nature and
concentration of electrolyte and oxygen flow rate were deter-mined to be: pH 3, Na2SO4 at 50 mM as electrolyte and a flow of O2
of 40 L h−1, respectively [8]. In this study, those conditions werefurther refined by optimizing the potential applied under poten-tiostatic mode and the catalyst concentration.
3.3.1. Potential choiceFig. 10 presents the electrochemical behavior of the KS44
membrane used as a cathode under oxygen bubbling (40 L h−1)in a solution of Na2SO4 (50 mM) at pH 3. The first wave on thevoltamogram is due to oxygen reduction following reaction (1). Atlower potential, hydrogen peroxide is reduced to water by a 2e−
reaction leading to hydrogen peroxide consumption. It is thereforeimportant to work at a potential between −0.8V/SCE and −1.2V/SCE to get a high concentration of hydrogen peroxide available forthe Fenton reaction (Eq. (2)). In the following part, the carbonmembrane has then been polarized at −1V/SCE.
3.3.2. Effect of catalyst concentrationFig. 11 shows changes in the absorption spectra of AO7
solutions during the electro-Fenton process runs at different timesfor a catalyst concentration of 2�10–5 M conducted on the KS44membrane. The potential has been fixed at −1V/SCE. For AO7 dye,the initial absorption spectrum consists of four bands at lambdamax of 228, 254, 310 and 485 nm. Bands correspond to absorptionof benzene rings, aromatic amines, naphthalene groups and azobonds, respectively, which is in accordance with the chemicalstructure of the dye (Fig. 12).
As evidenced in Fig. 11, the solution decolorization is linked tothe decrease of the band at 485 nm. The evolution of the band at254 nm (that increases during 40 min then decreases) clearlyshows that intermediate products are formed due to the cleavageof the azo bonds that are further transformed throughout theprocess. The intermediate compounds could be sulfanilic acid thatmight be oxidized into various sub-products before completemineralization. This is in good agreement with results obtainedby Hammami et al. [57] who proposed a complete mineralizationpathway of the AO7 degradation by electro-Fenton. This phenom-enon is also observed when the AO7 degradation kinetics isplotted as the function of time for three different concentrationsof Fe2+ (Fig. 13).
The decolorization of AO7 solution is assumed to be efficientafter 60 min of electro-Fenton reaction as shown by both thedisappearance of the 485 nm band (azo group) and the kinetics ofdiscoloration in Fig. 13. In addition, best decolorization conditionswere obtained for a catalyst concentration of 2�10–4 M. Indeed, athigher Fe2+ concentration (i.e. 2�10−3 M), the decolorization is
0
0.5
1
1.5
2
2.5
3
200 300 400 500 600
Abs
orba
nce
Wavelength (nm)
t=0 min
t=5 min
t=10 min
t=15 min
t=20 min
t=30 min
t=40 min
t=60 min
t=120 min
Fig. 11. Extinction spectra of AO7 during electro-Fenton process conducted on theKS44 membrane at different times under potentiostatic mode ([Fe2+]¼2�10–5 Mand E¼−1V/SCE).
Fig. 12. Molecular structure of Acid Orange 7.
0
20
40
60
80
100
0 40 80 120
A/A
0 (%
)
Time (min)
[Fe2+] = 2 10-5 M[Fe2+] = 2 10-4 M[Fe2+] = 2 10-3 M
Fig. 13. Decolorization kinetics of AO7 under potentiostatic mode (E¼−1V/SCE)obtained for the KS44 membrane using different concentrations of catalyst.
S. Ayadi et al. / Journal of Membrane Science 446 (2013) 42–4948
less effective because of an excess of ferrous ions that couldconsume the hydroxyl radicals according to reaction (3) [13]:
Fe2++OH�-Fe3++OH− (3)
On the other hand, a lower concentration (i.e. 2�10−5 M) leadsto a slightly slower decolorization kinetics because of the forma-tion of complexes between Fe3+ and intermediates formed duringdye degradation, which does not allow catalyst regeneration [58].
4. Conclusion
Conductive porous membrane supports were elaboratedfollowing a new route. Carbon graphite powders of various particlesizes along with organic additives and an ethanolic solution ofResols type phenolic resin were used in the paste formulation ofcarbon membranes. The main objective was to define the optimalprocessing conditions leading to a porous and conductive material
without affecting both the mechanical and chemical resistances.The impact of the phenolic resin presence when using KS44powder has been evidenced by Raman spectroscopy: after curingat 150 1C and carbonization under nitrogen stream at 1000 1C, thecorresponding carbon supports showed the highest conductivityand therefore the most important degree of carbon graphitization.The KS44 membrane support was characterized by a total porosityof 37%, an average pore diameter of 3 mm and a conductivity of190 Ω−1 cm−1. The ability of this carbon graphite membrane to beused as working electrode in advanced oxidation processes wasdemonstrated by studying the dye AO7 decolorization and degra-dation. The optimal conditions of the electro-Fenton process weredefined according to the KS44 support behavior in solutionregarding the hydrogen peroxide generation. Therefore, workingunder a potentiostatic mode at a fixed applied current of −1V/SCEand O2 flow rate of 40 L h−1, in a medium at pH 3 containingNa2SO4 (50 mM) as electrolyte and Fe2+ at 2�10–4 M as catalyst,lead to a rapid and efficient degradation kinetics with a highdegree of organic dye decolorization. These preliminary resultsconcerning carbon porous membrane supports elaboration andtheir innovative role in the electro-Fenton reaction are verypromising for applications in wastewater treatment.
Acknowledgments
Authors thank CNRS (France), DGRS (Tunisia), Institut CARNOT(France) and ENSCM (Montpellier—France) for their financialsupport. Authors are also grateful to TIMCAL group for the gift ofgraphite powders.
References
[1] I.G. Laing, The impact of effluent regulations on the dyeing industry, Rev. Prog.Color. 21 (1991) 56–71.
[2] S.W. Oh, M.N. Kang, C.W. Cho, M.W. Lee, Detection of carcinogenic aminesfrom dye stuffs or dyed substrates, Dyes Pigm. 33 (1997) 119–135.
[3] M. Faouzi, P. Canizares, A. Gadri, J. Lobato, B. Nasr, R. Paz, M.A. Rodrigo, C. Saez,Advanced oxidation processes for the treatment of wastes polluted with azoicdyes, Electrochim. Acta 52 (2006) 325–331.
[4] M.S. Lucas, J.A. Peres, Decolorization of the azo dye Reactive Black 5 by Fentonand photo-Fenton oxidation, Dyes Pigm. 71 (2006) 236–244.
[5] E. Rosales, M. Pazos, M.A. Longo, M.A. Sanromán, Electro-Fenton decolorationof dyes in a continuous reactor: a promising technology in colored wastewatertreatment, Chem. Eng. J. 155 (2009) 62–67.
[6] Y. Fan, Z. Ai, L. Zhang, Design of an electro-Fenton system with a novelsandwich film cathode for wastewater treatment, J. Hazard. Mater. 176 (2010)678–684.
[7] A. Da Pozza, P. Ferrantelli, C. Merli, E. Petrucci, Oxidation efficiency in theelectro-Fenton process, J. Appl. Electrochem. 35 (2005) 391–398.
[8] S. Hammami, N. Oturan, N. Bellakhal, M. Dachraoui, M.A. Oturan, Oxidativedegradation of direct orange 61 by electro-Fenton process using a carbon feltelectrode: application of the experimental design methodology, J. Electroanal.Chem 610 (2007) 75–84.
[9] C. Flox, P.L. Cabot, F. Centellas, J.A. Garrido, R.M. Rodríguez, C. Arias, E. Brillas,Electrochemical combustion of herbicide mecoprop in aqueous medium usinga flow reactor with a boron-doped diamond anode, Chemosphere 64 (2006)892–902.
[10] I. Sires, N. Oturan, M.A. Oturan, R.M. Rodriguez, J.A. Garrido, E. Brillas, Electro-.Fenton degradation of antimicrobials triclosan and triclocarban, Electrochim.Acta 52 (2007) 5493–5503.
[11] A. Ozcan, Y. Sahin, A.S. Koparal, M.A. Oturan, Degradation of picloram by theelectro-Fenton process, J. Hazard. Mater. 153 (2008) 718–727.
[12] N. Oturan, M.A. Oturan, Degradation of three pesticides used in viticulture byelectrogenerated Fenton's reagent, Agron. Sustainable Dev. 25 (2005) 267–270.
[13] M. Panizza, G. Cerisola, Electro-Fenton degradation of synthetics dyes, WaterRes. 43 (2009) 339–344.
[14] I. Sires, E. Guivarch, N. Oturan, M.A. Oturan, Efficient removal of triphenyl-methane dyes from aqueous medium by in situ electrogenerated Fenton'sreagent at carbon-felt cathode, Chemosphere 72 (2008) 592–600.
[15] M. Panizza, G. Cerisola, Removal of organic pollutants from industrialwastewater by electrogenerated Fenton's reagent, Water Res. 35 (2001) 3987.
[16] J.E. Koresh, A. Soffer, The carbon molecular-sieve membranes—general prop-erties and the permeability of CH4/H2 mixture, Sep. Sci. Technol 22 (1987)973–978.
S. Ayadi et al. / Journal of Membrane Science 446 (2013) 42–49 49
[17] CH. Liang, GY. Sha, SC. Guo, Carbon membrane for gas separation derived fromcoal tar pitch, Carbon 37 (1999) 1391–1397.
[18] J. Petersen, M. Matsuda, K. Haraya, Capillary carbon molecular sieve mem-branes derived from kapton for high temperature gas separation, J. Membr.Sci. 131 (1997) 85–94.
[19] LE. Sojo, A. Brocke, J. Fillion, SM. Price, Application of activated carbonmembranes for on-line cleanup of vegetable and fruit extracts in thedetermination of pesticide multi residues by gas chromatography with massselective detection, J. Chromatogr. 788 (1997) 141–154.
[20] W. Wei, H. Hu, L. You, G. Chen, Preparation of carbon molecular-sievemembrane from phenol–formaldehyde Novolac resin, Carbon 40 (2002)445–467.
[21] TA. Centeno, AB. Fuertes, Supported carbon molecular-sieve membranes basedon a phenolic resin, J. Membr. Sci. 160 (1999) 201–211.
[22] A. Soffer, J. Koresh, S. Saguee, Separation device, US Patent 4 (1987) 685–940.[23] A. Soffer, M. Azariah, A. Amar, H. Cohen, D. Golub, S. Saguee, H. Tobias, Method
of improving the selectivity of carbon membranes by chemical vapor deposi-tion, US Patent 5 (1997) 695–818.
[24] J. Hayashi, Y. Yamamoto, K. Kusakabe, S. Morooka, Simultaneous improvementof permeance and permselectivity of BPDA-ODA polyimide membrane bycarbonization, Ind. Eng. Chem. Res. 34 (1995) 4364.
[25] J. Hayashi, H. Mizuta, Y. Yamamoto, K. Kusakabe, S. Morooka, Pore size controlof carbonized BPDA-ODA polyimide membrane by chemical vapor depositionof carbon, J. Membr. Sci. 124 (1997) 243–251.
[26] H. Suda, K. Haraya, Gas permeation through micropores of carbon molecularsieve membranes derived from Kapton polyimide, J. Phys. Chem. B 101 (1997)3988–3994.
[27] C.W. Jones, W.J. Koros, Carbon molecular sieve gas separation membranes. I.Preparation and characterization based on polyimide precursors, Carbon 32(1994) 1419–1425.
[28] Y. Kusuki, H. Shimazaki, N. Tanihara, S. Nakanishi, T. Yoshinaga, Gas permea-tion properties and characterization of asymmetric carbon membranes pre-pared by pyrolyzing asymmetric polyimide hollow fiber membrane, J. Membr.Sci. 134 (1997) 245–253.
[29] A.S. Damle, S.K. Gangwal, V.K. Venkataraman, Carbon membrane for gasseparation: developmental studies, Gas Sep. Purif. 8 (1994) 137–147.
[30] K. Fukuyama, T. Nishizawa, K. Nishikawa, Effect of hot isostatic pressing onnanopore in glass-like carbon prepared from phenol–formaldehyde resin,Carbon 39 (2001) 1863–1867.
[31] N. Kasahara, S. Shiraishi, A. Oya, Heterogeneous graphitization of thin carbonfiber derived from phenol–formaldehyde resin, Carbon 41 (2002) 1645–1687.
[32] J. Górka, A. Zawislak, J. Choma, M. Jaroniec, KOH activation of mesoporouscarbons obtained by soft-templating, Carbon 46 (2009) 1159–2274.
[33] M. Kubota, A. Hata, H. Matsuda, Preparation of activated carbon from phenolicresin by KOH chemical activation under microwave heating, Carbon 47 (2009)2805–2811.
[34] I. Stamatin, A. Morozan, A. Dumitru, V. Ciupina, G. Prodan, J. Niewolski,H. Figiel, The synthesis of multi-walled carbon nanotubes (MWNTs) bycatalytic pyrolysis of the phenol–formaldehyde resins, Physica E 37 (2007)44–48.
[35] M.B. Rao, S. Sircar, C. Golden, Adsorbent membranes for gas separation, USPatent 5 (1992) 104–425.
[36] I. Jedidi, Elaboration de membranes inorganiques de filtration: application à lapurification de solutions chimiques (Ph.D. thesis), University of Sfax, Tunisia,2005.
[37] I. Jedidi, R. Ben Amar, A. Larbot, S. Khemakhem, A. Ben Salah, A. Charfi, C.Chtara, A. Fourati, N. Elloumi-Ammar et N. Abbes, Procédé d’élaboration demembranes de filtration en carbone, Brevet No: SN08394, Tunisia, 2009.
[38] N. Kishore, S. Sachan, K.N. Rai, A. Kumar, Synthesis and characterization of ananofiltration carbon membrane derived from phenol–formaldehyde resin,Carbon 41 (2003) 2961–2972.
[39] W. Wei, G. Qin, H. Hu, L. You, G. Chen, Preparation of supported carbonmolecular sieve membrane from Novolac phenol–formaldehyde resin, J.Membr. Sci. 303 (2007) 80–85.
[40] J.H. Clint, A.M. Lear, L.F. Oliver, S.R. Tennison, Membranes, Eur. Patent no. 0 474424 (1991).
[41] F.K. Katsaros, T.A. Steriotis, A.K. Stubos, A. Mitropoulos, N.K. Kanellopoulos, S.R. Tennison, High pressure gas permeability of microporous carbon mem-branes, Microporous Mater. 8 (1997) 171–176.
[42] F.K. Katsaros, Th.A. Steriotis, G.E. Romanos, M. Konstantakou, Preparation andcharacterization of gas selective microporous carbon membranes, Micropor-ous and Mesoporous Mater. 99 (2007) 181–189.
[43] C. Song, T. Wang, Y. Pan, J. Qiu, Preparation of coal-based microfiltrationcarbon membrane and application in oily wastewater treatment, Sep. Purif.Technol. 51 (2006) 80–84.
[44] I. Jedidi, S. Khemakhem, A. Larbot, R. Amar, Elaboration and characterizationof fly ash based mineral supports for microfiltration and ultrafiltrationmembranes, Ceram. Int. 35 (2009) 2747–2753.
[45] H.A. Mackay, The influence of polymer structure on the conversion ofsynthetic resins to carbon-coke, Carbon 8 (1970) 517–526.
[46] E. Fitzer, W. Schafer, The effect of crosslinking on the formation of glasslikecarbons from thermosetting, Carbon 8 (1970) 353–364.
[47] S. Masmoudi, A. Larbot, H. El Feki, R. Ben Amar, Elaboration and properties ofnew ceramic microfiltration membranes from natural and synthesized apatite,Desalination 190 (2006) 89–103.
[48] A. Larbot, S. Alami-Younssi, M. Persin, J. Sarrazin, L. Cot, Preparation of a γ-alumina nanofiltration membrane, J. Membr. Sci. 97 (1994) 167–173.
[49] Y. Pan, W. Wang, T. Wang, P. Yao, Fabrication of carbon membrane andmicrofiltration of oil-in-water emulsion: an investigation on fouling mechan-isms, Sep. Purif. Technol. 57 (2007) 388–393.
[50] F. Tuinstra, J.L. Koening, Raman spectrum of graphite, J. Chem. Phys. 53 (1970)1126–1131.
[51] S. Reich, C. Thomsen, Raman spectroscopy of graphite, Philos. Trans. R. Soc.London A 362 (2004) 2271–2288.
[52] Y. Wang, D.C. Alsmeyer, R.L. Mc Creery, Raman spectroscopy of carbonmaterials: structural basis of observed spectra, Chem. Mater. 2 (1990)557–563.
[53] T.H. Ko, W.S. Kuo, Y.H. Chang, Raman study of the microstructure changes ofphenolic resin during pyrolysis, Polym. Compos. 21 (2000) 745–750.
[54] D. Cottinet, P. Couderc, J.L Saint-Romain, P. Dhamelincourt, Raman microprobestudy of heat-treated pitches, Carbon 26 (1988) 339–344.
[55] P.D. Green, C.A. Johnson, K.M. Thomas, Application of laser Raman microprobespectroscopy to the characterization of coals and cokes, Fuel 62 (1983)1013–1023.
[56] P. Lespade, A. Marchand, M. Couze, F. Gruege, Caractérisation de matériauxcarbonés par microspectrométrie Raman, Carbon 22 (1984) 375–385.
[57] S. Hammami, N. Bellakhal, N. Oturan, M.A. Oturan, M. Dachraoui, Degradationof Acid Orange 7 by electrochemically generated 1OH radicals in acidicaqueous medium using boron-doped diamond or platinum anode: a mechan-istic study, Chemosphere 73 (2008) 678–684.
[58] C. Flox, S. Ammar, C. Arias, E Brillas, A.V Vargas-Zavala, R. Abdelhedi, Electro-Fenton and photoelectro-Fenton degradation of indigo carmine in acidicaqueous medium, Appl. Catal. B Environ. 67 (2006) 93–104.