Base genética da resistência de um acesso de tomate silvestre ao mosaico-amarelo do pimentão

FRG PAN99-L 99-P
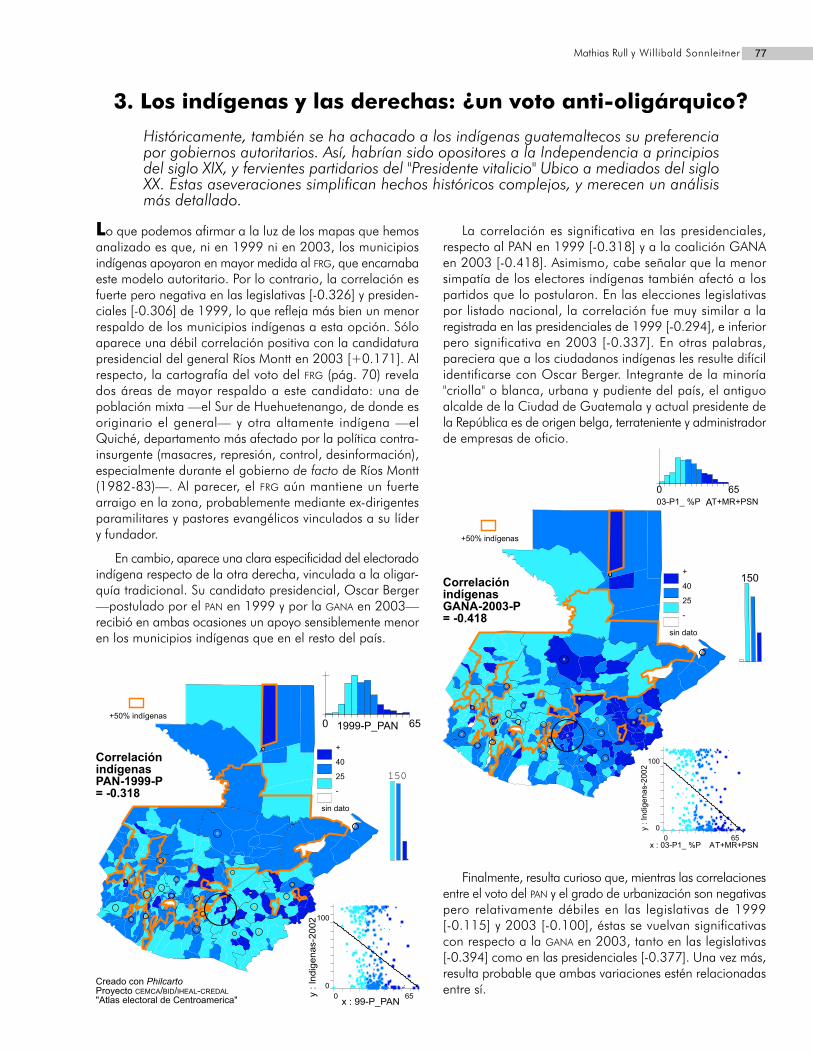
-0.326 -0.30611% 9%03-L 03-P10.097 0.1711% 3%
Correlación entreIndígenas y:
Pearsonr²
Indígenas y:Pearson
r²
PAN PAN99-L 99-P
-0.294 -0.318 9% 10%03-L 03-P10.008 0.0980% 1%
G
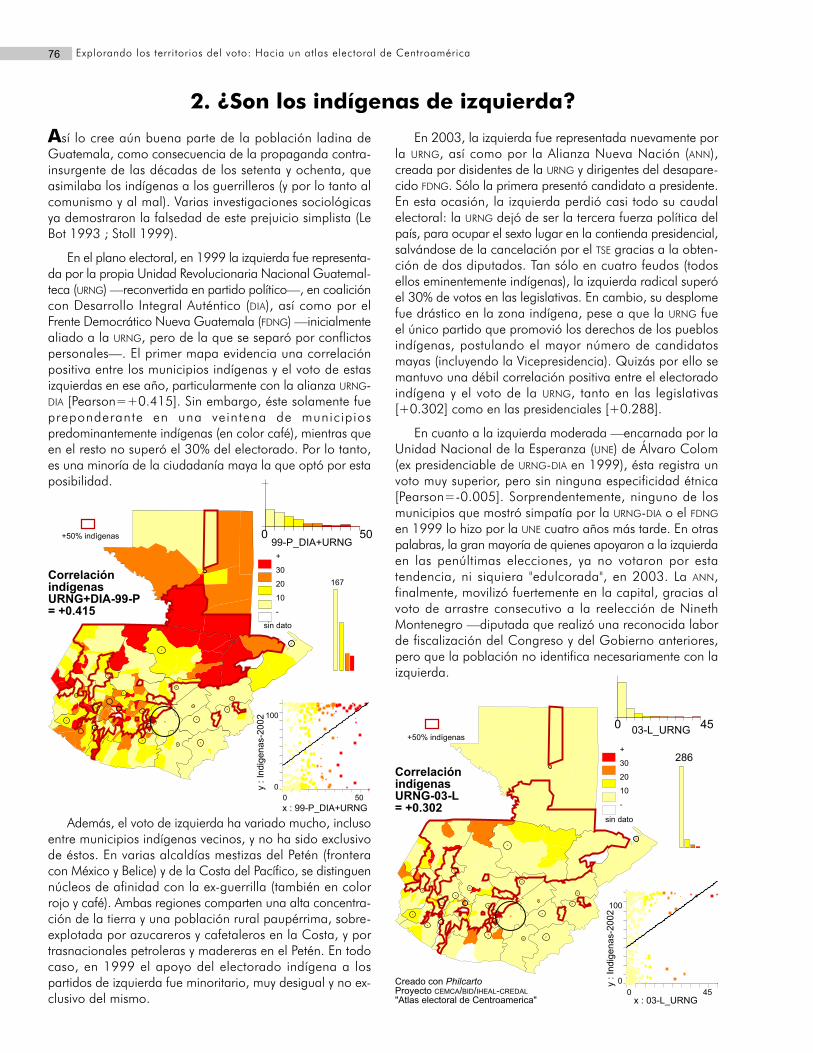
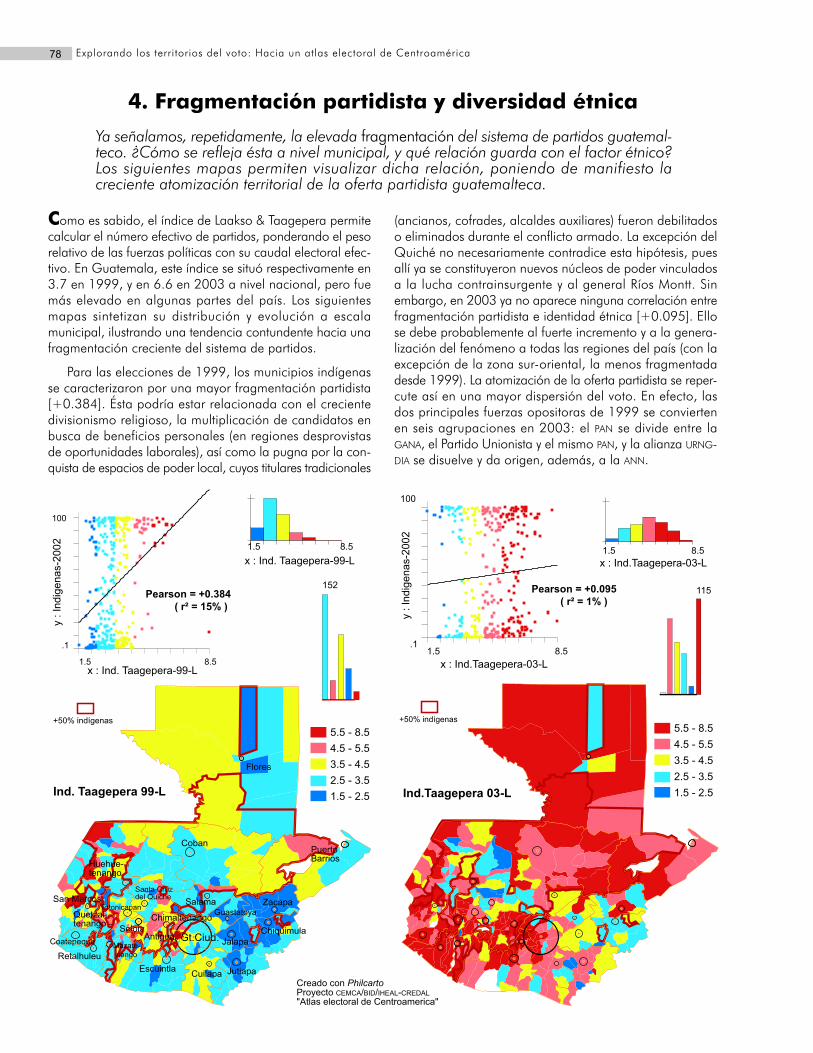
GANA FDNG URNG URNG Número de partidos Voto cruzado- - 99-L 99-P 99-L 99-P 99-L 99-L- - 0.254 0.281 0.342 0.415 0.384 0.384- - 6% 8% 12% 17% 15% 15%
03-L 03-P1 03-P2 03-P2_UNE 03-L 03-P1 03-L 2003
_
P-L-0.337 -0.418 -0.180 0.180 0.302 0.288 0.095 -0.07211% 17% 3% 3% 9% 8% 1% 1%

Correlaciones Participación electoral (población inscrita) Participación (población en edad de votar) %Muj.Pearson 99-LLn 99-P 03-LLn 03-P1 03-P2 99-LLn 99-P 03-LLn 03-P1 03-P2 Insc. 03
Indígenas 0.138 0.136 0.214 0.215 -0.054 -0.107 -0.109 -0.022 -0.022 -0.219 -0.295Habitantes/JRV -0.261 -0.254 -0.104 -0.100 0.072 -0.805 -0.802 -0.723 -0.722 -0.620 -0.546Población urbana 0.344 0.339 0.375 0.380 0.508 0.086 0.085 0.156 0.160 0.292 0.383Pobreza extrema -0.073 -0.072 -0.070 -0.070 -0.330 -0.041 -0.041 -0.044 -0.044 -0.266 -0.480Mujeres inscritas 03 0.304 0.301 0.237 0.239 0.269 0.521 0.521 0.511 0.513 0.560 1.000

Copyright © 2022 FDOKUMEN


![Ciudadanos de la geografía tropical. Ficciones históricas de lo ciudadano [Presentación + Introducciones]](https://static.fdokumen.com/doc/165x107/633292d78d2c463a5800f005/ciudadanos-de-la-geografia-tropical-ficciones-historicas-de-lo-ciudadano-presentacion.jpg)