EGYPT NATIONAL REPORT - Global Entrepreneurship Monitor
108
2018/2019 EGYPT NATIONAL REPORT Ayman Ismail Ahmed Tolba Shima Barakat Hakim Meshreki Seham Ghalwash
-
Upload
khangminh22 -
Category
Documents
-
view
1 -
download
0
Transcript of EGYPT NATIONAL REPORT - Global Entrepreneurship Monitor

2018/2019
EGYPTNATIONALREPORT
Ayman Ismail Ahmed Tolba Shima Barakat Hakim MeshrekiSeham Ghalwash

TO CITE THIS REPORT: Ismail, A., Tolba. A., Barakat, Sh., Meshreki, H., & Ghalwash, S. (2019). Global Entrepreneurship Monitor. Egypt National Report. Cairo: The American University in Cairo, for Global Entrepreneurship Monitor. https://www.gemconsortium.org/economy-profiles/egypt

TABLE OF CONTENTEXECUTIVE SUMMARY
INTRODUCTION About GEM GEM’s Approach and Impact GEM in Egypt Scope of This Report
METHODOLOGY GEM Conceptual Framework GEM Entrepreneurship Indicator GEM Data Countries Participating in The GEM Project
SECTION 1: PERSPECTIVES ON ENTREPRENEURSHIP IN EGYPT Societal Values About Entrepreneurship Individual Self-Perception About Entrepreneurship Phases and Types of Entrepreneurial Activity
SECTION 2: DEMOGRAPHIC CHARACTERISTICS OF ENTREPRENEURS Women and Gender Distribution of Entrepreneurship Activities Youth and Age Distribution of Entrepreneurship Activities
SECTION 3: CHARACTERISTICS OF ENTREPRENEURIAL ACTIVITIES Motivation for Early-Stage Entrepreneurial Activity Industry Sector Participation Job Creation Projections and Growth Orientation Orientation Innovation Internationalization
SECTION 4: ENTREPRENEURSHIP ECOSYSTEM GEM’s Entrepreneurship Framework Conditions National Entrepreneurship Context Index (NECI) Egypt’s Entrepreneurship Ecosystem Entrepreneurial Finance Government Policies Government Entrepreneurship Programs Entrepreneurship Education Research & Development Transfer Commercial and Legal Infrastructure Internal Market Dynamics Physical Infrastructure Cultural and Social Norms Experts Views and Recommendations
SECTION 5: CONCLUSIONS AND POLICY RECOMMENDATIONS
APPENDIX TABLE
8
14
18
24
34
38
50
72
78
FROM THE DEAN
This year, AUC celebrates its Centennial with 100 years of contribution to education, social progress, and economic development in Egypt and the Middle East and Africa (MENA) region. Entrepreneurship stands at the core of AUC’s liberal arts education and AUC School of Business’ mission and vision.
Over the past decade, Egypt has experienced a dynamic entrepreneurial movement that started to take place amongst the youth and young professionals nationally and regionally, with AUC School of Business being at the heart of this entrepreneurial movement. In 2010, the School selected entrepreneurship as one of its key strategic priorities. With almost 10 years down the road, the AUC School of Business has become a leading force in the entrepreneurship ecosystem in Egypt and the MENA region. Through academic and executive education programs, quality impact-oriented research, and various initiatives targeting Egyptian and Arab entrepreneurs, the School has strongly contributed in spreading the entrepreneurial spirit and in increasing the startup activity rate in the whole region.
This year for the fourth consecutive time, we join our efforts with the Global Entrepreneurship Monitor (GEM) Consortium to produce the GEM Egypt report. As usual, the report provides key indicators and in-depth analysis of entrepreneurship activity as well as individual motivations, behaviors, and attitudes towards entrepreneurship in the country. Through this report, we also contribute to building knowledge and sharing insights for effective evidence-based decision making and actions amongst key players in the Egyptian entrepreneurial ecosystem, and to foster much needed investments in the country’s entrepreneurs.
Through producing the GEM Egypt report, and other teaching, research, and outreach activities and initiatives, the AUC School of Business continues to promote and support entrepreneurship in Egypt, the region and beyond. This emanates from our vision to be the leading knowledge hub with an Arab region relevance and a global influence, and our mission to develop entrepreneurial and responsible global leaders and professionals.
Sherif KamelDean AUC School of Business
GEM Egypt National Report 18/194 FROM THE DEAN

THE AMERICAN UNIVERSITY IN CAIRO
The American University in Cairo (AUC) was founded in 1919 by Americans devoted to education and community service in the Middle East. Today, AUC is the region’s premier English-language university and an essential contributor to the social, political and cultural life of the Arab world. AUC’s academic programs are rooted in liberal arts education and serve as a crossroads for the world’s cultures: a vital, vibrant forum for reasoned argument, spirited debate and understanding across cultures. Chartered and accredited in the United States and Egypt, The American University in Cairo is an independent, not-for-profit, equal-opportunity institution.
AUC SCHOOL OF BUSINESS
The AUC School of Business is the leading business school in the Middle East and Africa, providing world-class undergraduate, graduate and executive business education in management, economics and accounting. The School’s programs are built around entrepreneurship, responsible business and economic development. Programs are delivered in ways that allow students to enjoy a learning experience that extends beyond the classroom, through diverse activities that prepare them to compete in a knowledge-based global community. The AUC School of Business is among fewer than 1 percent of business schools worldwide that hold triple-crown accreditation from three top international accreditation bodies: EQUIS, AMBA and AACSB. It consistently ranks among the top business schools in the MENA region and Africa in undergraduate, MBA and executive education.
GEM Egypt National Report 18/19 5THE AMERICAN UNIVERSITY IN CAIRO

FROM THE AUTHORS
This is our fourth consecutive GEM Egypt report since we undertook this project in 2015. Over the past decade, Egypt and the world has witnessed an ambitious entrepreneurial movement. In Egypt, this has translated into policies and programs to support entrepreneurs as well as numerous success stories. We are pleased that the GEM Egypt report is at the heart of this movement, helping many stakeholders make evidence-based analysis and decisions to support their programs, interventions, policies and reforms. The GEM data and analysis provide a strong foundation for these decisions, providing insights to policy makers, helping program managers better target their interventions, and advocating relevant and impactful policy reforms.
This year’s report reflects the beginning of Egypt’s economic recovery in 2018. During the period between 2016-2018, Egypt’s economy experienced a challenging period marked by a severe currency devaluation, high interest rates, rising inflation and a reduction of government subsidies. These challenging economic conditions and austerity measures resulted in high rates of unemployment, especially among youth, and a decline in the standards of living. Despite this challenging environment, Egypt’s entrepreneurial indicators remained positive. As the economy began to recover in 2018, we started witnessing this transformation in the various indicators entailed in this report, which reflects a culture of resilience and recovery.
As we present our research and findings, we continue to believe that entrepreneurship is a key driver for economic growth, job creation and competitiveness. It is also a great vehicle for socio-economic inclusion, youth engagement and promoting a free and competitive economy.
In this GEM report, we provide a comprehensive study of entrepreneurship in Egypt, tracking individual motivations, behaviors, attitudes towards entrepreneurship, and benchmarking them against GEM global figures and historical trends. We also examine the different elements of Egypt’s entrepreneurial ecosystem and provide insights on the strengths and weaknesses in each area.
GEM’s Egypt report provides analytical resources for policy makers, practitioners, and development organizations. It also provides evidence-based analysis on the characteristics of entrepreneurship in Egypt, with the aim of guiding policy decisions, institution building and investments decisions.
GEM Egypt National Report 18/196 FROM THE AUTHORS
AYMAN ISMAILPHD, MBAAssociate Professor and Abdul Latif Jameel Endowed Chair of Entrepreneurship
Director, AUC Venture Lab
AUC School of Business
AHMED TOLBAPHD, MBAAssociate Provost for Strategic Enrollment
Associate Professor of Marketing
AUC School of Business
SHIMA BARAKATPHD, MBAEntrepreneurship Education Advisor
The University of Cambridge
HAKIM MESHREKIPHD, MBAVisiting Assistant Professor of Marketing
AUC School of Business
SEHAM GHALWASHMScResearch Manager, GEM Egypt
AUC School of Business

GEM Egypt National Report 18/19 7ACKNOWLEDGEMENT
ACKNOWLEDGEMENTS
The authors and the American University in Cairo School of Business are grateful for the support provided to the Global Entrepreneurship Monitor Egypt 2018-19 Report by our partner organizations:
The Information Technology Industry Development Agency (ITIDA), established by the Ministry of Communications and Information Technology (MCIT) to stimulate, orchestrate and spearhead the development of the IT industry in Egypt.
Drosos is a non-profit charitable organization based in Zurich, Switzerland and established in 2003. Drosos is involved with more than 100 projects to fight poverty, promote health, increase access to education and creative activities for youth, and protect the environment.
Hivos, the Humanist Institute for Cooperation with Developing Countries, is a development aid organization headquartered in the Netherlands. Hivos supports organizations working in Africa, Latin America and Asia in the fields of social change, digital activism and rural innovations.
Oxfam, through a grant from the Danish-Arab Partnership Program (DAAP) under the Youth Participation and Employment Project (YPE), supports better economic opportunities, especially for young people and women in the region. The Danish-Arab Partnership Program is Denmark’s collaboration program with the Middle East and North Africa.

EXECUTIVESUMMARY
GEM Egypt National Report 18/198

EXECUTIVESUMMARY

EXECUTIVE SUMMARY
Despite challenging economic conditions in Egypt over the past few years (currency devaluation, growing inflation, rising interest rates and the reduction of government subsidies), the growing the buildup of a positive entrepreneurial trend continued, with more progress towards growing an entrepreneurial culture in Egypt.
In this report, we examine the behaviors, motivations and attitudes towards entrepreneurship as well as characteristics of early-stage enterprises through insights from the Adult Population Survey (APS) of a sample of 2,542 individuals. We also examine the different aspects of the entrepreneurship ecosystem in Egypt expressed by 50 national experts through the National Expert Survey (NES). We also introduce the National Entrepreneurship Context Index (NECI), a new index providing a composite measure of the entrepreneurial ecosystem, based on GEM’s 12 framework conditions. Through our analysis, we benchmark these aspects in Egypt against other GEM countries as well as countries of similar economic development level. We also look at the historical trend comparing this year’s data with data from previous years.
Perspectives on Entrepreneurship in Egypt
Overall, Egyptians hold a positive perspective of entrepreneurs, and a majority of them aspire to start a business. However, the rate of entrepreneurial participation is slowly declining over the past 3 years, along with a high level of business discontinuation, with a majority of entrepreneurs driven by economic necessity.
Societal perceptions of entrepreneurship remain highly favorable as 74% of Egyptians perceive entrepreneurship as a good career choice (ranking 10th among GEM countries), 82.6% regard successful entrepreneurs in high social status (ranking 5th among GEM countries), and 68.1% of Egyptians perceived media attention towards entrepreneurship as favorable. These indicators highlight a consistently positive appreciation for entrepreneurship within society at large.
Opportunity-recognition is at the heart of the entrepreneurial process; playing an important role in shaping individuals’ decisions to start new businesses. 39.3% of the non-entrepreneurs perceived an opportunity to start a new venture (ranking 30th). This represents a drop from previous years (ranging between 47-54% in 2015-2017), suggesting that opportunity is perceived to have reduced in Egypt compared to previous years. This is an indicator that while the economy has started to recover, opportunity recognition is lagging, with fewer people identifying entrepreneurial opportunities compared to previous years.
Entrepreneurial intention remains extremely high, with 60.2% of Egyptian non-entrepreneurs surveyed indicating interest or intentions to start a business within the next three years. This score is the third among all GEM countries surveyed and more than 2x the global average. These figures have been consistently high over the past three years. Given the tough economic environment during the time of data collection, it is likely that these intentions reflection economic necessity for self-employment, rather than the perception of a business opportunity.
GEM Egypt National Report 18/19 EXECUTIVE SUMMARY10

Early-stage entrepreneurial activity (TEA) is the primary metric used by GEM to measure and compare entrepreneurial activities among countries. In 2018, the TEA rate in Egypt was 9.8%, which is lower than the global average of 12.6%, ranking 28th globally. This TEA figure indicates that around 9.8% of the adult population in Egypt (aged 18-64) are currently either actively setting up a new business or have started a business that is younger than 3.5 years. This figure shows a decline from a peak of 14.3% in 2016 and 13.3% in 2017, an indication of a moderate decline in entrepreneurial activities in Egypt. The rate of established businesses has also declined from 6.1% in 2016, to 5.7% in 2017 to 4.5% in 2018. This decline reflects the high rate of business discontinuation (7.6%, ranking 8th globally), which has persisted over the past years and is primarily driven by lack of profitability or limited access to finance.
Demographic Characteristics of Entrepreneurship
In terms of gender distribution in Egypt: around one in every four entrepreneurs is a woman, and one in every eight established business owners is a woman. Women-led businesses have a lower probability of continuation compared to men-led businesses. The rate of women participation is far below the global and MENA region averages. In terms of age distribution, youth participation (18-24 and 25-34 years old) in entrepreneurial activities in Egypt remains higher than older age segments.
Characteristics of Entrepreneurship Activities
In terms of the motivation to start their business: opportunity-driven entrepreneurship has been decreasing, with 47.5% of early-stage entrepreneurs reporting that they were primarily driven by market opportunity, compared to 53.5% in 2017 and 61.2% in 2016. On the other hand, 47.6% of early stage entrepreneurs remain driven by necessity and their number increased compared to 42.7% in 2017 and 31.3% in 2016, i.e., those who started their business due to the absence of other work alternatives, which is a much higher rate than the global average of 23.0%. This continuous increase in necessity-driven entrepreneurship is an indication that the job market has not recovered yet.
In terms of sectoral distribution, most early-stage entrepreneurs are concentrated in three sectors: wholesale and retail distribution (61.5%), manufacturing (12.8%), and agriculture (8.3%); collectively representing 82.6% of all early-stage entrepreneurs in Egypt – an increase from 74.4% in the previous year. These sectors are typically attractive for necessity entrepreneurs, running informal micro/small enterprises that are not capital or knowledge intensive, and have limited or no aspirations for growth or job creation. It is noticeable that the share of knowledge-intensive industries, such as ICT, finance or professional services is very limited among new startups.
Job creation projections and growth orientation are divergent. On the one hand, 58.5% of Egyptian early-stage entrepreneurs do not expect to add any new jobs to their business within 5 years; indicating a large percentage of self-employment or low-growth businesses, which is typical in the case of necessity-driven informal micro enterprises. On the other hand, 19.3% of early stage entrepreneurs expect to grow their business by 6 or more jobs within 5 years; reflecting high growth aspirations among one fifth of the early stage entrepreneurs.
Despite the economic challenges in 2016, there seems to be a positive trend in entrepreneurship. More entrepreneurs are launching their startups, positive societal perception of entrepreneurship is gaining ground, and there’s a strong recognition for market opportunities. Coupled with serious investment in supporting organizations and the broader ecosystem, these trends could be the real foundation for growing the sector.
GEM Egypt National Report 18/19 EXECUTIVE SUMMARY 11

GEM Egypt National Report 18/19 EXECUTIVE SUMMARY
Entrepreneurship Ecosystem in Egypt
Overall, Egypt’s entrepreneurship ecosystem ranks low in most indicators compared to GEM global averages; however, there has still been a positive improvement trend across the past years. Most if not all measures witness a noticeable improvement between 2015 and 2018 such as entrepreneurial finance increasing from 3.5 to 4.4); government policies support and relevance (increasing from 3.3 to 4.3); government entrepreneurship programs (increasing from 3.1 to 4), entrepreneurship education at school stage (increasing from 1.6 to 2.3); entrepreneurship education at post-school stage (increasing from 3.1 to 3.7); internal market burdens/entry regulations (increasing from 3.8 to 4.4); and cultural and social norms (increasing from 3.8 to 4.6). These noticeable changes highlight the great potential in Egypt’s entrepreneurial ecosystem and an ensured substantial growth in the coming years.
The National Entrepreneurship Context Index (NECI), a composite index being introduced for the first time this year, evaluates the entrepreneurship environment in any given economy to determine the overall strength of the environment. It particularly assesses the following 12 entrepreneurship frameworks conditions: financing, government policies, taxes and bureaucracy, government programs, school-level entrepreneurship education and training, postschool entrepreneurship education and training, research and development transfer, access to commercial and professional infrastructure, internal market dynamics, internal market burdens, access to physical and services infrastructure, and cultural and social norms. Through that, it aims to guide practitioners /stakeholders and inform policy making. Egypt has a moderate ranking for each of the 12 indicators, receiving an overall score of 4.7 points and a ranking of 34 out of 54 participating GEM economies.
Accordingly, Egypt’s entrepreneurship ecosystem is considered above average in finance (with a score of 4.4 which is above the global average of 4.3 and low-income economies average of 4.2), physical infrastructure (with a score of 6.5 which is above the global average of 6.3 and low-income economies average of 6.2), and internal market burdens/entry regulations (with a score of 4.4 which is above the global average of 4.2 and low-income economies average of 4.1). In contrast, Egypt’s entrepreneurship ecosystem is considerably weak in entrepreneurship education at school stage (with a score of 2.3 which is lower than the global average of 3.2 and low-income economies average of 30), and entrepreneurship education at post-school stage (with a score of 3.7 which is lower than the global average of 4.8 and low-income economies average of 4.7).
Egypt’s gap in ratings in the following indicators are better than the aforementioned yet still need improvement to meet the global average. Government policies in taxes and bureaucracy (with a score of 3.5 which is lower than the global average of 3.9 and low-income economies average of 3.8), government entrepreneurship programs (with a score of 4.0 which is lower than the global average of 4.5 and low-income economies average of 4.4), research and development (with a score of 3.5 which is lower than the global average of 4 and low-income economies average of 3.8), commercial and legal infrastructure (with a score of 4.5 which is lower than the global average of 4.9 and low-income economies average of 4.8), and cultural and social norms (with a score of 4.6 which is lower than the global low-income economies averages of 4.8).
Finally, Egypt’s rating in government policies in support and relevance with a score of 4.3 meets the global average and is better than the low-income economies average of 4.2, and rating in internal market dynamics meets the low-income economies average of 5.1 and is slightly less than the global average of 5.2.
12

GEM Egypt National Report 18/19 Executive SummaryGEM Egypt National Report 18/19 EXECUTIVE SUMMARY
Recommendations for Policy and Practice
Over the past years, entrepreneurship has gradually emerged as an important part in the country’s 2030 development agenda. The growing entrepreneurship potential is reflected in the continuum of the positive momentum in areas such as perception of opportunity, awareness among the different stakeholders, and governmental support through new programs and policy reforms. As a result, many of the entrepreneurial indicators for Egypt have been gradually improving. That being said, a lot of work remains to be done to build on this momentum.
Based on the findings of this report, we group our recommendations for policy and practice under the following major themes: (i) increasing the financial support for entrepreneurs; (ii) supporting entrepreneurship culture and innovations; (iii) supporting entrepreneurial education; (iv) strengthening entrepreneurship policies and programs; (v) reforming the law in related aspects to entrepreneurship; (vi) encouraging female entrepreneurship; and (vii) enhancing the availability of market data.
13

GEM Egypt National Report 18/1914

INTRODUCTION

GEM Egypt National Report 18/19 INTRODUCTION
ABOUT GEM This year marks 20 years since the inaugural Global Entrepreneurship Monitor (GEM) survey of entrepreneurship was conducted in 10 developed economies. Since then, GEM teams around the world have surveyed over 2.9 million adults in 112 economies. Entrepreneurship itself is no longer regarded as a little-known specialization, but as a key driver of economic growth. Academics, policy makers and the broader business sector have come to recognize the role played by small, medium, and micro enterprises in decreasing unemployment, fighting poverty, and enhancing business agility and productivity. The desire to foster entrepreneurial activity and attitudes across the globe is underpinned by an increased appreciation of the critical role played by entrepreneurs — and the businesses they establish — in developing their societies.
GEM is considered the most authoritative and informative study on entrepreneurship today, based on the breadth of both its quantitative and qualitative data. Covered in this report are the results of GEM’s 2018 survey of over 164 thousand adults in 49 economies. In 2018, 49 economies participated in the GEM study, comprising approximately 70% of the world’s population and 90% of the world’s total GDP. GEM’s research examines data on rates and types of entrepreneurship at multiple phases of the process (from potential entrepreneur right through to established business owner), as well as the profiles of entrepreneurs (including demographics, motivations and ambitions), and their characteristics as business owners (such as innovativeness and industry participation). The study also looks at the broader entrepreneurship climate, measuring societal attitudes, self-perception, and the social safety net.
The aim, in short, is to understand which factors support a robust environment for entrepreneurship to thrive. Identifying what makes individual entrepreneurs think and perform opens up opportunities to build the entrepreneurial pipeline, moving from aspiring entrepreneurs, to intentional entrepreneurs, to entrepreneurs who actually manage to start a growing, established business.
These results are highlighted in the GEM report every year, with global trends identified, and the report is then launched at the GEM annual meeting, which takes place in a different global sponsor location every year. Research teams in every GEM economy issue national reports, which provide a more detailed examination of entrepreneurship in their particular economies. These reports illustrate changes taking place year to year, and use local knowledge to contextualize the results, analyzing the conditions and initiatives influencing regional entrepreneurial activity. In the last 20 years, regional reports have examined entrepreneurship in Africa, the Middle East, Southeast Asia, Latin America, the Caribbean and Europe.
GEM has also recently partnered with the United Nations Development Program and the World Economic Forum to produce several regional and thematic reports on entrepreneurship. All global, national and special topic reports are available for download from the GEM website at www.gemconsortium.org.
GEM’S APPROACH AND IMPACTGEM reports are a primary source of data, generated through an Adult Population Survey of at least 2,000 randomly selected adults (18-64 years of age) in every economy examined. National teams also collect expert opinions about different aspects of the broader entrepreneurship environment through a National Expert Survey (NES).
The Adult Population Survey captures information about both formal and informal activities. This is important because entrepreneurship studies that look only at registered businesses will capture only a fraction of the entrepreneurial activity actually taking place in many economies, especially in developing countries. GEM reports apply a rigorous methodology, followed by all regional teams and then supervised and processed by a central data team. This enables us to make cross-national comparisons, but also to be confident that the data we present reflects the reality on the ground, to the greatest degree possible.
GEM seeks to track societal attitudes and cross-cutting themes that particularly impact the growth of a highly entrepreneurial environment. These include women’s entrepreneurship, high-growth entrepreneurship, education and training for entrepreneurs, promoting entrepreneurship in the workplace, social entrepreneurship, youth and senior entrepreneurship, and policy.
16

Data and analysis provided by the GEM report is intended to benefit anyone with an interest in entrepreneurship, including business owners and entrepreneurs themselves, but it is particularly useful to researchers and policymakers. Researchers around the world have produced over 650 peer-reviewed research publications using GEM data, often combined with data from the World Economic Forum, the World Bank, the Heritage Foundation, Transparency International and many other sources. GEM representatives have presented research findings at the United Nations, the World Bank, the OECD, the U.S. State Department, the African Union, the Ibero-American Association, the International Development Research Center, and at many national, regional, and global events. For educators, GEM serves as an informative resource to teach university students about entrepreneurship in other countries.
GEM results are also highly publicized in the media, in global news publications including the Wall Street Journal, the Economist, the Financial Times, Business Week, Fortune, Forbes, and Entrepreneur. At least as important as this is GEM’s extensive reach into local, regional and national news outlets, which has resulted in a broad dissemination of GEM discoveries, and influences how the public — particularly practitioners and policy makers — understand entrepreneurship and address the issues surrounding it.
GEM IN EGYPT GEM provides an annual assessment of entrepreneurial activity, aspirations and attitudes across countries at different levels of economic development. It examines the factors that contribute to an entrepreneurial climate as well as the links between entrepreneurship and economic growth. Each year, teams of researchers from participating countries in the GEM cycle conduct independent investigations of domestic entrepreneurship, using the same methods to ensure quality and comparability of data. This is to help in studying the complex relationships between new venture creation, economic growth, culture, government policies and national propensity.
Egypt participates in GEM cycles to monitor its entrepreneurial performance, along with many other countries. This 2018-19 report is the seventh report covering Egypt. 2017-18, 2016-17 and 2015-16 reports were developed by a team of researchers from the American University in Cairo (AUC) led by Dr. Ayman Ismail. Previous reports for 2008, 2010, and 2012 were developed by Dr. Hala Hattab from the British University in Cairo.
The 2018-19 GEM Egypt report is a valuable resource for guiding policies and programs aimed at improving conditions for entrepreneurs, whether they are risk-taking innovators looking to start a business, or micro-entrepreneurs trying to support their families.
In this report, we compare Global Entrepreneurship Monitor (GEM) measures of entrepreneurial attitudes, activities and aspirations in Egypt with other GEM economies in 2018-19 based on our analysis of the Adult Population Survey (APS), a survey of 2,542 Egyptian adults. We track entrepreneurial attitudes, activities and demographics in Egypt over three cycles of GEM participation (2015-16, 2016-17 and 2017-18), and also compare Egypt to high-income, middle-income, and low-income countries.
We analyze the state of Egypt’s entrepreneurial ecosystem, using data from the National Expert Survey (NES), a survey of 50 entrepreneurship experts in nine key areas. An entrepreneurship ecosystem is the framework, or the conditions, within which entrepreneurial activities take place, and is therefore absolutely crucial to supporting and encouraging entrepreneurship at large. We benchmark Egypt’s entrepreneurship ecosystem against that of other participating GEM countries, and also examine changes in Egypt from 2015, 2016 and 2017 results to better understand how the ecosystem has changed and progressed over this period.
In this year’s report, GEM also introduces the National Entrepreneurship Context Index (NECI), a new index based on GEM’s National Expert Survey (NES). This represents a composite measure of the entrepreneurial ecosystem, based on 12 framework conditions. The aim is to quantify the contextual data as much as possible, so that policy makers and practitioners can benchmark results against peer economies and identify areas to address, as they seek to enhance an economy’s entrepreneurial impact and potential.
SCOPE OF THIS REPORT
GEM Egypt National Report 18/19 INTRODUCTION 17

GEM Egypt National Report 18/1918

METHODOLOGY

GEM Egypt National Report 18/19 METHODOLOGY
GEM CONCEPTUAL FRAMEWORK
GEM’s conceptual framework depicts the multifaceted features of entrepreneurship, showing the constant interplay between the proactive, innovative and risk responsible behavior of individuals and the environment they operate in. Understanding and conveying the interdependency of entrepreneurship and economic development has always been an important part of what the GEM survey seeks to do, in order to:
• Uncover factors that encourage or hinder entrepreneurial activity, especially related to societal values, personal attributes and the entrepreneurship ecosystem. • Provide a platform to assess to what extent entrepreneurial activity influences economic growth within individual economies. • Uncover policy implications, to enhance entrepreneurial capacity in an economy.
Figure 1: The GEM Framework
Source: GEM Global Report 2018-19
The social, cultural, political and economic context can essentially be broken down into National Framework Conditions and Entrepreneurial Framework Conditions. National Framework Conditions identify three kinds of economic development (factor-driven, efficiency-driven and innovation-driven) through which society can advance. Entrepreneurial Framework Conditions could be said to influence entrepreneurial activity more directly, and range from entrepreneurial finance to government policy, government entrepreneurship programs, entrepreneurship education, research and development (R&D) transfer, commercial and legal infrastructure, internal market dynamics and entry regulation, physical infrastructure, and social and cultural norms.
Social, Cultural,Political and
Economic Context
NationalFrameworkCondition
EntrepreneurialFrameworkConditions
Basic RequirementsEfficiency Enhancers
Innovation and Business Sophistication
Social Values AboutEntrepreneurship
Individual Attributes(Psychological,
Demographic, Motivation)
Outcome(Socio-economic development)
Entrepreneurial Output(New Jobs, New Value Added)
Entrepreneurial Activity
By PhasesNascent, New, Established,
Discontinuation
By ImpactHigh Growth, Innovation,
Internationalization
By TypeTEA,SEA,EEA
20

GEM Egypt National Report 18/19
Societal values about entrepreneurship include whether society regards entrepreneurship as a good career choice, whether entrepreneurs have high societal status and the extent to which entrepreneurship is positively represented in the media.
Individual attributes include demographic characteristics (gender, age, etc.), self-perception (perceived capabilities, perceived opportunities, fear of failure) and motives for starting a business (i.e., necessity versus opportunity).
Entrepreneurial activity encompasses multiple phases of the business process (nascent, new business, established business, discontinuation), potential impact ( job creation, innovation, internationalization), and the type of activity (Early-Stage Entrepreneurial Activity (TEA), Social Entrepreneurial Activity (SEA) or Employee Entrepreneurial Activity (EEA). Operational definitions of the business phases and entrepreneurship characteristics are represented in Figure 2.
Figure 2: The Entrepreneurial Process and GEM Operational Definitions
GEM ENTREPRENEURSHIP INDICATOR
Total Early StageEntrepreneurial Activity
(TEA)
NascentEntrepreneur:
Involved in Setting Up a Business
Owner-Managar of a New Business
(Up to 3.5 years)
Firm Birth
PotentialEntrepreneur:
Opportunities, Knowledgeand Skills
Conception
Owner-Managar ofan Established
Business(Up to 3.5 years old)
Persistence
Individual AttributesGender
AgeMotivation
IndustrySector
ImpactBusiness Growth
InnovationInternationalization
Early Stage Entrepreneurship Profile
Discontinuation ofBusiness
Source: GEM Global Report 2018-19
METHODOLOGY 21

GEM Egypt National Report 18/19
GEM’S multi-phase measures of entrepreneurship
-Potential Entrepreneurs: Those that see opportunities in their environments, have the capabilities to start businesses and are undeterred by fear of failure.-Intentional Entrepreneurs: Those who intend to start a business in the future (in the next three years). -Nascent Entrepreneurs: Those who have taken steps to start a new business, but have not yet paid salaries or wages for more than three months. -New Entrepreneurs: Those who are running new businesses that have been in operation from three months to 3.5 years. -Early-stage Entrepreneurs: The sum of nascent and new entrepreneurs. This is measured by analyzing Early-stage Entrepreneurial Activity (TEA), the primary indicator used by GEM. -Established Business Owners: Those who are running a business operating for more than 42 months. -Discontinued Entrepreneurs: Those who, for whatever reason, have ceased to run their business in the past year.
GEM’s focus at the individual level allows for a more comprehensive and nuanced analysis of business activity than measuring only formally registered businesses. Capturing both formal and informal activity is important because, in many societies, the majority of entrepreneurs operate in the informal sphere. A focus on the behavior of individuals, rather than analyzing business data, also offers greater insights into the profiles of the entrepreneurs themselves, including demographics, their motivations for starting their ventures and their ambitions for their businesses. GEM also assesses broader societal attitudes towards entrepreneurship, which has a bearing on the extent to which people are engaged in or willing to participate in entrepreneurial activity, and the level of societal support for their efforts. All this information is then collected in the GEM database, allowing analysts to explore the individual or business characteristics most likely to determine success, as well as the causes and consequences of new business creation.
GEM DATA
All participating GEM countries use similar research design, survey questionnaires and data collection methodology, to ensure the consistency and comparability of data. This year’s GEM report is based on two main surveys: The Adult Population Survey (APS) and the National Expert Survey (NES).
Adult Population SurveyThe Adult Population Survey (APS) was conducted on a randomly-selected representative sample of 2,542 adults in the 18-64 age range from all geographic regions in Egypt. Data collection was conducted by PHI Knowledge, a market information and research firm, between June and July 2018 through phone interviews.
National Expert Survey The National Expert Survey (NES) covers 12 key areas representing the Entrepreneurial Framework Conditions and was conducted with 50 key experts selected on the basis of their knowledge and experience in these areas.
COUNTRIES PARTICIPATING IN THE GEM PROJECT
GEM has been measuring entrepreneurship in over 100 economies for the past 20 years, covering all geographic regions and all economic levels. During this time, it has gained widespread recognition as the most informative and authoritative longitudinal study of entrepreneurship in the world. In 2018-19, 49 economies participated in the GEM study, comprising approximately 40% of the world’s population and 90% of the world’s total GDP. In Table 1, we list the participating countries in the 2018-19 GEM cycle, based on geographic region and income level.
METHODOLOGY22

GEM Egypt National Report 18/19
LOWINCOME
MIDDLEINCOME
HIGHINCOME
EAST AND SOUTH ASIA
IndiaIndonesia
JapanKorea Republic
Taiwan
ChinaThailand
EUROPE AND NORTH AMERICA
Bulgaria Kazakhstan*
Russian FederationTurkey
LATIN AMERICA & CARIBBEAN
ArgentinaChile
PanamaPuerto Rico
Uruguay
BrazilColombia
Dominican Republic*Guatemala
Mexico*Peru
MIDDLE EAST AND AFRICA
IsraelQatar
Saudi ArabiaUnited Arab Emirates
IranLebanon
AngolaEgypt
MadagascarMorocco
Mozambique*Sudan
Source: GEM Global Report 2018-19 *included in National Entrepreneurship Context Index (NECI) only
Global Regions and Income LevelThe 49 economies profiled in this report are grouped into four regions, as shown in Figure 3. The East and South Asia region contains economies classified as being in East Asia and Pacific or South Asia by the World Economic Forum (WEF), and classified as Southern, Eastern or Southeastern Asia by the United Nations (UN).
The Europe and North America region includes economies classified as European by WEF and the UN. Following WEF, the report moved the United States and Canada into this region, to include them in a larger group of mostly high-income countries with which they have had close historical associations. Also following WEF, the report grouped Turkey and Cyprus in Europe, but acknowledges that the UN classifies them differently, placing them in Western Asia.
The Latin America and Caribbean region is classified as such by both the UN and WEF. The Middle East and Africa region has countries which WEF classifies as being in the Middle East and North Africa, but which the UN classifies as being in North Africa, Western Asia or Southern Asia. Angola is classified as being in sub-Saharan Africa by both, and the UN also places Madagascar in sub-Saharan Africa.
The economies are also identified by income level, following WEF. The low-income group contains both those classified by WEF as low-income and lower-middle. The middle-income group has those which WEF places as upper-middle. The largest group of GEM economies by income level are those WEF categorizes as high-income.
AustriaCanadaCroatiaCyprusFrance
GermanyGreeceIreland
ItalyLatvia*
LuxembourgNetherlands
PolandSlovak Republic
SloveniaSpain
SwedenSwitzerland
United KingdomUnited States
METHODOLOGY 23

SECTION 1PERSPECTIVES ON
ENTREPRENEURSHIPIN EGYPT
GEM Egypt National Report 18/1924

SECTION 1PERSPECTIVES ON
ENTREPRENEURSHIPIN EGYPT

GEM Egypt National Report 18/19 PERSPECTIVES ON ENTREPRENEURSHIP IN EGYPT
SOCIETAL VALUES ABOUT ENTREPRENEURSHIP Societal values and attitudes are indicators of how entrepreneurship is perceived in a country. Among the key factors that can influence a society’s views of entrepreneurship are its culture, history, policy and business environment. These can, in turn, affect entrepreneurial ambitions and the extent to which startup companies are supported. GEM assesses the extent to which people think entrepreneurship is a good career choice, whether they feel entrepreneurs are perceived as having high status, and if there are positive representations of entrepreneurship in the media. Entrepreneurship as a desirable career choice: Entrepreneurship is perceived as a good career choice by 74% of Egyptians. While this marks a slight decline from last year’s figure of 75.9%, it remains consistent and very high. The positive perception of entrepreneurship has remained consistently high over the last 5 years, with slight fluctuations between 73- 83%. This rate is high compared to the global average of 62.3%, with Egypt ranking 10th among 49 GEM countries. At the regional level, entrepreneurship is generally regarded as a good career choice, and a notably higher proportion of the population in both Egypt and the MENA region as a whole see successful entrepreneurs as having high social status and respect than in other countries of a similar income bracket outside the region. In Egypt, this indicates the growing appeal of entrepreneurship as a career choice and the degree to which it is now seen as a desirable alternative to working in the government or corporate sectors. It reflects the continued perception of entrepreneurship as a viable means of gaining economic independence, in the face of fewer corporate jobs, more salary constraints, and high levels of unemployment.High status associated with successful entrepreneurship: Successful entrepreneurs are perceived as having high social status by 82.6% of Egyptians. This marks a slight increase on last year, continuing a pattern of minor fluctuations over the last 5 years between 79-87%. Overall, it shows a consistent trend of successful entrepreneurs in Egypt, who enjoy a markedly high status. Egypt ranks 5th out of 47 GEM countries, placing us well above the global average of 70%. This means that we’re maintaining our high ranking among the countries where entrepreneurs are well regarded, which is reflective of social attitudes towards “successful” entrepreneurs, who are increasingly seen as examples to emulate, especially by young Egyptians. Media attention to entrepreneurship: Media attention to entrepreneurship is seen as favorable by 68.1% of Egyptians, similar to last year’s figure of
68.7%. The figure is higher than the global average of 61.0%, as is the ranking (14th out of 47). It shows a continued steady trend of increased media focus on entrepreneurship, with 58.5% of respondents seeing media attention to entrepreneurship as favorable in 2015 and 62.1% in 2016. This positive image of entrepreneurship is both the result of and a contributor to cultural change, and also reflects state efforts to promote it as a discipline. This trend is also a result of a strong and positive coverage of successful entrepreneurs on social media, especially with the emergence of several local and regional digital news outlets focusing on entrepreneurs and their news and success stories, e.g., Wamda, Magnitt, Startup Scene, Entrepreneur.com and MENAbytes. Stories from these outlets highlight new startup launches, investments and expansion, and are highly shared on social media. Overall: In general, perceptions of entrepreneurship in Egypt are very positive and rank higher than the global average, with continued positive trends from previous years. This is particularly evident when it comes to the perception of the social status of entrepreneurs, which remains exceptionally high (82.6%). These findings suggest that Egyptian societal values and attitudes increasingly support entrepreneurship as a positive and desirable activity.
There is a growing culture in Egypt of people seeing entrepreneurship as a good career choice. Increasingly, Egyptians no longer aspire to holding government jobs. Fewer jobs are available in the traditional corporate space, and salaries are less competitive in relation to the cost of living. At the same time, a visible movement of wealth creation by private entrepreneurs – in Egypt and globally – is pushing many more people to see entrepreneurship as a viable career choice, and one that could yield substantial dividends.
The diverse backgrounds of the entrepreneurs held up as role models means that people of very different backgrounds now also aspire to being entrepreneurs. Some want to emulate global tech entrepreneurs who quickly make money with applications that solve endemic problems; others look at local examples of business tycoons, whose innovation comes from recognizing and seizing opportunities. Their example is catalyzing a change among early, mid and late-career professionals, in a variety of sectors. Not only are there now positive examples of both educated young people and mid-career professionals making quick success stories through an entrepreneurial initiative, but the new image of the entrepreneur does much to dispel previous negative stereotypes of businessmen, which were particularly prevalent from the 1980s onwards
26

Table 1: Societal Values about Entrepreneurship in Egypt and GEM Countries (2018)
MIDDLE EAST& NORTH
AFRICA (%)
HIGHINCOME
COUNTRIES (%)
MIDDLEINCOME
COUNTRIES (%)
LOW NCOME
COUNTRIES (%)EGYPT
(%)GLOBAL
AVERAGE (%)
ENTREPRENEURSHIP AS A DESIRABLE CAREER CHOICE
HIGH STATUS OF SUCCESSFUL ENTREPRENEURS
POSITIVE MEDIA ATTENTIONTO ENTREPRENEURSHIP
IT IS EASY TO START A BUSINESS
74.0
82.6
68.1
61.0
62.0
70.0
61.0
61.0
69.0
78.0
63.0
44.0
62.0
69.0
60.6
39.0
62.0
69.0
60.5
39.8
63.0
70.0
60.6
40.9
Source: The Authors; GEM Global Report 2018-19
Table 2: Societal Values about Entrepreneurship in Egypt (2015-2018)
Sources: The Authors; GEM Global Report 2018-19; GEM Egypt Reports 2015-16, 2016-17, 2017-18
2018 2017 20152016
Egypt Rank /47
Egypt%
Global Average
%Egypt
Rank /54Egypt
%Global
Average %
Egypt Rank /65
Egypt%
Global Average
%Egypt
Rank /60Egypt
%Global
Average %
10
5
14/43
ENTREPRENEURSHIPAS A DESIRABLECAREER CHOICE
HIGH STATUS OFSUCCESSFULENTREPRENEURS
POSITIVE MEDIA ATTENTION TO ENTREPRENEURSHIP
74.0
82.6
68.1
62.0
70.0
61.0
7
3
17
75.9
82.0
68.7
61.6
68.4
60.5
4
2
26
83.4
87.1
62.1
62.5
68.5
61.3
10
11
34
73.6
79.6
58.5
65.8
71.3
60.0
INDIVIDUAL SELF-PERCEPTION ABOUT ENTREPRENEURSHIP
Entrepreneurship as a concept may be held in high social regard, with societal attitudes and behavior being an indicator of this, but it is individual perceptions that are more likely to determine whether one will actually consider starting — or indeed start — a business. GEM assesses these individual perceptions, measuring the degree to which people see opportunities around them, whether those who see opportunities are constrained by the fear of failure, whether they believe they are actually capable of starting a business themselves, and whether they intend to do so within the next three years.
Perceived opportunities: Opportunity-recognition is a key driver of decisions taken by individuals to start new businesses, and is therefore at the very heart of the entrepreneurial process. In Egypt, 39.3% of the non-entrepreneurially active population saw good opportunities to start new ventures in 2018 (ranking 30th out of 49). This continues a downward trend from 46.6% in 2015, suggesting that perceived opportunities to start a new business have declined in Egypt since that time. This is almost certainly the continued impact of economic challenges, including the devaluation of the currency and the reduction of subsidies which resulted in significant inflation, as well as the increase of interest rates and limited access to finance. While generally regarded as necessary for the economy, these measures have contributed to a feeling of uncertainty which may well be reflected in the perception of opportunities. It is, however, worth bearing in mind that this data was taken in the summer of 2018, where these macroeconomic effects were still very visible. Since that time, inflation has declined significantly, and the Central Bank has cut interest rates several times. As the economy continues its recovery, we expect to see an increase in the perceived opportunity rate as well.
RANK/47
10
5
14
7/43
GEM Egypt National Report 18/19 PERSPECTIVES ON ENTREPRENEURSHIP IN EGYPT 27

Perceived capabilities: The perception among Egyptians of their own capability to open new businesses in 2018 was 43.0%, which remains within the range seen since 2015 (between 41.5% and 46.6%). Egypt is a little below the global average of 49.2%, and we are ranked 36th. There is a wider gap this year than there was last year between Egypt’s rate and the global average (this year, our rate is 43.0% and the global average is 49.2%, compared to last year’s rates of 46.6% and 48.8% respectively). This could, at least in part, be attributed to the continued impact of Egypt’s economic measures. While Egyptians perceive economic opportunities, the confidence they exhibit in launching their own new businesses remains relatively low, and this is likely to be one of the main reasons why fewer people are able to take the step from seeing opportunities around them to starting their own businesses. Fear of failure: When it comes to measuring the fear of failure among the non-entrepreneurially active population, lower values are better (denoting less fear). In 2018, the fear of failure among remained low at 28.2% compared to the global average of 36.2%, giving us a ranking of 40. Egypt also has a low fear of failure compared to other MENA economies. There is slight decline from previous years’ range of 30.2% - 33.2%, which was always below global average. When asked whether “fear of failure prevent you from starting a business?”, Egyptians have consistently had relatively low fear of failure figures, indicating that fear of failure is not a significant barrier to entrepreneurship in Egypt. We have observed before that in general, Egypt and other low-income economies display less fear of failure than high and middle-income economies. This could indicate a higher acceptance of risk as a factor in business, employment, and everyday life, and be reflective of the fact that entrepreneurship is often undertaken here as a matter of necessity.
Entrepreneurial intention: 60.2% of the non-entrepreneurially active Egyptians surveyed expressed their interest or intention to start a business within the next three years. This is a very high score, and puts Egypt third among all GEM countries for this particular metric, with a significantly higher proportion of the population intending to start their own businesses here than in other MENA economies. For the third successive year, our score is over twice the global average. The scores of the last three years represent a leap from 2015’s score of 39.5%, which was itself higher than the global average (24.0%) but not by such a significant margin. This may well be reflective of the difficult economic environment Egyptians have been operating in since this time, and the figures are likely to show entrepreneurship as primarily a necessity rather than an opportunity (especially given the decline in perceived opportunities above). However, it also speaks to something in Egypt’s entrepreneurial culture and mindset: it is very common to discuss starting a business, even if these intentions do not eventually translate into action. Overall: Perception about entrepreneurship continues to be impacted by the economic challenges that Egypt has been facing, including currency devaluation, reduction of subsidies, high inflation and interest rates. This is particularly apparent in the decline in perceived opportunities for starting a new venture and the decline in perception of capabilities to open new businesses. However, it is worth remembering that these declines are slight and could well rebound quickly now the economy is starting to recover. Egypt’s low fear of failure rate and high level of entrepreneurial intention are striking compared to global averages, and speak to a willingness to consider undertaking necessity-driven entrepreneurial ventures.
Table 3: Individual Self-Perceptions of Entrepreneurship in Egypt and GEM Countries (2018)
MIDDLE EAST& NORTH
AFRICA (%)
HIGHINCOME
COUNTRIES (%)
MIDDLEINCOME
COUNTRIES (%)
LOW INCOME
COUNTRIES (%)EGYPT
(%)GLOBAL
AVERAGE (%)
PERCEIVEDOPPORTUNITIES
PERCEIVEDCAPABILITIES
FEAR OFFAILURE
ENTREPRENEURIALINTENTION
39.3
43.0
28.2
60.2
45.0
49.0
36.2
26.8
51.0
57.0
36.4
26.8
46.0
49.0
36.6
27.0
44.0
49.0
36.9
24.2
46.0
50.0
36.9
27.3
Sources: The Authors; GEM Global Report 2018-19
RANK/49
30
36
40
3
GEM Egypt National Report 18/19 PERSPECTIVES ON ENTREPRENEURSHIP IN EGYPT28

Table 4: Individual Self-Perceptions of Entrepreneurshipin Egypt (2015-2018)
Sources: The Authors; GEM Global Report 2018-19; GEM Egypt Reports 2015-16, 2016-17, 2017-18
30
36
40
3
PERCEIVEDOPPORTUNITIES
PERCEIVED CAPABILITIES
FEAR OFFAILURE
ENTREPRENEURIAL INTENTION
39.3
43.0
28.2
60.2
45.6
49.2
36.2
27.0
29
31
41
2
43.5
46.6
30.2
55.5
42.9
48.8
41.3
24.9
14
38
52
1
53.5
46.2
33.2
65.5
42.2
50.2
40.1
25.6
27
46
46
12
46.6
41.5
32.6
39.5
42.0
49.8
39.0
24.0
PHASES AND TYPES OF ENTREPRENEURIAL ACTIVITYGEM visualizes entrepreneurship as a process in which individuals become increasingly engaged in entrepreneurial activity. This would begin with individuals having the intention to start a new business, and then continue along a path of actually starting the business (the first 3 months), managing the new business (the first 3 months to 3.5 years), and becoming the owner of an established business (any business that is older than 3.5 years). The process could end with the discontinuation of the business.
Total Early StageEntrepreneurial Activity
(TEA)
NascentEntrepreneur:
Involved in Setting Up a Business
Owner-Managar of a New Business
(Up to 3.5 years)
Firm Birth
PotentialEntrepreneur:
Opportunities, Knowledgeand Skills
Conception
Owner-Managar ofan Established
Business(more than
3.5 years old)
Persistence
Individual AttributesGender
AgeMotivation
(opportunity, necessity)
IndustrySector
ImpactBusiness Growth
InnovationInternationalization
Early Stage Entrepreneurship Profile
Discontinuation ofBusiness
Source: GEM Global Report, 2018-19Definitions: GEM defines the different phases of entrepreneurial Activities as follows:Nascent Entrepreneurship Rate: Percentage of individuals aged 18–64 who are currently actively involved in setting up a business they own/co-own, which hasn’t paid salaries, wages, or any other form of remuneration to its for three months. New Business Ownership Rate: Percentage of individuals aged 18–64 who are currently owners/managers of new businesses that have paid salaries, wages or other form of remuneration to its owners after three months and up to 3.5 years.Early-Stage Entrepreneurial Activity (TEA): Percentage of individuals aged 18–64 who are either nascent entrepreneurs or owners/managers of a new business.Established Business Ownership Rate: Percentage of individuals aged 18–64 who are currently owners/managers of established businesses that have paid salaries, wages or other forms of remuneration to its owners for more than 42 months.Business Discontinuation Rate: Percentage of individuals aged 18– 64 who have discontinued a business in the past 12 months, either by selling, shutting down, or suspending an owner/management relationship with the business. It’s worth noting that this is not a measure of business failure.
2018 2017 20152016
Egypt Rank /49
Egypt%
Global Average
%Egypt
Rank /54Egypt
%Global
Average %
Egypt Rank /65
Egypt%
Global Average
%Egypt
Rank /60Egypt
%Global
Average %
GEM Egypt National Report 18/19 PERSPECTIVES ON ENTREPRENEURSHIP IN EGYPT 29

Early-stage entrepreneurial activity (TEA): TEA is the primary metric used by GEM to measure and compare entrepreneurial activities among countries. It is the amalgamation of the nascent entrepreneurship rate (the amount of people who have started businesses that are up to 3 months old) and the new business ownership rate (the amount of people who have started businesses that are between 3 months and 3.5 years old). In 2018, the TEA rate in Egypt was 9.8%, giving us a ranking of 28 out of 49 countries. This is lower than the global average of 12.6%. This figure indicates that around 9.8% of the adult population in Egypt (aged 18-64) are currently either actively setting up a new business or have started a business that is younger than 3.5 years. Globally, the highest TEA rates are seen in the MENA region and in low-income economies, while the lowest rates are seen in south and east Asia.Egypt’s TEA saw a substantial jump between 2015 and 2017, where it moved from 7.4% to 13.3%, indicating an overall growth in entrepreneurship in the country. This means that at its peak, 13.3% of the population was starting a business, which is a significant number, but we should remember that this rate includes the self-employed, solo entrepreneurs, business owners, micro-enterprise owners and all sorts of people within the informal economy. The sharp increase in the TEA rate is likely to have been driven by necessity entrepreneurs — people who had difficulty finding work after the currency devaluation in late-2016, who then started their own initiatives as a matter of survival. As the economy stabilized and regained its growth momentum, this type of necessity entrepreneurship started to gradually decline, albeit still high. Hence, we attribute a portion of the decline in Egypt’s TEA, from 13.3% last year to 9.8% this year, as being the result of necessity-driven entrepreneurs exiting the self-employment space, having found other employment opportunities. Breaking down the TEA rate into its two components of nascent entrepreneurship and new business ownership supports the above pattern. Nascent entrepreneurship, indicating the percentage of individuals aged 18–64 who are currently actively involved in setting up a new business they own/co-own, increased dramatically after 2015, moving from 4.0% up to 6.5% in 2017, before moving back to 4.0% this year. Egypt’s ranking among the GEM countries has likewise followed a similar pattern, moving from 46 in 2015 up to 25 in 2017, and then falling to 36 this year. The global average for nascent entrepreneurship, meanwhile, has seen a slight decline during this period, moving from 7.9% in 2015 down to 6.8% this year. Egypt remains below the global average for nascent entrepreneurship
The growth pattern was even more striking in the new business ownership rate, which measures the percentage of entrepreneurs who own or manage a new business that is younger than 3.5 years. The rate soared from 3.4% in 2015 up to a range of 5.9% to 7.0% in 2016-2018. Egypt’s ranking in this area has skyrocketed from 2015, where we were ranked 37th out of 60 countries, to now, where we are ranked 17th out of 49. This is a striking increase. The global average for new business ownership has remained fairly steady since 2015, fluctuating between 5.4% and 6.1%. During 2016 and 2017, Egypt’s new business ownership rate was slightly higher than the global average, but it is now once again slightly below it. It is also slightly below the rate for low-income countries, and broadly equal to that of Europe and North America. It is worth noting that while the nascent entrepreneurship rate has effectively returned to the level it was at before economic measures (such as the currency devaluation) were taken, the new business entrepreneurship rate is markedly higher than it was in 2015. This supports the view that the sharp decline in Egypt’s TEA from 13.3% last year to 9.8% this year may have been primarily driven by necessity-driven entrepreneurs exiting the space, having engaged in nascent entrepreneurship activities for a relatively short period of time.Established business: In 2018, the percentage of Egyptian individuals aged 18–64 who are currently owners/managers of an established businesses (older than 3.5 years) was 4.5% (ranking 39th). While this figure remains lower than the global average of 8.4%, and the average of 8.7% for low-income countries, it represents a significant increase from Egypt’s 2015’s figure of 2.9%. The overall trend for established businesses follows that of the TEA rate, where the rate increased substantially between 2015 and 2017, and has since declined somewhat. Egypt’s business discontinuation rates have been wildly fluctuating over the past four years, within the range of 4.8% and 10.2%. Last year, we had the highest business discontinuation rate (10.2%) of all the countries surveyed. This year, Egypt’s business discontinuation rate was 7.6%, ranking is 8th out of 49 countries, which is an improvement from last year, but nevertheless remains one of the highest global rates. 2018 marks the first year since 2010 that business discontinuation rates started decreasing, which is a good break in the pattern. When we examine the reasons for discontinuation, businesses in Egypt are more likely to discontinue because of financing issues than the global average, and it is highly unlikely that their discontinuation is due to retirement or their exits planned in advance.
GEM Egypt National Report 18/19 PERSPECTIVES ON ENTREPRENEURSHIP IN EGYPT30

If we examine opportunities for “exit”, i.e., selling the business, we find that in 2015, Egypt had a score of 0% under opportunities to sell businesses. This then increased to 3.3% in 2017 and then decreased to 1.2% in 2018. The global average, on the other hand, has witnessed a steady increase of opportunities to sell, moving from 4.0% in 2015 to 6.1% in 2017, to 7.0% in 2018. Interestingly, Egypt’s global ranking has increased in this area: in 2017, we ranked 36 out of 54, while in 2018 we ranked 10 out of 49. This would indicate that while Egypt has fewer opportunities for businesses to be sold compared to the global average, our opportunities are gradually increasing. Exit opportunities are important for the economy as they indicate the ability to professionalize the business or to continue past the founders in the case of family-owned businesses.
Overall: Egypt’s TEA figures, which are the most important metric to focus on when measuring the entrepreneurial environment, underwent a significant increase between 2015 and 2017, from 7.4% to 13.3%. The rate has since declined to 9.8%, with the decline sharper in nascent entrepreneurial ventures (3 months old or less) than in new businesses aged between 3 months and 3.5 years. We attribute this overall pattern to a combination of the rise in positive entrepreneurial perceptions among Egyptians, a gradually improving support ecosystem and the increase in necessity-driven entrepreneurship due to the economic climate — the latter having then eased as the impact of the economic rebound started to be felt.
Table 5: Entrepreneurial Activity in Egypt and GEM Countries
MIDDLE EAST& NORTH
AFRICA (%)
HIGHINCOME
COUNTRIES (%)
MIDDLEINCOME
COUNTRIES (%)
LOW INCOME
COUNTRIES (%)EGYPT
(%)GLOBAL
AVERAGE (%)
POTENTIALENTREPRENEURS RATE
NASCENTENTREPRENEURSHIP RATE
NEW BUSINESSESRATE
TOTAL EARLY STAGE ENTREPRENEURIAL ACTIVITIES (TEA) RATE
60.2
4.0
5.8
9.8
7.6
26.8
6.8
6.1
12.6
5.0
26.8
6.7
6.2
12.6
5.0
27.0
6.5
5.8
12.0
4.6
24.2
6.3
6.0
12.1
4.6
Sources: The Authors; GEM Global Report 2018-19
27.3
6.7
6.2
12.6
5.0
RANK/49
3
36
17
28
8
GEM Egypt National Report 18/19 PERSPECTIVES ON ENTREPRENEURSHIP IN EGYPT 31
DISCONTINUEDBUSINESS RATE

Table 6: Entrepreneurial Activity in Egypt (2015-2018)
Sources: The Authors; GEM Global Report 2018-19; GEM Egypt Reports 2015-16, 2016-17, 2017-18
3
36
17
28
39
8
POTENTIAL ENTREPRENEURS RATE
NASCENT ENTREPRENEURSHIP RATE
NEW BUSINESSESRATE TOTAL EARLY STAGE ENTREPRENEUR-IAL ACTIVITIES (TEA) RATE
TOTAL EARLY STAGE ENTREPRENEURIAL ACTIVITIES (TEA) RATE
ESTABLISHED BUSINESS RATE
DISCONTINUED BUSINESS RATE
60.2
4.0
5.9
9.8
4.5
7.6
27
6.8
6.1
12.6
8.4
5.0
2
25
11
19
38
1
55.5
6.5
7
13.3
5.7
10.2
24.9
7
5.5
12.3
8.5
3.2
1
20
17
17
42
3
65.5
8.2
6.6
14.3
6.1
7.3
25.6
7.1
5.4
12.3
8
3
12
46
37
43
56
11
39.5
4
3.4
7.4
2.9
4.8
24.0
7.9
5.7
13.2
8
3
2018 2017 20152016
Egypt Rank /49
Egypt%
Global Average
%Egypt
Rank /54Egypt
%Global
Average %
Egypt Rank /65
Egypt%
Global Average
%Egypt
Rank /60Egypt
%Global
Average %
Table 7: Reasons for Business Discontinuation in Egypt and GEM Countries (2018)
1.2
42.4
21.8
4.9
1.4
0
17.5
3.5
7.3
7.0
31.0
14.0
10.4
3.8
4.0
18.5
4.8
6.8
10.0
33.5
17.7
6.8
2.7
2.2
15.4
4.0
7.5
7.0
27.8
11.0
11.4
4.5
4.7
19.7
5.2
8.7
3.0
40.3
17.3
9.7
2.8
2.8
16.4
3.4
5.3
Sources: The Authors; GEM Global Report 2018-19
11.0
30.7
22.4
7.0
2.4
2.4
16.5
5.1
2.4
OPPORTUNITY TO SELL
THE BUSINESS ISNOT PROFITABLE
PROBLEM GETTINGFINANCE
ANOTHER JOB OR BUSINESS OPPORTUNITY
EXIT PLANNEDIN ADVANCE
RETIREMENT
FAMILY OR BUSINESS REASONS
AN INCIDENT
BUREAUCRACY
MIDDLE EAST & NORTH AFRICA (%)
HIGH INCOME COUNTRIES (%)
MIDDLE INCOME COUNTRIES (%)
LOW INCOME COUNTRIES (%)
EGYPT(%)
GLOBALAVERAGE (%)
RANK/49
10
3
13
30
35
46
25
23
19
GEM Egypt National Report 18/19 PERSPECTIVES ON ENTREPRENEURSHIP IN EGYPT32

OPPORTUNITY TO SELL
THE BUSINESS ISNOT PROFITABLE
PROBLEM GETTINGFINANCE
ANOTHER JOB ORBUSINESS OPPORTUNITY
EXIT PLANNEDIN ADVANCE
RETIREMENT
FAMILY OR BUSINESS REASONS
AN INCIDENT
BUREAUCRACY
Table 8: Reasons for Business Discontinuation in Egypt (2015-2018)
Sources: The Authors; GEM Global Report 2018-19; GEM Egypt Reports 2015-16, 2016-17, 2017-18
10
3
13
30
35
46
25
23
19
1.2
42.4
21.8
4.9
1.4
0
17.5
3.5
7.3
7.0
31.0
14.0
10.4
3.8
4.0
18.5
4.8
6.8
36
11
19
35
40
41
43
21
17
3.3
49.2
15.5
6.3
1.4
0.8
12.6
3.8
7.3
6.1
32.4
13.5
10.3
4.3
3.1
18.6
3.5
8.4
55
10
30
44
48
47
25
33
22
0.3
47.7
11.7
7.6
1.3
0.9
20.5
2.4
6.7
6.4
35.7
12.0
10.6
4.0
3.8
18.0
3.0
6.1
50
13
8
39
31
38
57
15
27
0.0
43.0
24.0
8.8
3.5
1.0
10.3
5.2
4.3
4.0
33.5
13.2
11.0
3.8
3.4
20.3
3.2
7.1
2018 2017 20152016
Egypt Rank /49
Egypt%
Global Average
%Egypt
Rank /54Egypt
%Global
Average %
Egypt Rank /65
Egypt%
Global Average
%Egypt
Rank /60Egypt
%Global
Average %
GEM Egypt National Report 18/19 PERSPECTIVES ON ENTREPRENEURSHIP IN EGYPT 33

SECTION 2DEMOGRAPHIC
CHARACTERISTICSOF ENTREPRENEURS
GEM Egypt National Report 18/1934

SECTION 2DEMOGRAPHIC
CHARACTERISTICSOF ENTREPRENEURS

GEM is unique in its approach in primary data collection, where it focuses on individuals rather than firms. In doing so, it provides a rich demographic profile for entrepreneurs. Through this demographic analysis, GEM brings evidence about the power of women, the young and old, the effect of education and other demographics in contributing to the overall force of entrepreneurship around the world. GEM recognizes that not all types of entrepreneurs are equally represented in all places. A critical implication therefore centers on understanding the diversity, and also the gaps, in participation in entrepreneurship. In this section, we examine these rates across three key demographic characteristics: gender, age and education.
WOMEN AND GENDER DISTRIBUTION OF ENTREPRENEURSHIP ACTIVITIESIn Egypt, women’s participation in entrepreneurship is strikingly low. In 2018, only 26.3% of early-stage entrepreneurs and only 13.5% of established business owners were women. These figures are well below the global average of 42.0% and 37.5% respectively. They are also well below the average figures for high, middle- and low-income countries, as well as for the Middle East and North Africa region. The decrease of female participation from 26.3% early-stage entrepreneurs to 13.5% established business owners is also an indicator of the higher business discontinuous rate among female entrepreneurs, compared to male entrepreneurs. While women are less likely than men to engage in entrepreneurship, when they do, they are more likely to do so out of necessity. Looked at over a period of time, we can see that the rates of female early-stage and established business owners have remained fairly stable since 2015. The rate of female early-stage entrepreneurs has ranged between 25% and 29%, while the rate of female established business owners has ranged between 13% to 19%. This significant gender gap has remained consistent throughout this time period.
Table 9: Gender Distribution of Entrepreneurship Activities in Egypt and GEM Countries (2018)
42.0
58.0
37.5
62.5
43.7
56.3
36.7
63.3
41.0
59.0
37.0
63.0
41.6
58.4
36.3
63.7
42.3
57.7
37.3
62.7
EARLY-STAGE ENTREPRE-NEURSHIP
MIDDLE EAST & NORTH AFRICA (%)
HIGH INCOME COUNTRIES (%)
MIDDLE INCOME COUNTRIES (%)
LOW INCOME COUNTRIES (%)
EGYPT(%)
GLOBALAVERAGE (%)
Sources: The Authors; GEM Global Report 2018-19
ESTABLISHED BUSINESSES
Female
Male
Female
Male
26.3
73.7
13.5
86.5
GEM Egypt National Report 18/19
Table 10: Gender Distribution of Entrepreneurship Activities in Egypt (2015-2018)
29
71
19
81
26
74
15
85
2018(%) 2017(%) 2016(%)
Sources: The Authors; GEM Global Report 2018-19; GEM Egypt Reports 2015-16, 2016-17, 2017-18
25
75
17
83
2015(%)
ESTABLISHED BUSINESSES
Female
Male
Female
Male
26
74
13.5
87
DEMOGRAPHIC CHARACTERISTICS OF ENTREPRENEURS36
EARLY-STAGE ENTREPRE-NEURSHIP

YOUTH AND AGE DISTRIBUTION OF ENTREPRENEURSHIP ACTIVITIES
Globally, the most entrepreneurially active age groups are those aged 25-34 (TEA of 15.9%), followed by those aged 35-44 (13.9%). These are people in their early and mid-careers, who have perhaps acquired some experience, contacts and useful skill sets for starting a business, and who can balance youthful enthusiasm with concrete experience. They would also most likely be at the stage in their careers where they had not attained such positions of responsibility or high salaries as to be compelled to remain working for companies as employees. In Egypt, the most entrepreneurially active age groups are those aged 25-34 (TEA of 11.2%) followed by those aged 18-24 (10.7%). The 18-24 segment ranks higher in Egypt compared to the global and regional averages, which indicates higher entrepreneurial activity among recent graduates from universities and other types of education. This is likely to be a response to higher unemployment rates and necessity entrepreneurship among youth. Another noticeable pattern is the growth of senior entrepreneurship in Egypt (TEA of 9% among the 55-64 segment), both compared to previous years (normalized) and to the global average of 8%We can see that, for the most part in Egypt, entrepreneurship remains a youth-centered phenomenon. This is partly because young people are eager to seize upon opportunities, but it is also because youth unemployment is high, making entrepreneurial endeavors a necessity for many.
GEM Egypt National Report 18/19 DEMOGRAPHIC CHARACTERISTICS OF ENTREPRENEURS
Table 11: Total Early-Stage Entrepreneurship Activities (TEA) by Age Group in Egypt and GEM Countries (2018)
47.6
47.5
23.0
71.7
23.4
71.4
22.7
72.0
23.2
71.6
24.5
70.5
MIDDLE EAST & NORTH AFRICA (%)
HIGH INCOME COUNTRIES (%)
MIDDLE INCOME COUNTRIES (%)
LOW INCOME COUNTRIES (%)
EGYPT(%)
GLOBALAVERAGE (%)
18-24 YEARS
25-34 YEARS
35-44 YEARS
45-54 YEARS
55-64 YEARS
10.7
11.2
9.0
7.4
9.0
11.8
15.9
13.9
11.5
8.0
11.8
15.7
13.8
11.5
8.1
11.3
15.1
13.4
11.1
7.6
11.3
15.1
13.4
11.1
7.8
12.1
15.8
14.0
11.6
8.2
Sources: The Authors; GEM Global Report 2018-19
Sources: The Authors; GEM Global Report 2018-19; GEM Egypt Reports 2015-16, 2016-17, 2017-18
47.6
47.5
23.0
71.7
23.4
71.4
22.7
72.0
23.2
71.6
24.5
70.5
18-24 YEARS
25-34 YEARS
35-44 YEARS
45-54 YEARS
55-64 YEARS
10.7
11.2
9.0
7.4
9.0
13.2
18.3
12.2
10.5
6.3
16.2
17.7
15.4
9.3
5.6
6.0
9.7
8.8
5.9
4.6
Table 12: Total Early-Stage Entrepreneurship Activities (% of TEA) by Age Group in Egypt and GEM Countries (2018)
2018 2017 2016 2015
37

SECTION 3CHARACTERISTICS OF
ENTREPRENEURIAL ACTIVITIES
GEM Egypt National Report 18/1938

SECTION 3CHARACTERISTICS OF
ENTREPRENEURIAL ACTIVITIES

GEM Egypt National Report 18/19 CHARACTERISTICS OF ENTREPRENEURIAL ACTIVITIES
GEM provides a comprehensive set of indicators that characterize the entrepreneurial activities in an economy. In this section, we offer a detailed analysis on the following aspects: entrepreneurship motivation, sector of activity, job creation projections, growth orientation, innovation, use of new technologies, and internationalization.
MOTIVATION FOR EARLY-STAGE ENTREPRENEURIAL ACTIVITY
Understanding the motivations behind why people start new businesses can shed light on many aspects of early-stage entrepreneurial activity. GEM divides entrepreneurs based on their motivation into opportunity-driven entrepreneurs, who seek to capitalize on profitable business opportunities, and necessity-driven entrepreneurs, who have no other work options.
Most entrepreneurs around the world are opportunity motivated. At the global level, 71.7% of the entrepreneurs surveyed in 2018 stated that they were motivated by opportunities, while 23.0% were motivated by necessity. This breakdown is remarkably similar in high, middle- and low-income countries, as well as throughout the Middle East and North Africa. Egypt, however, shows a strikingly different pattern, with 47.5% of respondents motivated by opportunity and 47.6% motivated by necessity.
Opportunity-driven entrepreneurs: Of the entrepreneurially active population in Egypt, 47.5% are motivated by opportunity. This marks a decrease from 2017’s figure of 53.5%, and is part of an overall pattern of decrease from 66% in 2012. It is well below the global average of 71.7% and puts Egypt almost at the bottom of the GEM countries surveyed in 2018 (ranking 47th out of 49 countries).
Necessity-driven entrepreneurs: For the second year in a row, Egypt ranks the highest globally for necessity-driven entrepreneurs, with 47.6% of the entrepreneurially active population motivated by necessity. This figure has seen a slight increase over the past five years, from 42.4% in 2015. For the most part Egypt has had a consistently high level of necessity-driven entrepreneurship, and we remain well above the global average of 23.0%. Globally, many more entrepreneurs in low-income economies are motivated by necessity compared to entrepreneurs working in wealthier countries. Among low-income economies in the 2018 GEM report, 35% of the entrepreneurs surveyed stated that they started businesses because they had no better options for work. Europe and North America report the lowest rate of necessity entrepreneurs, at 22.4%.
It is clear from this data that Egypt has a very high level of necessity-driven entrepreneurship and a very high proportion of micro-businesses operating within the informal sector, many of which are in retail and manufacturing sectors. Despite the positive perception of entrepreneurship in the media, and the collective focus on tech startups, it is important to remember that the highest proportion of entrepreneurship in Egypt consists of people starting micro and small businesses. There’s a clear increase in necessity-driven entrepreneurship within the entrepreneurially active population, but we have also observed a decrease in TEA in Egypt. So, looked at broadly, the data we see may indicate an overall decline in entrepreneurial activity from last year.
CHARACTERISTICS OF ENTREPRENEURIAL ACTIVITIES
40

Table 13: Motivation for Early-Stage Entrepreneurial Activity in Egypt and GEM Countries (2018)
47.6
47.5
23.0
71.7
23.4
71.4
22.7
72.0
23.2
71.6
Sources: The Authors; GEM Global Report 2018-19Definitions: Necessity-driven entrepreneurs: Percentage of individuals aged 18–64 who indicate that they have “no better choices for work” or alternative means of survival, which rather compels them to become entrepreneurs. Opportunity-driven entrepreneurs: Percentage of individuals aged 18–64 who voluntarily start a business to take advantage of a business opportunity and gain profits.
24.5
70.5
NECESSITY-DRIVEN
OPPORTUNITY-DRIVEN
MIDDLE EAST& NORTH
AFRICA (%)
HIGHINCOME
COUNTRIES (%)
MIDDLEINCOME
COUNTRIES (%)
LOW INCOME
COUNTRIES (%)EGYPT
(%)GLOBAL
AVERAGE (%)
Table 14: Motivation for Early-Stage Entrepreneurial Activity in Egypt (2015-2018)
Sources: The Authors; GEM Global Report 2018-19; GEM Egypt Reports 2015-16, 2016-17, 2017-18
1
47
47.6
47.5
23.0
71.7
1
53
42.7
53.5
22.0
74.4
13
56
31.3
61.2
23.2
73.5
5
56
42.4
57.3
24.6
72.5
NECESSITY-DRIVEN
OPPORTUNITY-DRIVEN
INDUSTRY SECTOR PARTICIPATION
Early-stage entrepreneurs working in Egypt are overwhelmingly active in the field of wholesale and retail distribution (61.5%), followed by manufacturing (12.8%) and agriculture (8.3%). Collectively, these sectors represent over 81% of all early-stage entrepreneurship taking place in Egypt.
The percentage of early-stage entrepreneurs working in the wholesale and retail distribution sector in Egypt (61.5%) is significantly higher than the global average of 43.0%. There has been a noticeable increase since 2017 of entrepreneurs working in this sector, up from 54.3% to 61.5%. This increase is likely to indicate the growth of micro and small informal retail outlets that are often the typical refuge at times of high unemployment.
Manufacturing in Egypt (12.8%) is also significantly higher than the global average of 8.4%, remaining almost unchanged from the previous two years.
The agricultural sector is likewise quite significantly higher than the global average of 4.6%, with 8.3% of early-stage entrepreneurs in Egypt work in this sector, an increase from last year’s score of 7.0%.
5.6% of early-stage Egyptian entrepreneurs work in health, education, government and social services. While this figure is the fourth-largest sector for entrepreneurship in Egypt, we are well below the global average of 14.5%, indicating a lag in entrepreneurial activities in these sectors and the dominance of large established companies or state-owned enterprises.
2018 2017 20152016
Egypt Rank /49
Egypt%
Global Average
%Egypt
Rank /54Egypt
%Global
Average %
Egypt Rank /65
Egypt%
Global Average
%Egypt
Rank /60Egypt
%Global
Average %
RANK/47
1
49
GEM Egypt National Report 18/19 CHARACTERISTICS OF ENTREPRENEURIAL ACTIVITIES
CHARACTERISTICS OF ENTREPRENEURIAL ACTIVITIES
41

These figures may indicate that Egypt’s retail distribution and manufacturing sectors remain highly fragmented, with many micro and small enterprises and factories. As we observed last year, businesses such as small workshops, agri-businesses or retail stores generally have low barriers to entry, are labor intensive, and do not require substantial capital or knowledge. They can also be quickly started and are often created by necessity entrepreneurs.
Egypt continues to score well below the global average for early-stage entrepreneurs working in sectors that require extensive capital and knowledge,
including information and communication technology, finance and administrative services. There was no observable activity in early-stage entrepreneurship within the finance sector, and both the ICT and professional service sectors were very limited (0.3% and 2.2% respectively).
Overall, we can see that the number of entrepreneurs working in the wholesale and retail sector is increasing dramatically, and those working in agriculture are increasing at a more gradual pace. This shows the continued growth of necessity entrepreneurship in the informal sector.
Table 15: Sector Distribution of Entrepreneurial Activity in Egypt and GEM Countries (2018)
MIDDLE EAST& NORTH
AFRICA (%)
HIGHINCOME
COUNTRIES (%)
MIDDLEINCOME
COUNTRIES (%)
LOWINCOME
COUNTRIES (%)EGYPT
(%)GLOBAL
AVERAGE (%)INDUSTRYSECTOR
8.3
2.4
12.8
3.8
61.5
0.3
0.0
2.2
0.7
5.6
2.4
4.6
5.4
8.4
3.2
43.0
4.2
3.1
6.9
3.9
14.5
2.7
4.7
5.2
8.4
3.2
44.1
4.0
3.0
6.7
3.8
14.4
2.6
4.7
5.5
8.5
3.2
42.2
4.2
3.2
7.1
4.0
14.6
2.7
5.0
5.4
8.7
3.3
43.5
4.0
3.0
6.5
3.9
14.2
2.5
Sources: The Authors; GEM Global Report 2018-19
RANK/49
8
39
8
14
8
44
47
37
46
47
20
GEM Egypt National Report 18/19
AGRICULTURE
MINING
MANUFACTURING
TRANSPORTATION
WHOLESALE &RETAIL
INFORMATION & COMMUNICATION TECHNOLOGY
FINANCE
PROFESSIONALSERVICES
ADMINISTRATIVESERVICES
HEALTH, EDUCATION, GOVERNMENT & SOCIAL SERVICES
PERSONAL & CONSUMERSERVICES
4.6
5.1
8.3
3.2
44.6
4.0
2.8
6.3
3.9
14.5
2.5
CHARACTERISTICS OF ENTREPRENEURIAL ACTIVITIES42

JOB CREATION PROJECTIONS AND GROWTH ORIENTATION As entrepreneurs start to build and grow their businesses, they may employ others, or they may intend to do so in the future. Whether and to what degree entrepreneurs anticipate adding employees to grow their businesses—that is, the extent to which they are job creators—is of great interest to policy makers and other stakeholders. Job creation projections are a key indicator for a business’s growth aspirations, and potential socio-economic impact. GEM examines the job creation projections for early-stage enterprises: ranging from no-growth (not expecting to add any employees over the next five years), to low-growth (planning to add between one and five more employees in the next five years) to high-growth (planning to add six or more employees over the next five years). In 2018, 58.5% of early-stage entrepreneurs in Egypt did not expect to add any new jobs to their businesses within 5 years. This is quite significantly higher than the global average of 46.2%, the MENA region average of 46.7%. This also represents an increase from 2015-2017 range of 51.4% - 55.3%,
%, indicating that the number of necessity-driven informal micro enterprises with no growth aspirations is increasing as a proportion of total entrepreneurial activity in Egypt. Likewise, only 19.3% of early-stage entrepreneurs expect to create 6 or more jobs in their businesses within the coming five years. This figure is marginally higher than the figure for low income countries (18.5%), almost on a par with middle-income countries (19.9%) and somewhat lower than high-income countries (20.6%), the average in MENA (20.4%) and the global average (20.6%). But what’s really striking is the extent to which these scores have decreased in recent years, falling from 25.7% in 2015 to 23.7% in 2017 and now 19.3% this year, indicating lower growth sentiment among the business entrepreneurs.
This data shows that people’s expectations for growth are becoming more limited, which is consistent with the decline in opportunity-driven entrepreneurs which we observed earlier.
Table 16: Sector Distribution of Entrepreneurial Activity in Egypt (% of TEA) (2015 – 2018)
8.3
2.4
12.8
3.8
61.5
0.3
0.0
2.2
0.7
5.6
2.4
7.0
2.1
13.1
4.3
54.3
0.4
1.8
0.6
1.5
8.1
1.9
13.0
3.8
12.9
5.7
50.3
0.0
1.8
2.0
2.8
6.3
1.4
6.6
0.7
21.9
1.7
53.6
0.2
0.5
0.8
1.0
8.5
4.3
Sources: The Authors; GEM Global Report 2018-19; GEM Egypt Reports 2015-16, 2016-17, 2017-18
AGRICULTURE
MINING
MANUFACTURING
TRANSPORTATION
WHOLESALE &RETAIL
INFORMATION & COMMUNICATION TECHNOLOGY
FINANCE
PROFESSIONALSERVICES
ADMINISTRATIVESERVICES
HEALTH, EDUCATION, GOVERNMENT & SOCIAL SERVICES
PERSONAL & CONSUMERSERVICES
2018% 2017% 2016% 2015%INDUSTRY SECTOR
GEM Egypt National Report 18/19 CHARACTERISTICS OF ENTREPRENEURIAL ACTIVITIES 43

Table 17: Job Creation Projections Among Early-Stage Entrepreneurs in Egypt and GEM Countries (2018)
58.5
22.2
19.3
46.2
33.2
20.6
46.7
32.9
20.4
46.2
33.2
20.6
46.2
33.0
19.9
48.0
33.5
18.5
0 JOBS IN 5 YEARS
1 - 5 JOBS IN 5 YEARS
6 OR MORE JOBS IN 5 YEARS
MIDDLE EAST& NORTH
AFRICA (%)
HIGHINCOME
COUNTRIES (%)
MIDDLEINCOME
COUNTRIES (%)
LOWINCOME
COUNTRIES (%)EGYPT
(%)GLOBAL
AVERAGE (%)
Sources: The Authors; GEM Global Report 2018-19
Table 18: Job Creation Projections Among Early-Stage Entrepreneurs in Egypt (2015-2018)
58.5
22.2
19.3
52.5
23.8
23.7
55.3
19.3
25.4
51.4
22.8
25.7
2018 2017 2016 2015INDUSTRY SECTOR
0 JOBS IN 5 YEARS
1 - 5 JOBS IN 5 YEARS
6 OR MORE JOBS IN 5 YEARS
Sources: The Authors; GEM Global Report 2018-19; GEM Egypt Reports 2015-16, 2016-17, 2017-18
ORIENTATION INNOVATION
Innovation represents a company’s ability to introduce new products and services to the market and to use new technology within their own internal operations. Average innovation levels increase with economic development levels, with greater participation in technology-intensive sectors such as information and communication technology, and professional and other service industries, correlating with higher levels of education and greater access to advanced technologies. In addition, many developed economies are characterized by crowded competitive spaces and markets accustomed to advanced solutions; entrepreneurs may need to introduce novel solutions in order to compete successfully. GEM follows three approaches to measure innovation: (i) product innovation, (ii) market innovation, and (iii) use of new technology.
Product innovation: is measured in terms of customer familiarity with a product/service that is
introduced by the company. The scale is divided into three levels: product/service is new or unfamiliar to all potential customers, unfamiliar to some potential customers, or familiar to all potential customers. The percentage of Egyptian entrepreneurs — both early-stage and established — who believe their product to be new to all customers is growing. Among early-stage entrepreneurs, the numbers have increased noticeably, from 13.5% in 2015 to 26.9% in 2018. Established businesses follow the same trend, albeit with a less startling trajectory, moving from 14.8% in 2015 to 23.6% in 2018. These figures may be explained in several ways. It could be representative of true product innovation by local companies, or the introduction of existing products to new underdeveloped regions where they were not available before, or the importation of new products to the market. These new products are introduced more often by new businesses compared to established ones.
RANK/48
10
41
25
GEM Egypt National Report 18/19 CHARACTERISTICS OF ENTREPRENEURIAL ACTIVITIES44

GEM Egypt National Report 18/19
Table 19: Product Innovation in Egypt and GEM Countries (2018)
MIDDLE EAST & NORTH AFRICA
HIGH INCOME COUNTRIES
MIDDLE INCOME COUNTRIES
LOW INCOME COUNTRIES EGYPT GLOBAL
Sources: The Authors; GEM Global Report 2018-19
EARLY STAGEENTREPRE-NEURSHIP
(%)ESTABLISHEDBUSINESS (%)
ESTABLISHEDBUSINESS (%)
ESTABLISHEDBUSINESS (%)
ESTABLISHEDBUSINESS (%)
ESTABLISHEDBUSINESS (%)
ESTABLISHEDBUSINESS (%)
PRODUCT ISNEW TO
ALLCUSTOMERS
SOMECUSTOMERS
NONE
26.9
22.6
50.5
23.6
18.2
58.2
19.0
29.5
51.4
15.0
21.7
63.4
20.2
27.8
52.0
20.7
22.0
57.3
19.2
29.6
51.3
15.0
21.0
64.0
19.2
29.8
50.7
15.6
22.2
62.2
20.0
29.8
50.2
17.7
21.7
60.6
Table 20: Product Innovation in Egypt (2015 – 2018)
Sources: The Authors; GEM Global Report 2018-19; GEM Egypt Reports 2015-16, 2016-17, 2017-18
EARLY STAGEENTREPRENEURSHIP
(%)ESTABLISHEDBUSINESS (%)
ESTABLISHEDBUSINESS (%)
ESTABLISHEDBUSINESS (%)
ESTABLISHEDBUSINESS (%)
PRODUCT ISNEW TO
ALLCUSTOMERS
SOMECUSTOMERS
NONE
26.9
22.6
50.5
23.6
18.2
58.2
19.4
23.8
56.9
15.4
24.8
59.8
22.6
18.6
58.8
13.2
15.0
72.0
13.5
29.4
57.0
14.8
18.7
66.5
2018 2017 20152016
Market innovation: GEM measures market innovation by assessing the use of technology in market expansion. The scale includes four different levels: whether the company has no market expansion, or some market expansion without the use of new technology, or some market expansion with the use of new technology, or profound market expansion.
More Egyptian companies are expanding their markets compared to the global figures: 58% of early-stage Egyptian companies compared to 48% globally, and 53% of established Egyptian companies compared to 30% globally. Within the companies expanding, more Egyptian companies are using new technology in their market expansion and having profound market expansion compared to the global average. These figures do not add up when compared to the high levels of informality and the types of sectors that are dominant in the economy (e.g., retail, manufacturing and agriculture), and may require further investigation. We suspect that some respondents may have included the use of basic computing or telecommunications technology under this category.
CHARACTERISTICS OF ENTREPRENEURIAL ACTIVITIES 45
EARLY STAGEENTREPRE-NEURSHIP
(%)
EARLY STAGEENTREPRE-NEURSHIP
(%)
EARLY STAGEENTREPRE-NEURSHIP
(%)
EARLY STAGEENTREPRE-NEURSHIP
(%)
EARLY STAGEENTREPRE-NEURSHIP
(%)
EARLY STAGEENTREPRENEURSHIP
(%)
EARLY STAGEENTREPRENEURSHIP
(%)
EARLY STAGEENTREPRENEURSHIP
(%)

GEM Egypt National Report 18/19 CHARACTERISTICS OF ENTREPRENEURIAL ACTIVITIES46
Table 21: Market Innovation Measured by Market Expansion Mode in Egypt and GEM Countries (2018)
MIDDLE EAST & NORTH AFRICA
HIGH INCOME COUNTRIES
MIDDLE INCOME COUNTRIES
LOW INCOME COUNTRIES EGYPT GLOBAL
Sources: The Authors; GEM Global Report 2018-19
ESTABLISHEDBUSINESS (%)
PRODUCT ISNEW TO
NO MARKETEXPANSION
MARKETEXPANSION
SOME MARKETEXPANSION(NO NEWTECHNOLOGIES)
SOME MARKETEXPANSION(NEWTECHNOLOGIES)
PROFOUNDMARKETEXPANSION
42
58
32
18
8
47
53
31
18
4
52
48
31
13
3
70
30
24
5
1
49
51
26
22
4
65
35
27
7
1
53
47
31
13
3
69
31
24
6
1
51
49
32
14
3
69
31
24
6
1
52
48
31
14
3
69
31
24
6
1
Table 22: Market Innovation Measured by Market Expansion Mode in Egypt (2015-2018)
Sources: The Authors; GEM Global Report 2018-19; GEM Egypt Reports 2015-16, 2016-17, 2017-18
NO MARKETEXPANSION
MARKETEXPANSION
SOME MARKETEXPANSION(NO NEWTECHNOLOGIES)
SOME MARKETEXPANSION(NEWTECHNOLOGIES)
PROFOUNDMARKETEXPANSION
42
58
32
18
8
47
53
31
18
4
41
59
38
19
2
50
50
30
13
7
46
54
32
18
4
64
36
20
15
2
37
63
23
36
4
76
24
21
3
0
2018 2017 20152016
EARLY STAGEENTREPRE-NEURSHIP
(%)
ESTABLISHEDBUSINESS (%)
EARLY STAGEENTREPRE-NEURSHIP
(%)
ESTABLISHEDBUSINESS (%)
EARLY STAGEENTREPRE-NEURSHIP
(%)
ESTABLISHEDBUSINESS (%)
EARLY STAGEENTREPRE-NEURSHIP
(%)
ESTABLISHEDBUSINESS (%)
EARLY STAGEENTREPRE-NEURSHIP
(%)
ESTABLISHEDBUSINESS (%)
EARLY STAGEENTREPRE-NEURSHIP
(%)
EARLY STAGEENTREPRENEURSHIP
(%)ESTABLISHEDBUSINESS (%)
EARLY STAGEENTREPRENEURSHIP
(%)ESTABLISHEDBUSINESS (%)
EARLY STAGEENTREPRENEURSHIP
(%)ESTABLISHEDBUSINESS (%)
EARLY STAGEENTREPRENEURSHIP
(%)ESTABLISHEDBUSINESS (%)

GEM Egypt National Report 18/19
Use of New Technologies: is another measure for a company’s innovation capacity, especially within their internal operations. More early stage businesses in Egypt (60%) make use of new technology, compared to 43.7% of the established companies. The figures for Egyptian companies, both early stage and established, using new technology are higher than the global average. This pattern has been consistent over the past 3 years, which is unlikely to be the case, based on the high levels of informality and necessity entrepreneurship in the economy. Similar to the market innovation, we suspect that some respondents may have included the use of basic computing or telecommunications technology under this category.
CHARACTERISTICS OF ENTREPRENEURIAL ACTIVITIES 47
VERY LATEST TECHNOLOGY(NEWER THAN ONE YEAR)
NEW TECHNOLOGY (1-5 YEARS OLD)
NO NEW TECHNOLOGY (MORE THAN 5 YEARS OLD)
Table 23: Innovation Measured Through the Use of New Technology in Egypt and GEM Countries (2018)
MIDDLE EAST & NORTH AFRICA
HIGH INCOME COUNTRIES
MIDDLE INCOME COUNTRIES
LOW INCOME COUNTRIES EGYPT GLOBAL
Sources: The Authors; GEM Global Report 2018-19; GEM Egypt Reports 2015-16, 2016-17, 2017-18
VERY LATESTTECHNOLOGY(NEWER THANONE YEAR)
NEW TECHNOLOGY (1-5 YEARS OLD)
NO NEW TECHNOLOGY (MORE THAN 5 YEARS OLD)
25.5
34.5
40.0
23.3
20.4
56.3
16.3
24.0
59.8
7.5
14.1
78.4
26.4
28.0
45.6
11.8
20.7
67.5
16.9
24.0
59.0
7.8
14.5
77.8
17.3
24.7
57.9
8.3
15.0
76.8
21.4
26.3
52.2
10.4
18.1
71.4
Table 24: Innovation Measured Through the Use of New Technology in Egypt (2016-18)
Sources: The Authors; GEM Global Report 2018-19
25.5
34.5
40.0
23.3
20.4
56.3
21.0
35.6
43.4
14.9
26.6
58.5
22.0
31.0
47.0
16.3
39.0
44.6
2018 2017 2016
EARLY STAGEENTREPRENEURSHIP
(%)ESTABLISHEDBUSINESS (%)
EARLY STAGEENTREPRENEURSHIP
(%)ESTABLISHEDBUSINESS (%)
EARLY STAGEENTREPRENEURSHIP
(%)ESTABLISHEDBUSINESS (%)
ESTABLISHEDBUSINESS (%)
EARLY STAGEENTREPRE-NEURSHIP
(%)
ESTABLISHEDBUSINESS (%)
EARLY STAGEENTREPRE-NEURSHIP
(%)
ESTABLISHEDBUSINESS (%)
EARLY STAGEENTREPRE-NEURSHIP
(%)
ESTABLISHEDBUSINESS (%)
EARLY STAGEENTREPRE-NEURSHIP
(%)
ESTABLISHEDBUSINESS (%)
EARLY STAGEENTREPRE-NEURSHIP
(%)
ESTABLISHEDBUSINESS (%)
EARLY STAGEENTREPRE-NEURSHIP
(%)

INTERNATIONALIZATION
IInternationalization is an indicator of the entrepreneur’s aspirations for growth within a more globalized world, as well as the ability to compete in a more sophisticated and competitive global market. It is considered to be an indicator of high sustainability or success in the future because international trade may create more economic value. In today’s global context, internationalization is key to an economy’s national competitiveness. GEM asks entrepreneurs about the approximate percentage of their sales to customers outside their country. GEM measures internationalization by the percentage of entrepreneurs who report that 25% or more of their customers come from outside their country.
Egypt has an increasing number of companies — both early-stage and established — exporting their products compared to a year ago. In 2018, 22.3% of
the early-stage businesses and 19.2% of the established businesses had more than 25% of their customers outside the country, compared to 15.8% and 13.3% respectively in 2017. This increase could be the result of the currency devaluation rendering Egyptian products or services more competitive at a global level. Egypt also had relatively high levels of internationalization in 2018, whether compared to the global average or MENA economies. This was the case for both early-stage and established businesses. At 22.3%, the internationalization of entrepreneurial businesses in Egypt is higher than the global average of 20.8% and slightly higher than the MENA average of 21.3%. For established businesses, 2018 levels of internationalization (19.2%) were also higher than the global average (16.4%) and the MENA average (16.8%).
Table 25: Internationalization Among Entrepreneurial Businesses and Established Businesses in Egypt and GEM Countries (2018)
MIDDLE EAST & NORTH AFRICA
HIGH INCOME COUNTRIES
MIDDLE INCOME COUNTRIES
LOW INCOME COUNTRIES EGYPT GLOBAL
ENTREPRE-NEURIAL
BUSINESS (%)ESTABLISHEDBUSINESS (%)
ENTREPRE-NEURIAL
BUSINESS (%)ESTABLISHEDBUSINESS (%)
ESTABLISHEDBUSINESS (%)
ESTABLISHEDBUSINESS (%)
ESTABLISHEDBUSINESS (%)
ESTABLISHEDBUSINESS (%)
MORE THAN 25% OF CUSTOMERS OUTSIDE THE COUNTRY
Sources: The Authors; GEM Global Report 2018-19; GEM Egypt Reports 2015-16, 2016-17, 2017-18
22.3 19.2 20.8 16.4 21.3 22.2 17.8 20.8
ENTREPRE-NEURIAL
BUSINESS (%)
ENTREPRE-NEURIAL
BUSINESS (%)
ENTREPRE-NEURIAL
BUSINESS (%)
ENTREPRE-NEURIAL
BUSINESS (%)
16.8 21.2 16.7 16.3
GEM Egypt National Report 18/19 CHARACTERISTICS OF ENTREPRENEURIAL ACTIVITIES48
MORE THAN 25% OF CUSTOMERS OUTSIDE THE COUNTRY
Table 26: Internationalization Among Early-StageEntrepreneurship and Established Businesses in Egypt (2015-2018)
Sources: The Authors; GEM Global Report 2018-19
22.3 19.2 15.8 13.3 9.0 10.0
ENTREPRENEURIAL BUSINESS (%)
ESTABLISHEDBUSINESS (%)
ENTREPRENEURIAL BUSINESS (%)
ESTABLISHEDBUSINESS (%)
ENTREPRENEURIAL BUSINESS (%)
ENTREPRENEURIAL BUSINESS (%)
ENTREPRENEURIAL BUSINESS (%)
ESTABLISHEDBUSINESS (%)
2018 2017 20152016
17.2 22.3

GEM Egypt National Report 18/19 CHARACTERISTICS OF ENTREPRENEURIAL ACTIVITIES 49

SECTION 4ENTREPRENEURSHIP
ECOSYSTEM
GEM Egypt National Report 18/1950

SECTION 4ENTREPRENEURSHIP
ECOSYSTEM

GEM’S ENTREPRENEURSHIP FRAMEWORK CONDITIONS
An entrepreneurship framework measures the conditions shaping the national context in which entrepreneurial activities take place within an economy. As we have shown, each economy has its own specific profile when it comes to the rate of entrepreneurial activity in different fields, the characteristics of entrepreneurs and the nature of their businesses, and the attitudes towards and perceptions of entrepreneurship in wider society. Likewise, the environment of each economy differs when it comes to the opportunities that entrepreneurs can leverage and the constraints that they must overcome to start their businesses.
The National Expert Survey (NES) consists of an overview of the current ecosystem, offering insights into the major constraints, recommendations, and potential areas of improvement. From Egypt, 50 experts participated in the 2018 NES, comprising a minimum of four experts for each of the nine areas of Entrepreneurial Function Conditions (EFCs). EFCs average scores - assessed in National Expert Survey in 9-point Likert scale (1=highly insufficient; 9=highly sufficient) were re-scaled to 10 points for the purpose of NECI. In our analysis of Egypt’s National Expert Survey, we provide benchmarks to show how we compare to other GEM economies, including global averages and averages based on income levels, as identified and categorized by GEM 2018 (high, middle and low-income economies). We also track the progress of the entrepreneurship ecosystem in Egypt in the period between 2015 and 2018.
Table 27: Entrepreneurship Framework Conditions
ENTREPRENEURIAL FINANCE
GOVERNMENT POLICIES SUPPORT AND RELEVANCE
GOVERNMENT POLICIES, TAXES AND BUREAUCRACY
GOVERNMENT ENTREPRENEURSHIP PROGRAMS
ENTREPRENEURSHIP EDUCATION AT SCHOOL STAGE
ENTREPRENEURIALEDUCATION AT POST-SCHOOL STAGE
RESEARCH AND DEVELOPMENT (R&D) TRANSFER
The availability of financial resources and funding for current and potential entrepreneurs, including the accessibility and efficient functioning of equity markets and the availability of typical financing channels for entrepreneurs. Sources of funding include informal investments, professional business angels, venture capitalists, banks, government loans, grants and subsidies, as well as crowdfunding.
The extent to which national governments demonstrate support for entrepreneurs, for example, whether policymakers mention entrepreneurship in public discourse and press for specific regulations to improve conditions for different types of entrepreneurs and small and medium enterprises (SMEs).
The degree to which taxes are affordable and balanced for entrepreneurs, or whether they constitute a burden to starting and growing businesses, and the burden of dealing with bureaucracy in government processes.
The presence and quality of government programs directly assisting new firms and SMEs at all levels of government (national, regional, municipal, including subsidies, incubators, training and advisory services.
The extent to which training in creating or managing new firms and SMEs and entrepreneurial values are incorporated within the education system at primary and secondary school level
The inclusion of entrepreneurship subjects in post-school programs, such as colleges, business schools, and vocational centers, including the effectiveness of post-school educational systems in building students’ entrepreneurship skills and values and facilitating the venture creation process among students and graduates.
GEM Egypt National Report 18/19 ENTREPRENEURSHIP ECOSYSTEM
The extent to which research and development is transferred from universities and research centers to the business sector, including new firms and SMEs, and leading to new commercial opportunities. And the degree engineers and scientists can commercialize research findings and bring them to the market.
52

Sources: GEM Global Report, 2018-19
COMMERCIAL ANDPROFESSIONAL INFRASTRUCTURE
INTERNAL MARKET DYNAMICS
INTERNAL MARKET BURDENS OR ENTRY REGULATION
PHYSICALINFRASTRUCTURE
CULTURAL AND SOCIAL NORMS
The presence of property rights and the availability and affordability of professionals and firms providing services to entrepreneurs, including accountants, lawyers, and consultants, to help them start and managenew businesses.
The presence of a free and open market where no entity exerts power to influence or set prices, and where changes in demand are met with changes in supply, and vice versa.
The extent to which new firms are free to enter existing markets, including regulatory and other burdens.
The ease of access and affordability of physical infrastructure, such as, communication, utilities, transportation, land or space, at a price that does not discriminate against new firms or SMEs.
The extent to which social and cultural norms, including behaviors, beliefs, language and customs, encourage or allow entrepreneurial activities leading to new business venturesbusiness methods or activities that can potentially increase personal wealth and income
The extent to which a society exhibits an entrepreneurship focus within the culture through behavior, beliefs, language and customs. This can encourage entrepreneurs by demonstrating acceptance, support and high regard for their activity.
NATIONAL ENTREPRENEURSHIP CONTEXT INDEX (NECI)
For the first time, GEM is introducing a composite index, the National Entrepreneurship Context Index (NECI), to assess the environment for entrepreneurship in any given economy. This is an index combining the assessment of the 12 entrepreneurship framework conditions: financing, government policies, taxes and bureaucracy, government programs, school-level entrepreneurship education and training, postschool entrepreneurship education and training, R&D transfer, access to commercial and professional infrastructure, internal market dynamics, internal market burdens, access to physical and services infrastructure, and cultural and social norms.
The aim of the NECI is to assess the overall strength of the entrepreneurship environment through an examination of key matrices, providing an analysis that can then be used to inform policy, and guide practitioners and other stakeholders.
The NECI is calculated based on surveys of a minimum of 36 experts in each economy, including entrepreneurs as well as those involved in
entrepreneurship in areas including finance, government, and education. Experts are asked to assess different aspects of the 12 framework conditions and their importance in stimulating and supporting entrepreneurship within their particular economies, giving each a rating of between 1 and 9 (with 1 signifying the lowest possible rating, and 9 the highest). Then, the average of each factor is calculated.
Table X shows the NECI rankings and scores for the 54 GEM economies participating in the 2018 National Expert Survey (NES). These are sorted from high to low. In the appendix of this report, there is an additional breakdown, with detailed rankings and scores for each of the 12 framework conditions.
Egypt shows an average or below average rating for each of the framework condition, with an overall score of 4.7 points, ranking of 34th out of 54 economies, which places Egypt within the third quartile among the participating GEM economies, and within the middle of the MENA region countries.
GEM Egypt National Report 18/19 ENTREPRENEURSHIP ECOSYSTEM 53

Table 28: 2018 NECI Rankings and Scores for 54 Participating Economies
INCOME LEVEL REGIONECONOMY NECI SCORE
(OUT OF 10)NECIRANK
1
2
3
4
5
6
7
8
9
10
11
12
13
14
15
16
17
18
Middle East and Africa
East and South Asia
Europe and North America
East and South Asia
East and South Asia
Europe and North America
Middle East and Africa
Europe and North America
Europe and North America
Europe and North America
East and South Asia
Europe and North America
Europe and North America
East and South Asia
East and South Asia
Europe and North America
Europe and North America
Europe and North America
Qatar
Indonesia
Netherlands
Taiwan
India
United States
United Arab Emirates
Luxembourg
Switzerland
France
China
Canada
Austria
Korea Republic
Thailand
Spain
Ireland
Sweden
6.7
6.6
6.5
6.3
6.2
6.0
5.9
5.7
5.7
5.6
5.6
5.5
5.5
5.5
5.5
5.4
5.4
5.4
High
Low
High
High
Low
High
High
High
High
High
Middle
High
High
High
Middle
High
High
High
Germany
Japan
Argentina
Latvia
Mexico
Poland
Slovenia
Chile
Cyprus
Israel
Turkey
United Kingdom
Kazakhstan
Colombia
Europe and North America
East and South Asia
Latin America and the Caribbean
Europe and North America
Latin America and the Caribbean
Europe and North America
Europe and North America
Latin America and the Caribbean
Europe and North America
Middle East and Africa
Europe and North America
Europe and North America
Europe and North America
Latin America and the Caribbean
5.4
5.3
5.2
5.2
5.2
5.2
5.2
5.1
5.1
5.1
5.1
4.9
4.9
4.8
High
High
High
High
Middle
High
High
High
High
High
Middle
High
Middle
Middle
GEM Egypt National Report 18/19 ENTREPRENEURSHIP ECOSYSTEM54
19
20
21
22
23
24
25
26
27
28
29
30
31
32

Uruguay
Egypt
Lebanon
Bulgaria
Russian Federation
Dominican Republic
Peru
Italy
Saudi Arabia
Greece
Slovak Republic
Guatemala
Sudan
Iran
Morocco
Brazil
Madagascar
Angola
Puerto Rico
Panama
Croatia
Mozambique
Latin America and the Caribbean
Middle East and Africa
Middle East and Africa
Europe and North America
Europe and North America
Latin America and the Caribbean
Latin America and the Caribbean
Europe and North America
Middle East and Africa
Europe and North America
Europe and North America
Latin America and the Caribbean
Middle East and Africa
Middle East and Africa
Middle East and Africa
Latin America and the Caribbean
Middle East and Africa
Middle East and Africa
Latin America and the Caribbean
Latin America and the Caribbean
Europe and North America
Middle East and Africa
4.7
4.7
4.7
4.7
4.6
4.6
4.5
4.5
4.4
4.3
4.3
4.3
4.3
4.3
4.3
4.2
4.1
4.1
4.1
4.0
3.8
3.2
High
Low
Middle
Middle
Middle
Middle
Middle
High
High
High
High
Middle
Low
Middle
Low
Middle
Low
Low
High
High
High
Low
33
34
35
36
37
38
39
40
41
42
43
44
45
46
47
48
49
50
51
52
53
54
Sources: GEM Global Report, 2018-19
GEM Egypt National Report 18/19 ENTREPRENEURSHIP ECOSYSTEM 55
Sources: GEM Global Report, 2018-19
Note: Figures represent the mean scores based on a scale of 1 to 9 (1 = highly insufficient; 9 = highly sufficient)
8.0
7.0
6.0
5.0
4.0
3.0
2.0
1.0
0.0
Japa
nTh
aila
ndKo
rea R
epub
licCh
ina
Indi
aTa
iwan
Indo
nesi
aCr
oatia
Gree
ceSl
ovak
Rep
ublic
Italy
Russ
ian
Fede
ratio
nBu
lgar
iaKa
zakh
stan
Unite
d Ki
ngdo
mTu
rkey
Cypr
usSl
oven
iaLa
tvia
Pola
nd
Germ
any
Swed
enIre
land
Spai
nAu
stria
Cana
daFr
ance
Switz
erla
ndLu
xem
bour
gUn
ited
Stat
esNe
ther
land
sPa
nam
aPu
erto
Ric
oBr
azil
Guat
emal
aPe
ruDo
min
ican
Rep
ublic
Urug
uay
Colo
mbi
aCh
ileM
exic
oAr
gent
ina
Moz
ambi
que
Ango
laM
adag
asca
rM
oroc
coIra
nSu
dan
Saud
i Ara
bia
Leba
non
Egyp
tIs
rael
Unite
d Ar
ab E
mira
tes
Qata
r
East and South Asia Europe and North America Latin America and the Caribbean Middle East and Africa
Figure 3: National Entrepreneurship Context Index (NECI) Results for 54 Economies in Four Geographic Regions

EGYPT’S ENTREPRENEURSHIP ECOSYSTEM
Egypt’s entrepreneurship ecosystem is steadily improving when it comes to most indicators, although our ratings remain relatively low compared to GEM global averages. Experts are particularly noticing improvements in entrepreneurial finance, support and relevance of government policies, and government entrepreneurship programs. Experts are also observing noticeable decline in entrepreneurship education, both school and post school stages. The emerging areas of strength for the entrepreneurship ecosystem in Egypt include access to finance (Egypt’s score of 4.4, compared to the global average of 4.3) and physical infrastructure (Egypt’s score of 6.5 compared to the global average of 6.3). The key areas of weakness for the entrepreneurship ecosystem in Egypt include entrepreneurship education at both the school and post-school stages (Egypt’s score was 2.3 and 3.7, compared to the global averages of 3.2 and 4.8 respectively), and government bureaucracy and taxation policy (Egypt’s score was 3.5, compared to the global average of 3.9).
In the rest of this section, we review the expert assessment in each of these sections, comparing it to global averages as well as previous years.
GEM Egypt National Report 18/19 ENTREPRENEURSHIP ECOSYSTEM56
Figure 4: Experts’ Ratings of the Entrepreneurial Ecosystem in Egypt vs. GEM Global Average in (2018)
9
8
7
6
5
4
3
2
1
Entrepreneurial Finance4.39 (30/54)
Government Policies:Support & Relevance4.26 (28/54)
Government Policies:Taxes & Bureaucracy3.5 (35/54)
GovernmentEntrepreneurshipProgram3.98 (36/54)
Entrepreneurial Educationat School Stage2.33 (47/54)
Entrepreneurial Educationat Post-School Stage3.72 (51/54)
R&D Transfer3.46 (34/54)
Commercial & LegalInfrastucture
4.48 (37/54)
Internal MarketDynamics
5.13 (25/54)
Internal Market Burdensor Entry Regulation
4.38 (24/54)
PhysicalInfrastucture
6.52 (26/54)
Cultural &Social Norms
4.56 (37/54)
GEMEGYPT
Expert Ratings of the EntrepreneurialFramework Conditions
Sources: GEM Global Report, 2018-19

Table 29: Experts’ Ratings of the Entrepreneurial Ecosystem in Egypt (2015-2018)
4.4
4.3
3.5
4.0
2.3
3.7
3.5
4.5
5.1
4.4
6.5
4.6
4.0
4.2
3.0
3.3
1.8
3.4
2.9
4.0
5.8
4.1
6.1
4.0
3.9
3.6
3.1
3.3
1.7
3.1
2.8
3.9
5.1
4.0
6.5
4.1
3.5
3.3
3.0
3.1
1.6
3.1
2.9
4.2
5.1
3.8
6.3
3.8
Sources: The Authors; GEM Global Report 2018-19; GEM Egypt Reports 2015-16, 2016-17, 2017-18
1. ENTREPRENEURIAL FINANCE
2A. GOVERNMENT POLICIES: SUPPORT AND RELEVANCE
2B. GOVERNMENT POLICIES: TAXES AND BUREAUCRACY
3. GOVERNMENT ENTREPRENEURSHIP PROGRAMS
4A. ENTREPRENEURSHIP EDUCATION AT SCHOOL STAGE
4B. ENTREPRENEURSHIPEDUCATION AT POST-SCHOOL STAGE
5. RESEARCH AND DEVELOPMENT (R&D) TRANSFER
6. COMMERCIAL AND LEGAL INFRASTRUCTURE
7A. INTERNAL MARKETDYNAMICS
7B. INTERNAL MARKET BURDENS OR ENTRY REGULATIONS
8. PHYSICAL INFRASTRUCTURE
9.CULTURAL AND SOCIAL NORMS
2018 2017 2016 2015
GEM Egypt National Report 18/19 ENTREPRENEURSHIP ECOSYSTEM 57
Government Policies:Taxes & Bureaucracy3.5 (35/54)
GovernmentEntrepreneurshipProgram3.98 (36/54)
Entrepreneurial Educationat School Stage2.33 (47/54)
1. ENTREPRENEURIAL FINANCE
2A. GOVERNMENT POLICIES: SUPPORT AND RELEVANCE
2B. GOVERNMENT POLICIES: TAXES AND BUREAUCRACY
3. GOVERNMENT ENTREPRENEURSHIP PROGRAMS
4A. ENTREPRENEURSHIP EDUCATION AT SCHOOL STAGE
4B. ENTREPRENEURSHIPEDUCATION AT POST-SCHOOL STAGE
5. RESEARCH AND DEVELOPMENT (R&D) TRANSFER
6. COMMERCIAL AND LEGAL INFRASTRUCTURE
Table 30: Experts’ Ratings of the Entrepreneurial Ecosystem in Egypt and GEM Countries (2018)
HIGH INCOME COUNTRIES
MIDDLE INCOME COUNTRIES
LOW INCOME COUNTRIES EGYPT GLOBAL
AVERAGE
4.3
4.3
3.9
4.5
3.2
4.8
4.0
4.9
4.3
4.3
3.9
4.5
3.1
4.8
4.0
4.9
4.3
4.2
3.8
4.4
3.1
4.7
3.9
4.9
4.2
4.2
3.8
4.4
3.0
4.7
3.8
4.8
4.4
4.3
3.5
4.0
2.3
3.7
3.5
4.5

7A. INTERNAL MARKETDYNAMICS
7B. INTERNAL MARKET BURDENS OR ENTRY REGULATIONS
8. PHYSICAL INFRASTRUCTURE
9.CULTURAL AND SOCIAL NORMS
5.2
4.2
6.3
4.8
5.2
4.2
6.4
4.9
5.2
4.2
6.4
4.8
5.1
4.1
6.2
4.8
Sources: The Authors; GEM Global Report 2018-19
5.1
4.4
6.5
4.6
Note: Figures represent average scores on a scale of 1 to 9 (1 = highly insufficient; 9 = highly sufficient),grouped by income level
ENTREPRENEURIAL FINANCE
Entrepreneurial finance indicates the availability of financial resources for new firms as well as micro, small and medium enterprises (MSMEs), including debt and equity financing from varieties of sources. Egypt’s rating for entrepreneurial finance stands at 4.4, ranking 30th out of 54 economies, slightly higher than the global average of 4.3 and of similar-income countries. Over time, we have seen steady and consistent improvement, from 3.5 in 2015 to 4.4 in 2018. This overall positive improvement indicates improvements of different areas of access to finance such as debt, equity, subsidies and angel investments for startups, as well as for micro, small and medium enterprises. While a lack of financing is consistently identified as being one of the top challenges facing Egyptian entrepreneurs, these ratings are indicative of the efforts undertaken by a variety of stakeholders to improve the status quo.
In multiple areas, funding opportunities for entrepreneurs have improved since 2015. Equity funding has seen a leap from 3.8 in 2015 to 5.0 in 2017 and 5.2 in 2018, and debt funding has also improved substantially, moving from 3.0 in 2015 to 4.3 in 2017, to 4.6 in 2018. Government subsidies, professional business angel funding, informal investor funding from family and friends, and access to venture capital have all also seen notable growth from 2015, now standing at 4.2, 4.7, 5.7 and 4.8 respectively.
Financing through IPOs and crowdfunding has always been very low, with the former remaining at a rate of 3.2 from 2015 to 2018, and the latter having decreased from 3.4 in 2015 to 2.9 in 2018. These are not common methods for entrepreneurial financing in Egypt.
The increase in the ratings related to bank loans in Egypt show that the Central Bank’s initiative to support SMEs may be yielding positive results, and that commercial banks likewise are making an effort to increase access to finance for SMEs. New venture capital funds are also entering the market, with around USD 300 million of capitalization. Finally, there is a noticeable increase in the number of accelerators and incubators offering both financial and other kinds of support to entrepreneurs.
Table 31: Entrepreneurial Finance in Egypt (2015 -2018)
5.2
4.6
4.2
5.7
4.7
4.8
3.2
2.9
5.0
4.3
3.8
5.6
4.0
4.4
2.8
3.2
4.4
4.4
3.5
5.7
3.9
3.6
3.1
3.3
3.8
3.0
3.0
5.3
4.0
3.6
3.2
3.4
EQUITY FUNDING AVAILABLE FOR NEW AND GROWING FIRMS
DEBT FUNDING AVAILABLE FOR NEW AND GROWING FIRMS
GOVERNMENT SUBSIDIES AVAILABLE FOR NEW AND GROWING FIRMS
FUNDING AVAILABLE FROM INFORMAL INVESTORS (FAMILY & FRIENDS)
PROFESSIONAL BUSINESS ANGELS FUNDING AVAILABLE FOR NEW AND GROWING FIRMS
VENTURE CAPITALIST FUNDING AVAILABLE FOR NEW AND GROWING FIRMS
FUNDING AVAILABLE THROUGH INITIAL PUBLIC OFFERINGS (IPOS) FOR NEW AND GROWING FIRMS
PRIVATE LENDERS’ FUNDING (CROWDFUNDING) AVAILABLE FOR NEW AND GROWING FIRMS
2018 2017 2016 2015
GEM Egypt National Report 18/19 ENTREPRENEURSHIP ECOSYSTEM58

5.2
4.6
4.2
5.7
4.7
4.8
3.2
2.9
5.0
4.3
3.8
5.6
4.0
4.4
2.8
3.2
4.4
4.4
3.5
5.7
3.9
3.6
3.1
3.3
3.8
3.0
3.0
5.3
4.0
3.6
3.2
3.4
Sources: The Authors; GEM Global Report 2018-19; GEM Egypt Reports 2015-16, 2016-17, 2017-18
EQUITY FUNDING AVAILABLE FOR NEW AND GROWING FIRMS
DEBT FUNDING AVAILABLE FOR NEW AND GROWING FIRMS
GOVERNMENT SUBSIDIES AVAILABLE FOR NEW AND GROWING FIRMS
FUNDING AVAILABLE FROM INFORMAL INVESTORS (FAMILY & FRIENDS)
PROFESSIONAL BUSINESS ANGELS FUNDING AVAILABLE FOR NEW AND GROWING FIRMS
VENTURE CAPITALIST FUNDING AVAILABLE FOR NEW AND GROWING FIRMS
FUNDING AVAILABLE THROUGH INITIAL PUBLIC OFFERINGS (IPOS) FOR NEW AND GROWING FIRMS
PRIVATE LENDERS’ FUNDING (CROWDFUNDING) AVAILABLE FOR NEW AND GROWING FIRMS
GEM Egypt National Report 18/19 ENTREPRENEURSHIP ECOSYSTEM 59
GOVERNMENT POLICIES
Government policies, which impact virtually every area of doing business, including taxation, public procurement, licensing and permits, market regulation, and other legal and regulatory interventions, have a significant effect on businesses. Fledgling companies, at their earliest stages of growth, are particularly impacted by government policies.
GEM examines the influence of government policies and the consistency with which they are applied. It looks particularly at the extent to which policies are either size-neutral or favor either small businesses or large corporations. In doing this, GEM examines two government policy areas: (i) support and relevance, and (ii) taxes and bureaucracy.
In Egypt, government policies support and relevance score is 4.3, ranking 28th out of 54 economies; and government policies in taxes and bureaucracy score is 3.5, ranking 35th out of 54 economies. The support and relevance result is equal to both the global average and slightly higher than similar-income economies, at 4.2. This reflects a growing attention to entrepreneurship at the government.
When it comes to taxes and bureaucracy, however, we fare less well. Our score is substantially below the global average and that of high-income economies, which are both at 3.9, and also below similar-income economies, at 3.8. This indicates that the challenges in this area remain a significant and pressing impediment to progress.
Egypt’s scores in the area of government policy are not high, but they have been steadily improving since 2015. Ministerial support of entrepreneurship has been felt at different levels, including through regulatory reform, new policy initiatives and support programs. The impact of reforms made to the investment, bankruptcy and industrial licensing laws also continues to be felt.
Support for new and growing firms is evidently a government priority at both the national and local levels. At the national level, there has been a notable leap from 4.0 in 2015 to 5.5 in 2018. At the local level, there has also been an increase from 3.3 in 2015 to 4.3 in 2018. When it comes to bureaucracy and taxation, rates remain low, but they are improving. The extent to which taxes are not a burden for new and growing firms has grown from 3.7 in 2015 to 4.1 in 2018. Finally, the ease of coping with government bureaucracy, regulations and licensing requirements has seen a very slight increase from 2.6 in 2015 and 2017 up to 3.0 in 2018.

Table 32: Government Policies in Egypt (2015-2018)
3.0
5.5
4.3
3.2
4.1
3.6
3.0
3.1
5.2
4.0
2.4
3.6
3.2
2.6
2.6
4.5
3.5
2.3
4.5
3.3
2.8
2.6
4.0
3.3
2.4
3.7
3.7
2.6
Sources: The Authors; GEM Global Report 2018-19; GEM Egypt Reports 2015-16, 2016-17, 2017-18
GOVERNMENT POLICIES (e.g., PUBLIC PROCUREMENT) CONSISTENTLY FAVOR NEW FIRMS.
THE SUPPORT FOR NEW AND GROWING FIRMS IS A HIGH PRIORITY FOR POLICY AT THE NATIONAL GOVERNMENT LEVEL
THE SUPPORT FOR NEW AND GROWING FIRMS IS A HIGH PRIORITY FOR POLICY AT THE LOCAL GOVERNMENT LEVEL
NEW FIRMS CAN GET MOST OF THE REQUIRED PERMITS AND LICENSES IN ABOUT A WEEK
THE AMOUNT OF TAXES IS NOT A BURDEN FOR NEW AND GROWING FIRMS
TAXES AND OTHER GOVERNMENT REGULATIONS ARE APPLIED TO NEW AND GROWING FIRMS IN A PREDICTABLE AND CONSISTENT WAY
COPING WITH GOVERNMENT BUREAUCRACY, REGULATIONS, AND LICENSING REQUIREMENTS IS NOT UNDULY DIFFICULT FOR NEW AND GROWING FIRMS
2018 2017 2016 2015
GOVERNMENT ENTREPRENEURSHIPPROGRAMS
Government support programs for entrepreneurship play an important role in supporting early-stage businesses, especially in underserved and marginalized communities. Overall, Egypt’s score in government entrepreneurship programs is 4.0, ranking 36th out of 54 economies, compared to a global average of 4.5, and similar-income economies’ average of 4.4.
There is a noticeable improvement in all of the areas of government entrepreneurship programs from the previous years, including the number availability and effectiveness of these programs. The highest improvement area is in the number and effectiveness of these programs. This perception is likely due to the high visibility of several government programs over the past year, including, Egypt Ventures, Fekretak Sherketak, Falak startup accelerator, the Technology Entrepreneurship and Innovation Center (TIEC) and Rowad 2030. This is confirmed by the high score of 5.5 in the area of science parks and business incubators.
GEM Egypt National Report 18/19 ENTREPRENEURSHIP ECOSYSTEM60
Serious problems remain for entrepreneurs and business owners in, for example, securing permits or making tax payments and assessments. This is reflective of a broader problem exhibited in Egypt, where the difference between making good policy decisions and actually seeing their implementation all the way through the bureaucracy is very pronounced.

GEM Egypt National Report 18/19 ENTREPRENEURSHIP ECOSYSTEM 61
Table 33: Government Entrepreneurship Programs in Egypt (2015 – 2018)
4.0
5.5
4.4
3.3
3.2
4.9
2.6
5.0
3.7
2.7
2.7
3.3
2.9
4.8
3.6
3.0
2.7
3.3
3.2
4.5
3.8
3.0
2.4
3.2
Sources: The Authors; GEM Global Report 2018-19; GEM Egypt Reports 2015-16, 2016-17, 2017-18
A WIDE RANGE OF GOVERNMENT ASSISTANCE FOR NEW AND GROWING FIRMS CAN BE OBTAINED THROUGH CONTACT WITH A SINGLE AGENCY
SCIENCE PARKS AND BUSINESS INCUBATORS PROVIDE EFFECTIVE SUPPORT FOR NEW AND GROWING FIRMS
THERE IS AN ADEQUATE NUMBER OF GOVERNMENT PROGRAMS FOR NEW AND GROWING BUSINESSES
THE PEOPLE WORKING FOR GOVERNMENT AGENCIES ARE COMPETENT AND EFFECTIVE IN SUPPORTING NEW AND GROWING FIRMS
ALMOST ANYONE WHO NEEDS HELP FROM A GOVERNMENT PROGRAM FOR A NEW OR GROWING BUSINESS CAN FIND WHAT THEY NEED
GOVERNMENT PROGRAMS AIMED AT SUPPORTING NEW AND GROWING FIRMS ARE EFFECTIVE.
2018 2017 2016 2015
ENTREPRENEURSHIP EDUCATION
Providing basic business education and training on how to start, manage and grow a business in areas such as marketing, finance, operations, and strategy is an essential part of expanding the base of potential entrepreneurs. GEM examines two areas of entrepreneurship training: (i) primary and secondary education, and (ii) post-school level, including colleges and universities, as well as vocational, professional, and continuing education.
Egypt’s score for both educational sectors is among the lowest compared to all GEM economies. At the school stage, our score is 2.3, compared to the global average of 3.2 and similar-income economies’ average of 3.0. At the post-school level, Egypt fares slightly better, with a score of 3.7, compared to the global average of 4.8 and similar-income countries’ average of 4.7.
Despite these low scores, there is a positive pattern of improvement, albeit slow, among all the metrics between 2015 and 2018. These improvements reflect ambitious initiatives for educational reforms that target the primary and secondary level, technical and vocational (TVET) education and universities. Although it will take time for the impact of these reforms to be reflected in the scores shown here, all micro-indicators measured have shown some improvement from last year, which is positive. The teaching score for primary and secondary education is showing steady growth in its score for creativity, self-sufficiency, and personal initiative, increasing from 1.8 in 2015 to 2.4 in 2018. Scores have also increased for instruction in market economic principles at the school level, and for preparation for starting and growing new firms in all areas of the post-school level, including college and university, vocational, professional and continuing education.

Despite these improvements, entrepreneurship and business education in Egypt still has a long way to go to provide aspiring or existing entrepreneurs with the skills they need. Traditionally, teaching methods have not tended to foster creativity, independence or personal initiative-all of which are core parts of an entrepreneurial mindset and essential for the risk-taking and perseverance needed when starting one’s own business. Teaching content does not provide an understanding of the functioning of a market economy, or an understanding of the process of business creation. Education practices and methodology do not generally allow much room for students to innovate or question the status quo.
Egypt’s scores in the field of entrepreneurship education cannot be separated from the country’s broader education framework, of which they are a product. Viewed in this context, the scores are not surprising, as Egypt continues to rank very low on global scores for general primary and secondary education. There is, however, a recognition at the highest levels that educational reform is necessary, and it has been set as a government priority. Given that there is also a notable government movement to foster an entrepreneurial environment and support early-stage entrepreneurs, through programming and-increasingly-through policy, and there is a clear causal link between providing entrepreneurship education and building the pipeline of prospective entrepreneurs, we can hope that we may start to see improvements in the coming years.
GEM Egypt National Report 18/19
Table 34: Entrepreneurship Education in Egypt (2015 – 2018)
2.4
2.4
2.3
3.5
3.8
3.8
1.9
1.7
1.7
3.2
3.7
3.2
1.8
1.7
1.5
3.0
3.2
3.0
1.8
1.6
1.5
2.8
2.2
3.0
Sources: The Authors; GEM Global Report 2018-19; GEM Egypt Reports 2015-16, 2016-17, 2017-18
TEACHING IN PRIMARY AND SECONDARY EDUCATION ENCOURAGES CREATIVITY, SELF-SUFFICIENCY, AND PERSONAL INITIATIVE
TEACHING IN PRIMARY AND SECONDARY EDUCATION PROVIDES ADEQUATE INSTRUCTION IN MARKET ECONOMIC PRINCIPLES
TEACHING IN PRIMARY AND SECONDARY EDUCATION PROVIDES ADEQUATE ATTENTION TO ENTREPRENEURSHIP AND NEW FIRM CREATION
COLLEGES AND UNIVERSITIES PROVIDE GOOD AND ADEQUATE PREPARATION FOR STARTING UP AND GROWING NEW FIRMS
THE LEVEL OF BUSINESS AND MANAGEMENT EDUCATION PROVIDE GOOD AND ADEQUATE PREPARATION FOR STARTING UP AND GROWING NEW FIRMS
THE VOCATIONAL, PROFESSIONAL, AND CONTINUING EDUCATION SYSTEMS PROVIDE GOOD AND ADEQUATE PREPARATION FOR STARTING UP AND GROWING NEW FIRMS
2018 2017 2016 2015
ENTREPRENEURSHIP ECOSYSTEM62

GEM Egypt National Report 18/19 ENTREPRENEURSHIP ECOSYSTEM 63
RESEARCH & DEVELOPMENT TRANSFERThe depth and quality of research and development (R&D), in terms of gathering information and deepening collective understanding of particular topics or disciplines, as well as the ability to transfer knowledge and technology from universities and research centers into industry is necessary for a country to transition from a low-income economy to a middle-income economy, and then to a high-income economy. Overall, Egypt’s score in R&D transfer in 2018 is 3.5, ranking 34th out of 54 economies, which is relatively low compared to a global average of 4.0 and similar-income economies’ average of 3.8.
This relatively low score reflects weak links between industry, on the one hand, and universities and public research centers, on the other. A lack of connections or synergy between research and industry has long been recognized as a problem, with both the transfer of knowledge and technology from institutions of learning to places of industry, and the access to research provided to companies being low.
Government support for new businesses to acquire new technology also remains limited. These are endemic, long-term challenges, which have been consistently highlighted in previous surveys.
Having said this, every micro-indicator we measure improved its score in 2018 - although in general the improvements were small. By far the biggest change has been in new technology, science and knowledge being transferred from universities and public research centers to new and growing firms. This metric saw an increase from 2.4 in 2015 to 3.5 in 2018. There has also been an encouraging increase in the support available for engineers and scientists to have their ideas commercialized through new and growing firms, which has seen a substantial increase from 3.3 in 2015 to 4.0 in 2018. One area that remains low is government subsidies provided for new and growing firms to acquire new technology, which has virtually unchanged, ranging between 2.5 to 2.7 over the past four years.
Sources: The Authors; GEM Global Report 2018-19; GEM Egypt Reports 2015-16, 2016-17, 2017-18
Table 35: Research and Development Transfer in Egypt (2015 – 2018)
3.5
3.3
3.5
2.7
3.6
4.0
2.6
2.6
2.8
2.6
3.0
3.0
2.3
2.4
2.7
2.5
3.1
3.2
2.4
2.4
3.2
2.6
3.4
3.3
NEW TECHNOLOGY, SCIENCE, AND OTHER KNOWLEDGE ARE EFFICIENTLY TRANSFERRED FROM UNIVERSITIES AND PUBLIC RESEARCH CENTERS TO NEW AND GROWING FIRMS
NEW AND GROWING FIRMS HAVE JUST AS MUCH ACCESS TO NEW RESEARCH AND TECHNOLOGY AS LARGE, ESTABLISHED FIRMS
NEW AND GROWING FIRMS CAN AFFORD THE LATEST TECHNOLOGY
THERE ARE ADEQUATE GOVERNMENT SUBSIDIES FOR NEW AND GROWING FIRMS TO ACQUIRE NEW TECHNOLOGY
THE SCIENCE AND TECHNOLOGY BASE EFFICIENTLY SUPPORTS THE CREATION OF WORLD-CLASS NEW TECHNOLOGY-BASED VENTURES IN AT LEAST ONE AREA
THERE IS GOOD SUPPORT AVAILABLE FOR ENGINEERS AND SCIENTISTS TO HAVE THEIR IDEAS COMMERCIALIZED THROUGH NEW AND GROWING FIRMS
2018 2017 2016 2015

GEM Egypt National Report 18/19
COMMERCIAL AND LEGAL INFRASTRUCTURE A robust and accessible commercial and legal infrastructure is essential for new and growing firms to make use of services that allow them to organize, structure and grow their businesses. Having recourse to legal, accounting, banking and consulting services is an important part of a business being compliant with the law, and able to grow in the formal economy. Being able to access the services of subcontractors and suppliers for their businesses is also important for growth. Here, we measure the accessibility of such services for early-stage entrepreneurs. Overall, Egypt’s score in commercial and legal infrastructure is 4.5, ranking 37th out of 54 economies, slightly below the global average of 4.9, and the similar-income economies’ average of 4.8.
Over the past four years, we have seen an improvement in all the indicators for commercial and legal infrastructure in Egypt. Particularly, we have seen improvements in the access to banking services (up from 4.3 in 2015 to 5.0 in 2018), the supply of subcontractors and consultants (up from 4.7 in 2015 to 5.2 in 2018), and their affordability (up from 3.4 in 2015 to 4.1 in 2018).
Table 36: Commercial and Legal Infrastructure in Egypt (2015 – 2018)
5.2
4.1
4.1
4.7
5.0
4.6
3.4
3.7
4.2
4.0
4.2
3.3
3.7
4.3
3.8
4.7
3.4
3.8
4.6
4.3
Sources: The Authors; GEM Global Report 2018-19; GEM Egypt Reports 2015-16, 2016-17, 2017-18
THERE ARE ENOUGH SUBCONTRACTORS, SUPPLIERS, AND CONSULTANTS TO SUPPORT NEW AND GROWING FIRMS
NEW AND GROWING FIRMS CAN AFFORD THE COST OF USING SUBCONTRACTORS, SUPPLIERS, AND CONSULTANTS
IT IS EASY FOR NEW AND GROWING FIRMS TO GET GOOD SUBCONTRACTORS, SUPPLIERS, AND CONSULTANTS
IT IS EASY FOR NEW AND GROWING FIRMS TO GET GOOD, PROFESSIONAL LEGAL AND ACCOUNTING SERVICES
IT IS EASY FOR NEW AND GROWING FIRMS TO GET GOOD BANKING SERVICES (CHECKING ACCOUNTS, FOREIGN EXCHANGE TRANSACTIONS, LETTERS OF CREDIT, AND THE LIKE).
2018 2017 2016 2015
ENTREPRENEURSHIP ECOSYSTEM64
INTERNAL MARKET DYNAMICS
Internal market dynamics affect the ability of a new business to enter, compete and grow in an economy. GEM examines two areas of internal market dynamics: (i) market dynamics, which is the level of change in markets from year to year, as well as opportunities for new and growing firms created from expanding markets for products and services; and (ii) internal market burdens or entry regulations, i.e., the extent to which new and growing firms are free to enter existing markets considering the barriers to market entry created by high entry costs and blocked competition.
Overall, Egypt’s score in internal market dynamics is 5.1, ranking 25th out of 54 economies, compared to a global average of 5.2, and similar-income economies’ average of 5.1.

GEM Egypt National Report 18/19 ENTREPRENEURSHIP ECOSYSTEM 65
Egypt’s score in internal market burdens or entry regulations, meanwhile, is 4.4, ranking 24th out of 54 economies, compared to a global average of 4.2, and a similar-income economies’ average of 4.1.
In both areas, Egypt is close to the global average. Most scores in this area have also stayed roughly the same or improved slightly since 2015. There has been a significant positive improvement in new and growing firms being able to enter the market, with the score moving from 4.4 in 2015 to 5.1 in 2018. The affordability of market entry has also seen a positive increase, from 4.2 in 2015 to 4.7 in 2018. The perception of anti-trust legislation laws also continues to gradually improve.
Table 37: Internal Market Dynamics in Egypt (2015 – 2018)
5.9
5.6
4.7
4.3
3.9
3.6
5.3
4.9
4.9
4.3
4.1
3.0
5.2
5.0
4.4
4.2
4.0
3.3
Sources: The Authors; GEM Global Report 2018-19; GEM Egypt Reports 2015-16, 2016-17, 2017-18
2018 2017 2016 2015
THE MARKETS FOR CONSUMER GOODS AND SERVICES CHANGE DRAMATICALLY FROM YEAR TO YEAR
THE MARKETS FOR BUSINESS-TO-BUSINESS GOODS AND SERVICES CHANGE DRAMATICALLY FROM YEAR TO YEAR
NEW AND GROWING FIRMS CAN EASILY ENTER NEW MARKETS
NEW AND GROWING FIRMS CAN AFFORD THE COST OF MARKET ENTRY
NEW AND GROWING FIRMS CAN ENTER MARKETS WITHOUT BEING UNFAIRLY BLOCKED BY ESTABLISHED FIRMS
THE ANTI-TRUST LEGISLATION IS EFFECTIVE AND WELL ENFORCED
5.2
5.1
5.1
4.7
4.3
3.7
PHYSICAL INFRASTRUCTURE
Physical infrastructure describes the ease of access to physical resources, such as communication, utilities, transportation, ports or land. Crucially, it looks at whether this access is possible at a price that does not discriminate against new and growing firms. Overall, Egypt’s score in physical infrastructure is 6.5, ranking 26th out of 54 economies, compared to a global average of 6.3 and a similar-income economies’ average of 6.2. Physical infrastructure is an area where Egypt has been consistently strong. Egypt’s score in this area is the highest among all the ecosystem elements and ranks slightly above the global average. There have been improvements in virtually every area in the last year, with some being large leaps (the score for physical infrastructure itself has increased from 4.6 in 2017 to 5.6 in 2018) and others being smaller steps (the speed of access to utilities has moved from 6.4 in 2017 to 6.7 in 2018).
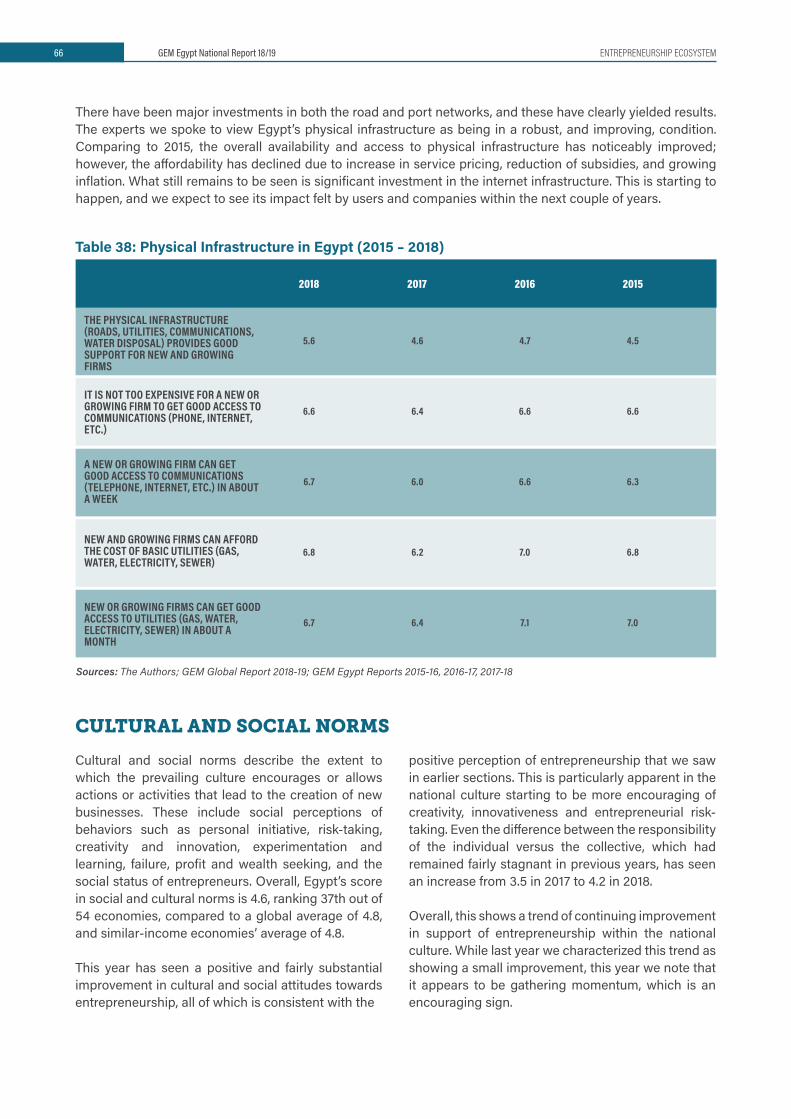
GEM Egypt National Report 18/19
There have been major investments in both the road and port networks, and these have clearly yielded results. The experts we spoke to view Egypt’s physical infrastructure as being in a robust, and improving, condition. Comparing to 2015, the overall availability and access to physical infrastructure has noticeably improved; however, the affordability has declined due to increase in service pricing, reduction of subsidies, and growing inflation. What still remains to be seen is significant investment in the internet infrastructure. This is starting to happen, and we expect to see its impact felt by users and companies within the next couple of years.
Table 38: Physical Infrastructure in Egypt (2015 – 2018)
5.6
6.6
6.7
6.8
6.7
4.6
6.4
6.0
6.2
6.4
4.7
6.6
6.6
7.0
7.1
4.5
6.6
6.3
6.8
7.0
Sources: The Authors; GEM Global Report 2018-19; GEM Egypt Reports 2015-16, 2016-17, 2017-18
THE PHYSICAL INFRASTRUCTURE (ROADS, UTILITIES, COMMUNICATIONS, WATER DISPOSAL) PROVIDES GOOD SUPPORT FOR NEW AND GROWING FIRMS
IT IS NOT TOO EXPENSIVE FOR A NEW OR GROWING FIRM TO GET GOOD ACCESS TO COMMUNICATIONS (PHONE, INTERNET, ETC.)
A NEW OR GROWING FIRM CAN GET GOOD ACCESS TO COMMUNICATIONS (TELEPHONE, INTERNET, ETC.) IN ABOUT A WEEK
NEW AND GROWING FIRMS CAN AFFORD THE COST OF BASIC UTILITIES (GAS, WATER, ELECTRICITY, SEWER)
NEW OR GROWING FIRMS CAN GET GOOD ACCESS TO UTILITIES (GAS, WATER, ELECTRICITY, SEWER) IN ABOUT A MONTH
2018 2017 2016 2015
ENTREPRENEURSHIP ECOSYSTEM66
CULTURAL AND SOCIAL NORMS
Cultural and social norms describe the extent to which the prevailing culture encourages or allows actions or activities that lead to the creation of new businesses. These include social perceptions of behaviors such as personal initiative, risk-taking, creativity and innovation, experimentation and learning, failure, profit and wealth seeking, and the social status of entrepreneurs. Overall, Egypt’s score in social and cultural norms is 4.6, ranking 37th out of 54 economies, compared to a global average of 4.8, and similar-income economies’ average of 4.8.
This year has seen a positive and fairly substantial improvement in cultural and social attitudes towards entrepreneurship, all of which is consistent with the
positive perception of entrepreneurship that we saw in earlier sections. This is particularly apparent in the national culture starting to be more encouraging of creativity, innovativeness and entrepreneurial risk-taking. Even the difference between the responsibility of the individual versus the collective, which had remained fairly stagnant in previous years, has seen an increase from 3.5 in 2017 to 4.2 in 2018.
Overall, this shows a trend of continuing improvement in support of entrepreneurship within the national culture. While last year we characterized this trend as showing a small improvement, this year we note that it appears to be gathering momentum, which is an encouraging sign.

GEM Egypt National Report 18/19 ENTREPRENEURSHIP ECOSYSTEM 67
Table 39: Cultural and Social Norms in Egypt (2015 – 2018)
5.0
4.3
3.5
3.8
3.5
5.3
4.0
3.5
3.6
3.9
5.0
4.0
3.4
3.4
3.7
Sources: The Authors; GEM Global Report 2018-19; GEM Egypt Reports 2015-16, 2016-17, 2017-18
2018 2017 2016 2015
THE NATIONAL CULTURE IS HIGHLY SUPPORTIVE OF INDIVIDUAL SUCCESS ACHIEVED THROUGH OWN PERSONAL EFFORTS
THE NATIONAL CULTURE EMPHASIZES SELF-SUFFICIENCY, AUTONOMY, AND PERSONAL INITIATIVE
THE NATIONAL CULTURE ENCOURAGES ENTREPRENEURIAL RISK-TAKING
THE NATIONAL CULTURE ENCOURAGES CREATIVITY AND INNOVATIVENESS
THE NATIONAL CULTURE EMPHASIZES THE RESPONSIBILITY THAT THE INDIVIDUAL (RATHER THAN THE COLLECTIVE) HAS IN MANAGING HIS OR HER OWN LIFE
5.5
4.6
4.0
4.4
4.2
In addition to the structured questions based on the entrepreneurship framework conditions, we provided open-ended questions for local experts to each raise three areas that either constrain or foster entrepreneurial activity in Egypt, as well as three recommendations to improve the entrepreneurship ecosystem, which we list below. Based on expert recommendations, several key themes emerge, which we explore further in the policy recommendations section.
Government bureaucracy remains a major constraint for entrepreneurs, as suggested by most of the 50 experts interviewed in 2018. They flag some laws and regulations, coupled with bureaucracy and red tape in their implementation. Experts acknowledge the regulatory reforms that were implemented over the last few years to support SMEs and startups; however, the negative impact of the government bureaucracy remains dominant.
Access to finance remains on a major challenge despite the noticeable improvement in this area over the past few years. Several initiatives by the Central Bank, MSMEDA, the Ministry of Trade and Industry, the Ministry of Investments, and other stakeholders were acknowledged. However, their size and scope remain limited, leaving a majority of SMEs lacking the funding needed to grow their businesses.
Access to talent is a growing challenge on several fronts. Technology-driven startups are competing for technical talent with regional and global markets and facing a significant brain drain. Other SMEs are challenged with limited education among the workforce, and the need for extensive on-the-job training. Overall, the traditional educational system is a key constraint for providing entrepreneurial workforce at all levels.
Access to market data is another key area where entrepreneurs are challenged. Micro-level market data is needed to guide the analysis of consumer behavior, product targeting and other marketing and sales activities.
Below are direct quotes from the expert surveys regarding the key constraints, opportunities and recommendations
EXPERTS VIEWS AND RECOMMENDATIONS

GEM Egypt National Report 18/19
Key factors constraining entrepreneurship in Egypt 1. Access to finance is still hindering entrepreneurial activity; not enough VCs and investments are being made and we’re yet to see banks and non-banking financial institutions facilitating sufficient access to debt, bank and non-financial products/services. Lack of investors (seed, angels and venture capital) and shortage of funds. Also, funding for startups based on opinions and not tangible proof. 2. Bureaucracy and regulation present the most challenges for entrepreneurs in Egypt. Regulatory constraints, especially in sectors like fintech, healthcare, or hardware. General understanding of the laws and regulations. Absence of a healthy legal, legislative and regulatory environment that is conducive to entrepreneurship and innovation.
3. There is a limited guidance, skill development channels for management and business planning skills.
4. Access to talent and the right skillsets of the entrepreneurs and of entrepreneurs’ teams.
5. Lack of market data and intelligence to guide entrepreneurs and investors.
6. Lack of education and training, as well as negative image and stigma about entrepreneurship. Quality of education in general and absence of entrepreneurship education.
7. The absence of support across the country, especially in rural areas and upper Egypt. Exposure to opportunities and entrepreneurs outside of Cairo and access for regional governorate to entrepreneurship programs.
8. Access to deep technical assistance and access to specialist advisory and mentorship. Although this is improving, still there is room for more improvement.
9. Stagnant culture, which is not supporting new ideas and initiatives, and incompetence across various sectors and industries. Additionally, inherited culture discouraging entrepreneurship (e.g. fear of risk, impact on opportunities for marriage without a secure job in the case of men, etc.).
ENTREPRENEURSHIP ECOSYSTEM68

GEM Egypt National Report 18/19 ENTREPRENEURSHIP ECOSYSTEM 69
Key factors fostering entrepreneurship in Egypt
Despite the previous constraints, national experts highlighted several factors that foster and encourage entrepreneurship in Egypt:
1. Concentration of support programs in certain geographies, e.g., Cairo.
2. Availability of angel investor networks and growth in number of incubators. This includes increasing number of hubs, venture capital firms and investors.
3. Government policies, as entrepreneurship is a priority in national development programs. The governmental agenda to push SMEs and raise formal employment in the country, as well as transparency and the national GDP.
4. Success stories, which help change the culture around entrepreneurship one step at a time, with a focus on international and regional success stories.
5. Culture that considers entrepreneurship as a worthy endeavor. Increased community / moral support for entrepreneurs and shifting positive perceptions of entrepreneurship and innovation / self-employment. Entrepreneurial activity is increasingly perceived to be a good career choice.
6. Universities are supportive to entrepreneurship development, including extracurricular activity in primary education.
7. Wide access to mobile internet and smart phones and national mobile wallet payment infrastructure. Money is available but there is a need for good committed entrepreneurs. Supportive legal and regulatory framework (easy establishment, access to land and production inputs, measures supporting access to national and international markets).
8. General recognition by policymakers of the importance of entrepreneurship to help solve key policy issues of unemployment, and diversifying banking sector exposure, although the effectiveness and approach are lacking.

Key recommendations to support entrepreneurship in Egypt
Experts also provided a set of recommendations that they believe will have the highest impact on growing entrepreneurship in the Egypt and supporting entrepreneurs::
1. Create policies and programs that look to longer term development rather than “quick wins”.
2.Provide better access to finance and credible information to investors, through building both a credit culture and sponsoring research coverage and information dissemination on less covered entities. Funding should not be based on ticket size but rather on validation.
3. Fewer government interventions; shift support to private organizations and effective implementation of governmental incentives (to be discussed with stakeholders before applied and to be followed up on periodically).
4. Structured collaboration between ecosystem players and encouragement of market linkages between large corporates and startups.
5.Invest in developing management capacity of entrepreneurs and developing more sector specific programs. Identify industry sectors (such as agritech, fintech) where Egypt can position itself as a regional hub.
6. Open accelerator for fintech inside the Central Bank.
7. Change culture through media and campaigns to promote entrepreneurship culture.
8. Programs should reach regional governorates and expand to governorates / bridge disparities in access to support programs.
9. Revamping of Nilex to ensure a better functioning market as opposed to its current status.
10. Expand and improve internet restructure (fiber optic last mile).
11. Programs to increase technological readiness, business sophistication and innovation support and promote grassroots innovations (in rural and informal settlements).
12. Providing market research at a low cost (somehow) as well as increasing marketing capabilities.
13. Focus on increasing exports and raising global competitiveness.
14. Government funding programs (zero expected returns) to train would-be venture capitalists and invest in a number of startups to create momentum.
15. Inclusion of corporates to create corporate Venture Capital.
16. Cultural overhaul, specifically with regard to weeding out incompetence and increasing accountability.
17. Allow PayPal and other international acceptance solutions needed by early stage startups in service exports.
18. Structured and accessible entrepreneurship education programs and boosting support for entrepreneurs in public education. Also, embed entrepreneurship and innovation education and training in all schools and universities.
GEM Egypt National Report 18/19 ENTREPRENEURSHIP ECOSYSTEM70


SECTION 5RECOMMENDATIONS FOR
POLICY AND PRACTICE
GEM Egypt National Report 18/1972

SECTION 5RECOMMENDATIONS FOR
POLICY AND PRACTICE

As the economy started to recover in 2018, it is important to continue and grow the pro-entrepreneurship policies and programs to leverage entrepreneurship as a driver for economic recovery and inclusive growth. In this section, we explore recommendations for policy and practice based on our research and practice.
Over the past three years, government policies and regulatory reforms were supportive for entrepreneurship. Several government regulatory reforms, policies and programs were implemented, and it is important to maintain the momentum in this area. On the regulatory side, a new investment law, bankruptcy law, industrial licensing regulations, and other regulatory reforms were implemented. The impact of these reforms was welcomed by the business community as it removed some of the bottlenecks and reduced red tape. However, most of these reforms were targeting large corporations and FDI, as opposed to micro, small and medium enterprises or technology startups. The biggest challenges facing those enterprises remains in the bureaucratic procedures required to operate on the ground, which typically add a financial and operational burden that is harder to manage for smaller and younger firms. Focusing on administrative reforms to reduce red tape, especially at the local level remains a priority.
For small and medium enterprises (SMEs), especially the ones operating in the manufacturing and retail sectors, they remain constrained by the bureaucracy at the local and municipal level, with many of them operating within the informal sector. These companies have major challenges relating to industrial licensing, operations, labor, industrial safety, and other regulations, mostly administered at the local or municipal level. These challenges have been persistent for long and are limiting the SMEs ability to grow jobs and exports.
Another area that is critical for startups and SMEs is the availability of market data. Several government agencies, especially CAPMAS has extensive databases that could help these companies make informed business decisions; however, most of these datasets are not made public or are not easily accessible. The need for a public data portal that is functioning and accessible is critical for the growth and efficiency of these companies.
Government programs are important to support SMEs as well as technology startups.
Several programs were introduced over time and their impact has been positive to the ecosystem. While many of these programs were pioneering when they were introduced, they have become redundant with other similar programs organized other support organizations, including universities, civil society organizations and companies. These government programs need to be redesigned to focus on gaps in the ecosystem that require the power and resources of the state, and to avoid crowding out other private programs and organizations.
Moreover, government programs should leverage the new mega-projects introduced by the state as enablers for Egyptian startups. For example, the new administrative capital, government digitalization initiative, renewable energy programs, large-scale agriculture programs – all can be used as a fertile ground to support and grow Egyptian startups by offering these startups contracts to introduce their new technologies in these projects.
Support organizations such as startup accelerators and incubators, training programs, co-working spaces, service providers and others act as the “enablers” for the entrepreneurship ecosystem. These support organizations may be civil society organizations, universities, governmental agencies or commercial entities. Over the past three years, there was an expansion in their entrepreneurial programs and in investments directed towards this sector.
Many of the current programs remain “generic” in nature and need to start building deeper specializations to remain relevant. Specifically, there is a need to create sector-focused and region-focused programs, supporting technological or industrial local clusters or ecosystems. Some of these focused programs started emerging in areas such as logistics and supply chain, social entrepreneurship, waste management, and agri-businesses. This specialization is particularly important for government-supported or donor-funded programs. This sectoral and/or regional focus is also important for the financial viability and sustainability of these support programs and organizations, as it creates strong stakeholders and business models.
Educational institutions provide entrepreneurial awareness and basic business skills education which are necessary for an entrepreneurial culture. Egypt ranks among the lowest in entrepreneurial education both at the basic education and university levels.
GEM Egypt National Report 18/19 RECOMMENDATIONS FOR POLICY AND PRACTICE74

GEM Egypt National Report 18/19 RECOMMENDATIONS FOR POLICY AND PRACTICE
On the basic education level and technical and vocational level, there is a need to include entrepreneurial behaviors and skills within the general educational curricula. This is taking place as part of the government’s ambitious educational reform program; however, it takes time for these reforms to be implemented. In the meantime, there are extracurricular programs that can provide the awareness and basic skills education that would be beneficial to support and widely expand.
On the higher education level, universities typically act as anchors for entrepreneurship ecosystems, providing talent as well as knowledge. More entrepreneurship training programs are needed within universities across Egypt. There are proposals for creating entrepreneurship centers and startup acceleration programs within these universities, but these require significant resources and long-term commitment. Some universities already started their own programs, such as The American University in Cairo, the Faculty of Economics and Political Science (FEPS) at Cairo University, Nile University, or the Arab Academy for Science, Technology & Maritime Transport. These programs need to be built on a foundation of research and development (R&D), where university research can be commercialized by faculty and students. Today, there is limited emphasis on or resources for R&D within most universities in Egypt.
Funding organizations including local and international foundations and development organizations play a significant role in filling the funding gap for many of the entrepreneurship programs through funding local implementing organizations, whether at the civil society, universities or companies. Significant resources were poured into this sector over the past five years from the US, Europe and other countries through several large-scale programs funded by USAID, the European Union, GIZ, ILO, and UNIDO, among others. These programs were successful in creating a boost for the sector; however, their visible impact on the ground was substantially less than the amounts of funds invested. Future programs need to learn from these lessons to ensure more effective usage of these investments.
Providing access to finance through the financial services sector is a key driver for promoting entrepreneurship. On the micro-finance side, there is a growth in the number of micro-finance institutions, especially for-profit companies. However, the availability of funding within this sector remains far below the market demand, and there is a visible need for more funding at this level (micro-loans below EGP 100,000), especially in rural areas. This need will grow as the interest rates decline and micro-loans become more affordable to broader segments. There is also a need to increase transaction costs (and hence interest rates) through the use of payment technologies in loan disbursement and collection, as well as credit rating technologies.
On the SME funding side, the Central Bank initiative to avail more funding at discounted rates through the banks has expanded the access to credit in this segment. However, banks still target larger companies within this segment, with limited funding available for smaller/younger SMEs. Informality and limited scoring and rating information limits SMEs capacity to access bank credit. More credit instruments such as factoring and leasing need to be further expanded, especially using digital payment solutions to reduce transaction costs.
On the venture capital side, where the funding is directed towards technology startups, there is a noticeable increase in the investments in this sector. Several venture capital funds launched, with investment tickets above EGP 10 million, and have made more than 50 investments within the EGP 10-30 million range. However, there is a visible gap in the seed funding stage with tickets between EGP 1-5 million. These investments are typically made by angel investors – a space that needs to be further developed to fill in this gap.
75

Digitalization is an emerging theme that is a key enabler for the transformation of the economy, i.e., using digital platforms and technologies to improve the efficiency of government services, supply chains, financial services or labor markets. This digital transformation is critical for the economy, and a big part of this transformation movement is driven by technology startups. Through technology platforms that deploy new and innovative business models, these startups have a strong potential for creating jobs, increasing productivity and promoting economic growth. Some examples of these technology-driven platforms include:
1) job search platforms for white-collar jobs (e.g., wuzzuf) or blue-collar jobs (e.g., forasna, felkhedma) can improve the efficiency of the labor market; 2) payment platforms, using mobile wallets and QR codes (e.g., paymob, fawry), which allow for digital payments and reduce informality;
3) supply chain platforms (e.g., maxab) that improve the efficiency of local supply chains in manufacturing and retail; 4) price discovery platforms (e.g., that create transparency in areas such as agricultural commodities improve the profitability of farmers;
5) logistics and transportation platforms (e.g., SWVL, trella) provide more cost-effective services and higher asset utilizations.
These technology startups have an economic and social impact that far exceeds their size or direct employment or financial impact, as they act as enablers for other sectors of the economy. Today, the major challenge for this sector is creating a conducive operating environment for fast-growing startups. A number of these startups are moving their headquarters outside of Egypt for a variety of reasons, including their limited ability to attract and employ foreign talent in Egypt under current employment laws; the limited flexibility in implementing and enforcing shareholding agreements, governance structures, investor protections and intellectual property rights; and the complexity of managing a multinational startup from Egypt. Accordingly, there are specific needs in the following areas to support these fast-growing regional startups:
1) reforming labor laws to allow for more flexibility in the employment of international staff; 2) relaxing visa regulations, especially for Africans to allow for pan-African startups operating from Egypt;
-introducing data protection regulations to provide a framework for data ownership, privacy and protection, especially as big data and artificial intelligence applications grow;
3) introducing a regulatory framework to allow for tech-focused shareholder agreements and investment instruments to be implemented and enforced in Egypt. The last investment law referred to this, but the governing regulations were not introduced by GAFI yet;
4) relaxing the restrictions on specific technologies that are becoming common globally and need to be activated in Egypt, e.g., drones (especially given their applications in agriculture), internet of things (IoT) and hardware-based startups, 3d printing and financial technologies (beyond payments).
Despite the success for the startup ecosystem in Egypt over the past decade, most startups that reach a certain size (usually around their series B investment round) end up relocating their headquarters to other countries due to the above challenges. Targeted policies to retain these startups are urgently needed.
GEM Egypt National Report 18/19 RECOMMENDATIONS FOR POLICY AND PRACTICE76

GEM Egypt National Report 18/19 RECOMMENDATIONS FOR POLICY AND PRACTICE 77

APPENDIXTABLES
GEM Egypt National Report 18/1978

APPENDIXTABLES

GEM Egypt National Report 18/19 Appendix Tables80
1. S
oci
etal
Val
ues
of
En
trep
ren
eurs
hip
, GE
M 2
018
– P
erce
nta
ge
of
Po
pu
lati
on
Ag
ed
18
-64
ENTR
EPRE
NEUR
SHIP
AS A
GOO
DCA
REER
CHO
ICE
HIGH
STA
TUS
TO S
UCCE
SSFU
LEN
TREP
RENE
URS
MED
IA
ATTE
NTIO
N FO
REN
TREP
RENE
URSH
IPEA
SY TO
STA
RT A
BU
SINE
SS
SCOR
E
RAN
K/47
SCOR
E
RANK
/43
INCO
ME
LEVE
LRE
GION
ECON
OMY
Low
Inco
me
High
Inco
me
High
Inco
me
Mid
dle I
ncom
e
Mid
dle I
ncom
e
High
Inco
me
High
Inco
me
Mid
dle I
ncom
e
Mid
dle I
ncom
e
High
Inco
me
High
Inco
me
Low
Inco
me
High
Inco
me
High
Inco
me
High
Inco
me
Mid
dle I
ncom
e
Low
Inco
me
Low
Inco
me
Mid
dle I
ncom
e
Mid
dle E
ast
and
Afric
a
Latin
Am
eric
aan
d th
e Car
ibbe
anEu
rope
and
Nort
h Am
eric
a
Latin
Am
eric
a and
the C
arib
bean
Euro
pe a
ndNo
rth
Amer
ica
Euro
pe a
ndNo
rth
Amer
ica
Latin
Am
eric
a and
the C
arib
bean
East
and
Sout
h As
ia
Latin
Am
eric
a and
the C
arib
bean
Euro
pe a
ndNo
rth
Amer
ica
Euro
pe a
nd N
orth
Am
eric
a
Mid
dle E
ast a
ndAf
rica
Euro
pe a
nd N
orth
Am
eric
a
Euro
pe a
nd N
orth
Am
eric
a
Euro
pe a
nd N
orth
Am
eric
a
Latin
Am
eric
a and
the C
arib
bean
East
and
Sou
thAs
ia
East
and
Sou
thAs
ia
Mid
dle E
ast a
ndAf
rica
74.4
59.4
50.2 -
62.6
64.1
76.1
60.8
68.7
62.1
69.9
74.0
58.2
49.6
64.9
94.4
63.7
71.9
39.3
9 30 38 N/A 26 22 8 29 15 27 13T 10 32 39 21 1 24 11 45
80.5
50.0
75.3 -
69.3
74.1
60.8
68.7
84.2
43.0
67.6
82.6
71.5
74.8
67.8
71.7
65.0
74.9
80.5
7T 43 17 N/A 29 22 39 30 3 47 34 5 25 19 33 24 36 18 7T
68.6
44.9
64.6 -
44.6
76.0
62.5
68.1
62.4
53.7
54.3
68.1
52.8
50.6
50.1
54.1
52.1
80.4
50.8
13 46 18 N/A 47 6 21 14T 22 31 27T
14T 33 38 39 29 36 3 37
55.0
23.4 - - 14.3
51.5
36.5
17.3
39.2
16.4
41.4
61.5
36.6 - 12.2
35.7
52.9
66.0
12.7
10T 33 N/A
N/A 41 15 23 38 20T
40 19 7 22 N/A
43 24 13 4 42
Ango
la
Arge
ntin
a
Aust
ria
Braz
il
Bulg
aria
Cana
da
Chile
Chin
a
Colo
mbi
a
Croa
tia
Cypr
us
Egyp
t
Fran
ce
Germ
any
Gree
ce
Guat
emal
a
Indi
a
Indo
nesi
a
Iran
SCOR
E
RAN
K/47
SCOR
E
RAN
K/47

GEM Egypt National Report 18/19 Appendix Tables 81
High
Inco
me
High
Inco
me
High
Inco
me
High
Inco
me
High
Inco
me
Mid
dle I
ncom
e
High
Inco
me
Low
Inco
me
Low
Inco
me
High
Inco
me
High
Inco
me
Mid
dle I
ncom
e
High
Inco
me
High
Inco
me
High
Inco
me
Mid
dle I
ncom
e
High
Inco
me
High
Inco
me
High
Inco
me
High
Inco
me
Low
Inco
me
High
Inco
me
High
Inco
me
Euro
pe a
nd N
orth
Am
eric
a
Mid
dle E
ast a
ndAf
rica
Euro
pe a
nd N
orth
Am
eric
a
East
and
Sou
thAs
ia
East
and
Sou
thAs
ia
Mid
dle E
ast a
ndAf
rica
Euro
pe a
nd N
orth
Am
eric
a
Mid
dle E
ast a
ndAf
rica
Mid
dle E
ast a
ndAf
rica
Euro
pe a
nd N
orth
Am
eric
aLa
tin A
mer
ica a
nd
the C
arib
bean
Latin
Am
eric
a and
th
e Car
ibbe
an
Euro
pe a
nd N
orth
Am
eric
a
Latin
Am
eric
a and
the C
arib
bean
Mid
dle E
ast a
ndAf
rica
Euro
pe a
nd N
orth
Am
eric
aM
iddl
e Eas
t and
Afric
a
Euro
pe a
nd N
orth
Am
eric
aEu
rope
and
Nor
th
Amer
ica
Euro
pe a
nd N
orth
Am
eric
a
Mid
dle E
ast a
ndAf
rica
Euro
pe a
nd N
orth
Am
eric
aEu
rope
and
Nor
th
Amer
ica
Irela
nd
Isra
el
Italy
Japa
n
Kore
a Rep
.
Leba
non
Luxe
mbo
urg
Mad
agas
car
Mor
occo
Neth
erla
nds
Pana
ma
Peru
Pola
nd
Puer
to R
ico
Qata
r
Russ
ian
Fede
ratio
n
Saud
i Ara
bia
Slov
ak R
epub
lic
Slov
enia
Spai
n
Suda
n
Swed
en
Switz
erla
nd
55.5
66.0
63.9
22.8
53.0 -
48.8
87.2
61.1
81.7
44.6
65.7
85.9
20.7
68.2
68.0
66.8
46.9
58.4
53.1
79.4
49.0
46.5
34 19 23 46 37 N/A 41 2 28 4 44 20 3 47 16 17 18 42 31 36 7 40 43
83.9
85.0
74.6
51.5
70.0 - 74.2
77.0
68.3
63.1
46.3
62.4
76.3
52.6
76.7
68.0
78.2
60.4
75.8
49.8
85.3
72.1
69.7
4 2 20 42 26 N/A 21 11 31 37T
46 38 15 41 12 32 10 40 16 44 1 23 27
73.4
54.3
60.2
59.4
67.1 -
49.3
56.7
52.2
64.8
45.2
72.0
46.2
80.9
64.2
49.0
71.4
53.9
77.2
49.4
70.8
62.8
47.7
8 27T
23 24 16 N/A 41 26 35 17 45 10 44 2 19 42 11 30 4 40 12 20 43
- 17.9
16.8
26.8
33.5 -
55.0
32.7
26.8
74.7
45.3
52.6
74.1
24.3
51.1
21.3
64.8
18.8
39.2
29.6
53.6
74.0
57.9
N/A 37 39 29T
25 N/A
10T 26 29T 1 18 14 2 31 16 34 6 36 20T
27 12 3 9

GEM Egypt National Report 18/19 Appendix Tables82
High
Inco
me
Mid
dle I
ncom
e
Mid
dle I
ncom
e
High
Inco
me
High
Inco
me
High
Inco
me
High
Inco
me
East
and
Sou
thAs
iaEa
st a
nd S
out
Asia
Euro
pe a
nd N
orth
Am
eric
a
Mid
dle E
ast a
ndAf
rica
Euro
pe a
nd N
orth
Am
eric
a
Euro
pe a
nd N
orth
Am
eric
a
Latin
Am
eric
a and
the C
arib
bean
Taiw
an
Thai
land
Turk
ey
Unite
d Ar
ab E
mira
tes
Unite
d Ki
ngdo
m
Unite
d St
ates
Urug
uay
69.6
80.1
80.8
71.7
56.1
62.7
54.7
62.4
13T 6 5 12 33 25 35
63.1
80.9
66.1
69.4
76.4
78.7
49.6
69.5
37T 6 35 28 13T 9 45
76.4
86.8
52.6
72.5
58.5
74.4
53.1
60.9
5 1 34 9 25 7 32
24.2
65.8
28.9
59.7 -
45.5
19.8
39.7
32 5 28 8 N/A 17 35
Sour
ces:
GEM
Glo
bal R
epor
t 201
8/19
PERC
EIVE
DOP
PORT
UNIT
IES
PERC
EIVE
D CA
PABI
LITI
ES
FEAR
OF F
AILU
RE
(% O
F 18-
64 S
EEIN
G OP
PORT
UNIT
IES)
ENTR
EPRE
NEUR
IAL
INTE
NTIO
NS(%
OF 1
8-64
, NO
N-EN
TREP
RENE
URS)
SCOR
E
RAN
K/49
REGI
ONEC
ONOM
YM
iddl
e Eas
tan
d Af
rica
Latin
Am
eric
aan
d th
e Car
ibbe
anEu
rope
and
Nort
h Am
eric
a
Latin
Am
eric
a and
the C
arib
bean
Euro
pe a
ndNo
rth
Amer
ica
Euro
pe a
ndNo
rth
Amer
ica
Latin
Am
eric
a and
the C
arib
bean
East
and
Sout
h As
ia
Latin
Am
eric
a and
the C
arib
bean
74.0
35.9
46.8
31.4
19.3
63.0
61.8
35.1
57.5
3 33 21 40 47 9 10 35 11
16.6
31.9
36.7
32.6
31.0
42.3
28.6
41.7
23.1
49 32 20 29T
34 12 40 13 45
56.7
36.9
39.7
34.4
33.5
39.9
42.1
45.7
42.1
4 25 20 31 33 19 15T 10 15T
79.8
14.8
11.8
26.1
3.9
14.5
48.7
15.3
48.8
1 32 37 19 48 34 6 29T 5
Ango
la
Arge
ntin
a
Aust
ria
Braz
il
Bulg
aria
Cana
da
Chile
Chin
a
Colo
mbi
a
2. S
elf-
Per
cep
tio
n V
alu
es o
f E
ntr
epre
neu
rsh
ip G
EM
20
18 –
Per
cen
tag
e o
f P
op
ula
tio
n A
ge
d 1
8-6
4
PERS
ONAL
LY K
NOW
AN
ENTR
EPRE
NEUR
SCOR
E
RAN
K/49
SCOR
E
RAN
K/49
SCOR
E
RAN
K/49
SCOR
E
RAN
K/49
75.7
48.8
48.3
54.3
36.9
55.9
62.5
24.2
66.4
2 25 27 14 42 12 9 48 6

GEM Egypt National Report 18/19 Appendix Tables 83
Croa
tia
Cypr
us
Egyp
t
Fran
ce
Germ
any
Gree
ce
Guat
emal
a
Indi
a
Indo
nesi
a
Iran
Irela
nd
Isra
el
Italy
Japa
n
Kore
a Rep
.
Leba
non
Luxe
mbo
urg
Mad
agas
car
Mor
occo
Neth
erla
nds
Pana
ma
Peru
Pola
nd
Euro
pe a
ndNo
rth
Amer
ica
Euro
pe a
nd N
orth
Am
eric
a
Mid
dle E
ast a
ndAf
rica
Euro
pe a
nd N
orth
Am
eric
a
Euro
pe a
nd N
orth
Am
eric
a
Euro
pe a
nd N
orth
Am
eric
a
Latin
Am
eric
a and
the C
arib
bean
East
and
Sou
thAs
ia
East
and
Sou
thAs
ia
Mid
dle E
ast a
ndAf
rica
Euro
pe a
nd N
orth
Am
eric
a
Mid
dle E
ast a
ndAf
rica
Euro
pe a
nd N
orth
Am
eric
a
East
and
Sou
thAs
ia
East
and
Sou
thAs
ia
Mid
dle E
ast a
ndAf
rica
Euro
pe a
nd N
orth
Am
eric
a
Mid
dle E
ast a
ndAf
rica
Mid
dle E
ast a
ndAf
rica
Euro
pe a
nd N
orth
Am
eric
aLa
tin A
mer
ica a
nd
the C
arib
bean
Latin
Am
eric
a and
th
e Car
ibbe
an
Euro
pe a
nd N
orth
Am
eric
a
33.1
45.9
39.3
35.0
42.1
19.2
54.6
49.8
54.9
22.3
51.7
56.2
34.6 8.1
45.7
42.0
55.0
30.6
33.6
66.7
39.0
56.0
68.5
39 22 30 36 28 48 16 20 15 46 18 12 37 49 23 29 14 41 38 7 31 13 6
52.3
45.9
43.0
37.5
38.3
46.4
65.2
52.2
64.0
53.1
45.6
41.5
29.8
10.1
49.7
68.1
43.9
51.5
29.5
46.1
42.1
71.8
46.6
18T 33 36 41 40 31 7 20 8 17 34 38 44 49 24 5 35 21 45 32 37 4 29T
30.3
48.5
28.2
37.1
35.1
57.8
30.3
50.1
34.1
30.4
39.3
47.5
51.7
46.4
32.8
22.4
47.2
36.6
64.2
34.7
19.4
30.2
31.1
36T 6 41 19 24 3 36T 5 27 35 16 7 4 9T 28 46 8 21 1 25 48 38 33
34.6
33.2
11.7
33.2
23.7
23.5
42.8
31.5
72.2
44.5
32.4
56.1
26.0
19.4
43.5
53.1
35.3
53.5
34.1
36.0
56.2
53.2
40.1
30 36T
49 36T
45 46 14 39 2 12 38 6 43 47 13 9 28 7 32 26 5 8 18
18.6
15.3
59.8
18.6 5.9 7.5 49.7
20.6
21.2
35.0
15.4
26.2
9.0
5.0
31.0
29.1
14.7
32.6
39.8 7.7 18.9
39.7
9.5
26T
29T 3 26T
46 42 4 24 23 10 28 18 40 47 13 15T 33 11 7 41 25 8 39

GEM Egypt National Report 18/19 Appendix Tables84
Puer
to R
ico
Qata
r
Russ
ian
Fede
ratio
n
Saud
i Ara
bia
Slov
ak R
epub
lic
Slov
enia
Spai
n
Suda
n
Swed
en
Switz
erla
nd
Taiw
an
Thai
land
Turk
ey
Unite
d Ar
ab E
mira
tes
Unite
d Ki
ngdo
m
Unite
d St
ates
Urug
uay
Latin
Am
eric
a and
th
e Car
ibbe
an
Mid
dle E
ast a
ndAf
rica
Euro
pe a
nd N
orth
Am
eric
a
Mid
dle E
ast a
ndAf
rica
Euro
pe a
nd N
orth
Am
eric
a
Euro
pe a
nd N
orth
Am
eric
a
Euro
pe a
nd N
orth
Am
eric
a
Mid
dle E
ast a
ndAf
rica
Euro
pe a
nd N
orth
Am
eric
a
Euro
pe a
nd N
orth
Am
eric
a
East
and
Sou
thAs
ia
East
and
Sou
thAs
ia
Euro
pe a
nd N
orth
Am
eric
a
Mid
dle E
ast a
ndAf
rica
Euro
pe a
nd N
orth
Am
eric
a
Euro
pe a
nd N
orth
Am
eric
a
Latin
Am
eric
a and
th
e Car
ibbe
an
35.2
54.2
22.8
76.3
37.4
42.2
29.1
71.0
81.6
45.5
26.7
50.1
44.3
66.5
44.0
69.8
28.9
34 17 45 2 32 27 42 4 1 24 44 19 25 8 26 5 43
47.5
52.3
27.5
83.4
53.3
51.0
48.5
74.5
38.4
36.3
28.2
51.0
56.8
53.6
46.6
55.6
59.0
28 18T 47 1 16 22T
26 3 39 43 46 22T 11 15 29T 13 10
20.7
32.6
46.4
43.6
29.4
32.0
36.2
34.5
37.2
39.9
41.4
58.9
28.1
24.3
37.7
35.2
27.4
47 29T
9T 11 39 31 22 26 18 15 14 2 42 44 17 23 43
18.4
44.9
35.7
79.1
35.0
38.5
33.4
59.3
39.2
28.4
41.0
29.3
25.3
27.9
33.3
38.5
38.3
48 11 27 1 29 22T
34 3 21 41 17 40 44 42 35 22T
24
22.9
29.1
2.2
26.8
13.7
15.3 6.2
66.7
9.6
6.9
24.1
31.5
29.7
38.2 7.2 12.2
24.2
22 15T 49 17 35 29T
45 2 38 44 21 12 14 9 43 36 20
Sour
ces:
GEM
Glo
bal R
epor
t 201
8/19

GEM Egypt National Report 18/19 Appendix Tables 85
3. P
has
es a
nd
Ty
pes
of
En
trep
ren
euri
al A
ctiv
ity,
GE
M 2
018
–
Per
cen
tag
e o
f P
op
ula
tio
n A
ge
d 1
8-6
4
NASC
ENT
ENTR
EPRE
NEUR
SHIP
RA
TE
NEW
BUS
INES
S OW
NERS
HIP
RATE
EARL
Y-ST
AGE
ENTR
EPRE
NEUR
IAL
ACTI
VITY
(TEA
)
EMPL
OYEE
EN
TREP
RENE
URIA
L AC
TIVI
TY
EEA
INCO
ME
LEVE
LRE
GION
ECON
OMY
Low
Inco
me
High
Inco
me
High
Inco
me
Mid
dle I
ncom
e
Mid
dle I
ncom
e
High
Inco
me
High
Inco
me
Mid
dle I
ncom
e
Mid
dle I
ncom
e
High
Inco
me
High
Inco
me
Low
Inco
me
High
Inco
me
High
Inco
me
High
Inco
me
Mid
dle I
ncom
e
Low
Inco
me
Low
Inco
me
Mid
dle I
ncom
e
Mid
dle E
ast
and
Afric
a
Latin
Am
eric
aan
d th
e Car
ibbe
anEu
rope
and
Nort
h Am
eric
a
Latin
Am
eric
a and
the C
arib
bean
Euro
pe a
ndNo
rth
Amer
ica
Euro
pe a
ndNo
rth
Amer
ica
Latin
Am
eric
a and
the C
arib
bean
East
and
Sout
h As
ia
Latin
Am
eric
a and
the C
arib
bean
Euro
pe a
ndNo
rth
Amer
ica
Euro
pe a
nd N
orth
Am
eric
a
Mid
dle E
ast a
ndAf
rica
Euro
pe a
nd N
orth
Am
eric
a
Euro
pe a
nd N
orth
Am
eric
a
Euro
pe a
nd N
orth
Am
eric
a
Latin
Am
eric
a and
the C
arib
bean
East
and
Sou
thAs
ia
East
and
Sou
thAs
ia
Mid
dle E
ast a
ndAf
rica
22.8
4.9
6.8 1.7 2.4
11.2
16.0 4.7
15.7
5.8 1.2 4.0
4.0 2.7
4.2
13.7
8.8 3.1
4.1
1 28 21T 48 47 6 3 29 4 25 49 36T
36T
43T
31T 5 13 41 33T
19.5 4.3
4.4
16.4 3.7
8.9
10.1
5.9
5.8
3.9
2.7
5.9
2.3
2.4
2.3
15.0 2.7
11.1
5.7
1 26 25 3 31T 10 9 17T
19T
28T
40T
17T
45T
44 45T 4 40T 7 21
3.2 1.5 6.4
0.7
0.4
8.6
4.2 1.0 2.0
5.3
5.4 2.1
4.3
5.2 1.8 2.0
0.8 1.3 0.9
25T
39T 9 45T
48 1T 21T 42 32T 15 14 31 19T 16 36 32T
44 41 43
15.2 9.1
6.5
20.3
8.4 7.5 8.5
3.2
6.5
4.2 6.1
4.5
2.5 7.5 10.8
11.2
7.0 11.8
12.3
5 16 27T 3 19T
22T 18 45 27T
40T
33T
39 48 22T 14 13 24 11 9
Ango
la
Arge
ntin
a
Aust
ria
Braz
il
Bulg
aria
Cana
da
Chile
Chin
a
Colo
mbi
a
Croa
tia
Cypr
us
Egyp
t
Fran
ce
Germ
any
Gree
ce
Guat
emal
a
Indi
a
Indo
nesi
a
Iran
ESTA
BLIS
HED
BUSI
NESS
OW
NERS
HIP
RATE
DISC
ONTI
NUAT
ION
OF B
USIN
ESSE
S
SCOR
E
RAN
K/49
SCOR
E
RAN
K/49
SCOR
E
RAN
K/49
SCOR
E
RAN
K/49
SCOR
E
RAN
K/49
SCOR
E
RAN
K/49
40.8 9.1
10.9
17.9
6.0
18.7
25.1
10.4
21.2 9.6
3.9
9.8 6.1
5.0
6.4
27.5
11.4
14.1
9.7
1 33 24 11 43 10 3 27 7 30T
49 28 42 47 39T 2 23 16 29
25.5
3.9
5.0
4.3 1.8 8.6 7.1 2.5
4.7
3.4
2.3 7.6 2.9 1.6 3.4 7.4 4.9 1.4 6.1
1 24 17T
22T
43T 4 11 36T
20T
29T 41 8T 34 46T
29T 10 19 49 13

GEM Egypt National Report 18/19 Appendix Tables86
High
Inco
me
High
Inco
me
High
Inco
me
High
Inco
me
High
Inco
me
Mid
dle I
ncom
e
High
Inco
me
Low
Inco
me
Low
Inco
me
High
Inco
me
High
Inco
me
Mid
dle I
ncom
e
High
Inco
me
High
Inco
me
High
Inco
me
Mid
dle I
ncom
e
High
Inco
me
High
Inco
me
High
Inco
me
High
Inco
me
Low
Inco
me
High
Inco
me
High
Inco
me
Euro
pe a
ndNo
rth
Amer
ica
Mid
dle E
ast a
ndAf
rica
Euro
pe a
ndNo
rth
Amer
ica
East
and
Sout
h As
ia
East
and
Sou
thAs
ia
Mid
dle E
ast a
ndAf
rica
Euro
pe a
nd N
orth
Am
eric
a
Mid
dle E
ast a
ndAf
rica
Mid
dle E
ast a
ndAf
rica
Euro
pe a
nd N
orth
Am
eric
a
Latin
Am
eric
a and
the C
arib
bean
Latin
Am
eric
a and
the C
arib
bean
Euro
pe a
nd N
orth
Am
eric
a
Latin
Am
eric
a and
the C
arib
bean
Mid
dle E
ast a
ndAf
rica
Euro
pe a
nd N
orth
Am
eric
a
Mid
dle E
ast a
ndAf
rica
Euro
pe a
nd N
orth
Am
eric
a
Euro
pe a
nd N
orth
Am
eric
a
Euro
pe a
nd N
orth
Am
eric
a
Mid
dle E
ast a
ndAf
rica
Euro
pe a
nd N
orth
Am
eric
a
Euro
pe a
nd N
orth
Am
eric
a
6.5 7.9 2.7
3.3
6.8
6.9 7.1 10.3 3.3
6.0 7.4 17.5
4.1
9.1
5.0 2.7
5.3
9.2
2.8 2.7
10.3 4.6 4.1
23 14 43T
38T
21T 20 18T 9T 38T
24 15T 2 33T 12 27 43T
26 11 42 43T
9T 30 33T
3.2
4.8 1.6 2.2
7.9 17.6
3.7
10.9 3.5
6.5
6.6
5.8 1.1 2.6
3.6
2.9
6.9 3.1
3.6
3.8
12.6 2.5
3.4
37 24 48 47 11 2 31T 8 35 15T 14 19T 49 42 33T
39 13 38 33T
30 6 43 36
8.6 7.2 3.2
2.2
3.6 1.7 7.1 0.6
4.8 7.9 0.0 1.5 1.9 1.9 6.3
0.7
2.8
4.4
5.9 1.7 4.3
6.8
6.3
1T 6 25T
30 23 37T 7 47 17 4 49 39T
34T
34T
10T
45T
28 18 13 37T
19T 8 10T
6.8
4.2
6.4
6.2
12.5
21.6 3.4
22.4
4.2
12.0 6.4
8.4
13.0 1.9 4.2
4.9 3.1
4.6
6.8 6.1
10.2 5.3
11.5
25T
40T
29T
32 8 2 44 1 40T
10 29T
19T 7 49 40T
37 46 38 25T
33T 15 36 12
Irela
nd
Isra
el
Italy
Japa
n
Kore
a Rep
.
Leba
non
Luxe
mbo
urg
Mad
agas
car
Mor
occo
Neth
erla
nds
Pana
ma
Peru
Pola
nd
Puer
to R
ico
Qata
r
Russ
ian
Fede
ratio
n
Saud
i Ara
bia
Slov
ak R
epub
lic
Slov
enia
Spai
n
Suda
n
Swed
en
Switz
erla
nd
9.6
12.7
4.2
5.3
14.7
24.1
10.7
20.7
6.7
12.3
13.8
22.4
5.2
11.6
8.5
5.6
12.1
12.1
6.4
6.4
22.2
6.8 7.4
30T 18 48 45 14 4 25T 8 38 19 17 5 46 22 34 44 20T
20T
39T
39T 6 37 36
3.8
5.0 1.6 1.8 2.5
8.0 3.7
4.3
10.4 2.5
3.4 7.6 2.4 3.1
3.0 1.6 8.5
3.6
2.4 1.7 17.3
3.7
2.0
25 17T
46T
43T
36T 7 26T
22T 3 36T
29T
8T 39T
32 33 46T 5 28 39T
45 2 26T
42

GEM Egypt National Report 18/19 Appendix Tables 87
High
Inco
me
Mid
dle I
ncom
e
Mid
dle I
ncom
e
High
Inco
me
High
Inco
me
High
Inco
me
High
Inco
me
East
and
Sout
h As
ia
East
and
Sou
thAs
ia
Euro
pe a
nd N
orth
Am
eric
a
Mid
dle E
ast a
ndAf
rica
Mid
dle E
ast a
ndAf
rica
Euro
pe a
nd N
orth
Am
eric
a
Latin
Am
eric
a and
the C
arib
bean
3.2
7.3 7.4 7.1 4.2
10.5 11.1
40 17 15T
18T
31T 8 7
6.5
13.2 7.1 3.9
4.2
5.3
4.9
15T 5 12 28T
27 22 23
4.2
2.4
3.2
6.3 7.3 8.0
3.5
21T 29 25T
10T 5 3 24
13.9
19.6 8.7
2.6
6.4 7.9 5.6
6 4 17 47 29T 21 35
Taiw
an
Thai
land
Turk
ey
Unite
d Ar
ab E
mira
tes
Unite
d Ki
ngdo
m
Unite
d St
ates
Urug
uay
9.5
19.7
14.2
10.7
8.2
15.6
15.7
32 9 15 25T
35 13 12
5.4 8.1
5.2 5.1
2.7
4.7
6.6
14 6 15 16 35 20T 12
Sour
ces:
GEM
Glo
bal R
epor
t 201
8/19
4. R
easo
ns
for
Ex
itin
g a
Bu
sin
ess
in t
he
Pre
vio
us
Yea
r, G
EM
20
18 –
P
erce
nta
ge
of
Th
ose
Ex
itin
g a
Bu
sin
ess
in t
he
Pre
vio
us
Ye
ar
SOLD
THE
BUSI
NESS
UNPR
OFIT
ABLE
PROB
LEM
SW
ITH
FINA
NCE
ANOT
HER
OPPO
RTUN
ITY
INCO
ME
LEVE
LRE
GION
ECON
OMY
Low
Inco
me
High
Inco
me
High
Inco
me
Mid
dle I
ncom
e
Mid
dle I
ncom
e
High
Inco
me
High
Inco
me
Mid
dle I
ncom
e
Mid
dle I
ncom
e
High
Inco
me
Mid
dle E
ast
and
Afric
a
Latin
Am
eric
aan
d th
e Car
ibbe
anEu
rope
and
Nort
h Am
eric
a
Latin
Am
eric
a and
the C
arib
bean
Euro
pe a
ndNo
rth
Amer
ica
Euro
pe a
ndNo
rth
Amer
ica
Latin
Am
eric
a and
the C
arib
bean
East
and
Sout
h As
ia
Latin
Am
eric
a and
the C
arib
bean
Euro
pe a
ndNo
rth
Amer
ica
3.2
6.9
15.7
8.2
0.0
23.9 1.1 2.7
0.5
0.6
28T 16 5 11T 47T 2 44 33T
46 45
25.8
42.0
18.4
40.1
57.7
25.0
27.5
28.3
35.8
19.7
27 10 43 11 2 29 26 24 17 39
Ango
la
Arge
ntin
a
Aust
ria
Braz
il
Bulg
aria
Cana
da
Chile
Chin
a
Colo
mbi
a
Croa
tia
EXIT
INCI
DENT
SCOR
E RA
NK/4
9
RETI
REM
ENT
PERS
ONAL
REAS
ONS
GOVE
RNM
ENT/
TAX P
OLIC
Y/BU
REAU
CRAC
Y
SCOR
E RA
NK/4
9SC
ORE
RANK
/49
SCOR
E RA
NK/4
9SC
ORE
RANK
/49
SCOR
E RA
NK/4
9SC
ORE
RANK
/49
SCOR
E RA
NK/4
9SC
ORE
RANK
/49
38.5
4.9
13.3 7.2 22.7
13.3
14.8
21.3
14.7 7.4
1 45 21T 37 10 21T 16 12 17 35T
4.5
10.0 11.1
10.3 8.4
11.5
13.5 9.8
14.9
18.5
44 24 16T 22 30T
14T 9 25T 7 5
2.1
5.8
5.5
5.7
0.0 2.7
2.5
3.4
4.7
1.9
27T 11 14T
12T
42T
24 26 23 18 31T
0.4 1.4 6.8
0.0
0.0
5.0
0.2
6.3
0.0 9.1
38 34T 10 41T
41T 18 40 11T 41T 8
14.6
18.1
17.2
20.8
2.7
11.9
35.3
23.1
19.1
16.5
35 23 27 20 49 40 2 15 22 29
9.1
2.1
5.8 7.7 0.0
3.0 3.7
3.8
2.9 7.1
6 33T 14 10 42T
25T 21 20 27 12
1.8 8.7
6.1
0.0
8.4
3.7
1.5 1.4 7.5 19.2
36T 12 21 47T
13T 31 39T
42 17T 4

GEM Egypt National Report 18/19 Appendix Tables88
14T 43 27 26 31 39 24 8 41 18T
11T 35 33T
18T 38 4 47T 1 36 30 22 21 47T
20.8
42.3
19.3
16.0
44.5
39.2
44.6
11.3
35.2
21.8
36.6
19.1
25.5
39.5
51.1
14.4
37.0
30.9
12.7
55.4
31.2
24.2
17.2
38 9 40 45 8 13 6T 49 18T 37 16 41 28 12 5 46 15 22 48 3 21 31T 44
25.2
21.8
31.1
16.6 5.8
10.6
28.9
30.8
28.6
14.1
9.4
13.0 8.7
10.9 7.1 5.8
4.0
10.7
8.6
10.8
11.9
5.3 6.1
7 11 3 15 41T 30 5 4 6 18 31 23 32 26 38 41T 47 28T
33 27 24 44 40
4.6
4.9
8.0
13.1
3.3
10.1
7.4 17.1
10.6
13.1
8.3
0.0
8.2
8.5
6.4
9.8
2.3
2.2
34.3
10.8
19.3
13.7 8.1
43 42 35T
10T 45 23 37T 6 20T
10T 32 48T
33 29 40 25T
46 47 1 19 4 8 34
0.0 1.4 1.9 1.9 0.0 1.0 1.0 4.4 2.1
2.1
1.2 6.5
9.0
4.4
9.9
8.3
2.6
0.0
6.0
0.0 1.4 7.9 6.0
42T
34T
31T
31T
42T
40T
40T
19T
27T
27T 37 8 4 19T 3 6 25 42T
9T 42T
34T 7 9T
5.4
0.0
5.2
6.0
10.9 0.0
0.3
13.6 4.9
5.2
3.5
6.3
0.0 2.1
7.8 3.7
0.0 1.2 1.4 1.5 2.3
9.5
2.4
15 41T
16T
13T 3 41T 39 1 19 16T 23 11T 41T
30T 9 22 41T 37 34T
33 28T
6T 27
27.1
17.5
15.5
28.4
11.4
26.2 7.2 9.4
14.1
31.5
16.4
26.6
25.9
21.7
5.6
24.4
36.4
6.8
28.6
16.9
25.5
16.3
22.9
6 25T
33 5 42 8T 44T
43 36 3 30 7 10 18 47 12 1 46 4 28 11 31T 16
2.4
3.5
4.3 7.6 0.0
0.5
4.4
0.0 1.9 1.5 3.5
4.8
19.9 2.1
5.0
6.9
17.7
0.3
2.6
0.0 1.9 9.5
27.3
32 22T 19 11 42T
39T 18 42T
35T
37 22T 17 2 33T
15T 13 3 41 29T
42T
35T 5 1
7.5 7.3 11.3
6.3
21.1
10.5 1.5 2.0 1.0 4.1
12.9
21.1
0.0 4.1
5.0
10.6 0.0
0.3
3.2 1.5 1.3 8.4
9.9
17T 19 7 20 2T 9 39T
35 44 26T 6 2T 47T
26T
24 8 47T
46 32 39T
43 13T
10T
High
Inco
me
Low
Inco
me
High
Inco
me
High
Inco
me
High
Inco
me
Mid
dle I
ncom
e
Low
Inco
me
Low
Inco
me
Mid
dle I
ncom
e
High
Inco
me
High
Inco
me
High
Inco
me
High
Inco
me
High
Inco
me
Mid
dle I
ncom
e
High
Inco
me
Low
Inco
me
Low
Inco
me
High
Inco
me
High
Inco
me
Mid
dle I
ncom
e
High
Inco
me
High
Inco
me
Euro
pe a
nd N
orth
Am
eric
a
Mid
dle E
ast a
ndAf
rica
Euro
pe a
nd N
orth
Am
eric
a
Euro
pe a
nd N
orth
Am
eric
aEu
rope
and
Nor
th
Amer
ica
Latin
Am
eric
a and
the C
arib
bean
East
and
Sou
thAs
iaEa
st a
nd S
outh
Asia
Mid
dle E
ast a
ndAf
rica
Euro
pe a
nd N
orth
Am
eric
a
Mid
dle E
ast a
ndAf
rica
Euro
pe a
nd N
orth
Am
eric
a
East
and
Sou
thAs
ia
East
and
Sou
thAs
ia
Mid
dle E
ast a
ndAf
rica
Euro
pe a
nd N
orth
Am
eric
a
Mid
dle E
ast a
ndAf
rica
Mid
dle E
ast a
ndAf
rica
Euro
pe a
nd N
orth
Am
eric
a
Latin
Am
eric
a and
the C
arib
bean
Latin
Am
eric
a and
the C
arib
bean
Euro
pe a
nd N
orth
Am
eric
a
Latin
Am
eric
a and
the C
arib
bean
Cypr
us
Egyp
t
Fran
ce
Germ
any
Gree
ce
Guat
emal
a
Indi
a
Indo
nesi
a
Iran
Irela
nd
Isra
el
Italy
Japa
n
Kore
a Rep
.
Leba
non
Luxe
mbo
urg
Mad
agas
car
Mor
occo
Neth
erla
nds
Pana
ma
Peru
Pola
nd
Puer
to R
ico
7.0 1.2 3.5 4.1
3.0 1.9 4.8
11.4
1.5 6.6
8.2
2.6 2.7
6.6 2.1
16.1
0.0
47.7
2.5 3.1
5.2
5.3
0.0

GEM Egypt National Report 18/19 Appendix Tables 89
3 28T
23 42 37 9 13 6T 14T 40 25 32 6T 10 17 20
35.2
73.5
13.1
34.5
18.5
52.3
23.4
23.5
23.5
24.7
24.2
27.6
38.3
23.8
29.0
44.6
18T 1 47 20 42 4 36 34T
34T
30 31T 25 14 33 23 6T
17.2
7.4 13.9
11.8
2.2
5.4
22.8
8.5
10.7
4.2
24.5
34.8
20.4
2.8
6.9
13.4
14 35T 19 25 49 43 9 34 28T
46 8 2 13 48 39 20
11.5
0.0 6.1
11.1
29.6 7.4 10.6
12.6
12.9 8.6
8.0 9.1
7.4 19.6
11.0
8.4
14T
48T 41 16T 2 37T
20T 13 12 28 35T
27 37T 3 18 30T
0.0
0.0
5.3
3.7
4.3 1.1 5.5
15.9
15.5 8.5 1.3 1.1 0.0
5.7
5.4
2.0
42T
42T 17 22 21 38T
14T 1 2 5 36 38T
42T
12T 16 30
0.0 3.1
2.9
0.0 2.1
9.5 1.3 4.1
11.7
10.0 2.1
4.3
2.3
9.6
6.0
3.0
41T 24 26 41T
30T
6T 36 21 2 4 30T
20 28T 5 13T 25
12.6 3.7
7.2 19.5
16.3
12.6
23.7
11.7
17.9
26.2
22.0
17.5
15.1
21.4
24.0
13.5
38T
48 44T 21 31T
38T 14 41 24 8T 17 25T
34 19 13 37
0.0
5.0
3.5
8.3
8.6
0.6
0.5
2.5
0.0
14.4 8.9
0.0
0.0
2.6 2.7
3.0
42T
15T
22T 9 8 38 39T 31 42T 4 7 42T
42T
29T
28 25T
2.9
4.0
43.0
9.9
15.9 1.6 4.1
8.4
0.6 1.8 4.8
2.9
3.9
5.6
8.2
6.0
33T
29 1 10T 5 38 26T
13T 45 36T
25 33T
30 23 16 22
High
Inco
me
Mid
dle I
ncom
e
High
Inco
me
High
Inco
me
High
Inco
me
High
Inco
me
Low
Inco
me
High
Inco
me
High
Inco
me
High
Inco
me
Mid
dle I
ncom
e
Mid
dle I
ncom
e
High
Inco
me
High
Inco
me
High
Inco
me
High
Inco
me
Mid
dle E
ast a
nd
Afric
a
Euro
pe a
nd N
orth
Am
eric
a
Mid
dle E
ast a
nd
Afric
a
Euro
pe a
nd N
orth
Am
eric
aEu
rope
and
Nor
th
Amer
ica
Euro
pe a
nd N
orth
Am
eric
a
Mid
dle E
ast a
nd
Afric
a
Euro
pe a
nd N
orth
Am
eric
aEu
rope
and
Nor
th
Amer
ica
East
and
Sou
th A
sia
East
and
Sou
th A
sia
Euro
pe a
nd N
orth
Am
eric
aM
iddl
e Eas
t and
Af
rica
Euro
pe a
nd N
orth
Am
eric
a
Euro
pe a
nd N
orth
Am
eric
a
Latin
Am
eric
a and
th
e Car
ibbe
an
Qata
r
Russ
ian
Fede
ratio
n
Saud
i Ara
bia
Slov
ak R
epub
lic
Slov
enia
Spai
n
Suda
n
Swed
en
Switz
erla
nd
Taiw
an
Thai
land
Turk
ey
Unite
d Ar
ab E
mira
tes
Unite
d Ki
ngdo
m
Unite
d St
ates
Urug
uay
20.6
3.2
5.0 1.3 2.4
9.6 8.1
12.7 7.0 1.7 4.2
2.8
12.7
8.9
6.7
6.1
Sour
ces:
GEM
Glo
bal R
epor
t 201
8/19

GEM Egypt National Report 18/19 Appendix Tables90
5. E
ntr
epre
neu
rial
Mo
tiv
atio
n f
or
TE
A, G
EM
20
18 -
P
erce
nta
ge
of
TE
A
NECE
SSIT
Y-DR
IVEN
OPPO
RTUN
ITY-
DRIV
ENIM
PROV
EMEN
T-DR
IVEN
OP
PORT
UNIT
YM
OTIV
ATIO
NAL I
NDEX
(ID
O/NE
CESS
ITY)
SCOR
E
RANK
/49
INCO
ME
LEVE
LRE
GION
ECON
OMY
Low
Inco
me
High
Inco
me
High
Inco
me
Mid
dle I
ncom
e
Mid
dle I
ncom
e
High
Inco
me
High
Inco
me
Mid
dle I
ncom
e
Mid
dle I
ncom
e
High
Inco
me
High
Inco
me
Low
Inco
me
High
Inco
me
High
Inco
me
High
Inco
me
Mid
dle I
ncom
e
Low
Inco
me
Low
Inco
me
Mid
dle I
ncom
e
Mid
dle E
ast
and
Afric
a
Latin
Am
eric
aan
d th
e Car
ibbe
anEu
rope
and
Nort
h Am
eric
a
Latin
Am
eric
a and
the C
arib
bean
Euro
pe a
ndNo
rth
Amer
ica
Euro
pe a
ndNo
rth
Amer
ica
Latin
Am
eric
a and
the C
arib
bean
East
and
Sout
h As
ia
Latin
Am
eric
a and
the C
arib
bean
Euro
pe a
ndNo
rth
Amer
ica
Euro
pe a
nd N
orth
Am
eric
a
Mid
dle E
ast a
ndAf
rica
Euro
pe a
nd N
orth
Am
eric
a
Euro
pe a
nd N
orth
Am
eric
a
Euro
pe a
nd N
orth
Am
eric
a
Latin
Am
eric
a and
the C
arib
bean
East
and
Sou
thAs
ia
East
and
Sou
thAs
ia
Mid
dle E
ast a
ndAf
rica
38.8
27.9
15.9
37.5
28.6
13.7
23.6
27.8
12.2
32.3
11.5
47.6
22.3
16.7
15.6
37.7
46.3
25.2
36.4
4 15T 36 6 14 38 22 17 41 9 43 1 26 32 37 5 2 19 7
57.0
68.8
75.2
61.8
68.1
79.3
74.1
70.5
85.5
61.9
84.6
47.5
72.9
69.8
81.3
62.2
43.2
73.0
61.0
46 34 17 44 35 12 20 28 3 43 5 48 25 30 7 42 49 24 45
36.3
37.8
38.1
50.4
27.5
44.6
59.7
25.5
43.4
44.3
65.5
26.0
63.7
52.8
47.4
46.1
25.4
44.2
46.3
42 41 40 17 46 26T 8 48 32T
28 5 47 6 15 21 25 49 29 24
0.9 1.4 2.4 1.3 1.0 3.3
2.5
0.9
3.6 1.4 5.7
0.5
2.9
3.2
3.0 1.2 0.5 1.8 1.3
45T
35T
22 39T
44 13T
20T
45T
10T
35T 5 48T 18 15T 17 43 48T
29T
39T
Ango
la
Arge
ntin
a
Aust
ria
Braz
il
Bulg
aria
Cana
da
Chile
Chin
a
Colo
mbi
a
Croa
tia
Cypr
us
Egyp
t
Fran
ce
Germ
any
Gree
ce
Guat
emal
a
Indi
a
Indo
nesi
a
Iran
SCOR
E
RANK
/49
SCOR
E
RANK
/49
SCOR
E
RANK
/49

GEM Egypt National Report 18/19 Appendix Tables 91
Low
Inco
me
High
Inco
me
High
Inco
me
Mid
dle I
ncom
e
Mid
dle I
ncom
e
High
Inco
me
High
Inco
me
Mid
dle I
ncom
e
Mid
dle I
ncom
e
High
Inco
me
High
Inco
me
Low
Inco
me
High
Inco
me
High
Inco
me
High
Inco
me
Mid
dle I
ncom
e
Low
Inco
me
Low
Inco
me
Mid
dle I
ncom
e
High
Inco
me
Low
Inco
me
High
Inco
me
High
Inco
me
Euro
pe a
nd N
orth
Am
eric
a
Mid
dle E
ast a
ndAf
rica
Euro
pe a
nd N
orth
Am
eric
aEa
st a
ndSo
uth
Asia
East
and
Sout
h As
ia
Mid
dle E
ast a
ndAf
rica
Euro
pe a
nd N
orth
Am
eric
a
Mid
dle E
ast
and
Afric
a
Mid
dle E
ast
and
Afric
aEu
rope
and
Nort
h Am
eric
a
Latin
Am
eric
aan
d th
e Car
ibbe
an
Latin
Am
eric
a and
the C
arib
bean
Euro
pe a
ndNo
rth
Amer
ica
Latin
Am
eric
a and
the C
arib
bean
Mid
dle E
ast a
ndAf
rica
Euro
pe a
ndNo
rth
Amer
ica
Mid
dle E
ast a
ndAf
rica
Euro
pe a
nd N
orth
Am
eric
aEu
rope
and
Nor
th
Amer
ica
Euro
pe a
ndNo
rth
Amer
ica
Mid
dle E
ast a
ndAf
rica
Euro
pe a
nd N
orth
Am
eric
aEu
rope
and
Nor
th
Amer
ica
19.5
16.4
11.4
20.2
21.0
36.1
12.0
31.3
31.2 8.9
13.0
23.1
8.4
22.9
16.5
39.8
29.9
27.0
24.2
22.6
27.9 9.3 7.4
30 34 44 29 27 8 42 10 11 46 39 23 47 24 33 3 12 18 21 25 15T 45 49
76.2
70.4
81.0
69.5
77.7
63.7
80.2
67.2
64.5
80.5
85.2
73.2
90.9
71.2
74.2
54.2
69.4
63.4
69.6
70.7
67.6
73.4
87.1
15 29 8 32 14 40 10 37 39 9 4 23 1 26 19 47 33 41 31 27 36 22 2
43.4
43.9
31.2
39.1
67.1
47.5
55.7
42.5
41.0
69.3
70.4
53.1
55.1
39.7
56.0
31.6
44.6
49.6
47.3
43.8
46.7
40.9
67.8
32T
30 44 39 4 20 12 34 35 2 1 14 13 38 11 43 26T 18 22 31 23 36 3
2.2
3.3
2.7
1.9 3.2 1.3 4.6 1.4 1.3 7.8 5.4
2.3
6.6 1.7 3.4
0.8 1.5 1.8 2.0 1.9 1.7 4.4 9.1
25 13T 19 27T
15T
39T 7 35T
39T 2 6 23T 4 31T 12 47 34 29T
26 27T
31T 8 1
Irela
nd
Isra
el
Italy
Japa
n
Kore
a Rep
.
Leba
non
Luxe
mbo
urg
Mad
agas
car
Mor
occo
Neth
erla
nds
Pana
ma
Peru
Pola
nd
Puer
to R
ico
Qata
r
Russ
ian
Fede
ratio
n
Saud
i Ara
bia
Slov
ak R
epub
lic
Slov
enia
Spai
n
Suda
n
Swed
en
Switz
erla
nd

GEM Egypt National Report 18/19 Appendix Tables92
High
Inco
me
Mid
dle I
ncom
e
Mid
dle I
ncom
e
High
Inco
me
High
Inco
me
High
Inco
me
High
Inco
me
East
and
Sout
h As
ia
East
and
Sout
h As
ia
Euro
pe a
ndNo
rth
Amer
ica
Mid
dle E
ast a
ndAf
rica
Euro
pe a
ndNo
rth
Amer
ica
Euro
pe a
ndNo
rth
Amer
ica
Latin
Am
eric
a and
the C
arib
bean
24.5
17.9
16.3
20.6
12.9 8.1
29.4
20 31 35 28 40 48 13
75.5
80.0
74.5
73.9
84.2
78.3
66.3
16 11 18 21 6 13 38
56.8
63.6
28.2
51.0
48.2
56.4
40.0
9 7 45 16 19 10 37
2.3
3.6 1.7 2.5
3.7
6.9 1.4
23T
10T
31T
20T 9 3 35T
Taiw
an
Thai
land
Turk
ey
Unite
d Ar
ab E
mira
tes
Unite
d Ki
ngdo
m
Unite
d St
ates
Urug
uay
Sour
ces:
GEM
Glo
bal R
epor
t 201
8/19
6.I
nd
ust
ry D
istr
ibu
tio
n o
f T
EA
, GE
M 2
018
– P
erce
nta
ge
of
TE
A
AGRI
CULT
URE
MIN
ING
INCO
ME
LEVE
LRE
GION
ECON
OMY
Mid
dle E
ast
and
Afric
a
Latin
Am
eric
aan
d th
e Car
ibbe
anEu
rope
and
Nort
h Am
eric
a
Latin
Am
eric
a and
the C
arib
bean
Euro
pe a
ndNo
rth
Amer
ica
Euro
pe a
ndNo
rth
Amer
ica
Latin
Am
eric
a and
the C
arib
bean
East
and
Sout
h As
ia
Latin
Am
eric
a and
the C
arib
bean
Euro
pe a
ndNo
rth
Amer
ica
Euro
pe a
ndNo
rth
Amer
ica
0.8
2.6
2.9
0.5
11.6
5.8
3.7 1.4 3.4
8.3
0.0
42 30T
28T
44 3 15 24T
38 26 8T 47T
Ango
la
Arge
ntin
a
Aust
ria
Braz
il
Bulg
aria
Cana
da
Chile
Chin
a
Colo
mbi
a
Croa
tia
Cypr
us
WHO
LESA
LE/
RETA
IL
HEAL
TH,
EDUC
ATIO
N,
GOVE
RNM
ENT A
ND
SOCI
AL S
ERVI
CES
SCOR
E|RA
NK/4
9SC
ORE|
RANK
/49
SCOR
E|RA
NK/4
9SC
ORE|
RANK
/49
SCOR
E|RA
NK/4
9SC
ORE|
RANK
/49
SCOR
E|RA
NK/4
9SC
ORE|
RANK
/49
SCOR
E|RA
NK/4
9SC
ORE|
RANK
/49
SCOR
E|RA
NK/4
9
Low
Inco
me
High
Inco
me
High
In
com
e
Mid
dle
Inco
me
Mid
dle
Inco
me
High
In
com
e
High
In
com
e
Mid
dle
Inco
me
Mid
dle
Inco
me
High
In
com
e
High
In
com
e
2.6
4.5 1.9 6.7
3.3
5.4
5.2
2.0
4.4 8.1
0.0
39 23T
42T 13 34T 17 20T 41 25 10 49
3.2
11.6
4.3
12.8 9.3
5.6
12.9 6.9
15.4
10.0 2.6
44 11 42 9T 21 38 8 32 3 14T 46
4.0
4.0 1.5 9.2
2.5
3.7
7.6 2.3
3.2
2.3
2.6
11T 11T 42T 1 28T 15 4 32T
18T
32T
26T
73.8
45.9
33.2
46.0
47.4
31.0
43.2
62.1
43.2
26.1
46.1
1 22T
34 21 18T 36 25T 7 25T
40 20
3.0 1.2 8.6 4.1
0.0
6.7
1.2 1.6 4.2
10.4 4.0
28 37T
5T 22 47T 16 37T
35 21 3 23
1.0 3.5
2.9
0.6
4.2
3.6 1.2 3.6 1.8 4.5
8.0
39 20T
24 43 14 18T
35T
18T 33 12 3
0.9
5.6
8.8
3.3 4.1
11.5
6.0 7.4 6.3
4.8
8.7
46T
25 17 35 31T 11 24 21 23 28 18T
0.9 1.1 3.0
3.8
5.8
5.0
8.9
0.8
4.2
10.7 5.1
44 41T
26T
22 8 14 4T 45T
18T 2 13
7.5 18.7
23.6
12.4
11.0
16.1
9.2
9.8
11.5
12.8
13.6
46 11 4 30 37 17 43 40 36 28 26
2.4 1.2 9.4
0.5
0.8
5.5 1.0 2.1
2.4 2.1
9.3
20T
37 1 46 42T 7 40T
25T
20T
25T 2
MAN
UFAC
TURI
NGTR
ANSP
ORTA
TION
FINA
NCE
INFO
R/CO
MM
UNIC
ATIO
NSTE
CHPR
OFES
SION
AL
SERV
ICES
ADM
INIS
TRAT
IVE
SERV
ICES
PE
RSON
AL/
CONS
UMER
SERV
ICES

GEM Egypt National Report 18/19 Appendix Tables 93
Mid
dle E
ast
and
Afric
a
Euro
pe a
ndNo
rth
Amer
ica
Euro
pe a
ndNo
rth
Amer
ica
Euro
pe a
ndNo
rth
Amer
ica
Latin
Am
eric
a and
the C
arib
bean
East
and
Sout
h As
iaEa
st a
ndSo
uth
Asia
Mid
dle E
ast
and
Afric
a
Euro
pe a
ndNo
rth
Amer
ica
Mid
dle E
ast
and
Afric
a
Euro
pe a
ndNo
rth
Amer
ica
East
and
Sout
h As
ia
East
and
Sout
h As
ia
Mid
dle E
ast
and
Afric
aEu
rope
and
Nort
h Am
eric
a
Mid
dle E
ast
and
Afric
a
Mid
dle E
ast
and
Afric
a
Euro
pe a
ndNo
rth
Amer
ica
Latin
Am
eric
a and
the C
arib
bean
Latin
Am
eric
a and
the C
arib
bean
Euro
pe a
ndNo
rth
Amer
ica
Latin
Am
eric
a and
the C
arib
bean
Mid
dle E
ast
and
Afric
a
8.3
5.2
6.9 7.9 2.9
5.0 1.8 7.4 1.9 3.7
9.6
5.5
0.3 1.9 0.3
21.3 4.4
3.2 1.9 1.8 1.0 3.9 1.2
8T 17 14 11 28T 18 36T 13 33T
24T 5 16 45T
33T
45T 1 19 27 33T
36T
40T
22T
39
Low
Inco
me
High
In
com
e
High
In
com
e
High
In
com
e
Mid
dle
Inco
me
Low
Inco
me
Low
Inco
me
Mid
dle
Inco
me
High
In
com
e
High
In
com
e
High
In
com
e
High
In
com
e
High
In
com
e
Mid
dle
Inco
me
High
In
com
e
Low
In
com
e
Low
In
com
e
High
In
com
e
High
In
com
e
Mid
dle
Inco
me
High
In
com
e
High
In
com
e
High
In
com
e
2.4
11.8
4.8
3.9 1.6 0.2
0.7
3.9
5.3
11.2
3.3
2.7
4.5 1.1 5.5
3.7
4.3
12.0 1.9 1.6
17.5
10.2 4.2
40 5 22 31T
44T
48 47 31T
18T 6 34T
38 23T
46 15T 33 26 4 42T
44T 1 7 28
12.8 1.9 7.4 5.9
10.1
5.0
9.2
11.5
2.9
14.8 5.9 1.8 14.1
10.0 9.6
9.6
10.0 4.1
7.0 9.7
5.3
5.3
8.7
9T 47 29 33T 13 41 22 12 45 4 33T
48 5 14T
18T
18T
14T 43 31 17
39T
39T
23
3.8
3.0 1.8 2.5 2.1
5.3 1.0 1.6 2.0 1.9 1.3 2.8
8.9
2.7
5.3
4.8
0.0
2.0
4.8
5.0
3.3
0.4
3.2
14 22 38T
28T
34 5T 45 41 35T
37 44 24 2 25 5T 9T 48T
35T
9T 8 17 47 18T
61.5
25.3
25.0
53.1
64.8
60.4
70.5
31.6
33.3
24.1
38.9
35.6
47.4
58.6
22.8
53.2
67.2
21.8
61.1
65.3
33.3
48.1
51.3
8 42 43 14 6 10 2 35 32T
44 27 30 18T 12 47 13 4 48 9 5 32T 17 16
0.3
5.2
7.0 1.7 3.3
0.7
3.1
7.6 13.2 3.7
3.3
10.6 1.7 0.6
9.9
0.4
0.0 7.1 0.4
2.0
4.5 1.5 4.5
45T 17 14 32T
25T 41 27 8 1 24 25T 2 32T
42 4 43T
47T 13 43T 31 19T 36 19T
0.0
5.2
6.3
0.9 1.6 0.2 0.1
3.7
2.7
5.6
5.8
3.2
2.8 1.2 6.3
0.2 1.1 4.9
0.7 1.1 4.3
0.0 2.7
48T 10 4T 40 34 44T
47 17 26T 7 6 23 25 35T
4T 44T
37T 11 42 37T 13 48T
26T
2.2
9.4
5.3
4.4
2.9
0.9 1.7 8.9 7.7 16.6
11.8
12.3 1.7 1.2 10.7 0.1
0.5
8.7 1.1 1.1 9.6
2.4 4.1
38 15 27 30 36 46T
39T 16 20 4 10 7T 39T
43 12 49 48 18T
44T
44T
13T 37 31T
0.7
4.8
5.6
5.5
2.0
2.6
0.0
4.8
3.7
3.7
6.3
4.7
0.7
1.9 12.0 1.1 2.3
8.9
3.0 1.1 1.7 5.6 9.1
47T
15T 9T 12 37 31T 49 15T
23T
23T 7 17 47T
38 1 41T 36 4T 26T
41T 40 9T 3
5.6
26.0
26.5
12.5 7.2 18.5
11.9
14.3
20.8
13.0
12.0
16.3
16.4
18.3
15.5 1.2 9.4
26.0
15.2 8.4
19.4
21.1
10.9
48 2T 1 29 47 12 33 25 7 27 32 16 15 13 18 49 42 2T 20 44 9 6 38
2.4
2.2
3.5 1.6 1.5 1.1 0.0
4.6
6.3 1.9 1.8 4.6 1.4 2.5
2.0
4.3
0.8 1.3 3.0
3.0
0.2 1.5 0.0
20T
24 14 32 33T
38T
48T
8T 3 29 30 8T 35 19 27T 10 42T
36 16T
16T 47 33T
48T
Egyp
t
Fran
ce
Germ
any
Gree
ce
Guat
emal
a
Indi
a
Indo
nesi
a
Iran
Irela
nd
Isra
el
Italy
Japa
n
Kore
a Rep
.
Leba
non
Luxe
mbo
urg
Mad
agas
car
Mor
occo
Neth
erla
nds
Pana
ma
Peru
Pola
nd
Puer
to R
ico
Qata
r

GEM Egypt National Report 18/19 Appendix Tables94
Euro
pe a
ndNo
rth
Amer
ica
Mid
dle E
ast
and
Afric
aEu
rope
and
Nort
h Am
eric
a
Euro
pe a
ndNo
rth
Amer
ica
Euro
pe a
ndNo
rth
Amer
ica
Mid
dle E
ast
and
Afric
aEu
rope
and
Nort
h Am
eric
a
Euro
pe a
ndNo
rth
Amer
ica
East
and
Sout
h As
ia
East
and
Sout
h As
ia
Euro
pe a
ndNo
rth
Amer
ica
Mid
dle E
ast
and
Afric
aEu
rope
and
Nort
h Am
eric
a
Euro
pe a
ndNo
rth
Amer
ica
Latin
Am
eric
a and
the C
arib
bean
8.9
0.0
2.6
8.4
4.3
9.9 8.1
0.7
3.9
13.7 7.8 0.0 1.0 4.1
2.6
6 47T
30T 7 20 4 10 43 22T 2 12 47T
40T 21 30T
Mid
dle
Inco
me
High
In
com
e
High
In
com
e
High
In
com
e
High
In
com
e
Low
In
com
e
High
In
com
e
High
In
com
e
High
In
com
e
Mid
dle
Inco
me
Mid
dle
Inco
me
High
In
com
e
High
In
com
e
High
In
com
e
High
In
com
e
9.9
3.2
15.5 4.3
4.0
2.9
4.0
5.5 7.8 5.3
10.0 5.2
12.4 5.7
7.2
9 36 2 26T
29T
37 29T
15T 11 18T 8 20T 3 14 12
9.6
5.7
8.2
7.8 7.2 15.7
8.6 7.5 13.7
5.9
17.7
1.2 5.7
7.6 13.4
18T
36T
25 26 30 2 24 28 6 33T 1 49 36T
27 7
8.8
0.6
2.6
5.2
4.0
3.5 1.8 0.0
2.4
2.5 3.1
1.5 1.8 3.2
2.9
3 46 26T 7 11T 16 38T
48T 31 28T 21 42T
38T
18T 23
35.1
67.9
25.6
23.9
28.8
51.9
26.2
27.4
45.9
59.9
36.7
45.4
21.2
23.4
38.1
31 3 41 45 37 15 39 38 22T 11 29 24 49 46 28
2.5
0.8
4.6
6.8 7.4 0.0
8.6
8.3
2.9
0.3
0.8 1.7 7.2 7.3 7.5
30 39T 18 15 10 47T
5T 7 29 45T
39T
32T 12 11 9
2.3
0.8
3.5
3.3
3.8
2.4
5.4
11.9
2.4
0.2
2.2
5.3
3.9
8.8 2.1
30 41 20T
22 16 28T 8 1 28T
44T 31 9 15 2 32
4.5
3.4
9.6
20.1
19.9 1.6 12.1
15.3 3.9 1.3 5.5
17.7
12.3
13.2 6.6
29 34 13T 1 2 41 9 5 33 42 26 3 7T 6 22
2.5
0.8
2.7
4.2
3.0 1.8 2.7 3.1
2.4
2.4
2.6
3.9 7.8 5.6
4.2
33 45T
29T
18T
26T
39 29T
25 34T
34T
31T 21 6 9T 18T
14.9
14.4
23.4
11.7
15.0 9.7
18.9
14.5
10.7 7.7 11.7
16.9
20.6
15.3
12.2
22 24 5 34T 21 41 10 23 39 45 34T 14 8 19 31
1.0 2.3 1.7 4.2
2.6
0.6
3.6
5.8
3.9
0.7
2.0 1.1 6.1
5.8
3.3
40T
23 31 11 18 45 13 5T 12 44 27T
38T 4 5T 15
Russ
ian
Fede
ratio
n
Saud
i Ara
bia
Slov
ak R
epub
lic
Slov
enia
Spai
n
Suda
n
Swed
en
Switz
erla
nd
Taiw
an
Thai
land
Turk
ey
Unite
d Ar
ab E
mira
tes
Unite
d Ki
ngdo
m
Unite
d St
ates
Urug
uay
Sour
ces:
GEM
Glo
bal R
epor
t 201
8/19

GEM Egypt National Report 18/19 Appendix Tables 95
7. J
ob
Cre
atio
n E
xpec
tati
on
s fo
r T
EA
, GE
M 2
018
-
Per
cen
tag
e o
f T
EA
SCOR
E
RANK
/49
INCO
ME
LEVE
LRE
GION
ECON
OMY
Low
Inco
me
High
Inco
me
High
Inco
me
Mid
dle I
ncom
e
Mid
dle I
ncom
e
High
Inco
me
High
Inco
me
Mid
dle I
ncom
e
Mid
dle I
ncom
e
High
Inco
me
High
Inco
me
Low
Inco
me
High
Inco
me
High
Inco
me
High
Inco
me
Mid
dle I
ncom
e
Low
Inco
me
Low
Inco
me
Mid
dle I
ncom
e
Mid
dle E
ast
and
Afric
a
Latin
Am
eric
aan
d th
e Car
ibbe
anEu
rope
and
Nort
h Am
eric
a
Latin
Am
eric
a and
the C
arib
bean
Euro
pe a
ndNo
rth
Amer
ica
Euro
pe a
ndNo
rth
Amer
ica
Latin
Am
eric
a and
the C
arib
bean
East
and
Sout
h As
ia
Latin
Am
eric
a and
the C
arib
bean
Euro
pe a
ndNo
rth
Amer
ica
Euro
pe a
nd N
orth
Am
eric
a
Mid
dle E
ast a
ndAf
rica
Euro
pe a
nd N
orth
Am
eric
a
Euro
pe a
nd N
orth
Am
eric
a
Euro
pe a
nd N
orth
Am
eric
a
Latin
Am
eric
a and
the C
arib
bean
East
and
Sou
thAs
ia
East
and
Sou
thAs
ia
Mid
dle E
ast a
ndAf
rica
44.5
36.4
56.8
81.0
72.2
57.1
19.1
66.7
11.3
39.9
43.6
58.5
40.3
48.1
44.9
20.4
39.2
75.6
40.6
26 39 13 1 4 12 48 5 49 32 28 10 31 21 25 47 34 2 30
Ango
la
Arge
ntin
a
Aust
ria
Braz
il
Bulg
aria
Cana
da
Chile
Chin
a
Colo
mbi
a
Croa
tia
Cypr
us
Egyp
t
Fran
ce
Germ
any
Gree
ce
Guat
emal
a
Indi
a
Indo
nesi
a
Iran
SCOR
E
RANK
/49
0 JO
BS IN
5
YEAR
S1 –
5 JO
BS
IN 5
YEA
RS6
OR M
ORE J
OBS
IN 5
YEA
RS
31.2
51.9
27.3
12.9
25.3
22.2
47.3
12.9
38.9
33.6
34.0
22.2
30.6
23.0
45.4
52.6
52.4
22.8
23.4
26 4 30T
48T
35 42T 9 48T 14 25 24 42T
27 40 10 2 3 41 38T
SCOR
E
RANK
/49
24.3
11.7
15.9 6.1
2.5
20.7
33.5
20.4
49.9
26.5
22.4
19.3
29.1
28.9
9.7
27.0 8.4 1.6 36.0
16 37 31 44T
47 22 7 24 2 15 20 26 9 10 39 13 43 49 6

GEM Egypt National Report 18/19 Appendix Tables96
41 17 9 14 36 11 20 8 6 3 27 45 29 46 19 7 35 23 22 15 33 16 38
29.7
52.5
60.4
56.7
37.6
58.3
48.6
61.1
64.0
75.0
43.7
27.2
43.4
26.4
49.9
63.5
38.4
46.6
47.0
56.2
39.5
55.6
36.6
26.6
24.6
26.3
21.6
49.6
38.0
34.8
36.6
27.3
15.4
50.2
57.4
45.1
49.4
23.4
16.6
49.4
26.3
37.7
35.1
37.4
27.8
34.9
32 37 33T
44 6 15 23 18 30T
46 5 1 11 7T 38T
45 7T 33T 16 20T 17 29 22
43.7
22.9
13.3
21.6
12.8 3.7
16.6 2.3
8.7
9.5 6.1
15.3
11.5
24.2
26.7
19.8
12.2
27.1
15.3 8.7
23.1
16.7
28.5
4 19 34 21 35 46 30 48 41T 40 44T
32T
38 17 14 25 36 12 32T
41T 18 29 11
Irela
nd
Isra
el
Italy
Japa
n
Kore
a Rep
.
Leba
non
Luxe
mbo
urg
Mad
agas
car
Mor
occo
Neth
erla
nds
Pana
ma
Peru
Pola
nd
Puer
to R
ico
Qata
r
Russ
ian
Fede
ratio
n
Saud
i Ara
bia
Slov
ak R
epub
lic
Slov
enia
Spai
n
Suda
n
Swed
en
Switz
erla
nd
Euro
pe a
ndNo
rth
Amer
ica
Mid
dle E
ast
and
Afric
a
Euro
pe a
ndNo
rth
Amer
ica
East
and
Sou
thAs
ia
East
and
Sou
thAs
ia
Mid
dle E
ast a
ndAf
rica
Euro
pe a
ndNo
rth
Amer
ica
Mid
dle E
ast a
ndAf
rica
Mid
dle E
ast a
ndAf
rica
Euro
pe a
ndNo
rth
Amer
ica
Latin
Am
eric
a and
the C
arib
bean
Latin
Am
eric
a and
the C
arib
bean
Euro
pe a
nd N
orth
Am
eric
a
Latin
Am
eric
a and
the C
arib
bean
Mid
dle E
ast a
ndAf
rica
Euro
pe a
nd N
orth
Am
eric
a
Mid
dle E
ast a
ndAf
rica
Euro
pe a
nd N
orth
Am
eric
aEu
rope
and
Nor
th
Amer
ica
Euro
pe a
nd N
orth
Am
eric
a
Mid
dle E
ast a
ndAf
rica
Euro
pe a
nd N
orth
Am
eric
aEu
rope
and
Nor
th
Amer
ica
High
Inco
me
High
Inco
me
High
Inco
me
High
Inco
me
High
Inco
me
Mid
dle I
ncom
e
High
Inco
me
Low
Inco
me
Low
Inco
me
High
Inco
me
High
Inco
me
Mid
dle I
ncom
e
High
Inco
me
High
Inco
me
High
Inco
me
Mid
dle I
ncom
e
High
Inco
me
High
Inco
me
High
Inco
me
High
Inco
me
Low
Inco
me
High
Inco
me
High
Inco
me

GEM Egypt National Report 18/19 Appendix Tables 97
High
Inco
me
Mid
dle I
ncom
e
Mid
dle I
ncom
e
High
Inco
me
High
Inco
me
High
Inco
me
High
Inco
me
East
and
Sou
thAs
ia
East
and
Sou
thAs
iaEu
rope
and
Nort
h Am
eric
a
Mid
dle E
ast a
ndAf
rica
Euro
pe a
ndNo
rth
Amer
ica
Euro
pe a
ndNo
rth
Amer
ica
Latin
Am
eric
a and
the C
arib
bean
27.3
45.4
29.1
31.9
51.0
28.3
36.8
44 24 42 40 18 43 37
Taiw
an
Thai
land
Turk
ey
Unite
d Ar
ab E
mira
tes
Unite
d Ki
ngdo
m
Unite
d St
ates
Urug
uay
35.1
35.5
25.0
14.8
28.4
40.0
44.4
20T 19 36 47 28 13 12
37.6
19.1
45.9
53.3
20.5
31.8
18.8
5 27 3 1 23 8 28
Sour
ces:
GEM
Glo
bal R
epor
t 201
8/19
8. S
olo
En
trep
ren
eurs
hip
, In
no
vat
ion
lev
el, I
nte
rnat
ion
aliz
atio
n f
or
TE
A,
GE
M 2
018
– P
erce
nta
ge
of
TE
A
SCOR
E
RANK
/48
INCO
ME
LEVE
LRE
GION
ECON
OMY
Low
Inco
me
High
Inco
me
High
Inco
me
Mid
dle I
ncom
e
Mid
dle I
ncom
e
High
Inco
me
High
Inco
me
Mid
dle I
ncom
e
Mid
dle I
ncom
e
High
Inco
me
High
Inco
me
Mid
dle E
ast
and
Afric
a
Latin
Am
eric
aan
d th
e Car
ibbe
anEu
rope
and
Nort
h Am
eric
a
Latin
Am
eric
a and
the C
arib
bean
Euro
pe a
ndNo
rth
Amer
ica
Euro
pe a
ndNo
rth
Amer
ica
Latin
Am
eric
a and
the C
arib
bean
East
and
Sout
h As
ia
Latin
Am
eric
a and
the C
arib
bean
Euro
pe a
ndNo
rth
Amer
ica
Euro
pe a
nd N
orth
Am
eric
a
2.1
13.8 7.8 53.2 4.1
3.4 4.1
1.3 0.1
0.0
2.4
40 12 20 1 33T
36 33T
42 45 46T
39
Ango
la
Arge
ntin
a
Aust
ria
Braz
il
Bulg
aria
Cana
da
Chile
Chin
a
Colo
mbi
a
Croa
tia
Cypr
us
SCOR
E
RANK
/49
NO C
O-FO
UNDE
RS O
R EM
PLOY
EES,
NO
JOBS
PR
OJEC
TED
IN 5
YEA
RS
INNO
VATI
ON(P
RODU
CT IS
NEW
TO A
LL O
R SO
ME
CUST
OMER
S AND
FEW
/NO
BUSI
NESS
ES
OFFE
R TH
E SAM
E PRO
DUCT
)
INTE
RNAT
IONA
LIZA
TION
(MOR
E THA
N 25
% S
ALES
TO C
USTO
MER
OU
TSID
E HOM
E ECO
NOM
Y)
17.8
32.2
37.0 3.7
14.9
41.3
47.6
33.1
16.1
24.6
38.6
37T 14 8 49 42T 5 2 12 40 28 7
SCOR
E
RANK
/49
1.8 3.0
43.0
0.3 7.4 43.8 - 8.8
9.6
40.3
38.2
45 42T 6 48 39 5 - 35 33 8 10

GEM Egypt National Report 18/19 Appendix Tables98
Low
Inco
me
High
Inco
me
High
Inco
me
High
Inco
me
Mid
dle I
ncom
e
Low
Inco
me
Low
Inco
me
Mid
dle I
ncom
e
High
Inco
me
High
Inco
me
High
Inco
me
High
Inco
me
High
Inco
me
Mid
dle I
ncom
e
High
Inco
me
Low
Inco
me
Low
Inco
me
High
Inco
me
High
Inco
me
Mid
dle I
ncom
e
High
Inco
me
High
Inco
me
High
Inco
me
Mid
dle E
ast a
nd
Afric
a
Euro
pe a
nd N
orth
Am
eric
a
Euro
pe a
nd N
orth
Am
eric
a
Euro
pe a
nd N
orth
Am
eric
aLa
tin A
mer
ica a
nd
the C
arib
bean
East
and
Sou
thAs
ia
East
and
Sou
thAs
ia
Mid
dle E
ast a
nd
Afric
aEu
rope
and
Nort
h Am
eric
a
Mid
dle E
ast a
nd
Afric
aEu
rope
and
Nort
h Am
eric
a
East
and
Sou
thAs
ia
East
and
Sou
thAs
ia
Mid
dle E
ast a
nd
Afric
aEu
rope
and
Nort
h Am
eric
a
Mid
dle E
ast a
nd
Afric
a
Mid
dle E
ast a
nd
Afric
aEu
rope
and
Nort
h Am
eric
a
Latin
Am
eric
a and
the C
arib
bean
Latin
Am
eric
a and
the C
arib
bean
Euro
pe a
ndNo
rth
Amer
ica
Latin
Am
eric
a and
the C
arib
bean
Mid
dle E
ast a
nd
Afric
a
3.3
8.0
16.5 9.6 7.1 5.2
0.0
4.6
5.7
4.0
17.8
5.1
8.0
14.3 5.2
30.0
2.0
22.5
26.4
4.6
2.6 7.6 0.4
37 18T 8 15 22 27T
46T
30T
25 35 7 29 18T 11 27T 2 41 4 3 30T
38 21 44
27.5
28.1
30.5
28.4
39.2
46.9
15.4
17.2
35.8
32.9
24.3
27.7
29.9
41.9
47.9
13.4
14.9
23.8
10.5
21.9
12.2
26.1
26.9
23 21 17 19 6 3 41 39 9 13 29 22 18 4 1 44T
42T
30 47 34 46 25 24
22.3
19.9
18.9
27.5 2.3
25.4
5.7
4.9
35.5
30.2
19.9
25.0
10.5
59.3
47.2 1.1 54.9
8.7
14.4 8.1
3.0
23.8
41.8
20 22T
26 16 44 17 40 41 11 14 22T 18 32 1 3 47 2 36 28 38 42T 19 7
Egyp
t
Fran
ce
Germ
any
Gree
ce
Guat
emal
a
Indi
a
Indo
nesi
a
Iran
Irela
nd
Isra
el
Italy
Japa
n
Kore
a Rep
.
Leba
non
Luxe
mbo
urg
Mad
agas
car
Mor
occo
Neth
erla
nds
Pana
ma
Peru
Pola
nd
Puer
to R
ico
Qata
r

GEM Egypt National Report 18/19 Appendix Tables 99
Mid
dle I
ncom
e
High
Inco
me
High
Inco
me
High
Inco
me
High
Inco
me
Low
Inco
me
High
Inco
me
High
Inco
me
High
Inco
me
Mid
dle I
ncom
e
Mid
dle I
ncom
e
High
Inco
me
High
Inco
me
High
Inco
me
High
Inco
me
Euro
pe a
nd N
orth
Am
eric
a
Mid
dle E
ast a
nd
Afric
a
Euro
pe a
nd N
orth
Am
eric
a
Euro
pe a
nd N
orth
Am
eric
aEu
rope
and
Nor
th
Amer
ica
Mid
dle E
ast a
nd
Afric
a
Euro
pe a
nd N
orth
Am
eric
aEu
rope
and
Nor
th
Amer
ica
East
and
Sou
thAs
ia
East
and
Sou
thAs
iaEu
rope
and
Nort
h Am
eric
a
Mid
dle E
ast a
nd
Afric
a
Euro
pe a
ndNo
rth
Amer
ica
Euro
pe a
ndNo
rth
Amer
ica
Latin
Am
eric
a and
the C
arib
bean
9.8¬ 0.0 6.1
9.5
19.2 5.3
16.1
4.2
12.5
16.4 0.5
0.0
17.9
8.8
6.6
14 46T
24 16 5 26 10 32 13 9 43 46T 6 17 23
8.1
23.3
22.0
25.5
22.3
13.4
33.7
31.7
18.8
17.8
30.8
28.2
21.6
34.0
25.3
48 31 33 26 32 44T 11 15 36 37T 16 20 35 10 27
1.6 40.0
21.9
28.7
9.3
19.2
32.9
33.3
10.8
18.6
14.2
46.7
19.5
12.7
8.4
46 9 21 15 34 25 13 12 31 27 29 4 24 30 37
Russ
ian
Fede
ratio
n
Saud
i Ara
bia
Slov
ak R
epub
lic
Slov
enia
Spai
n
Suda
n
Swed
en
Switz
erla
nd
Taiw
an
Thai
land
Turk
ey
Unite
d Ar
ab E
mira
tes
Unite
d Ki
ngdo
m
Unite
d St
ates
Urug
uay
Sour
ces:
GEM
Glo
bal R
epor
t 201
8/19

GEM Egypt National Report 18/19 Appendix Tables100
9. G
end
er D
istr
ibu
tio
n o
f T
EA
, Op
po
rtu
nit
y T
EA
& N
eces
sity
TE
A,
GE
M 2
018
MAL
E TEA
(% O
F ADU
LT M
ALE
POPU
LATI
ON)
FEM
ALE T
EA
(% O
F ADU
LT FE
MAL
E PO
PULA
TION
)
MAL
E TEA
OPPO
RTUN
ITY
(% O
F TEA
MAL
ES)
FEM
ALE T
EAOP
PORT
UNIT
Y (%
OF T
EA FE
MAL
ES)
INCO
ME
LEVE
LRE
GION
ECON
OMY
Low
Inco
me
High
Inco
me
High
Inco
me
Mid
dle I
ncom
e
Mid
dle I
ncom
e
High
Inco
me
High
Inco
me
Mid
dle I
ncom
e
Mid
dle I
ncom
e
High
Inco
me
High
Inco
me
Low
Inco
me
High
Inco
me
High
Inco
me
High
Inco
me
Mid
dle I
ncom
e
Low
Inco
me
Low
Inco
me
Mid
dle I
ncom
e
Mid
dle E
ast
and
Afric
a
Latin
Am
eric
aan
d th
e Car
ibbe
anEu
rope
and
Nort
h Am
eric
a
Latin
Am
eric
a and
the C
arib
bean
Euro
pe a
ndNo
rth
Amer
ica
Euro
pe a
ndNo
rth
Amer
ica
Latin
Am
eric
a and
the C
arib
bean
East
and
Sout
h As
ia
Latin
Am
eric
a and
the C
arib
bean
Euro
pe a
ndNo
rth
Amer
ica
Euro
pe a
nd N
orth
Am
eric
a
Mid
dle E
ast a
ndAf
rica
Euro
pe a
nd N
orth
Am
eric
a
Euro
pe a
nd N
orth
Am
eric
a
Euro
pe a
nd N
orth
Am
eric
a
Latin
Am
eric
a and
the C
arib
bean
East
and
Sou
thAs
ia
East
and
Sou
thAs
ia
Mid
dle E
ast a
ndAf
rica
41.0
10.1
13.9
18.5 6.4
20.4
29.0
11.4
24.9
12.1
4.8
14.1
7.0 6.6
8.8
30.8
14.0
14.0
12.9
1 34 23 13 46 8T 4 30 6 28 49 20 42 45 38T 3 21T
21T 25
40.7
8.1
7.9 17.3
5.6
17.0
21.2 9.3
17.8 7.1 2.9
5.4
5.3
3.3
3.9
24.5
8.7
14.1
6.5
1 29 30 9 35 11 3 18 7 32 48 36T
38 47 44T 2 22T 12 33
47.2
59.8
77.0
55.6
63.4
83.3
66.5
72.4
83.0
59.6
86.6
45.0
66.9
69.7
67.7
56.1
40.2
70.8
64.9
46 40 16 45 35 5 29 22 6 41T 2 47 28 25 27 43 48 24 31T
27.5
21.4
16.5
31.4
23.2
16.8
18.4
29.4
10.7
32.4
12.4
47.3
21.1
17.1
10.4
32.3
44.2
22.4
39.6
12 21 38 9 17 36 30 10 45 7 41 1 23 33T
46 8 2 19 3
Ango
la
Arge
ntin
a
Aust
ria
Braz
il
Bulg
aria
Cana
da
Chile
Chin
a
Colo
mbi
a
Croa
tia
Cypr
us
Egyp
t
Fran
ce
Germ
any
Gree
ce
Guat
emal
a
Indi
a
Indo
nesi
a
Iran
MAL
E TEA
NECE
SSIT
Y(%
OF T
EA M
ALES
)
FEM
ALE T
EANE
CESS
ITY
(% O
F TEA
MAL
ES)
SCOR
E
RAN
K/49
SCOR
E
RAN
K/49
SCOR
E
RAN
K/49
SCOR
E
RAN
K/49
SCOR
E
RAN
K/49
SCOR
E
RAN
K/49
67.3
76.4
74.3
67.7
72.2
75.9
79.9
68.9
87.5
63.3
83.4
48.4
77.5
69.9
87.3
67.4
45.0
75.2
59.0
41 16 24 39 32 17 11 38 2 43T 7 48 15 36 4 40 49 19T 47
49.5
35.7
14.9
44.0
34.8
10.0
30.6
25.9
14.1
32.2
9.8
48.5
23.9
15.9
27.1
43.9
49.9
28.0
29.8
3 9T 36 5 11 43 16 24 37 15 44 4 26 34 21 6 2 18 17

GEM Egypt National Report 18/19 Appendix Tables 101
11.9
12.8 5.5
6.7
17.0
31.3
12.7
20.4
9.2
16.2
13.8
23.9
6.0
15.2 8.6 7.3 14.7
15.2 8.8
6.8
27.5 9.5
10.0
29 26 48 44 15 2 27 8T 37 16 24 7 47 17T 40 41 19 17T
38T
43 5 36 35
7.5 9.1
2.8
4.0
12.2
17.4
8.7
21.1
4.3
8.3
13.9
20.9
4.5
8.4
8.4
3.9
8.5
9.0
3.8
6.0
17.1
4.0 4.7
31 19 49 42T 16 8 22T 4 41 28 13 5 40 25T
25T
44T
24 20 46 34 10 42T
39
77.8
72.2
78.6
62.8
77.8
64.3
82.4
64.4
68.3
82.8
84.8
73.1
95.0
64.9
78.6
39.8
59.6
61.7
62.4
65.7
55.9
80.0
86.4
14T 23 12T 36 14T 34 8 33 26 7 4 21 1 31T
12T 49 41T 38 37 30 44 10 3
19.6
20.6
11.5
18.1
21.9
36.4
17.1
28.5
32.8
8.6
13.7
23.1
10.8
20.9
16.7
33.1
26.1
26.6
20.7
18.9
21.2
12.5 5.5
28 26 42 32 20 4 33T 11 6 47 39 18 44 24 37 5 14 13 25 29 22 40 49
75.2
69.0
82.2
73.3
77.6
63.3
78.8
70.3
62.6
79.3
85.6
73.3
87.9
75.0
73.1
62.6
73.6
64.4
72.6
75.2
75.0
70.7
87.4
19T 37 8 28T 14 43T 13 34 45T 12 6 28T 1 22T
30 45T
26T
42 31 19T
22T
33 3
19.3
10.6
11.3
23.8
19.6
35.7
4.2
33.9
27.7 9.7
12.3
23.1
5.0
26.2
15.8
51.1
39.0
27.6
32.7
26.7
38.3 1.3 11.5
31 42 41 27 30 9T 48 13 19 45 38 28 47 23 35 1 7 20 14 22 8 49 39
High
Inco
me
High
Inco
me
High
Inco
me
High
Inco
me
High
Inco
me
Mid
dle I
ncom
e
High
Inco
me
Low
Inco
me
Low
Inco
me
High
Inco
me
High
Inco
me
Mid
dle I
ncom
e
High
Inco
me
High
Inco
me
High
Inco
me
Mid
dle I
ncom
e
High
Inco
me
High
Inco
me
High
Inco
me
High
Inco
me
Low
Inco
me
High
Inco
me
High
Inco
me
Irela
nd
Isra
el
Italy
Japa
n
Kore
a Rep
.
Leba
non
Luxe
mbo
urg
Mad
agas
car
Mor
occo
Neth
erla
nds
Pana
ma
Peru
Pola
nd
Puer
to R
ico
Qata
r
Russ
ian
Fede
ratio
n
Saud
i Ara
bia
Slov
ak R
epub
lic
Slov
enia
Spai
n
Suda
n
Swed
en
Switz
erla
nd
Euro
pe a
ndNo
rth
Amer
ica
Mid
dle E
ast
and
Afric
a
Euro
pe a
ndNo
rth
Amer
ica
East
and
Sou
thAs
ia
East
and
Sou
thAs
iaM
iddl
e Eas
t and
Afric
a
Euro
pe a
ndNo
rth
Amer
ica
Mid
dle E
ast a
ndAf
rica
Mid
dle E
ast a
ndAf
rica
Euro
pe a
ndNo
rth
Amer
ica
Latin
Am
eric
aan
d th
e Car
ibbe
an
Latin
Am
eric
a and
the C
arib
bean
Euro
pe a
ndNo
rth
Amer
ica
Latin
Am
eric
a and
the C
arib
bean
Mid
dle E
ast a
ndAf
rica
Euro
pe a
nd N
orth
Am
eric
a
Mid
dle E
ast a
ndAf
rica
Euro
pe a
nd N
orth
Am
eric
a
Euro
pe a
nd N
orth
Am
eric
aEu
rope
and
Nor
th
Amer
ica
Mid
dle E
ast a
ndAf
rica
Euro
pe a
nd N
orth
Am
eric
a
Euro
pe a
nd N
orth
Am
eric
a

GEM Egypt National Report 18/19 Appendix Tables102
10.2
20.1
20.0
11.0
11.1
17.7
19.4
33 10 11 32 31 14 12
8.8
19.3 8.4
10.1
5.4
13.6
12.3
21 6 25T 17 36T 14 15
75.3
79.6
76.7
73.8
81.0
74.7
60.5
18 11 17 20 9 19 39
24.4
17.1
18.3
20.3
11.1
8.5
25.7
16 33T 31 27 43 48 15
75.6
80.3
73.6
73.9
85.7
81.1
70.2
18 10 26T
25 5 9 35
24.7
18.7
11.4
21.4
16.6 7.7 34.7
25 32 40 29 33 46 12
High
Inco
me
Mid
dle I
ncom
e
Mid
dle I
ncom
e
High
Inco
me
High
Inco
me
High
Inco
me
High
Inco
me
Taiw
an
Thai
land
Turk
ey
Unite
d Ar
ab E
mira
tes
Unite
d Ki
ngdo
m
Unite
d St
ates
Urug
uay
East
and
Sou
thAs
ia
East
and
Sou
thAs
ia
Euro
pe a
ndNo
rth
Amer
ica
Mid
dle E
ast a
ndAf
rica
Euro
pe a
ndNo
rth
Amer
ica
Euro
pe a
ndNo
rth
Amer
ica
Latin
Am
eric
a and
the C
arib
bean
10. T
EA
by
Ag
e G
rou
p, G
EM
20
18 -
Per
cen
tag
e o
f P
op
ula
tio
n A
ge
d 1
8-6
4
TEA
- 25
- 34
YEAR
STE
A - 3
5 - 4
4YE
ARS
INCO
ME
LEVE
LRE
GION
ECON
OMY
Low
Inco
me
High
Inco
me
High
Inco
me
Mid
dle I
ncom
e
Mid
dle I
ncom
e
High
Inco
me
High
Inco
me
Mid
dle I
ncom
e
Mid
dle I
ncom
e
High
Inco
me
High
Inco
me
Mid
dle E
ast
and
Afric
a
Latin
Am
eric
aan
d th
e Car
ibbe
anEu
rope
and
Nort
h Am
eric
a
Latin
Am
eric
a and
the C
arib
bean
Euro
pe a
ndNo
rth
Amer
ica
Euro
pe a
ndNo
rth
Amer
ica
Latin
Am
eric
a and
the C
arib
bean
East
and
Sout
h As
ia
Latin
Am
eric
a and
the C
arib
bean
Euro
pe a
ndNo
rth
Amer
ica
Euro
pe a
nd N
orth
Am
eric
a
Ango
la
Arge
ntin
a
Aust
ria
Braz
il
Bulg
aria
Cana
da
Chile
Chin
a
Colo
mbi
a
Croa
tia
Cypr
us
TEA
- 45
- 54
YEAR
STE
A - 5
5 - 6
4YE
ARS
TEA
- 18
- 24
YEAR
S
38.9
8.9
14.0
21.2 3.8
27.3
18.8
10.9 17.1
11.7
1.7
1 31 15 6 43 3 8 25 9 21T 48
SCOR
E
RAN
K/49
39.8 9.1
13.0
19.5 7.7 20.1
31.1
13.2
26.2
11.5
4.0
1 33 22 12 39 9 2 21 6 25 49
SCOR
E
RAN
K/49
31.6
10.5 9.7
15.6 7.3 14.7
26.3
10.8
21.2 4.9
5.2
1 25 27 10 33 12 3 23 6 43 41
SCOR
E
RAN
K/49
SCOR
E
RAN
K/49
51.0
10.5
15.1
20.2
8.0
26.1
26.6
12.0
24.3
19.0 4.0
1 35T
22 12 41T 7 5 30 10 13T 49
SCOR
E
RAN
K/49
28.2 5.1
3.5
9.7
2.4
9.3
19.6 5.1
13.9 2.3
3.7
1 27T
38 14 44T 15 2 27T 10 46 37
Sour
ces:
GEM
Glo
bal R
epor
t 201
8/19

GEM Egypt National Report 18/19 Appendix Tables 103
Low
Inco
me
High
Inco
me
High
Inco
me
High
Inco
me
Mid
dle I
ncom
e
Low
Inco
me
Low
Inco
me
Mid
dle I
ncom
e
High
Inco
me
High
Inco
me
High
Inco
me
High
Inco
me
High
Inco
me
Mid
dle I
ncom
e
High
Inco
me
Low
Inco
me
Low
Inco
me
High
Inco
me
High
Inco
me
Mid
dle I
ncom
e
High
Inco
me
High
Inco
me
High
Inco
me
Mid
dle E
ast a
nd
Afric
a
Euro
pe a
nd N
orth
Am
eric
a
Euro
pe a
nd N
orth
Am
eric
a
Euro
pe a
nd N
orth
Am
eric
aLa
tin A
mer
ica a
nd
the C
arib
bean
East
and
Sou
thAs
ia
East
and
Sou
thAs
ia
Mid
dle E
ast a
nd
Afric
aEu
rope
and
Nort
h Am
eric
a
Mid
dle E
ast a
nd
Afric
aEu
rope
and
Nort
h Am
eric
a
East
and
Sou
thAs
ia
East
and
Sou
thAs
ia
Mid
dle E
ast a
nd
Afric
aEu
rope
and
Nort
h Am
eric
a
Mid
dle E
ast a
nd
Afric
a
Mid
dle E
ast a
nd
Afric
aEu
rope
and
Nort
h Am
eric
a
Latin
Am
eric
a and
the C
arib
bean
Latin
Am
eric
a and
the C
arib
bean
Euro
pe a
ndNo
rth
Amer
ica
Latin
Am
eric
a and
the C
arib
bean
Mid
dle E
ast a
nd
Afric
a
Egyp
t
Fran
ce
Germ
any
Gree
ce
Guat
emal
a
Indi
a
Indo
nesi
a
Iran
Irela
nd
Isra
el
Italy
Japa
n
Kore
a Rep
.
Leba
non
Luxe
mbo
urg
Mad
agas
car
Mor
occo
Neth
erla
nds
Pana
ma
Peru
Pola
nd
Puer
to R
ico
Qata
r
10.7
3.2
6.0
11.5
27.4
12.3
13.6 7.2 6.7
11.7
4.4
5.4
8.6
15.9 4.8
24.8 7.1 15.9
11.4
24.5 1.2 12.4 6.7
27 45 39 23 2 19 16 34 37T
21T 42 40 32 10T 41 4 35 10T 24 5 49 18 37T
9.0 8.1
6.1
4.1
30.7
9.6
16.9
10.2 9.9
9.9
5.0
6.3
16.0
27.9
14.6
15.6 7.8 12.4
16.4
26.0 8.1
13.8 9.3
34T
36T
44 48 3 30T 13 27 28T
28T
47 42T 16 4 18 17 38 24 14 7 36T 19 32
7.4 6.2
4.6
4.7
25.6
12.6
12.6 5.4 9.1
11.0
3.6
4.5
16.3
23.6
10.0
14.6 5.1
10.7
15.5
18.4 2.0
8.3
11.6
32 37T
45 44 4 18T
18T
39T
29 22 47 46 9 5 26 13 42 24 11 7 49 30 20
11.2
8.1
6.6 7.0 30.0
13.3
14.6
15.2
13.4
13.5 6.4
8.4
15.3
30.3
14.2
26.3 7.8 17.6
14.8
21.8 9.8
19.0 8.0
33T
40 47 46 3 29 24 21 27T
26 48 39 20 2 25 6 44 16 23 11 37 13T
41T
9.0
4.0
2.4
5.4
14.7
6.9
10.0 3.0 7.6 7.6 2.1
2.6
14.5
18.4 6.5
13.7
3.3
6.6
8.4
18.6 2.2
4.6
6.0
16 36 44T
26 7 21 13 41 19T
19T 48 43 8 4 23 11 39T
22 18 3 47 32 25

GEM Egypt National Report 18/19 Appendix Tables104
Mid
dle I
ncom
e
High
Inco
me
High
Inco
me
High
Inco
me
High
Inco
me
Low
Inco
me
High
Inco
me
High
Inco
me
High
Inco
me
Mid
dle I
ncom
e
Mid
dle I
ncom
e
High
Inco
me
High
Inco
me
High
Inco
me
High
Inco
me
Euro
pe a
nd N
orth
Am
eric
a
Mid
dle E
ast a
nd
Afric
a
Euro
pe a
nd N
orth
Am
eric
a
Euro
pe a
nd N
orth
Am
eric
aEu
rope
and
Nor
th
Amer
ica
Mid
dle E
ast a
nd
Afric
a
Euro
pe a
nd N
orth
Am
eric
aEu
rope
and
Nor
th
Amer
ica
East
and
Sou
thAs
ia
East
and
Sou
thAs
iaEu
rope
and
Nort
h Am
eric
a
Mid
dle E
ast a
nd
Afric
a
Euro
pe a
ndNo
rth
Amer
ica
Euro
pe a
ndNo
rth
Amer
ica
Latin
Am
eric
a and
the C
arib
bean
Russ
ian
Fede
ratio
n
Saud
i Ara
bia
Slov
ak R
epub
lic
Slov
enia
Spai
n
Suda
n
Swed
en
Switz
erla
nd
Taiw
an
Thai
land
Turk
ey
Unite
d Ar
ab E
mira
tes
Unite
d Ki
ngdo
m
Unite
d St
ates
Urug
uay
6.9
10.5
19.2 3.1
3.3
14.7
10.3 2.2
10.8
11.9
14.3 9.0 7.8 14.7
12.9
36 28 7 46 44 12T 29 47 26 20 14 30 33 12T 17
5.6
12.7
13.7
6.3 7.3 27.2 5.6 7.6 10.9
21.7
16.2 9.6
9.0
19.7
19.6
45T
23 20 42T 41 5 45T
40 26 8 15 30T
34T 10 11
3.3
12.8 8.2
5.4 7.2 27.8 6.9
9.6
6.2
17.5
11.2
12.9 6.5
14.2
12.8
48 16T 31 39T
34 2 35 28 37T 8 21 15 36 14 16T
9.7
11.2
16.8
13.4 7.5 24.4
8.0
10.5
16.9
27.2
17.2
11.9
11.4
18.1
24.5
38 33T 19 27T
45 9 41T
35T 18 4 17 31 32 15 8
2.0
14.4 4.9
2.8
4.7
18.0 4.2
4.2
3.3
17.4
8.7
4.8
6.2
10.4 4.5
49 9 29 42 31 5 34T
34T
39T 6 17 30 24 12 33
Sour
ces:
GEM
Glo
bal R
epor
t 201
8/19

GEM Egypt National Report 18/19 Appendix Tables 105
11.N
atio
nal
En
trep
ren
eurs
hip
Co
nte
xt I
nd
ex (
NE
CI)
an
d i
ts 1
2 C
om
po
nen
ts –
S
core
s fo
r 5
4 E
con
om
ies
ENTR
EPRE
NEUR
IAL
FINA
NCE
GOVE
RNM
ENT
POLI
CIES
:SUP
PORT
AND
RELE
VANC
E
ENTR
EPRE
NEUR
IAL
EDUC
ATIO
N AT
SCHO
OL S
TAGE
GOVE
RNM
ENT
ENTR
EPRE
NEUR
SHIP
PROG
RAM
S
ENTR
EPRE
NEUR
IAL
EDUC
ATIO
N A
TPO
ST S
CHOO
LST
AGE
Entre
prep
rene
ursh
ip C
onte
xt Fr
amew
ork C
ondi
tions
Sco
res R
re-s
cale
d to
10 p
oint
s)
R&D
TRAN
SFER
CO
MM
ERCI
ALAN
D LE
GAL
INFR
ASTR
UCTU
RE
PHYS
ICAL
INFR
ASTR
UCTU
RE
ENTR
EPRE
NEUR
IAL
EDUC
ATIO
N AT
SCH
OOL
STAG
E
INTE
RNAL
MAR
KET
DYNA
MIC
S
ENTR
EPRE
NEUR
IAL
EDUC
ATIO
N AT
POST
SCH
OOL
STAG
E
NECI
SCOR
EEC
ONOM
YRA
NK/4
9GO
VERN
MEN
T PO
LICI
ES: T
AXES
AND
BU
REAU
CRAC
Y
Ango
la
Arge
ntin
a
Aust
ria
Braz
il
Bulg
aria
Cana
da
Chile
Chin
a
Colo
mbi
a
Croa
tia
Cypr
us
Egyp
t
Fran
ce
Germ
any
Gree
ce
Guat
emal
a
Indi
a
Dom
inic
anRe
publ
ic
4.13
5.24
5.54 4.18
4.66
5.54
5.09 5.61
4.79
3.83
5.09 4.57
4.72
5.62
5.36
4.34
4.33 6.19
50 21 13 48 36 12 26 11 32 53 27 38 34 10 19 42 44 5
2.87
3.56
5.54
5.34
5.82
5.85
4.26 5.11
3.56 4.41
4.19
2.98
4.88 5.2
5.28
4.43 3.01
6.27
4.06 6.91
5.17
3.07 3.51
5.49
5.79
5.32 4.31
3.13
5.18 3.9
4.74
6.51
4.76
3.66
2.36 7.0
4
4.06
4.03
4.44
2.25 5.01
4.78 5.21 5.11
4.05
2.33 5.71
4.07
3.88
5.94
4.82
2.86
3.94
5.23
3.48
5.84
6.87
3.72
3.87
5.39 6.2
4.96
5.06
3.65 4.11 5.6
4.42
6.27
6.46 3.71
3.34
6.33
3.57 3.3
2.91
2.46 3.14
4.59
2.65 3.75
3.77
2.72
3.61 2.6
2.58 3.21
3.36
3.07
2.54
5.02
4.28
5.58 5.81
4.53 4.5
5.31 5.6
5.86
6.34 4.12
5.89
5.58 4.13
6.27
5.06
4.43
6.24 5.81
3.02 5 4.97
3.78
3.73
5.33 4.11
4.49 3.7
3.3
4.63
2.92
3.84
5.32
5.08
4.38
3.65 5.81
5.05
5.63 6.74
5.02
5.76
6.74
4.62 4.7
4.73 4.17
5.94 4.74
4.97
5.93
6.32
4.95
5.22
6.36
4.41
6.18
8.42
6.02 7.7 7.4
5
8.09
8.22
7.02
6.23 7.17
7.31
7.24
8.5
6.74
7.05
6.89 7.3
6
5.54 6.19
4.98
6.45 5.19
4.71
4.93 7.4
1
4.61 5.7
5.35
4.85 5.7
4.77
5.63
4.98
4.44 7.17
3.97
4.67
6.36
4.05
4.34 5.01
4.22 4.9
4.59
3.34
5.03
4.03
4.86
4.36 5.71
4.14
4.15
5.85
5.21
5.95 4.31
3.76
3.88 6.2
5.95
6.69 5.9
3.05 4.81
6.19
5.07
5.23
4.95
4.65 5.61 6.2

GEM Egypt National Report 18/19 Appendix Tables106
Indo
nesi
a
Iran
Irela
nd
Isra
el
Italy
Japa
n
Kaza
khst
an
Latv
ia
Leba
non
Luxe
mbo
urg
Mad
agas
car
Mex
ico
Mor
occo
Moz
ambi
que
Neth
erla
nds
Pana
ma
Peru
Pola
nd
Puer
to R
ico
Qata
r
Saud
i Ara
bia
Repu
blic
of K
orea
Russ
ian
Fede
ratio
n
6.57
4.29
5.38
5.08
4.52
5.28
4.93 5.21
4.67 5.7
4.14
5.21
4.26 3.15
6.51
4.01
4.54 5.21
4.07
6.69
5.49
4.63 4.4
2 46 17 28 40 20 31 22 35 8 49 23 47 54 3 52 39 24 51 1 14 37 41
6.57
4.24 5.81
5.85 5.13 5.5
3.82 5.31
5.25 4.61 3.11
4.44 4 1.9 6.5
3.43
3.96
5.83
3.45 5.81
5.18
3.66
3.57
6.97
4.25
5.37
4.09
4.44
5.96 6.1
4.64
3.66
6.08 3.67 5.14 3.8
2.03
5.98 3.17 3.8
5.42
3.23
6.89
6.83 4.16
4.94
6.07
3.26
4.94
2.84 3.47
4.49
5.03
4.05 3.81
5.87
3.57
4.08 4.41
2.76 6 3.55
3.58 3.5
2.49
6.44
4.94
3.66
4.03
6.27
3.23 6.16
4.39
4.37
4.91
5.09
4.95 4.17
6.96
3.37
5.63 3.77 2.5
6.35
4.67
4.62
4.85
3.88
6.57
5.72
3.58
4.43
5.69 3.21
4.18 3.11
2.95
2.58
3.53
4.59
4.42
4.49
2.59
3.37
2.07 1.9
7 6 2.11
3.37
3.03
2.62
6.76
3.77
3.21
1.94
7.08
4.18
5.56
5.26
4.95 4.6
4.49
5.29
5.32
6.28 6.12
6.45
4.46 2.51
6.87 4.4
5.53
4.48
5.57 7.3 4.84 5.3
3.46
6.07
3.67 5.11
4.81 4.5
5.52
3.46
4.42
3.65 5.73
3.63
4.68
2.88 2.12
5.89 3.5
3.76 4.19 3.5
6.41
4.46
2.99
3.09
6.39
3.96
5.79 6.3
4.75
4.87
5.26 6.7
5.74
5.86
4.83
4.92 5.51
4.01
6.77
3.89
4.55
5.54
4.87
6.29
4.74
5.63 4.2
7.18
6.35
5.93 7.7 5.54 8.15 6.7
7.8 4.37
7.36
4.73
7.46
7.34
5.55 8.51
6.71
6.27
8.02 5.3
8.01
7.43
6.69
6.89
7.38
6.29 4.71
5.23
5.57 7.75
5.91
4.78
4.75
4.33
5.72
6.26 5 5.35 5.9
4.48 4.72
7.45
5.09 7.16 8 7.11
5.51
6.03 4.3
5.6
4.15
4.78
4.94
4.22
5.06 4.19
5.76
3.73 4.1
3.43
3.46 6.51 3.3
4.52
4.76 4 5.91
4.19
3.52
4.06
7.17
4.65
5.95 7.73
3.89
4.02
5.49
5.26 7.2
2
5.38 4.19
6.21
4.21
3.49
6.85
5.07 6.21
5.37 5.1
6.81
5.69 5.19 6

GEM Egypt National Report 18/19 Appendix Tables 107
5.32
5.52
4.95
4.32 5.31 5.1
5.99
6.02
5.28 4.81
5.53 6.61
3.91
2.68
4.88
5.23 2.77
4.39 5.11
6.68 5.12
5.04
6.69 3.77
4.63
4.64
3.21 3.7
4.41
2.99
4.07
5.29 6.18
4.57
3.86 5.8
5.43 5.2
3.77
3.81
5.51
6.19
2.95 5.3
6.32
6.09
4.65
4.65 6.21
4.46
4.86
6.04
2.97
3.47 3.9
2.74
4.36
3.78
4.25 4.1
3.06
4.99
3.27
4.81
2.75
4.34 5.3
5.87
4.35
5.08
5.84
6.04
5.46 5.61
5.65
4.84 6.1
6.33
3.64 4.77
5.15
3.26 4.6
6.03
5.62
4.49 5 4.85
4.64
4.87 4.91
5.91
5.53
5.78
5.37 5.6
6.4
6.39
5.36 6.15
5.72
5.74
6.58 5.13
7.9 7.68
6.99
5.47
7.95
8.72
9.03 7.2
1
6.75
7.53
6.22 7.8
7
6.76
4.77
5.92
5.37
8.28
6.46
4.98 6.51
6.74
6.91
6.68
5.46 6.1
4.14
5.08
5.32 5.15
3.53
5.47
5.37
6.57
5.05
4.65 5.11
4.93
5.27
4.54
3.16
4.13
5.64
4.83
5.43
5.09
6.25 6.3
5.55
6.84
5.36
8.08
3.88
Slov
ak R
epub
lic
Slov
enia
Spai
n
Suda
n
Swed
en
Switz
erla
nd
Taiw
an
Thai
land
Turk
ey
Unite
d Ki
ngdo
m
Unite
d St
ates
Urug
uay
Unite
d Ar
ab
Emira
tes
4.34 5.18
5.38
4.29
5.37
5.68
6.33
5.48
5.05
5.92
4.94
5.98 4.72
43 25 16 45 18 9 4 15 29 7 30 6 33
Sour
ces:
GEM
Glo
bal R
epor
t 201
8/19
NECI
cal
cula
ted
in 10
poi
nt sc
ale (
1 = ve
ry b
ad e
-shi
p co
ntex
t, 10
= ve
ry g
ood
e-sh
ip co
ntex
t);
EFCs
aver
age s
core
s ass
esse
d in
Nat
iona
l Exp
ert S
urve
y in
9 poi
nt Li
kert
scal
e (1=
high
ly in
suffi
cien
t; 9=
high
ly su
ffici
ent)
re-s
cale
d to
10 p
oint
s for
the p
urpo
se o
f NEC
I.
TO C
ITE
THIS
REP
OR
T:
Ism
ail,
A.,
Tolb
a. A
., Ba
raka
t, Sh
., M
eshr
eki,
H.,
& G
halw
ash,
S.
(201
9).
Glo
bal
Entr
epre
neur
ship
Mon
itor.
Egyp
t Nat
iona
l Rep
ort.
Cai
ro: T
he A
mer
ican
Uni
vers
ity in
C
airo
, for
Glo
bal E
ntre
pren
eurs
hip
Mon
itor.
http
s://
ww
w.g
emco
nsor
tium
.org
/eco
nom
y-pr
ofile
s/eg
ypt

AUC AVENUE - P.O. BOX 74 NEW CAIRO 11835 - EGYPT
TEL +20 2 0615 3290
WWW.AUCEGYPT.EDU/BUSINESS
© 2018 All rights of this publication are reserved and therefore cannot be reproduced in its totality, its part, recorded or transmitted by any information retrieval system in any way, by any means mechanical, photochemical, electronic, magnetis, electrooptical, digital, photocopying or otherwise, without the prior permission in writing by authors.