Effortful listening under the microscope: examining relations ...
52
Effortful listening under the microscope: examining relations between pupillometric and 1 subjective markers of effort and tiredness from listening 2 3 4 Ronan McGarrigle, Lyndon Rakusen, & Sven Mattys 5 6 Department of Psychology, University of York, UK. 7 8 9 10 11 ACCEPTED IN PSYCHOPHYSIOLOGY 12 13 14 15 16 17 18 19 Corresponding author: Ronan McGarrigle, Department of Psychology, University of York, UK, 20 YO10 5DD. 21 Email: [email protected] 22
-
Upload
khangminh22 -
Category
Documents
-
view
0 -
download
0
Transcript of Effortful listening under the microscope: examining relations ...

Effortful listening under the microscope: examining relations between pupillometric and 1
subjective markers of effort and tiredness from listening 2
3
4
Ronan McGarrigle, Lyndon Rakusen, & Sven Mattys 5
6
Department of Psychology, University of York, UK. 7
8
9
10
11
ACCEPTED IN PSYCHOPHYSIOLOGY 12
13
14
15
16
17
18
19
Corresponding author: Ronan McGarrigle, Department of Psychology, University of York, UK, 20
YO10 5DD. 21
Email: [email protected] 22

Abstract 23
Effort during listening is commonly measured using the task-evoked pupil response (TEPR); a 24
pupillometric marker of physiological arousal. However, studies to date report no association between 25
TEPR and perceived effort. One possible reason for this is the way in which self-report effort 26
measures are typically administered, namely as a single data point collected at the end of a testing 27
session. Another possible reason is that TEPR might relate more closely to the experience of tiredness 28
from listening than to effort per se. To examine these possibilities, we conducted two pre-registered 29
experiments that recorded subjective ratings of effort and tiredness from listening at multiple time 30
points and examined their co-variance with TEPR over the course of listening tasks varying in levels 31
of acoustic and attentional demand. In both experiments, we showed a within-subject association 32
between TEPR and tiredness from listening, but no association between TEPR and effort. The data 33
also suggest that the effect of task difficulty on the experience of tiredness from listening may go 34
undetected using the traditional approach of collecting a single data point at the end of a listening 35
block. Finally, this study demonstrates the utility of a novel correlation analysis technique (‘rmcorr’), 36
which can be used to overcome statistical power constraints commonly found in the literature. 37
Teasing apart the subjective and physiological mechanisms that underpin effortful listening is a 38
crucial step towards addressing these difficulties in older and/or hearing-impaired individuals. 39
40
41
42
43
44
45
46
47

Introduction 48
Understanding speech in everyday environments is fraught with challenges arising from a 49
variety of sources, including the level and/or type of interfering acoustic signals present as well as the 50
sensory-cognitive profile of the listener (Mattys et al., 2012). This is because successful speech 51
understanding in adverse conditions relies upon both the fidelity of the acoustic signal that impinges 52
our senses and the ‘top-down’ cognitive mechanisms and linguistic knowledge that help to make 53
sense of the incoming signal (McClelland & Elman, 1986; Pisoni, 1985; Rönnberg et al., 2008). 54
Speech understanding difficulty is exacerbated when to-be-ignored background sounds contain 55
meaningful information; a phenomenon often referred to as ‘informational’ masking (Kidd et al., 56
2008). Indeed, the presence of a competing talker during listening can lead to poorer speech 57
understanding ability (Agus, Akeroyd, Gatehouse, et al., 2009) as well as a more negative perception 58
of speech understanding performance (Agus, Akeroyd, Noble, et al., 2009). 59
However, speech understanding in the presence of a competing talker does not only incur 60
costs in terms of intelligibility. There is growing interest in uncovering ways to measure not just an 61
individual’s ability to recognise speech, but also the cognitive effort required to achieve this goal. 62
This is often referred to as ‘listening effort’; defined recently as ‘the deliberate allocation of resources 63
to overcome obstacles in goal pursuit when carrying out a (listening) task.’ (Pichora-Fuller et al., 64
2016). In particular, it is believed that a better understanding of mental effort allocation will allow a 65
more comprehensive picture of hearing impairment (McGarrigle et al., 2014). Effortful listening is 66
also a common experience for individuals listening to speech in a second (i.e., non-native) language 67
or in an unfamiliar accent (Borghini & Hazan, 2018; McLaughlin & Van Engen, 2020). Repeated or 68
sustained episodes of effortful listening may lead to an exacerbated sense of tiredness or fatigue1. The 69
types of measures commonly used to extract information relating to effortful listening vary from 70
1 We use the terms ‘tiredness’ and ‘fatigue’ interchangeably. ‘Fatigue’ from listening is the terminology most
commonly found in the literature, but the scale administered in the present study refers specifically to ‘tiredness’
from listening.

subjective measures (e.g., self-report questionnaires) to behavioural (e.g., response times) and 71
physiological (e.g., measuring brain activity either directly or indirectly). 72
Self-report measures of listening effort provide important and ecologically valid insights 73
about the subjective experience of effortful listening. However, they may be prone to bias (Moore & 74
Picou, 2018) and provide limited information about the underlying physiological mechanisms 75
involved. In recent years, there has been a spike in the number of studies using physiological 76
measures to monitor listening effort (see Francis & Love, 2020 for a summary). A commonly-used 77
physiological marker of listening effort can be determined using pupillometry, an eye-tracking 78
technique. Fluctuations in the size of the eye’s pupil reflect not just adaptive changes to 79
environmental light (e.g., the ‘light reflex’) but also cognitive-evoked changes that can be traced to 80
changing activity patterns in the brain stem’s locus coeruleus (Mathôt, 2018). The locus coeruleus 81
sends and receives projections to and from the cortex, and is thought to govern moment-to-moment 82
changes in our states of attention and arousal (Aston-Jones & Cohen, 2005). In the context of hearing 83
research, the task-evoked pupil response (TEPR) has widely been shown to be sensitive to the 84
increased demands of listening in suboptimal acoustic conditions (see Zekveld et al., 2018 for a 85
review), and is therefore thought to reflect the effort required to achieve speech recognition under 86
degraded listening conditions. However, while TEPR has consistently been shown to be sensitive to 87
task demand, it has not yet been found to correlate with subjective reports of effort (Koelewijn et al., 88
2012; Strand et al., 2018) or fatigue (McGarrigle et al., 2017; Wang et al., 2018) during a listening 89
task. 90
Koelewijn et al. (2012) examined the effect of speech reception threshold (SRT; 50%, 84%) 91
and masker type (single-talker, stationary noise, and fluctuating noise) on TEPR and subjective effort 92
in a group of normal-hearing adults. SRTs were calculated for each participant by adjusting the level 93
of the target speaker relative to the level of the masker until a pre-specified performance level was 94
determined. In this case, SRT 50% represents the more-challenging listening condition (i.e., 95
performance ~ 50% correct), and SRT 84% represents the less-challenging condition (i.e., 96
performance ~ 84% correct). Subjective effort ratings were administered at the end of each condition 97

block on a continuous scale. Overall, TEPRs were larger and self-reported effort ratings higher in the 98
single-talker masker condition relative to the stationary and fluctuating noise masker conditions. 99
Further, TEPRs and effort ratings were also sensitive to listening demand; the SRT50% showed larger 100
TEPRs and higher effort ratings compared to the SRT84% condition. However, correlation analyses 101
revealed no significant associations between subjective effort and TEPR; a finding that is consistently 102
reported in the literature (McGarrigle et al., 2014; Pichora-Fuller et al., 2016; Strand et al., 2018). 103
While evidence for an association between subjective and physiological markers of effort is 104
clearly lacking, there are also conflicting views on the extent to which (or the circumstances under 105
which) the experience of ‘effort’, as measured in laboratory settings, may lead to the experience of 106
‘fatigue’ from listening (Francis & Love, 2020; Hornsby et al., 2016; McGarrigle et al., 2014). 107
Fatigue is a multi-faceted construct that has been operationalised using subjective, behavioural, and 108
physiological markers (Hockey, 2013). However, frequent anecdotal reports of tiredness and fatigue 109
from listening in individuals with a hearing loss have sparked an interest in the subjective 110
manifestation of fatigue (Alhanbali et al., 2017; Holman et al., 2019; Hornsby et al., 2016; Hornsby & 111
Kipp, 2016). Importantly, like effort, the experience of tiredness from listening is not currently 112
tractable based on standard speech understanding assessment procedures alone (e.g., speech 113
recognition performance). 114
The number of studies investigating listening-related fatigue using subjective and 115
physiological measures have increased in recent years (McGarrigle et al., 2017; Moore et al., 2017; 116
Wang et al., 2018). Wang et al. (2018) found a significant negative correlation between TEPR and 117
reports of daily life fatigue; individuals who reported more daily fatigue had smaller peak TEPRs. 118
However, self-report measures of effort or fatigue were not administered during or after the 119
experimental task. McGarrigle et al. (2017) examined the effect of signal-to-noise ratio (SNR) on 120
TEPR and subjective reports of effort and fatigue during a sustained listening task. Following the 121
early task-evoked peak response, pupil size showed a more pronounced downward linear slope during 122
trials in the latter stages of the experiment and in particular for ‘hard’ versus ‘easy’ SNR conditions, 123
suggesting a reduction in the ability to sustain attention and arousal during the more demanding 124

listening condition. Self-reported effort (but not fatigue) varied as a function of SNR. However, no 125
associations were found between TEPR and subjective reports of either effort or fatigue. Likewise, in 126
Moore et al. (2018), participants performed a sustained auditory processing task with a fixed task-127
demand level while their EEG activity was recorded. Overall, participants reported increased fatigue 128
following the auditory processing task, suggesting that sustained auditory processing can elicit mental 129
fatigue. However, as with previous studies, no relationship was found when assessing the association 130
between subjective and physiological markers of fatigue. 131
In the studies described above, single self-report evaluations of effort (Koelewijn et al., 2012) 132
and fatigue (McGarrigle et al., 2017; Moore et al., 2017) were collected immediately after each 133
condition of interest, an approach that is fairly standard in the literature (Alhanbali et al., 2017; 134
Dimitrijevic et al., 2019; Rovetti et al., 2019; Strand et al., 2018). However, it is possible that the 135
subjective perceptions of effort and tiredness from listening may fluctuate over the course of a 136
listening experience. While this is often taken into account when recording physiological activity like 137
electroencephalography (EEG) and pupillometry by recording at the level of individual trials, 138
concomitant changes in subjective experiences are rarely examined with a similar level of sensitivity. 139
As a result, the lack of an association between subjective and physiological measures may at least 140
partly reflect inherent differences in the precision with which they are measured. Further, in studies 141
that manipulate task difficulty (e.g., SNR), subjective judgements of effort or fatigue are likely 142
influenced by the conscious perception of a change in task demand or performance. In other words, a 143
listener who becomes subjectively aware of either a change in task demand and/or a change in their 144
own task performance, will likely use these more intuitive judgements to inform their effort or 145
tiredness ratings. Subjective judgements of effort, in particular, are shown to be inversely correlated 146
with performance evaluation (Moore & Picou, 2018). 147
Systematic examinations of the relationship between domain-general mental fatigue and 148
TEPR can be found in the wider literature. Hopstaken et al. (2015) examined associations between 149
subjective mental fatigue and TEPR over the course of a visual working memory (‘2-back’) task. 150
Subjective fatigue scales were administered on seven consecutive occasions over the course of the 151

task. The authors found that TEPRs became smaller with higher ratings of mental fatigue, suggesting 152
that when subjective and physiological measures are recorded and analysed over more frequent time 153
intervals, TEPR appears to be related to the experience of fatigue. In a separate study, Gergelyfi et al. 154
(2015) examined associations between subjective fatigue and a host of physiological measures 155
(including EEG, skin conductance, and pupillometry) while participants performed Sudoku puzzles. 156
In contrast to Hopstaken et al. (2015), no association was found between subjective reports of mental 157
fatigue and TEPRs. These conflicting results suggest that the relationship between TEPRs and 158
subjective fatigue is more complex than initially assumed. Further, as only mental fatigue (and not 159
effort) was examined, it is difficult to ascertain whether TEPR is related more to the experience of 160
effort or to fatigue. 161
To summarise, despite a rapidly-growing literature highlighting the use of pupillometry as an 162
objective measure of listening effort (cf. Zekveld et al., 2018), no studies to date have reported a 163
robust association between TEPR and the subjective experience of effort. We speculate that a possible 164
reason for the lack of an association between subjective and physiological measures of effort and/or 165
tiredness from listening is that self-report measures are typically collected as a single data point ‘after-166
the-fact’. Collecting data in this manner implicitly assumes that participants can accurately reflect on 167
these subjective experiences, something which we know to be especially problematic for retrospective 168
estimations of effort exertion (Moore & Picou, 2018; Picou & Ricketts, 2018). Further, studies in the 169
literature have reported a potential link between between TEPR and mental fatigue, particularly when 170
examined over the course of an experimental session (Hopstaken et al., 2015; McGarrigle et al., 2017; 171
Wang et al., 2018). It is therefore possible that the TEPR may be more closely related to changes in 172
perceived tiredness (than with perceived effort) during an effortful listening task. 173
Based on our summary of the literature, we propose two potential competing accounts of the 174
relationship between TEPR and subjective effort and tiredness from listening. The ‘traditional’ 175
hypothesis refers to the assumption that subjective tiredness from listening is a consequence of the 176
repeated or sustained application of effortful cognitive processing (e.g., van der Linden et al., 2003), 177
and TEPR can be thought of as a physiological manifestation of this effort (McGarrigle et al., 2014; 178

Pichora-Fuller et al., 2016). In other words, if TEPR reflects transient listening effort, and if demands 179
on capacity increase with the onset of fatigue (Hockey, 2013), then as tiredness from listening (and/or 180
effort) ratings increase, so too should TEPR. Alternatively, a competing hypothesis can be derived 181
from the possibility that reduced TEPRs over time are a physiological manifestation of depleted task-182
related cognitive resources (Hopstaken et al., 2015; Kuchinsky et al., 2014; Wang et al., 2018), which 183
coincides with a more pronounced subjective experience of tiredness from listening. We refer to this 184
as the ‘resource depletion’ hypothesis. From this perspective, as tiredness from listening (and/or 185
effort) ratings increase, TEPRs should decrease2. 186
187
Experiment 1 188
Before examining covariance between subjective measures and TEPR, we firstly wanted to ensure 189
that we could replicate a TEPR effect that is commonly reported in the literature. Therefore the first 190
aim of Experiment 1 was to replicate Koelewijn et al.’s (2012) effect of SNR on TEPR during speech 191
recognition in the presence of a competing talker. The second aim was to uncover whether analysis 192
based on the collection of multiple data points would reveal overall differences in tiredness from 193
listening ratings as a function of SNR. In other words, would consideration of multiple self-report 194
administrations over the course of a listening task result in enhanced sensitivity to changes in 195
tiredness from listening than would be expected from the traditional approach of collecting just one 196
data point at the end of a testing condition? Finally, we aimed to examine relationships between TEPR 197
and subjective ratings of effort and tiredness from listening. For Experiment 1, participants performed 198
a speech recognition task in the presence of a competing talker and provided subjective ratings of 199
effort and tiredness from listening in two different SNR conditions; ‘easy’ and ‘hard’. The following 200
specific predictions were made: 201
2 We return to (and explicitly test) these theoretical predictions in Experiment Two.

(1) Larger overall mean TEPRs in the hard versus the easy condition, replicating the effect of 202
SNR on TEPR during speech recognition in the presence of a competing talker (Koelewijn et 203
al., 2012). 204
(2) Higher effort ratings in the hard versus the easy condition, replicating similar findings in the 205
literature (e.g., Koelewijn et al., 2012; McGarrigle et al., 2017) and higher tiredness from 206
listening ratings in the hard versus the easy condition, reflecting the increased sustained 207
perceptual demands of the more challenging (hard) condition and the improved sensitivity 208
afforded by collecting multiple subjective measurements. 209
(3) Positive correlation between overall mean TEPR and both subjective effort and subjective 210
tiredness from listening. This is based on the prediction that tiredness from listening increases 211
as a consequence of effortful listening, which is thought to be reflected in both TEPR and 212
subjective rating scores (Pichora-Fuller et al., 2016). 213
214
Method 215
Sample size, experimental design, hypotheses, outcome measures, and analysis plan for 216
Experiment 1 were pre-registered on the Open Science Framework (https://osf.io/uk32p). Raw data, 217
stimuli, and R scripts for analysis and plots can be found at https://osf.io/cdv2r/. 218
219
Participants 220
Twenty-eight young adults (5 male) aged 18 to 30 years took part in this experiment. This 221
sample size was based on a power analysis conducted using G*Power (Faul et al., 2009). Koelewijn et 222
al. (2012) reported a Cohen’s d effect size of .5 when comparing TEPRs in the presence of a single-223
talker masker in listening conditions similar to the current experiment. Based on the assumption that 224
within-subject conditions are highly correlated (say r = .70), a sample size of 27 participants would 225
therefore provide an estimated power of .80 to detect a difference between these conditions if one is 226

present at the .05 alpha error probability. To ensure that an equal number of participants were 227
included in each of our four counterbalanced item lists (see below), we rounded the sample size to 28. 228
All participants were native-English speakers who reported: (i) normal or corrected-to-normal 229
visual acuity, (ii) no known eye condition, and (iii) no history of suffering from claustrophobia (due to 230
space restrictions in the testing booth) or any medical condition that could make them tired (e.g., 231
Chronic Fatigue Syndome, sleep disorder). All participants had normal hearing thresholds, measured 232
as ≤ 20 dB at 0.5, 1, 2, and 4 kHz in each ear. Participants were recruited either through flyers posted 233
around the University of York campus or as part of a course credit scheme for Psychology 234
undergraduate students. Participants who did not receive course credit were financially compensated 235
for their time. They provided informed written consent before participating in the experiment. The 236
study was granted ethical approval by the departmental research ethics committee at The University 237
of York (ID: 733). 238
239
Equipment 240
PTA testing was conducted using a Kamplex Diagnostic Audiometer AD 25. During the 241
subsequent testing, participants were positioned 65 cm away from a 24” flat screen LCD monitor, 242
which displayed the visual stimuli. The participant’s head was stabilised on a head- and chin-rest 243
which was secured to the end of a table. Stimulus presentation was programmed using the SR 244
Research Experiment Builder software, version 2.2.1 (SR Research, Mississauga, ON, Canada). 245
Auditory stimuli were presented via two speakers positioned either side of the computer monitor, at 246
45˚, and 315˚ azimuth angle. A microphone was positioned inside the test booth so that verbal 247
responses could be heard and scored online by the experimenter who listened via headphones, and 248
recorded for later inter-rater reliability checks. 249
Pupil size was recorded using the Eyelink 1000 Plus, at a sampling rate of 250 Hz. Pupil size 250
was recorded as an integer number corresponding to the number of thresholded pixels in the camera’s 251
pupil image. Typical pupil area can range between 100 and 10,000 units, with a precision of 1 unit. 252

This corresponds to a resolution of .01 mm for a 5 mm pupil diameter. The desktop-mounted eye 253
tracker camera was positioned in between the participant and the computer monitor at a distance of 55 254
cm from the participant (at 0˚ azimuth angle). The eye tracker camera was aligned to the centre of the 255
computer monitor screen, and was positioned just below the bottom of the flat screen to maximise the 256
trackable range without obscuring the participant’s view of the screen. 257
258
Materials 259
Target stimuli were IEEE sentences (Rothauser et al., 1969) produced by a male talker with a 260
standard Southern British accent. Each sentence contained five key words. The masker stimulus was a 261
female talker, also with a southern English accent, reading the standard phonetically-balanced 262
‘Rainbow Passage’ (Fairbanks, 1960). Target and masker stimuli were digitally mixed using a Matlab 263
script (Nike, 2020) to create .wav files at 20 different SNRs ranging from +4 dB to -15 dB for each of 264
the IEEE sentences used. These mixed files were subsequently used for the adaptive screening and 265
listening task (described below). A random 6-second portion of the masker audio file (total file 266
duration: 74 seconds) was selected for target-masker mixing. For each trial, masker onset began two 267
seconds before target onset and ended two seconds after target offset. Target stimulus presentation 268
level was fixed at 55 dB SPL. 269
270
Adaptive screening 271
The adaptive screening used an approach similar to the one-up one-down adaptive procedure 272
to estimate 50% speech recognition performance accuracy (Kaernback, 1991). The purpose of this 273
screening procedure was to calculate an SNR that could be used as the more challenging (hard) 274
condition in the subsequent listening task (described in the next section). A performance criterion 275
threshold of 50% correct was chosen as it has been shown to elicit the maximum TEPR (Ohlenforst et 276
al., 2017). Twenty IEEE sentences were used for the adaptive screening. Each IEEE sentence was 277
mixed with the masker stimulus to create 10 different SNRs ranging from -6 dB to -15 dB SNR, 278

resulting in the creation of a total of 200 mixed target-masker .wav files (20 sentences x 10 SNRs). 279
Participants heard 20 mixed target and masker sentences, which started at -6 dB and could reach a 280
lower limit of -15 dB. If participants responded correctly, the SNR decreased by 1 dB in the 281
subsequent trial. If participants responded incorrectly, the SNR increased by 1dB in the subsequent 282
trial. An incorrect response at the upper limit (i.e., -6 dB) or a correct response at the lower limit (i.e., 283
-15 dB) resulted in no change to the SNR in the subsequent trial (i.e., it remained at -6 dB or -15 dB, 284
respectively). Each participant’s 50% performance threshold was calculated as the mean SNR across 285
sentences 10-20 (rounded to the nearest whole number). In cases where a ‘.5’ decimal value was 286
calculated, we rounded down (e.g., -12.5 dB SNR was rounded down to -13 dB SNR). This adaptive 287
approach was implemented to ensure that the hard condition was sufficiently challenging to require 288
increased cognitive resource allocation, but not so challenging that it would lead to withdrawal from 289
the task (Borghini & Hazan, 2018). Overall, the mean adapted SNR value for hard condition was -9.5 290
dB (SD = 1.75). 291
292
Listening task 293
The SNRs used during the listening task were individually adapted according to each 294
participant’s performance during the adaptive screening. Mean SNR in the adaptive screening was 295
used as the fixed hard condition SNR in the listening task. The easy condition SNR was calculated as 296
the hard condition SNR plus 10 dB. For example, a hard condition SNR of -6 dB would result in an 297
easy condition SNR of +4 dB for the listening task. A total of 120 IEEE sentences were used to create 298
two target-masker lists (List 1 and List 2). IEEE sentences presented during the listening task differed 299
from those presented in the adaptive screening. For List 1, the first 60 IEEE sentences were digitally 300
mixed with the masker stimulus to create target-masker .wav files in the 10 possible SNRs for the 301
easy condition (from -5 dB to +4 dB). The last 60 IEEE sentences were then digitally mixed with the 302
masker stimulus to create a total of 60 target-masker .wav files in the 10 possible SNRs for the hard 303
condition (from -15 dB to -6 dB). For List 2, the same 120 IEEE sentences were used, but the easy 304
and hard condition stimuli from List 1 were swapped. Thus, the target sentences that were used in the 305

hard condition in List 1 were used in the easy condition in List 2, and vice versa. An additional four 306
IEEE sentences were mixed with the masker stimulus to create practice trials. 307
308
Subjective ratings 309
During the listening task, participants were administered three self-report rating scales. First, 310
subjective tiredness from listening was assessed as follows: 311
(1) How tired of listening do you feel? (100-step scale from Not at all – Extremely) 312
The choice of wording for this scale was taken from Picou, Moore, and Ricketts (2017) and was 313
chosen to tap tiredness arising specifically from listening demands, as opposed to other unrelated 314
processes (e.g., relating to visual fatigue). This measure has also been shown to have high test-retest 315
reliability (r = .84) and excellent internal consistency (α = .91) (Picou & Ricketts, 2018). Second, 316
subjective effort was assessed as follows; 317
(2) How hard did you have to work to understand what was said for the previous 5 sentences? 318
(100-step scale from Not at all – Extremely) 319
Subjective effort ratings were an adapted version of the NASA task load index item assessing mental 320
demand (Hart & Staveland, 1988), a commonly-used subjective measure of effort (Dimitrijevic et al., 321
2019; McGarrigle et al., 2017; Pals et al., 2019; Peng & Wang, 2019; Strand et al., 2018). Finally, we 322
assessed subjective performance evaluation as follows; 323
(3) How would you rate your performance accuracy on the previous 5 sentences? (100-step scale 324
from Poor – Good) 325
Subjective performance evaluation ratings were an adapted version of the performance scales used in 326
Moore and Picou (2018). This was included in an attempt to mitigate the possibility that participants 327
used perceived performance evaluation as a proxy of effort (Moore & Picou, 2018). 328

Participants provided responses using an on-screen slider bar with values ranging from 0 to 329
100 in increments of 1. A triangular icon was positioned on the mid-point of the scale (50) to begin 330
with and participants adjusted the icon using a mouse. Verbal anchors were positioned at each 331
endpoint of the slider scale. A ‘Click here to continue’ box was positioned at the bottom of the screen 332
which participants clicked on to advance to the next scale/trial. 333
334
Design and Procedure 335
On arrival, participants were seated comfortably in the sound-treated test booth and 336
completed Pure Tone Audiometry (PTA) testing following the British Society of Audiology 337
recommended procedure (2011). After the PTA test, eye tracker setup and calibration began. 338
Following the recommendations of Winn, Wendt, Koelewijn, and Kuchinsky (2018), soft room 339
lighting was used and the computer screen had a grey background with reduced brightness settings 340
(screen brightness measured at 100 cd/m2) to minimise any visual discomfort. The seat height and/or 341
chinrest could be adjusted to ensure that the participant was comfortable and their eyes were in line 342
with the upper third of the screen. A 5-point calibration procedure was performed and subsequently 343
validated. Participants were then given the following instructions prior to the adaptive screening task: 344
‘You will now perform a brief listening task. At the beginning of each trial, a black cross will be 345
displayed on the screen. You will then hear an audio recording of a female talker and a male talker. 346
The female talker will begin speaking before the male talker. Please continue to look at the black 347
cross while you listen. After listening to the speech, text will be displayed on the screen asking you to 348
respond. When prompted to do so, please repeat back the speech from the male talker only. If you are 349
unsure what he said, please feel free to have a guess.’ 350
Participants performed 20 trials during the adaptive screening, starting at an SNR of -6 dB. 351
Participants began each trial by fixating on a small black cross in the centre of the screen. The 352
experimenter was seated outside the test booth and used a wireless keyboard to control stimulus 353
presentation. After hearing and scoring the participant’s response, the experimenter pressed ‘y’ or ‘n’ 354

on the keyboard to indicate whether the verbal response was correct or not (‘y’ = yes, ‘n’ = no). 355
Participants could only advance to the next trial after the experimenter had provided a keyboard 356
response. A sentence was scored as correct only if all five key words were correctly identified and in 357
the correct order. For example, for the IEEE sentence ‘The birch canoe slid on the smooth planks’, 358
participants were only scored as correct if they accurately recalled all five key words in the correct 359
order (i.e., birch, canoe, slid, smooth, planks). Even minor deviations from a single key word, 360
including inflections or derivations (e.g., ‘plank’ instead of ‘planks’), were deemed to be an incorrect 361
response. The adaptive screening lasted approximately 5 minutes. 362
At the beginning of the listening task, the participants were informed of the approximate task 363
duration and that they would be asked to respond to subjective rating scales at periodic intervals 364
during the listening task. To familiarise themselves with the subjective rating scales, participants then 365
performed four practice trials (two in the easy SNR and two in the hard SNR). For the listening task, 366
stimuli were presented in a blocked fashion. easy and hard condition blocks each contained 60 trials. 367
To avoid order effects, the order of the two SNR conditions was counterbalanced across participants. 368
Before each block, participants provided a tiredness from listening scale response (used as a baseline 369
in the analysis). Effort and performance evaluation rating scales were administered after 5 trials 370
(totalling 12 responses each per block). The tiredness from listening subjective rating scale was 371
administered every 10 trials (totalling 6 responses per block). At the relevant trial intervals, the effort 372
scale was always administered first, followed by the ‘performance evaluation’ scale, followed by the 373
tiredness from listening scale. 374
In between blocks, participants were given the opportunity to rest inside the booth. In general, 375
participants tended to resume the experiment within one minute. A three-second inter-trial interval 376
(ITI) was incorporated in between the experimenter’s keyboard response to advance to the next trial 377
and the onset of the female talker masker. Thus, including the experimenter's scoring time (~1 sec), 378
there was at least 4-5 seconds between the participant’s verbal response and the recording of the 379
subsequent trial baseline. This is consistent with Winn et al.’s (2018) recommended ITI of 4-6 380
seconds for experiments involving verbal responses. Each condition block lasted approximately 18-20 381

minutes. Including PTA testing, eye tracker setup and calibration, instruction period, adaptive 382
screening, and the listening task, the total session lasted approximately one hour. 383
384
Analysis 385
Pupillometry 386
Pre-processing. Following the recommendations of Winn et al. (2018), pupil data were pre-387
processed to remove noise from the analysis. Following data collection, a sample report was 388
generated that included the pupil data for each participant and each trial. Gaze position is shown to 389
influence pupil size estimation (Brisson et al., 2013). Therefore, to limit the influence of pupil size 390
estimation errors caused by a rotated pupil (e.g., caused by looking at the corner of the screen), a 391
rectangular area of interest was created in the centre of the visual display surrounding the fixation 392
cross (left, top, right, and bottom screen coordinates: 131, 94, 874, and 675, respectively). Only data 393
from fixations that fell inside this perimeter were included in the sample report. These data were then 394
output as a text file and read into R Studio using R version 4.0.0 (R Development Core Team, 2019) 395
for pre-processing and analysis. 396
Any missing values in the data file (e.g., caused by blinks) were coded as ‘NA’ and linearly 397
interpolated across using values from previous and subsequent data points. Trials that contained > 398
25% missing data were removed from the analysis. This resulted in the removal of 46 trials across all 399
participants (1.4% of all trials in the data set). Baseline-correction was performed on each trial. The 400
two seconds of masker speech preceding the onset of the target speech was used as the baseline 401
window. The mean pupil size value recorded during this two-second window was then subtracted 402
from every sample recorded after target speech onset to provide a TEPR value. Consistent with the 403
literature (Winn et al., 2018), we found that TEPR started to emerge approximately one second after 404
target onset and peaked approximately one second after target offset (see Figure 2). As a result, TEPR 405
was calculated as the relative change from baseline during the 3-second window following target 406
speech onset. This helped to rule out any pupil size changes elicited by behavioural and/or preparatory 407
motor responses. 408
A repeated-measures ANOVA was conducted to examine mean differences in TEPR as a 409
function of condition (easy, hard) and block (1, 2, 3, 4, 5, 6). For the ‘rmcorr’ analysis (described in 410
more detail below), the pre-processed time series data were averaged providing a mean TEPR for 411
every 10 trials of the 60 in each condition. By-block mean TEPR values were calculated to assess 412
changes in TEPR over time. 413
414
Speech recognition performance 415
Speech recognition performance was calculated as the mean percentage of key words 416
correctly identified. Each trial contained five possible key words. The experimenter transcribed the 417
responses online during the task. A second independent rater transcribed the responses offline using 418
audio recordings of each trial3. All discrepancies between the independent rater scores were 419
subsequently resolved upon discussion. A repeated-measures ANOVA was conducted to examine 420
differences in mean speech recognition performance as a function of condition (easy, hard) and the 421
linear trend over time using block (1, 2, 3, 4, 5, 6) as a continuous factor. For the rmcorr analysis, 422
mean speech recognition performance percentage scores were calculated every 10 trials to assess 423
changes in performance accuracy over time. 424
425
Subjective ratings 426
Subjective ratings of effort, performance evaluation, and tiredness from listening ranged from 427
0 to 100. Tiredness from listening ratings were subtracted from a baseline score that was recorded at 428
the beginning of each block. Repeated-measures ANOVAs were conducted to examine differences in 429
3 Due to a programming error, no audio was recorded for the final trial of the first block (i.e., trial 60) for every
subject in Experiment 1. As a result, scores on this particular trial could not be verified by a second independent
reviewer.

effort, performance evaluation, and tiredness from listening ratings as a function of condition (easy, 430
hard) and the linear trend over time using block (1, 2, 3, 4, 5, 6) as a continuous factor. For the rmcorr 431
analysis, by-block mean scores were calculated by averaging the two scores provided within each 10-432
trial block. For example, the first two ratings (after trials 5 and 10) were averaged to reflect overall 433
effort/performance evaluation rating in block 1. Rating scores on trials 15 and 20 were averaged to 434
reflect overall effort/performance evaluation rating in block 2, and so on. 435
436
Correlations between measures 437
Correlations between TEPR, performance evaluation ratings, and tiredness from listening 438
ratings were examined using standard pearson’s correlation tests. These tests were performed on both 439
the overall data (i.e., collapsed across condition) and within each individual condition. The standard 440
correlation test approach (described above) can be useful in determining whether there are 441
associations between measures in terms of the overall scores that they produce. However, before 442
conducting these tests, scores must be averaged (e.g., across conditions or time points) in order to 443
meet the assumption of independence of error between observations; for example, there is likely to be 444
non-independence when sampling data from the same participants across multiple time points 445
(Bakdash & Marusich, 2017). Aggregation of scores in this manner can disguise potentially 446
informative intra-individual associations between these measures. An alternative approach to 447
analysing within-subject associations between variables that harnesses the high degree of statistical 448
power inherent in a fully repeated-measures design is repeated-measures correlation (‘rmcorr’) 449
(Bakdash & Marusich, 2017)4. Rmcorr analysis estimates the common regression slope (i.e., the linear 450
association shared amongst individuals) for two paired repeated measures, and can therefore be a 451
powerful statistical tool for assessing the extent to which two measures provide convergent 452
information. All rmcorr plots and analyses were conducted in R Studio. 453
4 The rmcorr analysis method was not preregistered prior to Experiment 1 data collection and so results therein
are treated as exploratory.

454
Results 455
Speech recognition performance 456
Figure 1 (left panel) shows speech recognition performance as a function of condition and 457
block. There was a significant main effect of condition on performance accuracy (F(1, 27) = 213.95, p < 458
.001, partial η2 = .89). Overall, performance accuracy was higher in the easy (Mean = 93.20%, SE = 459
0.59%) than the hard (Mean = 67.64%, SE = 1.93%) condition. There was also a significant main 460
effect of block on the linear term, (F(1, 27) = 29.60, p < .001, partial η2 = .52), with mean speech 461
recognition performance showing a general improvement over time. No significant difference was 462
found between conditions in terms of the linear change over time (F(1, 27) = 2.64, p = .12, partial η2 = 463
.09). 464
465
466

Figure 1. Left panel: Mean % correct speech recognition performance for each condition and block. 467
Right panel: Mean TEPR for each condition and block. Error bars represent the standard error of the 468
mean, SE. 469
470
TEPR 471
Figure 1 (right panel) shows mean TEPR as a function of condition and block. Figure 2 shows 472
the mean TEPR time series at the level of the individual trial (i.e., sentence recognition) in each 473
condition. There was a significant main effect of condition on mean TEPR (F(1, 27) = 30.51, p < .001, 474
partial η2 = .53). Overall, Mean TEPR was higher in the hard (Mean = 154.94, SE = 25.79) than the 475
easy (Mean = 77.06, SE = 19.98) condition. There was also a significant main effect of block on the 476
linear term, (F(1, 27) = 39.82, p < .001, partial η2 = .60), with mean TEPR showing a general decrease 477
over time. No significant difference was found between conditions in terms of the linear change over 478
time (F(1, 27) = 0.36, p = .55, partial η2 = .01). 479
480

481
Figure 2. Mean baseline-corrected task-evoked pupil response (TEPR; in arbitrary units representing 482
number of thresholded pixels) in the easy and hard conditions. Error bars represent the standard error 483
of the mean, SE. Vertical dotted lines represent the beginning and end of the TEPR interval. 484
485
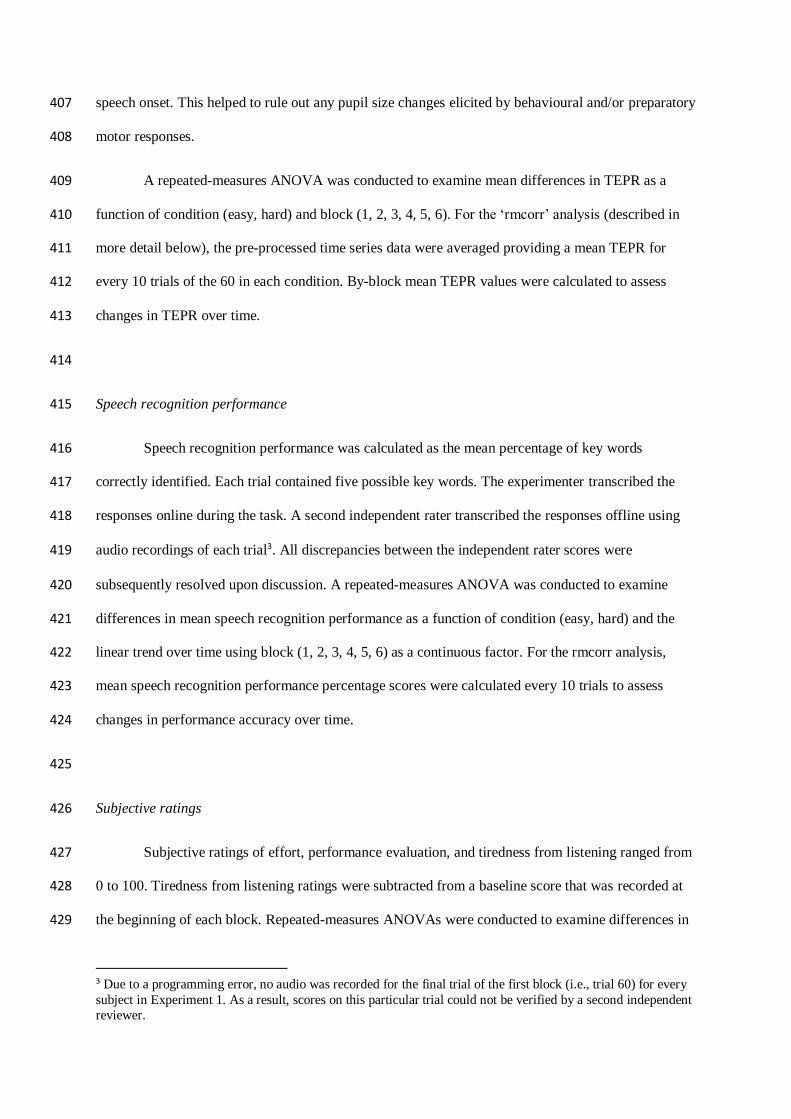
Subjective ratings 486
Figure 3 displays each of the three subjective rating scores (effort, tiredness from listening, 487
and performance evaluation) in each condition as a function of block. There was a significant main 488
effect of condition on effort ratings (F(1, 27) = 196.78, p < .001, partial η2 = .88). Overall, effort ratings 489
were higher in the hard (Mean = 66.49, SE = 2.23) than the easy (Mean = 32.28, SE = 2.49) condition. 490
There was no significant main effect of block on the linear term, (F(1, 27) = 1.22, p = .28, partial η2 = 491
.04). No significant difference was found between conditions in terms of the linear change over time 492
(F(1, 27) = 0.93, p = .34, partial η2 = .03). 493

There was a significant main effect of condition on tiredness from listening ratings (F(1, 27) = 494
5.35, p = .03, partial η2 = .17). Overall, tiredness from listening ratings were higher in the hard (Mean 495
= 16.85, SE = 2.69) than the easy (Mean = 7.07, SE = 2.77) condition. There was a significant main 496
effect of block on the linear term, (F(1, 27) = 81.09, p < .001, partial η2 = .75), with mean tiredness 497
from listening ratings showing a general increase over time. There was also a significant difference 498
between conditions in terms of the linear change over time (F(1, 27) = 4.34, p = .05, partial η2 = .14). 499
Tiredness from listening ratings showed a more steeply rising increase over time in the easy condition 500
than in the hard condition. 501
Finally, there was a significant main effect of condition on performance evaluation ratings 502
(F(1, 27) = 147.66, p < .001, partial η2 = .85). Overall, performance ratings were higher in the easy 503
(Mean = 68.13, SE = 2.40) than the hard (Mean = 35.95, SE = 2.50) condition. There was no 504
significant main effect of block on the linear term, (F(1, 27) = 3.72, p = .06, partial η2 = .12). No 505
significant difference was found between conditions in terms of the linear change over time (F(1, 27) < 506
0.001, p = .99, partial η2 < .001). 507
508
509
Figure 3. Mean subjective ratings (0-100 scale) for the easy and hard conditions as a function of 510
block. Tiredness from listening ratings were calculated as the relative change from a baseline recorded 511
at the beginning of block 1. Error bars represent the standard error of the mean, SE. 512
513
Correlations 514
Standard 515
Standard Pearson’s r (or Spearman’s rho) correlation tests were conducted to examine 516
relationships between each of the different measures both overall (i.e., collapsed across condition) and 517

within each condition. These analyses were conducted on data collapsed across blocks. A total of 12 518
correlation tests were conducted to test our hypotheses, resulting in a Bonferroni-corrected alpha 519
criterion significance level of .004 (.05/12). We found no significant correlation between overall mean 520
effort ratings and overall mean tiredness from listening ratings, rs = .38, p = .05, as well as no 521
significant correlation between effort ratings and tiredness from listening ratings within the easy 522
condition only (rs = .05, p = .82) or the hard condition only (rs = .27, p = .16). Mean TEPR did not 523
correlate with effort ratings overall (rs = -.17, p = .40) or within each condition (easy; rs = .02, p = .90, 524
hard; rs = -.16, p = .42). Mean TEPR also did not correlate with tiredness from listening ratings 525
overall (r = -.25, p = .21) or within each condition (easy; r = -.32, p = .10, hard; r = .05, p = .81). 526
Finally, mean TEPR did not correlate with speech recognition performance overall (rs = .08, p = .67) 527
or within each condition (easy; rs = -.28, p = .15, hard; rs = -.13, p = .51). 528
529
Rmcorr 530
Rmcorr analyses were conducted to explore associations between each of the dependent 531
variables at the intra-individual level. Six ‘block’ values were therefore collected for each participant 532
and each dependent variable to represent change over time. As with the standard correlation tests, we 533
examined relationships both overall (i.e., collapsed across conditions) and within each condition. We 534
examined all possible relationships between each of the five dependent variables (effort ratings, 535
tiredness from listening ratings, performance evaluation rating, speech recognition performance, and 536
TEPR), resulting in a total of 30 correlation tests. We therefore applied a Bonferroni-corrected alpha 537
criterion significance level of .001 (.05/30). 538
Table 1 shows rmcorr coefficients for within-subject correlation tests between all outcome 539
measures. Rmcorr yielded a positive relationship between overall mean effort ratings and overall 540
mean tiredness from listening ratings. Higher effort ratings were associated with higher tiredness from 541
listening ratings. Condition-specific analyses revealed that this association was significant in the easy, 542
but not the hard, condition. Changes in overall mean TEPR showed a negative correlation with 543

changes in overall mean tiredness from listening ratings. Smaller TEPRs coincided with increased 544
tiredness from listening ratings. Condition-specific analyses revealed that this association was 545
significant in the easy, but not the hard, condition. However, changes in mean TEPR did not correlate 546
with changes in mean effort ratings overall, nor within each condition. Significant negative 547
associations were found between mean tiredness from listening ratings and mean performance 548
evaluation ratings overall and within each condition. Tiredness from listening ratings generally 549
increased as performance evaluation ratings decreased. Speech recognition performance showed a 550
significant negative association with effort ratings both overall and within each condition. 551
Performance improvements were generally associated with reductions in perceived effort ratings. And 552
finally, significant negative associations were found between effort and performance evaluation 553
ratings both overall and within each condition. Effort ratings generally increased as performance 554
evaluation ratings decreased. All other correlation test results were non-significant (ps > .001) 555
556
Table 1. Rmcorr correlation coefficients (and 95% confidence intervals) for within-subject correlation 557
tests between all outcome measures. 558
1 2 3 4
Overall
1. TEPR
2. Effort rating .03 [-.14, .19]
3. Tiredness from listening rating -.40 [-.53, -.25] .37
[.21, .50]
4. Performance evaluation rating .09 [-.07, .26] -.70 [-.78, -.61]
-.42 [-.55, -.27]
5. Speech recognition performance -.25 [-.40, -.08] -.31
[-.45, -.15] .19 [.03, .35]
.24 [.08, .39]
Easy condition only
1. TEPR
2. Effort rating .06 [-.11, .23]
3. Tiredness from listening rating -.29 [-.43, -.13]
.39 [.24, .52]

4. Performance evaluation rating .05 [-.22, .12] -.76 [-.83, -.69]
-.36 [-.49, -.20]
5. Speech recognition performance -.19 [-.35, -.03] -.42
[-.55, -.28] .01 [-.16, .18] .48
[.34, .60]
Hard condition only
1. TEPR
2. Effort rating .11 [-.06, .27]
3. Tiredness from listening rating -.20 [-.36, -.04] .19 [.03, .35]
4. Performance evaluation rating .04 [-.20, .13] -.68 [-.76, -.58] -.28 [-.42, -.11]
5. Speech recognition performance -.15 [-.31, .02] -.42 [-.55, -.27]
.07 [-.10, .23] .41 [.26, .54]
Note, coefficients in bold are significant at the Bonferonni-corrected alpha criterion of p < .001. 559
560
Discussion 561
For Experiment 1, the primary objectives were to: (1) replicate the effect of SNR on TEPR 562
during a competing talker task (Koelewijn et al., 2012), (2) examine whether subjective effort and 563
tiredness from listening ratings also change as a function of SNR, and (3) test for associations 564
between TEPR and subjective ratings of effort and tiredness from listening. First, participants showed 565
a larger TEPR in the hard than the easy condition, replicating Koelewijn et al. (2012). This suggests 566
that a 10 dB reduction in SNR elicits an increase in the allocation of cognitive resources required to 567
understand speech in the presence of a competing talker. This primarily served as a manipulation 568
check and helped to ensure that we were examining a well-established pupillometry effect. Second, 569
we found an effect of SNR on both subjective effort and tiredness from listening ratings, with higher 570
ratings recorded in the hard versus the easy condition across both measures. Higher overall effort 571
ratings in the hard versus the easy corroborates findings in the literature, clearly demonstrating an 572
effect of SNR on subjective effort ratings (McGarrigle et al., 2017; McMahon et al., 2016; Rennies et 573
al., 2014; Seeman Scott & Sims Rebecca, 2015; Strand et al., 2018; Zekveld et al., 2010). Higher 574
overall tiredness from listening ratings in the more adverse (i.e., negative) SNR condition supports 575
Picou, Moore, and Ricketts (2017), but not McGarrigle et al. (2017). This discrepancy may relate to 576
the methodology used; both the present study and Picou, Moore and Ricketts (2017) used a scale that 577

specifically assessed tiredness from listening, whereas McGarrigle et al. (2017) administered the 578
domain-general Visual Analog Scale for Fatigue (VAS-F) to examine differences in listening-related 579
fatigue. It is possible that the tiredness from listening scale is more sensitive to the kinds of challenges 580
posed by adverse SNRs. However, it is also noteworthy that the effect of SNR emerged only when 581
data were aggregated across an entire block. In other words, the traditional approach of administering 582
a questionnaire pre- and post- manipulation would have likely revealed no such effect of SNR, as only 583
the final data point would have been entered into the analysis (cf. Figure 3). This suggests that 584
perceived tiredness/fatigue may show differences in fluctuation patterns as a function of SNR, and 585
highlights the importance of administering self-report scales on a continuous basis to capture 586
potentially subtle differences in perceived tiredness from listening. 587
The difference in tiredness from listening ratings between the easy and hard conditions 588
appeared to reduce over time (see Figure 3). This pattern of change is somewhat unexpected; although 589
no study to our knowledge has specifically investigated this phenomenon, it would be intuitive to 590
predict that tiredness from listening might show a steeper linear increase over time, reflecting the 591
heightened demands of sustained effort, in more challenging listening conditions (cf. Hornsby, 2013; 592
McGarrigle et al., 2017). One possible interpretation for the observed data could stem from changes 593
over time in the relative contributions of perceived duration and task demand. In other words, 594
perceived demand (i.e., how adverse the SNR is) and duration (i.e., how long the task feels) both 595
likely influence our own subjective tiredness judgements. However, the relative contribution of each 596
may change as a function of time such that duration becomes more salient as the task progresses, thus 597
mitigating the relative influence of task demand. It should also be noted that, even in the hard 598
condition, mean tiredness from listening ratings did not exceed 30/100 (see Figure 3). This suggests 599
that, although the hard condition was found to be more tiring than the easy condition overall, 600
individuals did not report particularly high levels of tiredness from listening. 601
Finally, correlation tests between each of the primary dependent variables yielded no 602
significant associations. On the other hand, exploratory ‘rmcorr’ analyses revealed significant within-603
subject associations between several outcome measures (see Table 1). In particular, a negative within-604

subject association was found between overall TEPR and tiredness from listening, but not TEPR and 605
effort; reduced TEPRs were associated with increased tiredness from listening ratings, but no change 606
in effort ratings. This suggests that changes over time in TEPR are more closely related with the 607
perceptual experience of tiredness from listening than with effort. Further, a positive within-subject 608
association was found between overall effort and tiredness from listening ratings, lending support to 609
Hockey’s (2013) model of fatigue which proposes that one’s evaluation of demands on capacity (i.e., 610
effort rating) changes dynamically with the onset of fatigue. The finding of a relationship between 611
subjective effort and tiredness also corroborates Alhanbali et al. (2017) who reported a significant 612
positive relationship between effort and fatigue ratings. 613
Rmcorr analysis also revealed a significant negative within-subject association between 614
performance evaluation ratings and both effort and tiredness from listening ratings. Generally, effort 615
and tiredness from listening ratings went up as performance evaluation ratings went down. The 616
significant association between effort and performance evaluation provides further support for Moore 617
and Picou’s (2018) assertion that effort ratings at least partly reflect the more intuitive evaluation of 618
one’s own performance. The association between performance evaluation ratings and tiredness from 619
listening hints at a potentially interesting relationship between tiredness and self-efficacy (i.e., belief 620
in one’s own ability to succeed). The possibility that tiredness from listening may have a cascading 621
effect on one’s own evaluation of communication success has potential implications for hearing 622
rehabilitation strategies. For example, targeting a reduction in tiredness from listening during 623
rehabilitation could become increasingly important if it is found to influence an individual’s 624
willingness to engage socially and ‘persevere’ in an adverse communication setting (Smith et al., 625
2011). 626
Correlation results demonstrated differences between the associations revealed by standard 627
(pearson’s r) correlation tests and rmcorr analyses. There are a number of potential reasons for these 628
discrepancies. Standard correlation tests and rmcorr analyses are designed to test fundamentally 629
different types of research question. In the case of the standard correlation test, the question is a 630
‘between-subject’ one; for example, do people who report high subjective ‘effort’ also show larger 631

TEPRs? In contrast, the question examined with rmcorr analysis is of a ‘within-subject’ nature; for 632
example, when individuals show a larger increase in TEPR during a listening task, does this also 633
coincide with a larger increase in effort ratings? 5 Another key difference between the two tests which 634
likely impacted the results observed relates to statistical power. For standard correlation tests, within-635
subject data are often aggregated to meet statistical independence assumption requirements which 636
reduces overall statistical power (Bakdash & Marusich, 2017). However, rmcorr retains and models 637
this within-subject variance, resulting in increased power to detect an association where one exists 638
(discussed in more detail in the ‘General Discussion’). 639
Given the exploratory nature of the above rmcorr analyses, further examination is required to 640
verify the associations reported above (Wagenmakers et al., 2018). Although tiredness from listening 641
ratings were found to be negatively associated with TEPRs, mean change in tiredness from listening 642
remained relatively low in Experiment 1 (≤ 20/100; see Figure 3), even towards the latter stages of the 643
hard condition. Simulating a more sustained effortful listening task could induce more variability in 644
tiredness from listening and effort ratings, and therefore shed light on the associations between TEPR, 645
subjective ratings of effort, tiredness from listening, and performance evaluation. 646
647
Experiment 2 648
Experiment 2 had two primary aims: (1) to verify the intra-individual associations found in 649
Experiment 1, and (2) to induce a larger degree of variability in the subjective rating scores by 650
simulating a more sustained effortful listening task. In doing so, we were able to more directly test the 651
predictions of the ‘traditional’ versus the ‘resource depletion’ accounts of the relationship between 652
TEPR and subjective reports of tiredness from listening. Further, changes in speech recognition 653
performance have been shown to influence subjective judgements of effort (Moore & Picou, 2018; 654
Picou et al., 2017). Using a single fixed level of task demand (i.e., SNR) therefore permits a closer 655
5 Although rmcorr and standard correlation tests will often show a similar pattern, this may not always be the
case (cf. ‘Simpson’s paradox’ discussion in Bakdash & Marusich, 2017).

inspection of possible associations between TEPR and subjective effort and tiredness from listening 656
that are less likely to be influenced by changes in speech recognition performance. By administering a 657
task that taxes both perceptual capacities (i.e., listening) and sustained attention, we were also able to 658
test the predictions of Hockey’s (2013) motivation control theory of fatigue which posits that fatigue 659
influences the evaluation of demands on capacity. Therefore, the following predictions were made: 660
(1) Changes in TEPR will either be: (a) positively related to changes in effort and tiredness from 661
listening ratings (traditional hypothesis) or (b) negatively related to changes in tiredness from 662
listening (resource depletion hypothesis). 663
(2) Subjective effort ratings will be positively related to subjective tiredness from listening 664
ratings, supporting Hockey’s (2013) motivation control theory of fatigue prediction that 665
fatigue influences one’s own evaluation of demands on capacity. 666
(3) Tiredness from listening ratings will be negatively related to speech recognition performance, 667
supporting the idea that fatigue has a detrimental impact on task performance (Hockey, 2013; 668
DeLuca, 2005). 669
670
Method 671
Sample size, experimental design, hypotheses, outcome measures, and analysis plan for 672
Experiment 2 were all pre-registered on the Open Science Framework (https://osf.io/nya2g). Raw 673
data, stimuli, and R scripts for analysis and plots can be found at https://osf.io/6mbk7/. 674
675
Participants 676
Twenty healthy young adults (2 male) aged 18 to 30 years took part in this study. Only 677
participants who had not taken part in Experiment 1 were eligible to take part in Experiment 2. 678
Hopstaken et al. (2015) reported a Pearson’s r correlation of -.33 between TEPR and subjective 679
fatigue in their study. Based on power estimates for detecting a medium effect size when using the 680

repeated measures correlation (rmcorr) technique with k = 6 (see Figure 4; Bakdash & Marusich, 681
2017), we calculated that a sample size of 20 participants should provide > 80% power to detect an 682
association between these variables if one is present at the standard .05 alpha error probability. All 683
participants had hearing thresholds of ≤ 20 dB at .5 – 4 kHz in each ear. Otherwise, the same 684
eligibility criteria and recruitment methods were used as in Experiment 1. 685
686
Materials, Design, and Procedure 687
The equipment used, eye tracker setup, materials, design, and procedure were the same as 688
those of Experiment 1, with the following exceptions. Participants performed the task in one condition 689
(hard) only. This listening task included a total of 120 trials and lasted approximately 35-40 mins. 690
Participants performed the task continuously (i.e., without a break)6. Two stimulus lists were created, 691
and participants were randomly assigned to one of the two lists. List 1 consisted of the same 120 IEEE 692
sentences used in Experiment 1. List 2 consisted of 120 IEEE sentences not used in Experiment 1. 693
Based on pilot testing the new experiment amongst members of the lab, we decided to reduce screen 694
brightness from 100 cd/m2 to 70 cd/m2 to mitigate against the potential for participant discomfort. 695
Two practice trials were administered, using the same two IEEE sentences as in Experiment 1’s hard 696
practice trials. All three subjective rating scales were administered after the second practice trial to 697
establish baselines. The mean adapted SNR value for the main (hard) condition was -8.6 dB (SD = 698
1.88). 699
700
Analysis 701
Minor differences in how outcome measures were administered and/or scored in Experiment 702
2 were as follows. Subjective ratings of effort and performance evaluation were administered every 5 703
6 However, please note that the competing talker stimulus was not played continuously in the background. As in
Experiment 1, the masker stimulus started at the beginning of each trial and ended just before the speech
repetition prompt.

trials, resulting in a total of 24 ratings on each scale. Mean effort and performance evaluation rating 704
scores were therefore calculated by averaging over every four (rather than two) responses. For 705
example, block 1 effort and performance evaluation ratings reflected the average effort and 706
performance evaluation ratings as indicated after trials 5, 10, 15, and 20. Mean TEPR scores reflected 707
TEPRs averaged over every 20 trials. Subjective ratings of tiredness from listening were administered 708
every 20 trials (six ratings in total). A tiredness from listening subjective rating scale was 709
administered at the very beginning of the listening task (i.e., before trial one), and this score was used 710
as a baseline in the analysis. To summarise, each of the six blocks in Experiment 2 reflected scores 711
averaged over 20 (rather than 10) trials. The same pupil data pre-processing techniques were used as 712
in Experiment 1. However, on this occasion, data from one subject (s17) were removed due to having 713
72/120 trials with >25% missing data. Of the remaining data set, a total of 46 trials (2% of all trials in 714
the data set) were removed from the analysis due to > 25% missing sample values. One-way repeated 715
measures ANOVAs were conducted for each of the dependent variables to examine linear trend over 716
time. 717
718
Results 719
Speech recognition performance 720
Figure 4 (left panel) illustrates the general pattern of change in speech recognition 721
performance accuracy as a function of block. There was no significant main effect of block on the 722
linear term, (F(1, 19) = 0.004, p = .95, partial η2 < .001), with mean speech recognition performance 723
showing no linear change over time. 724
725

726
Figure 4. Left panel: Mean % correct speech recognition performance accuracy as a function of block. 727
Right panel: Overall mean task-evoked pupil response (TEPR; in arbitrary units representing number 728
of thresholded pixels) as a function of block. Error bars represent the standard error of the mean, SE. 729
730
TEPR 731
Figure 4 (right panel) illustrates the general pattern of change in mean TEPR as a function of 732
block. There was a significant main effect of block on the linear term, (F(1, 18) = 35.54, p < .001, 733
partial η2 = .66). Mean TEPR showed a general linear decrease over time. 734
735
Subjective ratings 736
Figure 5 displays the general pattern of results in each of the three subjective rating scores 737
(effort, tiredness from listening, and performance evaluation) as a function of block. For mean effort 738
ratings, there was no significant main effect of block on the linear term, (F(1, 19) = 0.65, p = .43, partial 739

η2 = .03), with mean effort ratings showing no linear change over time. For mean tiredness from 740
listening ratings, there was a significant main effect of block on the linear term, (F(1, 19) = 77.61, p < 741
.001, partial η2 = .80). Mean tiredness from listening ratings showed a general linear increase over 742
time. For mean performance evaluation ratings, there was no significant main effect of block on the 743
linear term, (F(1, 19) = 0.41, p = .53, partial η2 = .02), with mean performance evaluation ratings 744
showing no linear change over time. 745
746
747
Figure 5. Mean subjective rating scores as a function of block. Rating scores on the y axis ranged 748
from 0-100. Tiredness from listening rating scores were calculated as the relative change from a 749
baseline recorded at the beginning of block 1. Error bars represent the standard error of the mean, SE. 750
751
Correlations 752
Rmcorr 753
Rmcorr analyses were conducted to examine associations between the dependent variables at 754
the intra-individual level. We examined all possible pairwise correlations between the five dependent 755
variables (effort ratings, tiredness from listening ratings, performance evaluation rating, speech 756
recognition performance, and TEPR), resulting in a total of 10 tests. A Bonferroni-corrected alpha 757
criterion significance level of .005 (.05/10) was applied. 758
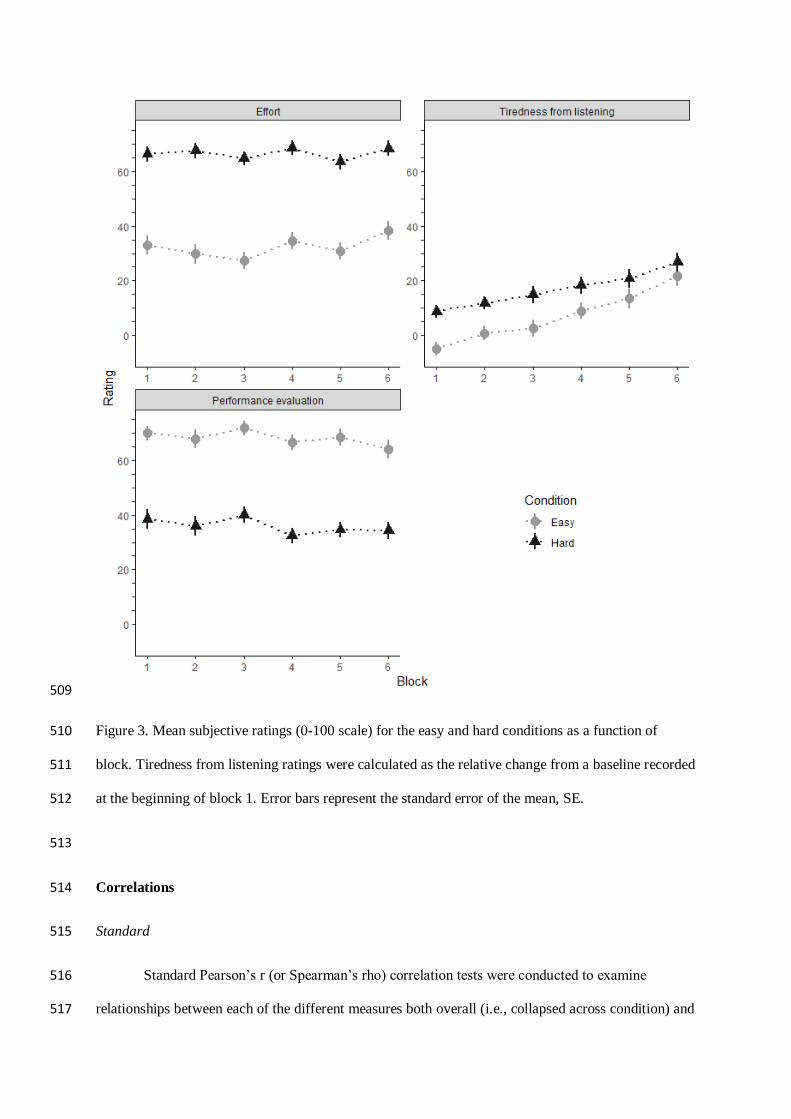
Figure 6 shows the rmcorr scatterplots pertaining to the main correlation tests of interest. 759
Table 2 shows rmcorr coefficients for within-subject correlation tests between all outcome measures. 760
Firstly, changes in mean TEPR showed a significant negative correlation with changes in mean 761
tiredness from listening ratings. Smaller TEPRs coincided with increased tiredness from listening 762
ratings. However, changes in mean TEPR did not correlate with changes in mean effort ratings. 763
Similarly, no significant relationship was found between changes in mean effort ratings and changes 764
in mean tiredness from listening ratings, nor between mean TEPR and speech recognition 765
performance. Finally, changes in tiredness from listening were not associated with either mean speech 766
recognition performance or mean performance evaluation ratings. 767
768

769

Figure 6. Rmcorr scatterplots showing within-subject associations between TEPR, effort ratings, 770
tiredness from listening ratings (reported as a change from baseline), and performance evaluation 771
ratings. Observations from a given participant are plotted in the same colour, with corresponding lines 772
showing the rmcorr fit for each participant. A single data point represents the aggregate mean value 773
for each subject on each of the six blocks. Mean data aggregation was performed over the following 774
trials: (1) TEPR; 20 trials within each block, (2) Effort and Performance evaluation ratings; four 775
ratings recorded after every 5 trials within each block, and (3) Tiredness from listening rating; a single 776
self-report rating value at the end of each block of 20 trials. 777
778
Table 2. Rmcorr correlation coefficients (and 95% confidence intervals) for within-subject correlation 779
tests between all outcome measures. 780
1 2 3 4
1. TEPR
2. Effort rating .03 [-.18, .23]
3. Tiredness from listening rating -.48 [-.63, -.31] .17 [-.02, .36]
4. Performance evaluation rating .11 [-.09, .31] -.71 [-.80, -.60] -.21 [-.39, -.01]
5. Speech recognition performance .05 [-.16, .25] -.49 [-.62, -.32]
.11 [-.30, .09] .59
[.44, .70]
Note, coefficients in bold are significant at Bonferonni-corrected alpha criterion of p < .005. 781
782
Discussion 783
Experiment 2 aimed to more closely examine intra-individual associations between TEPR, 784
subjective ratings of effort and tiredness from listening, and performance evaluation. Firstly, we found 785
evidence in favour of the ‘resource depletion’ account of the relationship between TEPR and tiredness 786
from listening; TEPRs became smaller as individuals reported increased tiredness from listening. 787
Once again, no association was found between changes in TEPR and subjective effort. Unlike 788
Experiment 1, no significant within-subject association was found between subjective ratings of effort 789

and tiredness from listening (possible reasons are discussed in the General Discussion). We found no 790
significant within-subject association between tiredness from listening and speech recognition 791
performance, suggesting that tiredness from listening did not have a detrimental impact on task 792
performance (Hockey, 2013). Finally, evidence for an association between tiredness from listening 793
and performance evaluation ratings was weaker (and non-significant) in this experiment (r = -.21) 794
compared with Experiment 1 (r = -.42). Potential reasons for these discrepant results are also 795
discussed in the General Discussion. 796
797
General Discussion 798
TEPR as a marker of tiredness from listening, not effort 799
In both experiments, a negative within-subject association was found between TEPR and 800
tiredness from listening ratings; as participants’ ratings of tiredness from listening increased, their 801
TEPRs became smaller. This effect was even stronger in Experiment 2 (r = -.48) than Experiment 1 (r 802
= -.40), suggesting that it is exacerbated by more sustained listening demands. On the other hand, 803
neither experiment revealed a significant association between TEPR and subjective effort ratings. This 804
finding lends weight to the argument that TEPR is not an objective correlate of the subjective 805
experience of listening effort (McGarrigle et al., 2014; Pichora-Fuller et al., 2016; Strand et al., 2018). 806
Instead, within-subject changes in TEPR appear to align more closely with the subjective experience 807
of tiredness from listening. This supports the characterisation of TEPR as a broad indicator of 808
physiological arousal that is governed by moment-to-moment changes in locus coeruleus activity 809
which serves to maintain goal-oriented attention (Aston-Jones & Cohen, 2005). Importantly, this 810
arousal-mediated activity appears to exhibit signs of disruption as a challenging mental task persists 811
and becomes fatiguing (Hopstaken et al., 2015; McGarrigle et al., 2017). 812
The TEPR reflects a physiological response that is time-locked to a particular stimulus or 813
event; in this case, perception of a sentence. The current study findings suggest that the strength of 814
TEPR declines over time, and shows an association with the perception of tiredness from listening. 815

However, as a marker of relative change from a baseline, the evoked pupil response may be 816
influenced by underlying changes in baseline pupil size across the duration of the experiment. In other 817
words, it is possible that the observed reduction in TEPR over time may be driven by, or at least 818
influenced by, more low-frequency fluctuations in arousal that are not necessarily time-locked to a 819
stimulus or event; characterised as ‘tonic’ (as opposed to ‘phasic’) changes in LC-mediated pupil 820
activity (Aston-Jones & Cohen, 2005). To explore this possibility, we conducted additional 821
exploratory rmcorr analyses testing for any associations between baseline pupil size, TEPR, and 822
tiredness from listening ratings (plots and rmcorr estimates are provided in supplementary materials). 823
These analyses yielded no significant associations between changes in baseline pupil size and either 824
TEPR or tiredness from listening ratings (ps > .05). This suggests that both the TEPR pattern 825
observed and the association between TEPR and tiredness from listening ratings in the current study 826
are not likely to have been driven by changes in baseline pupil size. 827
Results from the current study suggest that changes in TEPR over the course of a sustained 828
effortful listening task correspond more closely to the subjective experience of tiredness from 829
listening which show a pattern of change that is inversely related to TEPR; as TEPRs decrease in size, 830
tiredness ratings increase. On the other hand, within-subject changes in perceived effort appear to be 831
more closely driven by changes in performance evaluation, with both measures showing a more 832
constrained pattern of change over time. Figure 7 shows a hypothetical schematic illustration of how 833
each of these four measures reflect divergent patterns of change over time during a sustained effortful 834
listening task, based on the results of the current study. 835
These findings have implications for future experiments aiming to assess the impact of a 836
specific manipulation (e.g., listening demand or an intervention) on subjective outcome measures. 837
Previous research has shown that effort ratings are indeed sensitive to subtle (e.g., SNR) 838
manipulations of task demand (Krueger et al., 2017). This is perhaps unsurprising when we consider 839
the correlation between effort ratings and speech recognition performance reported both in the 840
literature (r = -.43; Picou & Ricketts, 2018) and in the current study (Experiment 1; r = -.31). 841
However, if the goal of a study is to examine how cognitive processes relating to listening change 842

over time, data from the current study suggest that subjective tiredness from listening ratings may be 843
more sensitive to the effects of sustained listening demands than are effort ratings. Rather than 844
reflecting moment-to-moment fluctuations in cognitive resource allocation, effort ratings appear to be 845
more fixed and prone to change only in response to modulations in task demand. 846
It is important to emphasise that, although we found no evidence of an association between 847
effort ratings and TEPRs, this does not mean that TEPR cannot provide useful information pertaining 848
to effortful listening; in fact, we would argue the opposite. At the within-subject level, changes over 849
time in physiological arousal during a listening task correspond more closely with the subjective 850
experience of tiredness. This may (at least, partly) be because the experience of ‘tiredness’ is simply 851
more tractable (and therefore easier to self-report) than the experience of ‘effort’, which in some cases 852
may be beyond our introspective capacities (Moore & Picou, 2018). Ultimately, this study highlights 853
the utility of pupillometry as a measure sensitive not just to changes in task demand but also to 854
moment-to-moment fluctuations in tiredness from listening. 855
856
857

Figure 7. Hypothetical schematic diagram of within-subject change over time during a sustained 858
effortful listening task for perceived effort, performance evaluation, task-evoked pupil response 859
(TEPR), and perceived tiredness from listening. Perceived effort is relatively high (and performance 860
evaluation relatively low) on the y axis to reflect the fixed (high) level of listening demand. Both 861
display a similar rate of change over time, with perceived effort increases coinciding with reduced 862
performance evaluation ratings. On the other hand, TEPR starts high (and tiredness from listening 863
low) on the y axis to reflect early heightened levels of task engagement and arousal and the fact that 864
fatigue has not yet started to accumulate. Both TEPR and tiredness then show a similarly steep rate of 865
change over time (albeit in opposite directions), to reflect the more pronounced cumulative effect of 866
time-on-task on both TEPR and tiredness from listening. 867
868
Relations between subjective measures 869
It is often suggested that the mental fatigue or tiredness from listening that is reported 870
anecdotally in hearing-impaired populations (Hétu et al., 1988; Backenroth & Ahlman, 2000; 871
Nachtegaal et al., 2009) is likely the consequence of repeated and/or sustained episodes of effort 872
allocation during listening (Hornsby et al., 2016; McGarrigle et al., 2014; Pichora-Fuller et al., 2016). 873
Hockey’s (2013) motivation control theory of fatigue proposed a more nuanced conceptualisation of 874
fatigue, suggesting that it serves as an emotion-like alerting mechanism which forces an individual to 875
re-evaluate their goals and priorities. In the former account, effort would be predicted to increase 876
fatigue (Hornsby et al., 2016; McGarrigle et al., 2014; Pichora-Fuller et al., 2016). In contrast, 877
according to Hockey’s (2013) account, fatigue would be predicted to influence our effort evaluations, 878
such that as fatigue increases, so too do effort evaluations. In either case, we would hypothesise a 879
positive relationship between these variables. Experiment 1 revealed a significant positive association 880
between changes in perceived effort ratings and changes in perceived tiredness from listening ratings, 881
supporting this prediction. However, in Experiment 2, this association was no longer significant. 882

Closer inspection of the data from Experiment 1 revealed that the relationship (when 883
collapsed across conditions) appears to have been driven primarily by the strength of the association 884
in the easy condition (r = .39), and not the hard condition (r = .19). Indeed, although non-significant 885
(p = .08), the effect size in Experiment 2 was similar to the effect size for the hard condition in 886
Experiment 1 (r = .17). This suggests that the relationship between effort and tiredness from listening 887
ratings may be contingent on the level of difficulty of the listening situation. This may result from an 888
unexpected interaction between perceived task demand and task duration; in adverse listening 889
scenarios, the most salient driver of effort ratings is likely the task demand (i.e., the SNR), and as long 890
this does not change, feelings of tiredness will not likely influence effort ratings. On the other hand, in 891
less adverse listening scenarios, a more salient factor influencing effort ratings may be the duration of 892
the task. Increases in perceived task duration may therefore lead to a heightened sense of fatigue 893
(Thoenes et al., 2018), thus facilitating a stronger association between effort and tiredness from 894
listening ratings. Future research could examine this possibility by, for example, asking individuals to 895
provide verbal time estimates during or after the listening task. 896
Experiment 1 revealed a negative association between changes in tiredness from listening and 897
changes in performance evaluation; as individuals reported increased tiredness from listening, they 898
also tended to rate their own speech recognition performance more negatively. Although this was an 899
exploratory finding, it hinted at the possibility of an association between an individual’s subjective 900
experience of tiredness from listening and their feelings of self-efficacy in a communication setting. 901
While a significant association was found in Experiment 1 (r = -.42), a weak (and non-significant) 902
association was found in Experiment 2 (r = -.21). Analyses of each condition subset in Experiment 1 903
yielded similar effect sizes for easy (r = .36) and hard (r = .28) conditions, suggesting that this effect 904
is unlikely to be contingent on the level of task demand. Taken together, this study provides moderate 905
evidence in favour of an association between tiredness from listening and performance evaluation. 906
However, further research is needed to verify and explore this potential relationship. 907
908
On the importance of (multiple) subjective ratings 909

In Experiment 1, we found an effect of SNR on tiredness from listening ratings, such that 910
individuals overall reported higher tiredness from listening in the hard versus the easy condition. 911
Visual inspection of the data (see Figure 3) suggests that this effect would have gone undetected had 912
we used the standard approach of collecting a single data point after each condition. This highlights 913
the importance of monitoring changes in subjective evaluations over the course of a listening task and 914
suggests not only that the subjective experience of tiredness from listening fluctuates over the course 915
of a listening experience, but also that this pattern of change interacts with the specific level of task 916
demand (in this case, SNR); a steeper increase in tiredness from listening was found in the more 917
favourable SNR in Experiment 1. However, the highest overall tiredness from listening ratings were 918
observed in the more sustained Experiment 2 (hard) condition (see Figure 5), suggesting that tiredness 919
from listening ratings are influenced by both task duration and perceptual demand. Changes in these 920
kinds of subjective judgements over the course of a communication scenario will likely influence 921
whether or not an individual chooses to withdraw or sustain engagement (Pichora-Fuller et al., 2016). 922
Therefore, a better understanding of how these phenomena change during, and not just after 923
(retrospectively), a listening task could potentially inform intervention strategies aimed at overcoming 924
barriers to communication. 925
926
Rmcorr 927
Many previous studies that have examined associations between subjective and objective 928
measures suffer from low statistical power; a problem that is by no means confined to this particular 929
field of enquiry (Clayson et al., 2019). Rmcorr represents a promising tool for harnessing the inherent 930
statistical power of repeated-measures designs to examine associations at the within-subject level 931
(Bakdash & Marusich, 2017). Studies on listening effort are typically designed to have sufficient 932
statistical power to detect differences (e.g., in TEPR) between two or more conditions, and not 933
necessarily associations between measures. For example, we reported an effect size of r = .4 for the 934
association between TEPR and tiredness from listening ratings. A statistical power calculation on 935
G*Power (Faul et al., 2009) reveals that, using the standard correlation approach (i.e., Pearson’s r or 936

Spearman’s rho), a minimum sample size of 46 subjects would be needed for the recommended 80% 937
power to detect an association. Indeed, the effect size of interest in this example (r = .4) is 938
considerably larger than many effect sizes of interest in the literature, which typically fall within the 939
small-medium range. In these cases, an even larger sample size would be required. Recruiting 940
sufficiently large samples is not always a viable option, especially where specialist populations are 941
concerned, e.g., cochlear-implant users. As a result, powerful tests of within-subject associations like 942
rmcorr that do not require extremely large samples can provide a practical alternative for testing 943
within-subject associations between subjective and physiological measures. 944
945
Study limitations and future directions 946
Of the 48 participants that took part in the experiments, only 7 were male. We had no a-priori 947
reason to suspect that there would be sex-related differences in effortful listening given the paucity of 948
research on this topic. However, sex differences in subjective and physiological responses are 949
reported in the wider literature (Bath, 2020) and therefore cannot be ruled out in the current study. To 950
optimise generalisability, we advocate recruiting a more balanced sex ratio for future research in the 951
area. Another limitation of the study is that we cannot infer causality from these correlational 952
findings. For example, there are at least two potential causal interpretations for the negative within-953
subject association between TEPR and tiredness from listening ratings: (1) TEPR decreases as 954
tiredness increases because fatigue is eroding the strength of the physiological response that underlies 955
the TEPR, or (2) TEPR decreases as tiredness increases because fatigue is causing participants to 956
disengage more readily, leading to an increasing number of non-peaking TEPR trials (and thus, a 957
reduced mean response). Future studies could examine these potential causal mechanisms by probing 958
for markers of task disengagement and/or distraction more explicitly. For example, this could be 959
achieved by using paradigms that require more continuous task monitoring and engagement. 960
961
Conclusions 962

This is the first study to systematically examine within-subject associations between 963
subjective markers of effort and tiredness from listening and a commonly-used physiological marker 964
of effort (TEPR). Contrary to what is often assumed in the literature, TEPR showed a systematic 965
within-subject association with the experience of tiredness from listening, but not effort. This study 966
also demonstrates the importance of assessing changes in these subjective experiences over time; the 967
effect of SNR on tiredness from listening ratings would have gone undetected using the traditional 968
approach of collecting a single data point at the end of a listening block. Finally, we highlight the 969
utility of assessing correlations at the within-subjects level using a highly-powerful and novel analysis 970
technique (‘rmcorr’). A more detailed understanding of the subjective and physiological 971
manifestations of effortful listening will ultimately help to mitigate this problem in various affected 972
populations (e.g., individuals with hearing loss). 973
974
Acknowledgements 975
We would like to thank everyone at SR research for their assistance with designing the 976
experiments on E-Builder. We would also like to thank the technical services team (Anna, Marc, 977
David, and Garry) in the University of York Psychology department for their help with setting up the 978
eye tracking lab. Thank you also to Keith Wilbraham for letting us borrow an audiometer. Thank you 979
to Jonathan Bakdash for his valuable advice regarding the use and interpretation of ‘rmcorr’ results. 980
And finally, thank you to everyone in the Speech lab at the University of York (especially Sarah 981
Knight) for useful insights and discussions. These findings were presented at: Basic Auditory Science 982
Meeting (September, 2019), Psychonomics meeting (November, 2019), and the Speech in Noise 983
workshop (January, 2020). 984
985
References 986

Agus, T. R., Akeroyd, M. A., Gatehouse, S., & Warden, D. (2009). Informational masking in young 987
and elderly listeners for speech masked by simultaneous speech and noise. The Journal of the 988
Acoustical Society of America, 126(4), 1926. https://doi.org/10.1121/1.3205403 989
Agus, T. R., Akeroyd, M. A., Noble, W., & Bhullar, N. (2009). An analysis of the masking of speech 990
by competing speech using self-report data. The Journal of the Acoustical Society of America, 991
125(1), 23–26. https://doi.org/10.1121/1.3025915 992
Alhanbali, S., Dawes, P., Lloyd, S., & Munro, K. J. (2017). Self-Reported Listening-Related Effort 993
and Fatigue in Hearing-Impaired Adults. Ear and Hearing, 38(1), e39–e48. 994
https://doi.org/10.1097/AUD.0000000000000361 995
Aston-Jones, G., & Cohen, J. D. (2005). An integrative theory of locus coeruleus-norepinephrine 996
function: Adaptive gain and optimal performance. Annual Review of Neuroscience, 28, 403–997
450. https://doi.org/10.1146/annurev.neuro.28.061604.135709 998
Bakdash, J. Z., & Marusich, L. R. (2017). Repeated Measures Correlation. Frontiers in Psychology, 8, 999
456. https://doi.org/10.3389/fpsyg.2017.00456 1000
Bath, K. G. (2020). Synthesizing Views to Understand Sex Differences in Response to Early Life 1001
Adversity. Trends in Neurosciences, 43(5), 300–310. 1002
https://doi.org/10.1016/j.tins.2020.02.004 1003
Borghini, G., & Hazan, V. (2018). Listening Effort During Sentence Processing Is Increased for Non-1004
native Listeners: A Pupillometry Study. Frontiers in Neuroscience, 12, 152. 1005
https://doi.org/10.3389/fnins.2018.00152 1006
Brisson, J., Mainville, M., Mailloux, D., Beaulieu, C., Serres, J., & Sirois, S. (2013). Pupil diameter 1007
measurement errors as a function of gaze direction in corneal reflection eyetrackers. Behavior 1008
Research Methods, 45(4), 1322–1331. https://doi.org/10.3758/s13428-013-0327-0 1009
Clayson, P. E., Carbine, K. A., Baldwin, S. A., & Larson, M. J. (2019). Methodological reporting 1010
behavior, sample sizes, and statistical power in studies of event-related potentials: Barriers to 1011
reproducibility and replicability. Psychophysiology, 56(11), UNSP e13437. 1012
https://doi.org/10.1111/psyp.13437 1013

Dimitrijevic, A., Smith, M. L., Kadis, D. S., & Moore, D. R. (2019). Neural indices of listening effort 1014
in noisy environments. Scientific Reports, 9, 11278. https://doi.org/10.1038/s41598-019-1015
47643-1 1016
Faul, F., Erdfelder, E., Buchner, A., & Lang, A.-G. (2009). Statistical power analyses using G*Power 1017
3.1: Tests for correlation and regression analyses. Behavior Research Methods, 41(4), 1149–1018
1160. https://doi.org/10.3758/BRM.41.4.1149 1019
Francis, A. L., & Love, J. (2020). Listening effort: Are we measuring cognition or affect, or both? 1020
Wiley Interdisciplinary Reviews. Cognitive Science, 11(1), e1514. 1021
https://doi.org/10.1002/wcs.1514 1022
Gergelyfi, M., Jacob, B., Olivier, E., & Zénon, A. (2015). Dissociation between mental fatigue and 1023
motivational state during prolonged mental activity. Frontiers in Behavioral Neuroscience, 9. 1024
https://doi.org/10.3389/fnbeh.2015.00176 1025
Hart, S. G., & Staveland, L. E. (1988). Development of NASA-TLX (Task Load Index): Results of 1026
Empirical and Theoretical Research. In P. A. Hancock & N. Meshkati (Eds.), Advances in 1027
Psychology (Vol. 52, pp. 139–183). North-Holland. https://doi.org/10.1016/S0166-1028
4115(08)62386-9 1029
Hockey, R. (2013). The psychology of fatigue: Work, effort and control. Cambridge University Press. 1030
https://doi.org/10.1017/CBO9781139015394 1031
Holman, J. A., Drummond, A., Hughes, S. E., & Naylor, G. (2019). Hearing impairment and daily-life 1032
fatigue: A qualitative study. International Journal of Audiology, 58(7), 408–416. 1033
https://doi.org/10.1080/14992027.2019.1597284 1034
Hopstaken, J. F., van der Linden, D., Bakker, A. B., & Kompier, M. A. J. (2015). The window of my 1035
eyes: Task disengagement and mental fatigue covary with pupil dynamics. Biological 1036
Psychology, 110, 100–106. https://doi.org/10.1016/j.biopsycho.2015.06.013 1037
Hornsby, B. W. Y. (2013). The effects of hearing aid use on listening effort and mental fatigue 1038
associated with sustained speech processing demands. Ear and Hearing, 34(5), 523–534. 1039
https://doi.org/10.1097/AUD.0b013e31828003d8 1040
Hornsby, B. W. Y., & Kipp, A. M. (2016). Subjective Ratings of Fatigue and Vigor in Adults With 1041
Hearing Loss Are Driven by Perceived Hearing Difficulties Not Degree of Hearing Loss. Ear 1042
and Hearing, 37(1), e1-10. https://doi.org/10.1097/AUD.0000000000000203 1043
Hornsby, B. W. Y., Naylor, G., & Bess, F. H. (2016). A Taxonomy of Fatigue Concepts and Their 1044
Relation to Hearing Loss. Ear and Hearing, 37(Suppl 1), 136S-144S. 1045
https://doi.org/10.1097/AUD.0000000000000289 1046
Koelewijn, T., Zekveld, A. A., Festen, J. M., & Kramer, S. E. (2012). Pupil Dilation Uncovers Extra 1047
Listening Effort in the Presence of a Single-Talker Masker: Ear and Hearing, 33(2), 291–1048
300. https://doi.org/10.1097/AUD.0b013e3182310019 1049
Krueger, M., Schulte, M., Brand, T., & Holube, I. (2017). Development of an adaptive scaling method 1050
for subjective listening effort. The Journal of the Acoustical Society of America, 141(6), 1051
4680–4693. https://doi.org/10.1121/1.4986938 1052
Kuchinsky, S. E., Ahlstrom, J. B., Cute, S. L., Humes, L. E., Dubno, J. R., & Eckert, M. A. (2014). 1053
Speech-perception training for older adults with hearing loss impacts word recognition and 1054
effort: Changes in word recognition and effort. Psychophysiology, 51(10), 1046–1057. 1055
https://doi.org/10.1111/psyp.12242 1056
Mathôt, S. (2018). Pupillometry: Psychology, Physiology, and Function. Journal of Cognition, 1(1), 1057
16. https://doi.org/10.5334/joc.18 1058
Mattys, S. L., Davis, M. H., Bradlow, A. R., & Scott, S. K. (2012). Speech recognition in adverse 1059
conditions: A review. Language and Cognitive Processes, 27(7–8), 953–978. 1060
https://doi.org/10.1080/01690965.2012.705006 1061
McClelland, J. L., & Elman, J. L. (1986). The TRACE model of speech perception. Cognitive 1062
Psychology, 18(1), 1–86. https://doi.org/10.1016/0010-0285(86)90015-0 1063
McGarrigle, R., Dawes, P., Stewart, A. J., Kuchinsky, S. E., & Munro, K. J. (2017). Pupillometry 1064
reveals changes in physiological arousal during a sustained listening task: Physiological 1065
changes during sustained listening. Psychophysiology, 54(2), 193–203. 1066
https://doi.org/10.1111/psyp.12772 1067

McGarrigle, R., Munro, K. J., Dawes, P., Stewart, A. J., Moore, D. R., Barry, J. G., & Amitay, S. 1068
(2014). Listening effort and fatigue: What exactly are we measuring? A British Society of 1069
Audiology Cognition in Hearing Special Interest Group ‘white paper’. International Journal 1070
of Audiology, 53(7), 433–445. https://doi.org/10.3109/14992027.2014.890296 1071
McLaughlin, D. J., & Van Engen, K. J. (2020). Task-evoked pupil response for accurately recognized 1072
accented speech. The Journal of the Acoustical Society of America, 147(2), EL151–EL156. 1073
https://doi.org/10.1121/10.0000718 1074
McMahon, C. M., Boisvert, I., de Lissa, P., Granger, L., Ibrahim, R., Lo, C. Y., Miles, K., & Graham, 1075
P. L. (2016). Monitoring Alpha Oscillations and Pupil Dilation across a Performance-1076
Intensity Function. Frontiers in Psychology, 7. https://doi.org/10.3389/fpsyg.2016.00745 1077
Moore, T. M., Key, A. P., Thelen, A., & Hornsby, B. W. Y. (2017). Neural mechanisms of mental 1078
fatigue elicited by sustained auditory processing. Neuropsychologia, 106, 371–382. 1079
https://doi.org/10.1016/j.neuropsychologia.2017.10.025 1080
Moore, T. M., & Picou, E. M. (2018). A Potential Bias in Subjective Ratings of Mental Effort. 1081
Journal of Speech, Language, and Hearing Research, 61(9), 2405–2421. 1082
https://doi.org/10.1044/2018_JSLHR-H-17-0451 1083
Ohlenforst, B., Zekveld, A. A., Lunner, T., Wendt, D., Naylor, G., Wang, Y., Versfeld, N. J., & 1084
Kramer, S. E. (2017). Impact of stimulus-related factors and hearing impairment on listening 1085
effort as indicated by pupil dilation. Hearing Research, 351, 68–79. 1086
https://doi.org/10.1016/j.heares.2017.05.012 1087
Pals, C., Sarampalis, A., van Dijk, M., & Baskent, D. (2019). Effects of Additional Low-Pass-Filtered 1088
Speech on Listening Effort for Noise-Band-Vocoded Speech in Quiet and in Noise. Ear and 1089
Hearing, 40(1), 3–17. https://doi.org/10.1097/AUD.0000000000000587 1090
Peng, Z. E., & Wang, L. M. (2019). Listening Effort by Native and Nonnative Listeners Due to Noise, 1091
Reverberation, and Talker Foreign Accent During English Speech Perception. Journal of 1092
Speech Language and Hearing Research, 62(4), 1068–1081. 1093
https://doi.org/10.1044/2018_JSLHR-H-17-0423 1094

Pichora-Fuller, M. K., Kramer, S. E., Eckert, M. A., Edwards, B., Hornsby, B. W. Y., Humes, L. E., 1095
Lemke, U., Lunner, T., Matthen, M., Mackersie, C. L., Naylor, G., Phillips, N. A., Richter, 1096
M., Rudner, M., Sommers, M. S., Tremblay, K. L., & Wingfield, A. (2016). Hearing 1097
Impairment and Cognitive Energy: The Framework for Understanding Effortful Listening 1098
(FUEL). 37, 23. 1099
Picou, E. M., Moore, T. M., & Ricketts, T. A. (2017). The Effects of Directional Processing on 1100
Objective and Subjective Listening Effort. Journal of Speech, Language, and Hearing 1101
Research, 60(1), 199–211. https://doi.org/10.1044/2016_JSLHR-H-15-0416 1102
Picou, E. M., & Ricketts, T. A. (2018). The relationship between speech recognition, behavioural 1103
listening effort, and subjective ratings. International Journal of Audiology, 57(6), 457–467. 1104
https://doi.org/10.1080/14992027.2018.1431696 1105
Pisoni, D. B. (1985). Speech perception: Some new directions in research and theory. The Journal of 1106
the Acoustical Society of America, 78(1 Pt 2), 381–388. 1107
Rennies, J., Schepker, H., Holube, I., & Kollmeier, B. (2014). Listening effort and speech 1108
intelligibility in listening situations affected by noise and reverberation. The Journal of the 1109
Acoustical Society of America, 136(5), 2642–2653. https://doi.org/10.1121/1.4897398 1110
Rönnberg, J., Rudner, M., Foo, C., & Lunner, T. (2008). Cognition counts: A working memory 1111
system for ease of language understanding (ELU). International Journal of Audiology, 1112
47(sup2), S99–S105. https://doi.org/10.1080/14992020802301167 1113
Rovetti, J., Goy, H., Pichora-Fuller, M. K., & Russo, F. A. (2019). Functional Near-Infrared 1114
Spectroscopy as a Measure of Listening Effort in Older Adults Who Use Hearing Aids. 1115
Trends in Hearing, 23, 2331216519886722. https://doi.org/10.1177/2331216519886722 1116
Rudner, M., Lunner, T., Behrens, T., Thorén, E. S., & Rönnberg, J. (2012, September). Working 1117
Memory Capacity May Influence Perceived Effort during Aided Speech Recognition in Noise 1118
[Text]. https://doi.org/info:doi/10.3766/jaaa.23.7.7 1119
Seeman Scott, & Sims Rebecca. (2015). Comparison of Psychophysiological and Dual-Task 1120
Measures of Listening Effort. Journal of Speech, Language, and Hearing Research, 58(6), 1121
1781–1792. https://doi.org/10.1044/2015_JSLHR-H-14-0180 1122

Smith, S. L., Pichora-Fuller, K. M., Watts, K. L., & La More, C. (2011). Development of the 1123
Listening Self-Efficacy Questionnaire (LSEQ). International Journal of Audiology, 50(6), 1124
417–425. https://doi.org/10.3109/14992027.2011.553205 1125
Strand, J. F., Brown, V. A., Merchant, M. B., Brown, H. E., & Smith, J. (2018). Measuring Listening 1126
Effort: Convergent Validity, Sensitivity, and Links With Cognitive and Personality Measures. 1127
Journal of Speech, Language, and Hearing Research, 61(6), 1463–1486. 1128
https://doi.org/10.1044/2018_JSLHR-H-17-0257 1129
Thoenes, S., Arnau, S., & Wascher, E. (2018). Cognitions about time affect perception, behavior, and 1130
physiology—A review on effects of external clock-speed manipulations. Consciousness and 1131
Cognition, 63, 99–109. https://doi.org/10.1016/j.concog.2018.06.014 1132
van der Linden, D., Frese, M., & Meijman, T. F. (2003). Mental fatigue and the control of cognitive 1133
processes: Effects on perseveration and planning. Acta Psychologica, 113(1), 45–65. 1134
https://doi.org/10.1016/s0001-6918(02)00150-6 1135
Wagenmakers, E.-J., Dutilh, G., & Sarafoglou, A. (2018). The Creativity-Verification Cycle in 1136
Psychological Science: New Methods to Combat Old Idols. Perspectives on Psychological 1137
Science: A Journal of the Association for Psychological Science, 13(4), 418–427. 1138
https://doi.org/10.1177/1745691618771357 1139
Wang, Y., Naylor, G., Kramer, S. E., Zekveld, A. A., Wendt, D., Ohlenforst, B., & Lunner, T. (2018). 1140
Relations Between Self-Reported Daily-Life Fatigue, Hearing Status, and Pupil Dilation 1141
During a Speech Perception in Noise Task. Ear and Hearing, 39(3), 573. 1142
https://doi.org/10.1097/AUD.0000000000000512 1143
Winn, M. B., Wendt, D., Koelewijn, T., & Kuchinsky, S. E. (2018). Best Practices and Advice for 1144
Using Pupillometry to Measure Listening Effort: An Introduction for Those Who Want to Get 1145
Started. Trends in Hearing, 22, 233121651880086. 1146
https://doi.org/10.1177/2331216518800869 1147
Zekveld, A. A., Koelewijn, T., & Kramer, S. E. (2018). The Pupil Dilation Response to Auditory 1148
Stimuli: Current State of Knowledge. Trends in Hearing, 22, 233121651877717. 1149
https://doi.org/10.1177/2331216518777174 1150
Zekveld, A. A., Kramer, S. E., & Festen, J. M. (2010). Pupil Response as an Indication of Effortful 1151
Listening: The Influence of Sentence Intelligibility. Ear and Hearing, 31(4), 480–490. 1152
https://doi.org/10.1097/AUD.0b013e3181d4f251 1153
1154