Effluent impact assessment using microarray-based analysis in common carp: A systems toxicology...
12
Effluent impact assessment using microarray-based analysis in common carp: A systems toxicology approach Lotte N. Moens a, * , Roel Smolders a,b , Karlijn van der Ven a , Piet van Remortel c , Jurgen Del-Favero d , Wim M. De Coen a a Laboratory for Ecophysiology, Biochemistry and Toxicology, Department of Biology, University of Antwerp, Groenenborgerlann 171, B-2020 Antwerp, Belgium b Flemish Institute of Technological Research (VITO), Belgium c Intelligent Systems Laboratory, Department of Mathematics and Computer Science, University of Antwerp, Belgium d Applied Molecular Genomics Group, Department of Molecular Genetics, Flanders Interuniversity Institute for Biotechnology (VIB), University of Antwerp, Belgium Received 10 April 2006; received in revised form 4 September 2006; accepted 27 September 2006 Available online 30 January 2007 Abstract Effluents are a main source of direct and continuous input of pollutants to the aquatic environment, and can cause ecotoxicological effects at different levels of biological organization. Since gene expression responses represent the primary interaction site between envi- ronmental contaminants and biota, they provide essential clues to understand how chemical exposure can affect organismal health. The aim of the present study was to investigate the applicability of a microarray approach for unraveling modes of action of whole effluent toxicity and impact assessment. A chronic toxicity test with common carp (Cyprinus carpio) was conducted where fish were exposed to a control and 100% effluent for 21 days under flow-through conditions. Microarray analysis revealed that effluent treatment mainly affected molecular pathways associated with the energy balance of the fish, including changes in carbohydrate and lipid metabolism, as well as digestive enzyme activity. These gene expression responses were in clear agreement with, and provided additional mechanistic information on various cellular and higher level effects observed for the same effluent. Our results demonstrate the benefit of toxicoge- nomic tools in a ‘‘systems toxicology’’ approach, involving the integration of adverse effects of chemicals and stressors across multiple levels of biological complexity. Ó 2006 Elsevier Ltd. All rights reserved. Keywords: Fish; Gene expression; Mixtures; Microarrays; Toxicogenomics; Mode of action 1. Introduction Effluents are important sources of direct input of pollu- tants into the aquatic environment, thereby posing signifi- cant environmental hazards to the receiving biota and ecosystems. Adverse ecotoxicological effects induced by effluent exposure may be acute or chronic, and can occur at all levels of biological organization, from the molecular to the ecosystem level (Adams et al., 1992; Adams et al., 2000; Porter and Janz, 2003). Among them are changes in cellular energy budgets (Smolders et al., 2003; Smolders et al., 2004a), physiological alterations related to stress induction (Linton et al., 2005), growth reduction (van den Heuvel and Ellis, 2002), impairment of reproduction (Sepulveda et al., 2003) and ultimately effects on fish pop- ulations and communities (Adams et al., 1992; Porter and Janz, 2003). In order to fully understand this cascade of effects occurring in effluent-contaminated aquatic systems, research should concentrate on integrating different aspects of (eco)toxicological endpoints, from (molecular) mecha- nisms of toxic action to physiological and ecological pro- cesses. A common strategy to investigate potential 0045-6535/$ - see front matter Ó 2006 Elsevier Ltd. All rights reserved. doi:10.1016/j.chemosphere.2006.09.092 * Corresponding author. Tel.: +32 3 265 34 83; fax: +32 3 265 34 97. E-mail addresses: [email protected] (L.N. Moens), karlijn.vander- [email protected] (K. van der Ven). www.elsevier.com/locate/chemosphere Chemosphere 67 (2007) 2293–2304
-
Upload
independent -
Category
Documents
-
view
6 -
download
0
Transcript of Effluent impact assessment using microarray-based analysis in common carp: A systems toxicology...

www.elsevier.com/locate/chemosphere
Chemosphere 67 (2007) 2293–2304
Effluent impact assessment using microarray-based analysisin common carp: A systems toxicology approach
Lotte N. Moens a,*, Roel Smolders a,b, Karlijn van der Ven a, Piet van Remortel c,Jurgen Del-Favero d, Wim M. De Coen a
a Laboratory for Ecophysiology, Biochemistry and Toxicology, Department of Biology, University of Antwerp, Groenenborgerlann 171,
B-2020 Antwerp, Belgiumb Flemish Institute of Technological Research (VITO), Belgium
c Intelligent Systems Laboratory, Department of Mathematics and Computer Science, University of Antwerp, Belgiumd Applied Molecular Genomics Group, Department of Molecular Genetics, Flanders Interuniversity Institute for Biotechnology (VIB),
University of Antwerp, Belgium
Received 10 April 2006; received in revised form 4 September 2006; accepted 27 September 2006Available online 30 January 2007
Abstract
Effluents are a main source of direct and continuous input of pollutants to the aquatic environment, and can cause ecotoxicologicaleffects at different levels of biological organization. Since gene expression responses represent the primary interaction site between envi-ronmental contaminants and biota, they provide essential clues to understand how chemical exposure can affect organismal health. Theaim of the present study was to investigate the applicability of a microarray approach for unraveling modes of action of whole effluenttoxicity and impact assessment. A chronic toxicity test with common carp (Cyprinus carpio) was conducted where fish were exposed to acontrol and 100% effluent for 21 days under flow-through conditions. Microarray analysis revealed that effluent treatment mainlyaffected molecular pathways associated with the energy balance of the fish, including changes in carbohydrate and lipid metabolism,as well as digestive enzyme activity. These gene expression responses were in clear agreement with, and provided additional mechanisticinformation on various cellular and higher level effects observed for the same effluent. Our results demonstrate the benefit of toxicoge-nomic tools in a ‘‘systems toxicology’’ approach, involving the integration of adverse effects of chemicals and stressors across multiplelevels of biological complexity.� 2006 Elsevier Ltd. All rights reserved.
Keywords: Fish; Gene expression; Mixtures; Microarrays; Toxicogenomics; Mode of action
1. Introduction
Effluents are important sources of direct input of pollu-tants into the aquatic environment, thereby posing signifi-cant environmental hazards to the receiving biota andecosystems. Adverse ecotoxicological effects induced byeffluent exposure may be acute or chronic, and can occurat all levels of biological organization, from the molecularto the ecosystem level (Adams et al., 1992; Adams et al.,
0045-6535/$ - see front matter � 2006 Elsevier Ltd. All rights reserved.
doi:10.1016/j.chemosphere.2006.09.092
* Corresponding author. Tel.: +32 3 265 34 83; fax: +32 3 265 34 97.E-mail addresses: [email protected] (L.N. Moens), karlijn.vander-
[email protected] (K. van der Ven).
2000; Porter and Janz, 2003). Among them are changesin cellular energy budgets (Smolders et al., 2003; Smolderset al., 2004a), physiological alterations related to stressinduction (Linton et al., 2005), growth reduction (vanden Heuvel and Ellis, 2002), impairment of reproduction(Sepulveda et al., 2003) and ultimately effects on fish pop-ulations and communities (Adams et al., 1992; Porter andJanz, 2003). In order to fully understand this cascade ofeffects occurring in effluent-contaminated aquatic systems,research should concentrate on integrating different aspectsof (eco)toxicological endpoints, from (molecular) mecha-nisms of toxic action to physiological and ecological pro-cesses. A common strategy to investigate potential

2294 L.N. Moens et al. / Chemosphere 67 (2007) 2293–2304
adverse effects and toxicological modes of action followingeffluent exposure, and/or to assess contamination to certainclasses of chemicals (e.g. heavy metals or estrogenic com-pounds), is the use of biomarkers. Over the past decade,a variety of biomarkers, covering a range of molecular,biochemical and cellular alterations, have been used toevaluate effects of contaminant exposure in aquatic envi-ronments. These proved to be very valuable in providingmeasures of the molecular mechanisms that underlie toxic-ity (Hinton et al., 2005). A major difficulty in evaluatingwhole effluent toxicity (WET) however, is the complexand often variable composition of effluents, which maycomplicate a specific and targeted assessment of potentialadverse effects. Unraveling the molecular mechanismsunderlying the various toxic effects resulting from exposureto complex mixtures, is a highly challenging task. Whichendpoints should be studied, when there is no – or limited –a priori information available on which subcellular targetpathways could be affected, or how different chemical com-ponents will interact? Therefore, the use of a battery of bio-markers will often be needed to be able to effectivelyevaluate WET and its associated mechanisms of action.The arrival of new technologies in genomics, such ascDNA microarrays, offer the potential to measure expres-sion changes of hundreds to thousands of genes in a singleassay and may provide crucial help in this matter. Applica-tion of this technology in WET testing could allow for amore integrated and holistic view on all molecular altera-tions induced by effluent exposure. It could provide signif-icant clues towards unraveling the mechanisms of toxiceffects, without the need for any prior detailed informationconcerning chemical composition or target pathways. Theuse of DNA microarrays in the field of aquatic toxicologyhas only recently started to emerge, especially in the con-text of effluent and mixture toxicity. While several authorshave described the use of array technology to study theeffects of specific classes of xenobiotics, such as pesticides,pharmaceuticals, metals and endocrine disruptors (Koski-nen et al., 2004; van der Ven et al., 2005; Soetaert et al.,2006; Moens et al., 2006), only very few publications areavailable on the use of molecular genomic tools for thecharacterization of whole effluent or mixture toxicity inaquatic organisms (Denslow et al., 2004; Teodorakiset al., 2006).
In previous work, we developed a custom cDNA micro-array consisting of cDNA fragments from common carp,including metabolism-, stress-, immune- and endocrine-related genes Moens et al., in press-a, Moens et al., inpress-b. We successfully used it to generate a set ofreference gene expression profiles induced by 14 modelendocrine disrupting compounds, representing variousmechanisms of action (Moens et al., 2006). In the presentstudy, we aimed to investigate the applicability of this cus-tomized C. carpio microarray for elucidating modes ofaction of WET and impact assessment, within the frame-work of a broad study exploring the effect of an industrialeffluent on different levels of biological organization (Smol-
ders et al., 2003). More specifically, we investigatedwhether the observed impairment of several reproductiveparameters in zebrafish following exposure to this indus-trial effluent (Smolders et al., 2002a) could be the resultof chemical-induced endocrine disruption. We demonstratethat molecular events in exposed carp quantified usingmicroarrays corroborate the adverse effects at higher levelsof biological organization.
2. Materials and methods
2.1. Experimental set-up and effluent exposure conditions
Tests were performed at the site of an industrial plant, inan online monitoring system. Juvenile carp with an averagelength of 22.3 ± 1.8 mm (at t = 0) were obtained from theagricultural University of Wageningen (The Netherlands).The fish were acclimated for two weeks in aerated tapwater in two separate 500 l flow-through aquaria beforethe start of the effluent exposure. Fish were fed commercialfeed (Biofeed, Brassleer Biofish, Westmeerbeek, Belgium)at a constant food ratio. Not all the feed was consumed,so feed availability was not limiting for growth. At the startof the exposure, the water supply was switched fromacclimation conditions to 100% effluent. Tap water (0%effluent) was used as control. Effluent exposure was con-ducted according to the OECD guidelines for testing chem-icals on biotic systems (nr. 204, prolonged toxicity test forfish), for a total period of 21 days. The aquaria were con-stantly aerated and the flow rate was 200 l/h. Fish wereexposed to a 16:8 h light:dark photoperiod, though lightconditions were also influenced by daylight conditions.For more information on the technical set-up of effluentexposure, consult (Smolders et al., 2002a).
2.2. Growth and condition
Each week, a subsample of 20 fish per aquarium (controlor effluent-exposed) was weighed and the total length wasdetermined. Liver tissue was dissected, snap-frozen in liquidnitrogen, and stored at �70 �C for microarray analyses (seebelow). Based on length and weight measurements, theRelative Condition Factor (RCF) was calculated as an indi-cator of the general ‘well-being’ or ‘fatness’ of the fish, usingthe formula:
RCF ¼ W
ða�LbÞwhere W is the total body weight (in g) and L is the totallength (in mm). The parameters a and b were determinedfrom the control (unstressed) aquarium and are estimatedby logW = loga + b logL (i.e. a is the regression interceptand b is the regression slope) (Jones et al., 1999). This pro-cedure automatically leads to the result that the conditionof the population in the control aquarium is always one,and the condition of the population in the exposure aquar-ium is a fraction of this value (hence Relative Condition
L.N. Moens et al. / Chemosphere 67 (2007) 2293–2304 2295
Factor). Statistical significant differences between the RCFof control and exposed fish were calculated using a stu-dent’s T-test (Statistica software, StatSoft Inc., Tulsa,OK, USA).
2.3. RNA isolation
There were a total of 20 fish in each exposure condition.To yield an adequate sample size for RNA extraction, fourpools of liver tissue were created from each control andeffluent-treated group (n = 5 fish per pool). Frozen tissuewas disrupted by homogenization, and RNA was isolatedusing the Trizol RNA Extraction procedure (Gibco BRL,Life Technologies, Merelbeke, Belgium), followed by aDNAse treatment (Fermentas, St. Leon-Rot, Germany)and subsequent phenol/chloroform extraction. The con-centration was determined by spectrophotometry, andRNA integrity was assessed by denaturing formamide–aga-rose gel-electrophoresis.
2.4. cDNA microarray construction and hybridizations
Microarrays were prepared as described in Moens et al.,in press-b by robotic spotting of a set of 960 carp gene frag-ments. Each cDNA clone was spotted four times on theslides, allowing analysis of variation between replicatespots at different locations within an array. In addition, aset of artificial control genes, consisting of ten calibrationcontrols, eight ratio controls and two negative controls,was spotted in 36 replicates (Lucidea Universal ScoreCard,Amersham Biosciences, Roosendaal, The Netherlands) oneach array, to assist the evaluation of the quality of thearray data. These spiked-in labeled controls at knownconcentrations provide information technical variationresulting from cDNA labeling efficiency, sensitivity andintra-array variability of replicates. Negative controls wereincluded to assess non-specific hybridization and quality ofblocking at the prehybridization step. Fluorescent targetlabeling and hybridization protocols were identical to thosereported in Moens et al., in press-b. Briefly, 7 lg of totalRNA from each subpool of tissue sample was convertedinto aminoallyl-dUTP labeled cDNA using the SuperscriptII Reverse transcriptase kit (Invitrogen, Paisly, UK). Luci-dea reference and test mRNA spikes, corresponding tothe calibration and ratio controls spotted on the arrays,were added to the RNA samples from reference and testpopulations respectively. RNA was hydrolyzed and unin-corporated nucleotides were removed (QiaQuick PCRpurification kit, Qiagen, Crawley, UK). The aminoallyl-labeled cDNA samples were then covalently coupled toCy3- (for A0 and A2 cDNA populations) or Cy5- (forA1 and A3 cDNA populations) esters (Amersham Biosci-ences). Reaction mixtures were purified once more, andthe labeling efficiency was determined by spectrophotome-try. The threshold for optimal dye incorporation was150 pmol and a frequency of incorporation of 20–50&
was considered appropriate for hybridizations. Following
analysis of incorporation, the fluorescently labeled sampleswere dried to completion in a vacuum centrifuge andresolved in hybridization solution. Microarray slides wereprehybridized, and the target cDNA solution was dena-tured and added to the slides. Hybridization took placeovernight (16–18 h) at 42 �C. After hybridization, slideswere washed and dried with N2. Finally, slides werescanned using the Genepix Personal 4100 A scanner (AxonIntruments, Union City, CA, USA).
2.5. Microarray data acquisition, pre-processing and
differential expression analysis
Scanned images were analyzed using Genepix pro 4.1software (Axon Intruments), for spot identification, andquantification of raw fore- and background intensities ofthe spots. These data were then further evaluated by theBioArray Software Environment database (BASE 1.2.12,http://www.islab.ua.ac.be/base/), a MIAME platformbased microarray analysis method developed by the Intel-ligent Systems Laboratory (University of Antwerp,Antwerp, Belgium). Spots were background (BG) cor-rected, and the corrected signal was included in furtheranalyses only when the average foreground (FG) intensityof at least one colour of the spot was greater than the meanlocal BG + 2SD (SD, Standard Deviation). Spots withoversaturated signal intensities were also excluded fromfurther analyses. The Cy5/Cy3 ratio was calculated foreach spot, log2 transformed, and normalized using the Var-iance Stabilization and Normalization method (VSN) in R(Huber et al., 2002). This method incorporates data nor-malization, a model for the dependence of the variance ofthe mean intensity, and a variance stabilizing data transfor-mation. Expression data presented in figures and tables arethe median log2(R/G) ratios of quadruplicate experiments(biological replicates). To determine the significant cut-offsfor up-or downregulated genes, significance thresholdsbased on 99.7% confidence intervals were calculated, usingthe average standard deviation (ASD) of all genes on thearray, as determined by multiple self–self hybridizationexperiments. In these ‘homotypic’ hybridizations, aliquotsfrom single RNA samples from liver tissue were labelledwith both dyes and hybridized to the same array. Basedon the ASD, we estimated the expected natural and exper-imental variance of the genes on the array, leading to a pre-dicted confidence interval for testing the significance of theratios obtained. Median ratios outside the 99.7% confi-dence interval were determined to be significantly differentfollowing effluent exposure. On the basis of this, log2me-dian 6�0.70 and P+0.66 (i.e. a fold change of �1.62and 1.58) were set as the cut-off values for down- andupregulated genes, respectively.
To assess the endocrine disrupting potential of the efflu-ent on the molecular level, effluent-induced gene expressionprofiles were compared to previously generated expressionprofiles of a set of reference endocrine disruptors (Moens

2296 L.N. Moens et al. / Chemosphere 67 (2007) 2293–2304
et al., 2006), using hierarchical clustering (Acuity 4.0, AxonIntruments).
3. Results
3.1. Cellular and organismal effects of effluent exposure,
observed by Smolders et al. (2002a); Smolders et al., 2003;
Smolders et al., 2004b
The present work is situated within the framework of abroad study exploring the effect of an industrial effluent ondifferent levels of biological organization. Smolders et al.(2003) used a combination of active biomonitoring andin situ analyses, across several test species and trophic lev-els, to quantify the impact of this effluent on the aquaticecosystem. For more details on these studies, readers arereferred to Smolders et al., 2002a; Smolders et al., 2002b;Smolders et al., 2003; Smolders et al., 2004a; Smolderset al., 2004b; Smolders et al., 2004c. A summary of theobserved effects of effluent exposure in fish (Danio rerio
and C. carpio) is given in Table 1. Briefly, effluent treatmentresulted in (i) a decrease in cellular glycogen and lipid bud-gets; (ii) a reduced condition – with a fast recovery ofgrowth (‘catch-up’ growth) after two weeks of treatment –and (iii) a reduction of zebrafish spawning and hatchingafter four weeks of exposure.
3.2. Microarray analysis of gene expression modificationsinduced by effluent exposure
In order to determine the changes in gene expression inresponse to effluent exposure, fish were sacrificed after 7, 14and 21 days of either effluent or control treatment, andliver RNA was isolated. Four replicate sets of fluorescentlylabeled cDNA targets derived from control and exposedliver subpools were hybridized on a customized cDNAmicroarray, containing 960 gene fragments from commoncarp, including metabolism-, stress-, immune- and endo-
Table 1Effects of effluent exposure on several cellular and organismal parameters in z
Test/endpoints Observed effects
Danio rerio, chronic (28-day) exposure
Cellular energy budgets – decreased glycogen budget at all t
– decreased lipid budget at all time– increased protein budget after 7,! effects on cellular energy budgefollowed by a general recovery dur
Respiration increased oxygen consumption afte
Growth and condition – decreased body weight and cond– fast ‘catch-up’ growth during the
Reproduction decreased spawning and hatching a
Cyprinus carpio, chronic (28-day)
exposure
Growth and condition decreased condition after 14, 21 anCellular lipid budget decreased lipid budget after 14, 21
crine-related genes Moens et al., in press-b. The qualityof individual microarrays and inter-array variability wasevaluated using the Lucidea Scorecard references, as des-cribed in Moens et al., in press-b. All microarrays includedin the analysis fulfilled our prerequisite quality parameters.Fig. 1 shows the expression profiles of differentiallyexpressed genes for the different time intervals. In total,39 unique genes were found to be up- or downregulatedin effluent-exposed carp relative to their time-matched con-trols. The number of differentially expressed genesremained more or less constant upon the time course ofthe experiment: 18 clones were found to be influenced at7 days of exposure, and 20 clones at 14 and 21 days. Therewas a significant overlap of differentially expressed genesbetween the different time points investigated. In addition,we also observed a set of specific gene expression effectsassociated with each time interval. Numerical data on theexpression levels of the differentially expressed genes aregiven in Table 2.
3.3. Gene expression effects associated with different
biological functions
The majority of differentially expressed genes with aknown function is related to the energy metabolism ofthe organisms, including genes involved in carbohydrateand lipid metabolism, mitochondrial energy metabolism,and genes coding for various digestive enzymes. Theobserved inhibition of glucokinase and a regulatory sub-unit of protein phosphatase 1 after one and three weeksof effluent exposure, are supportive of an increased glyco-gen breakdown, and a decreased glycogen synthesis. Theseeffects were not observed in the liver of fish exposed during14 days. The effects on lipid and fatty acid transport andmetabolism include a clear decrease in the expression levelof the gene for Apolipoprotein A-I at all time points inves-tigated, and an inhibition of Apolipoprotein B expressionafter 21 days of exposure. On the other hand, a fish-specific
ebrafish and common carp
Reference
ime points investigated (i.e., after 7, 14, 21 and 28 days) (Smolders et al.,2003)
points investigated14 and 21 days
ts were most pronounced after 14 days of exposure,ing the last two weeksr 14, 21, and 28 days of exposure (Smolders et al.,
2002a)ition at all time points investigated
last two weeksfter 4 weeks of exposure
(Smolders et al.,2004b)
d 28 days of exposureand 28 days of exposure

Fig. 1. Gene expression patterns for genes found to be differentially regulated following effluent exposure, at 3 distinct exposure intervals (7, 14 and 21days). Relative gene expression versus control is shown in rows. The colors represent median log2 ratios from quadruplicate experiments. Up-regulation ofmRNA transcripts is represented by shades of red, and down-regulation by shades of green. Black means no change.
L.N. Moens et al. / Chemosphere 67 (2007) 2293–2304 2297
14 kDa apolipoprotein was found to be induced after 7days of effluent treatment, after which its expression levelssteadily decreased over time. Furthermore, an activation ofthe AcylCoA desaturase gene was observed after two weeksof exposure, but not after one or three weeks. After two
weeks, we also observed a significant decrease in thetranscript levels of an androgen metabolism gene,hydroxy-delta-5-steroid dehydrogenase (3 beta- and steroiddelta-isomerase 7). A considerable number of genesinvolved in various digestive processes were found to be

Table 2Differentially expressed genes between control and effluent treated fish, associated with different biological functions
Accession Gene Median fold change
t = 7days
t = 14days
t = 21days
Glucose and glycogen metabolism
AAC33587 Glucokinase �2.20 1.01 �1.97CA964834 Cyprinus carpio cDNA clone similar to protein phosphatase 1, regulatory subunit 3C (PPR5) �1.89 �1.36 �1.69
Lipid/fatty acid metabolism and transport
NP_571203 Apolipoprotein A-I precursor protein �2.04 �2.02 �2.26S65460 Apolipoprotein B �1.30 �1.22 �1.84AAS89347 14 kDa apolipoprotein 1.81 1.44 1.15CA965352 Cyprinus carpio cDNA clone similar to Acyl-CoA desaturase 1.23 2.04 1.03
Steroid metabolism
XP_415754 Similar to Hydroxy-delta-5-steroid dehydrogenase, 3 beta- and steroid delta-isomerase 7 �1.00 �2.07 �1.33
Digestive enzymes
AAH55668 Carboxyl ester lipase �1.05 1.89 1.06NP_998176 Amylase, alpha 2A �1.01 1.62 1.82NP_954965 Carboxypeptidase A 1.56 1.69 1.74AH67637 Carboxypeptidase B1 1.19 1.66 1.72CF660875 cDNA clone similar to Chymotrypsin A precursor 1.14 1.31 1.90CA968740 cDNA clone similar to Elastase 1 precursor 1.51 1.48 2.08AAH42328 Ela2 protein 1.77 1.93 2.10AAH92664 Trypsin 1.82 1.82 2.11NP_955899 zgc:66382 (unknown protein containing trypsin domain [Danio rerio] 1.77 1.95 2.04AAH78376 zgc:92041 (unknown protein containing trypsin domain [Danio rerio] 1.81 1.78 1.90CA966708 Cyprinus carpio cDNA clone similar to syncollin 1.48 1.29 1.83
Mitochondrial energy metabolism
AAQ54323 Cytochrome b �1.81 �1.25 �1.42NP_112132 NADH dehydrogenase subunit 1 1.65 1.48 1.17
Detoxification and stress response
AAF78081 Glutathione S-transferase 1.59 1.41 1.02CF662051 cDNA clone similar to Selenoprotein Pa precursor (zSelPa) �1.13 1.89 1.10
Unknown
– EBT_carp_LM0014 �2.04 �1.63 �1.51CA967023 cDNA clone 12k12 5 1.62 1.36 1.19CAF97157 Unnamed protein product [Tetraodon nigroviridis] 1.69 1.27 1.07
2298L
.N.
Mo
ens
eta
l./
Ch
emo
sph
ere6
7(
20
07
)2
29
3–
23
04

NP
_956
302
zgc:
7339
51.
781.
161.
19A
AM
2119
8C
yp
rin
us
carp
iocD
NA
clo
ne
11e2
45’
1.79
1.01
1.32
CA
9676
61cD
NA
clo
ne
10i0
45
1.68
2.12
1.18
CA
9696
13cD
NA
clo
ne
23h
105
�1.
122.
031.
16X
P_3
7215
0H
ypo
thet
ical
pro
tein
XP
_376
918
�1.
041.
90�
1.02
AW
0591
45cD
NA
clo
ne
IMA
GE
:373
9958
31.
011.
821.
13–
EB
T_c
arp
_LM
0489
1.09
1.85
1.03
CN
3278
81D
an
iore
rio
cDN
Acl
on
eIM
AG
E:7
2638
755
1.43
2.34
1.32
CA
G07
202
Un
nam
edp
rote
inp
rod
uct
[Tet
rao
do
nn
igro
viri
dis
]�
1.30
1.51
1.83
DT
3571
28P
imep
hal
esp
rom
elas
cDN
Acl
on
eC
AB
Y56
8�
1.02
1.37
1.82
CA
F92
564
Un
nam
edp
rote
inp
rod
uct
[Tet
rao
do
nn
igro
viri
dis
]1.
181.
251.
65–
EB
T_c
arp
_LM
0578
�1.
39�
1.09
�1.
78A
G03
661
Un
nam
edp
rote
inp
rod
uct
[Tet
rao
do
nn
igro
viri
dis
]�
1.22
�1.
32�
1.78
–E
BT
_car
p_L
M00
981.
701.
642.
16
L.N. Moens et al. / Chemosphere 67 (2007) 2293–2304 2299
upregulated after effluent treatment. These include genesinvolved in lipid, starch and – particularly – protein diges-tion. Most of these genes responded in a time-dependentmanner, with an increasing induction level over the timecourse of the experiment. Only the lipid digestion enzymecarboxyl ester lipase was found to be uniquely upregulatedafter two weeks of exposure.
After one week, expression results indicate that effluentexposure could also interfere with the mitochondrial path-ways of the fish. Two mitochondrial electron transportgenes were altered by effluent treatment, although inopposite directions: the expression of cytochrome b wasdecreased, whereas NADH dehydrogenase transcript lev-els were increased by effluent exposure. At this point intime, we also observed an increase in the expression levelsof the detoxification enzyme glutathione-S-transferase,which subsequently steadily dropped over the time courseof the experiment. After 14 days of exposure, we noticed aspecific induction of Selenoprotein Pa, an oxidative stress-responsive protein. Finally, a set of genes with unknownbiological functions were found to be influenced by efflu-ent treatment, some of which responded specifically atone of the time intervals, while others exhibited an over-lapping, or time-dependent response.
3.4. Assessment of endocrine disruptive potential of the
effluent
Although one gene involved in steroid (androgen)metabolism was found to be downregulated at two weeksof effluent exposure, no other apparent signs of endocrinedisruptive effects were observed. In order to substantiate
Fig. 2. Hierarchical clustering analysis of gene expression patternsinduced by exposure to 14 model endocrine disruptors (Moens et al.,2006), and effluent treatment. Effluent exposure at the three time pointsinduced comparable gene expression fingerprints, which is reflected in anindividual ‘effluent cluster’. No relationships were observed betweeneffluent exposure and any of the reference endocrine disruptingcompounds.
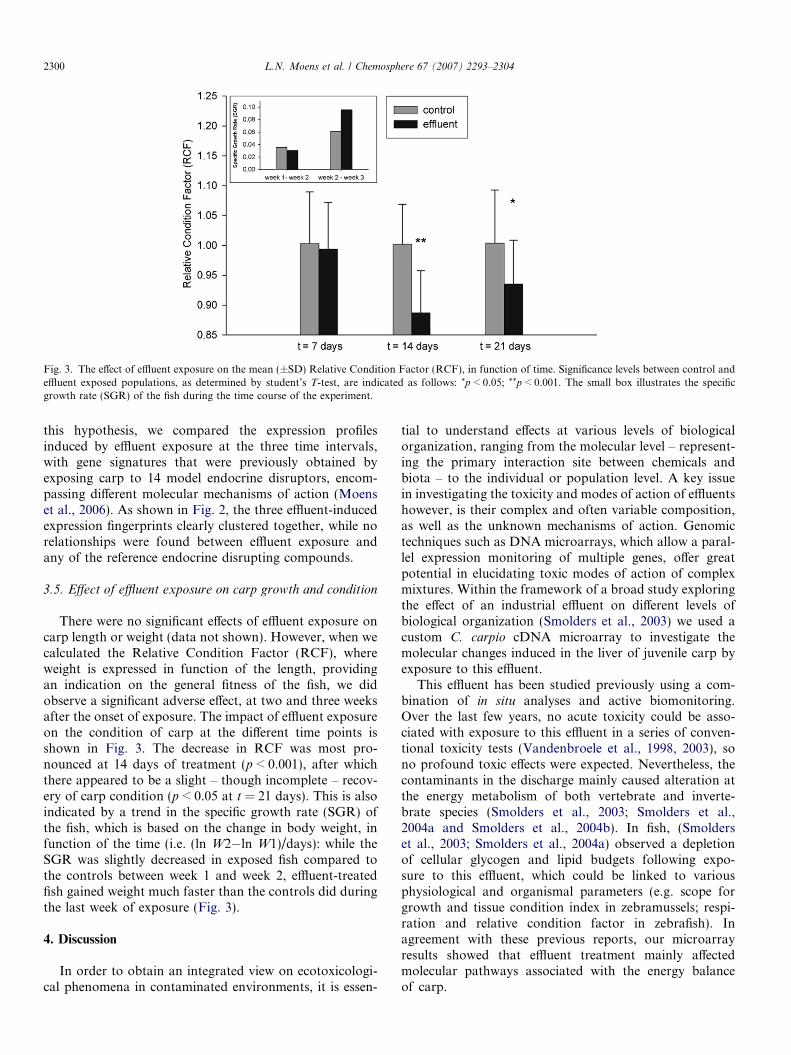
Fig. 3. The effect of effluent exposure on the mean (±SD) Relative Condition Factor (RCF), in function of time. Significance levels between control andeffluent exposed populations, as determined by student’s T-test, are indicated as follows: *p < 0.05; **p < 0.001. The small box illustrates the specificgrowth rate (SGR) of the fish during the time course of the experiment.
2300 L.N. Moens et al. / Chemosphere 67 (2007) 2293–2304
this hypothesis, we compared the expression profilesinduced by effluent exposure at the three time intervals,with gene signatures that were previously obtained byexposing carp to 14 model endocrine disruptors, encom-passing different molecular mechanisms of action (Moenset al., 2006). As shown in Fig. 2, the three effluent-inducedexpression fingerprints clearly clustered together, while norelationships were found between effluent exposure andany of the reference endocrine disrupting compounds.
3.5. Effect of effluent exposure on carp growth and condition
There were no significant effects of effluent exposure oncarp length or weight (data not shown). However, when wecalculated the Relative Condition Factor (RCF), whereweight is expressed in function of the length, providingan indication on the general fitness of the fish, we didobserve a significant adverse effect, at two and three weeksafter the onset of exposure. The impact of effluent exposureon the condition of carp at the different time points isshown in Fig. 3. The decrease in RCF was most pro-nounced at 14 days of treatment (p < 0.001), after whichthere appeared to be a slight – though incomplete – recov-ery of carp condition (p < 0.05 at t = 21 days). This is alsoindicated by a trend in the specific growth rate (SGR) ofthe fish, which is based on the change in body weight, infunction of the time (i.e. (ln W2�ln W1)/days): while theSGR was slightly decreased in exposed fish compared tothe controls between week 1 and week 2, effluent-treatedfish gained weight much faster than the controls did duringthe last week of exposure (Fig. 3).
4. Discussion
In order to obtain an integrated view on ecotoxicologi-cal phenomena in contaminated environments, it is essen-
tial to understand effects at various levels of biologicalorganization, ranging from the molecular level – represent-ing the primary interaction site between chemicals andbiota – to the individual or population level. A key issuein investigating the toxicity and modes of action of effluentshowever, is their complex and often variable composition,as well as the unknown mechanisms of action. Genomictechniques such as DNA microarrays, which allow a paral-lel expression monitoring of multiple genes, offer greatpotential in elucidating toxic modes of action of complexmixtures. Within the framework of a broad study exploringthe effect of an industrial effluent on different levels ofbiological organization (Smolders et al., 2003) we used acustom C. carpio cDNA microarray to investigate themolecular changes induced in the liver of juvenile carp byexposure to this effluent.
This effluent has been studied previously using a com-bination of in situ analyses and active biomonitoring.Over the last few years, no acute toxicity could be asso-ciated with exposure to this effluent in a series of conven-tional toxicity tests (Vandenbroele et al., 1998, 2003), sono profound toxic effects were expected. Nevertheless, thecontaminants in the discharge mainly caused alteration atthe energy metabolism of both vertebrate and inverte-brate species (Smolders et al., 2003; Smolders et al.,2004a and Smolders et al., 2004b). In fish, (Smolderset al., 2003; Smolders et al., 2004a) observed a depletionof cellular glycogen and lipid budgets following expo-sure to this effluent, which could be linked to variousphysiological and organismal parameters (e.g. scope forgrowth and tissue condition index in zebramussels; respi-ration and relative condition factor in zebrafish). Inagreement with these previous reports, our microarrayresults showed that effluent treatment mainly affectedmolecular pathways associated with the energy balanceof carp.

L.N. Moens et al. / Chemosphere 67 (2007) 2293–2304 2301
Although our microarray data do not give a completedepiction of all molecular events occurring after effluentexposure, this study demonstrates the value of a comple-mentary application of microarrays in a ‘‘systems toxicol-ogy’’ approach; it is clear that all levels of biologicalorganization are relevant to reconstruct the toxicologicalconsequences of this mixture exposure. Importantly, themolecular mechanisms of action observed in the presentstudy can be clearly linked to, and integrated in previouslyreported cellular and higher level effects.
When organisms are exposed to suboptimal environ-ments, e.g. resulting from contaminant exposure, there willbe a priority cost of combating stress in terms of metabolicresources and available energy (Calow, 1991). The liver, asthe organism’s central metabolic organ, plays an essentialrole in maintaining proper levels of nutrients in the bloodfor use in brain, muscles and other tissues. Two keyenzymes in the regulation of blood glucose levels, glucoki-nase and the glycogen targeting regulatory subunit (R5) ofprotein phosphatase 1 (PP1), were found to be influencedafter one and three weeks of effluent treatment. PP1 hasbeen named a ‘‘green’’ enzyme, promoting the rationaluse of energy, when nutrients are abundant and all environ-mental conditions are optimal (Ceulemans and Bollen,2004). It plays a key role in the regulation of glycogenmetabolism, catalyzing the dephosphorylation of glycogensynthase and phosphorylase, thereby activating and inhi-biting these enzymes, respectively, and promoting the netsynthesis of glycogen (Ceulemans and Bollen, 2004). Adecrease in the expression of the glycogen targeting subunitof PP1, as observed here, will inhibit PP1 from acting onglycogen synthase and phosphorylase, resulting in adecreased glycogen synthesis and a stimulation of glyco-genolysis. In line with this, the gene encoding glucokinasewas also found to be downregulated at the same exposureperiods. Glucokinase is the predominant glucose-phos-phorylating enzyme in hepatocytes (Iynedjian, 1993), andits catalytic product (glucose-6-phosphate) is required forthe allosteric activation of glycogen synthase, convertingit to a better substrate for protein phosphatases (includingPP1) (Ferrer et al., 2003). An inactivation of glucokinase,as observed here, will revert glycogen synthase to its inac-tive (i.e. phosphorylated) state, resulting in a reduced gly-cogen synthesis (Ferrer et al., 2003). These results are inconcordance with, and give additional mechanistic infor-mation on the previously reported reduction of whole bodyglycogen budgets in zebrafish following exposure to thiseffluent (Smolders et al., 2003) (see Table 1). By bothdepleting intracellular glycogen stores, and inhibiting de
novo hepatic glycogen synthesis, a high amount of glucoseis released into the blood and becomes available for use byother tissues, such as brain and muscle, and for coping withstress conditions.
In addition to the effects on carbohydrate metabolism,we also observed several effects on lipid/fatty acid metabo-lism and transport. For instance, Apolipoprotein A-I(ApoA-I) expression was found to be downregulated by
effluent treatment at all time points investigated. On thecontrary, a fish-specific 14 kDa apolipoprotein (Apo-14),that has no homologue in other vertebrates (Kondoet al., 2005), was upregulated after effluent exposure.Although both of these proteins have been identified asmajor components of high density lipoprotein (HDL) infish (Amthauer et al., 1989, 2001), they are clearly regulatedin a different way, presumably reflecting a distinct function.Since the exact function of these proteins in fish is not fullyunderstood – lipid metabolism in fish has repeatedly beenshown to be different from mammals (Sheridan, 1988) –the observed effects of effluent treatment on ApoA-I andApo-14 expression are difficult to interpret. Typically, pol-lutant exposure or stress factors cause a depletion of lipidresources in fish (Sancho et al., 1998; Handy et al., 1999;Berntssen and Lundebye, 2001), a phenomenon that wasalso found in zebrafish and carp following exposure to thiseffluent (Smolders et al., 2003; Smolders et al., 2004b)(Table 1). Therefore, it seems reasonable to state that theobserved effects on apolipoprotein expression might reflectthe molecular changes underlying an increased lipid andfatty acid oxidation.
A significant number of genes involved in various diges-tive processes was found to be influenced after effluenttreatment, including genes involved in lipid, starch and,most markedly, protein digestion. This is not surprising,considering the central role of digestive enzymes in thefood absorption process. Although remarkably few studieshave examined the digestive enzyme activity in relation totoxic insult, both toxicant-induced decreases and increasesin digestive enzyme activity have been described in litera-ture (Sastry and Gupta, 1978; Sastry and Gupta, 1980;De Coen and Janssen, 1997). The upregulation of digestiveprocesses, as observed here, might reflect a means of theorganisms to extract more energy from food, in order tocope with the toxicant-induced increase in metabolicdemand. As demonstrated in Fig. 3, this upregulation ineffluent-exposed fish was not translated into an increasedcondition, indicating that the gathered energy was indeedallocated towards stress-combating processes rather thangrowth, in particular during the first two weeks of expo-sure. During the last week of exposure however, an appar-ent recovery of carp condition, together with an increasedspecific growth rate was observed (Fig. 3). This compensa-tory or ‘catch-up’ growth after two weeks of exposure wasalso repeatedly reported by Smolders et al. in zebrafish andcarp exposed to the same effluent Smolders et al. (2002a);Smolders et al., 2004b, and was considered an indicationthat effluent-treated fish suffered from an initial shock,mainly impacting on food uptake and assimilation,followed by a rapid growth recovery. In the light of ourresults, we can further refine this thesis, by hypothesiz-ing that the described observations (i.e. a suppressionof growth and/or condition during the first weeks ofexposure, and a subsequent fast compensatory growth)might be explained by a time-dependent shift in food-derived nutrient preferences as well as intracellular energy
2302 L.N. Moens et al. / Chemosphere 67 (2007) 2293–2304
expenditure: both protein and starch digestion efficienciesseemed to improve over time, as shown by the increasingexpression levels of several serine proteases and alpha-amy-lase, respectively. In fact, the latter was only induced fromtwo weeks of exposure on, while it was not influenced after7 days of effluent treatment. Furthermore, after two weeksof exposure activation of the expression of carboxyl esterlipase could indicate a more efficient digestion of food-derived lipids, compared to control fish. At this time point,the induced transcript levels of acyl-CoA in exposed fishcould even demonstrated increased de novo synthesis offatty acids. Once more, this effect on lipid metabolismgenes is consistent with the previously reported fast recov-ery of lipid budgets in zebrafish and carp exposed to thiseffluent (Smolders et al., 2003; Smolders et al., 2004b). Infact, these reports described a strikingly parallel time-related effect on lipid reserves, involving an effluent-induced decrease in cellular lipid budgets, which was mostmarked after two weeks of effluent treatment, and thengradually recovered from two weeks of exposure on(Table 1). Taken together, our molecular results corrobo-rate the previous biochemical and organismal data, show-ing the complementary mechanistic information that iscollected at the different hierarchical levels.
In addition to the various changes in energy metabolismof effluent-treated fish, we also observed a few signs of toxicresponses. After one week of exposure, glutathione-S-trans-ferase (GST) was found to be induced. GST enzymes havean important role in the detoxification of a wide numberof exogenous and endogenous hydrophobic electrophiles,by conjugation with glutathione (Hayes and Strange,2000). As the GST gene was specifically induced at 7 daysexposure, after which its expression levels steadily decreasedover time, it is assumed that this effect reflects a transientreaction of the organisms in response to the presence ofexogenous substances, after which they adapt to, or recoverfrom this toxic insult. After one week, effluent exposure alsointerfered with the mitochondrial energy metabolism of thefish: the expression of NADH dehydrogenase was found tobe increased, whereas cytochrome b transcript levels weredecreased after 7 days of effluent exposure. Although thesetranscriptional results are seemingly contradictory, theycould reflect an interference of effluent exposure with ATPsynthesis-coupled mitochondrial electron transport at thistime interval. After two weeks of exposure, we observedan induction of selenoprotein Pa, an abundant extracellularglycoprotein that has been implicated in the protectionagainst oxidative damage (Tujebajeva et al., 2000; Burket al., 2003). Its expression has been shown to be upregu-lated following exposure to a variety of compounds (Moenset al., 2006), and can be considered indicative of a generaltoxicant-induced (oxidative) stress response.
No interference with immune-related genes wasobserved, nor a clear-cut indication of endocrine disrup-tion. Although we did find an alteration of a single geneinvolved in androgen metabolism after two weeks of efflu-ent treatment, this effect was not found at 7 days of expo-
sure, and was largely reduced after 21 days. Therefore, weconsider this expression change as a temporary side effectof effluent-induced alterations in the energy balance andintermediary metabolism of the organisms, rather than adirect effect of ‘endocrine disrupting chemicals’. This wasalso suggested by Smolders et al. (2002a), when theyobserved a decrease in the reproductive success of zebrafishexposed to this effluent – fish in the 100% effluent only pro-duced about 25% of the number of eggs and juveniles pro-duced in the control.
To further validate this hypothesis, we compared theexpression profiles induced by effluent exposure at the threetime intervals, with gene signatures that were previouslygenerated by exposing carp to a set of model endocrinedisruptors, representing different molecular mechanismsof action and endocrine pathways (Moens et al., 2006).To that purpose, we subjected the expression profiles toa hierarchical clustering analysis. This is a commonlyused approach in toxicogenomics to group or classifychemicals, based on their similarity in gene expressionpatterns. These algorithms produce a classification inwhich small clusters of very similar compounds are nestedwithin larger clusters of less closely-related chemicals. Forexample, it is observed that a group of known estrogeniccompounds (bisphenol A, ethinylestradiol, 17beta-estra-diol, 4-nonylphenol and the estrogen-like metabolites ofmethyltestosterone) were clearly grouped together in onecluster, distinct from the other chemicals (Moens et al.,2006). This grouping of compounds thus represents a com-mon mode of action, which distinguishes this chemicalclass from the other substances. Likewise, the clusterformed by the three effluent treatment conditions, separatefrom the various reference endocrine disruptors (Fig. 2),reflects that the effluent-induced molecular effects at thethree time points are closely related to each other, whilethey are distinct from the gene expression patterns inducedby the endocrine disrupting compounds. It is therefore con-cluded that the effluent exposure did not cause direct endo-crine disruption in carp.
In conclusion, this is one of the first studies investigatingthe use of molecular genomic tools for the characterizationof whole effluent toxicity. We have demonstrated that ourmicroarray data are in full correspondence with other bio-chemical, physiological and ecological data generated forthe same effluent. In this perspective, we argue for a coordi-nated utilization of toxicogenomic tools in a ‘‘systems toxi-cology’’ approach, which involves an integrated and holisticassessment of the adverse effects of chemicals and stressors,across multiple levels of biological complexity. Each level ofbiological organization provides a key element in the evalu-ation of toxic insult, and mechanisms at the molecular levelcan be further understood in the light of the available dataon survival, growth, energy metabolism, etc.
The results of our study indicated that effluent treatmentmainly affected the energy balance of the fish, which is inagreement with previous reports. Various alterations inthe metabolism of both endogenous and exogenous energy

L.N. Moens et al. / Chemosphere 67 (2007) 2293–2304 2303
resources were observed following effluent exposure,including changes in carbohydrate and lipid metabolism,as well as digestive enzyme activity. Effluent treatmentdid not interfere with any of the molecular pathways asso-ciated with immune responses in carp. Furthermore, whenexpression fingerprints of effluent-treated fish were com-pared to a set of reference endocrine disruptor-associatedgene profiles, no clear-cut signs of direct, chemical-inducedendocrine disruption were found.
Considering the consistency of these data – expressionlevels were derived from four biological replicate hybridiza-tions – and the high conformity with previously described,higher level effects, we believe that our results illustrate thepower of toxicogenomics, and more specifically our cus-tomized carp cDNA microarray, for unraveling the molec-ular mechanisms of action underlying adverse effects ofcomplex chemical mixtures, and evaluating their endocrinedisruptive potential. Yet, to be able to fully comprehendthe toxicity and associated molecular effects of complexmixtures, large databases comprising numerous expressionprofiles of individual, pure chemicals will be needed.
Acknowledgements
This work was financially supported by the Promotionof Innovation by Science and Technology in Flanders(I.W.T.) (Grant No. 1274), and partially funded by theFund for Scientific Research Flanders (FWO-Flanders)(G.0358.02).
References
Adams, S.M., Crumby, W.D., Greeley Jr., M.S., Shugart, L.R., Saylor,C.F., 1992. Responses of fish populations and communities to pulpmill effluents: a holistic assessment. Ecotoxicol Environ Safety 24, 347–360.
Adams, M.S., Greeley, M.S., Ryon, M.G., 2000. Evaluating effects ofcontaminants on fish health at multiple levels of biological organiza-tion: extrapolating from lower to higher levels. Hum. Ecol. RiskAssess. 6, 15–27.
Amthauer, R., Villanueva, J., Vera, M.I., Concha, M.I., Krauskopf, M.,1989. Characterization of the major plasma apolipoproteins of thehigh density lipoprotein in the carp (Cyprinus carpio). Comput.Biochem. Physiol. 92B, 787–793.
Berntssen, M.H., Lundebye, A.K., 2001. Energetics in Atlantic salmon(Salmo salar L.) parr fed elevated dietary cadmium. Comp. Biochem.Physiol. C Toxicol. Pharmacol. 128, 311–323.
Burk, R.F., Hill, K.E., Motley, A.K., 2003. Selenoprotein metabolism andfunction: evidence for more than one function for selenoprotein P. J.Nutr. 133, 1517S–1520S.
Calow, P., 1991. Physiological costs of combating chemical toxicants:ecological implications. Comp. Biochem. Physiol. C. 100, 3–6.
Ceulemans, H., Bollen, M., 2004. Functional diversity of proteinphosphatase-1, a cellular economizer and reset button. Physiol. Rev.84, 1–39.
De Coen, W., Janssen, C., 1997. The use of biomarkers in Daphnia magnatoxicity testing. II. Digestive enzyme activity in Daphnia magnaexposed to sublethal concentrations of cadmium, chromium andmercury. Chemosphere 35, 1053–1076.
Denslow, N.D., Kocerha, J., Sepulveda, M.S., Gross, T., Holm, S.E.,2004. Gene expression fingerprints of largemouth bass (Micropterus
Salmoides) exposed to pulp and paper mill effluents. Mut. Res. 552,19–34.
Ferrer, J.C., Favre, C., Gomis, R.R., Fernandez-Novell, J.M., Garcia-Rocha, M., de la Iglesia, N., Cid, E., Guinovart, J.J., 2003. Control ofglycogen deposition. FEBS Lett. 546, 127–132.
Handy, R.D., Sims, D.W., Giles, A., Campbell, H.A., Musonda, M.M.,1999. Metabolic trade-off between locomotion and detoxification formaintenance of blood chemistry and growth parameters by rainbowtrout (Oncorhynchus mykiss) during chronic dietary exposure tocopper. Aquat. Toxicol. 47, 23–41.
Hayes, J.D., Strange, R.C., 2000. Glutathione-S-transferase poly-morphisms and their biological consequence. Pharmacology 61,154–166.
Hinton, D.E., Kullman, S.W., Hardman, R.C., Volz, D.C., Chen, P.J.,Carney, M., Bencic, D.C., 2005. Resolving mechanisms of toxicitywhile pursuing ecotoxicological relevance? Marine Pollut. Bull. 51,635–648.
Huber, W., Von Heydebreck, A., Sultmann, H., Poustka, A., Vingron, M.,2002. Variance stabilization applied to microarray data calibration andto the quantification of differential expression. Bioinformatics 18, S96–S104.
Iynedjian, P.B., 1993. Mammalian glucokinase and its gene. Biochem. J.293 (Pt 1), 1–13.
Jones, R.E., Petrell, R.J., Pauly, D., 1999. Using modified length–weightrelationship to assess the condition of fish. Aqua. Eng. 20, 261–276.
Kondo, H., Kawazoe, I., Nakaya, M., Kikuchi, K., Aida, K., Watabe, S.,2001. The novel sequences of major plasma apolipoproteins in the eelAnguilla japonica. Biochim. et Biophysica Acta 1531, 132–142.
Kondo, H., Morinaga, K., Misaki, R., Nakaya, M., Watabe, S., 2005.Characterization of the pufferfish Takifugu rubripes apolipoproteinmultigene family. Gene 346, 257–266.
Koskinen, H., Pehkonen, P., Vehniainen, E., Krasnov, A., Rexroad, C.,Afanasyev, S., Molsa, H., Oikari, A., 2004. Response of rainbow trouttranscriptome to model chemical contaminants. Biochem. Biophys.Res. Commun. 320, 745–753.
Linton, E.D., Scuton, D.A., McKinley, R.S., 2005. Physiological effects ofthermomechanical newsprint mill effluent on Atlantic salmon (Salmo
salar L.). Ecotoxicol. Environ. Safety 62, 317–330.Moens, L.N., Soetaert, A., van der Ven, K., Del-Favero, J., De Coen,
W.M., in press-a. Use of suppression subtractive hybridization pcr forthe development of cDNA arrays for the detection of endocrinedisruption in carp (Cyprinus carpio). Comp. Biochem. Physiol.
Moens, L.N., van der Ven, K., Van Remortel, P., Del-Favero, J., DeCoen, W.M., in press-b. Gender related differences in gene expressionin common carp (Cyprinus carpio): a microarray study. Gen. Comp.Endocrinol.
Moens, L.N., van der Ven, K., van Remortel, P., Del-Favero, J., De Coen,W.M., 2006. Expression profiling of endocrine disrupting compoundsusing a customized Cyprinus carpio cDNA microarray. Toxicol. Sci. 93(2), 298–310.
Porter, C.M., Janz, D.M., 2003. Treated municipal sewage dischargeaffects multiple levels of biological organization in fish. Ecotoxicol.Environ. Safety 54, 199–206.
Sancho, E., Ferrando, M.D., Andreu, E., 1998. Effects of sublethalexposure to a pesticide on levels of energetic compounds in Anguillaanguilla. J. Environ. Contam. 33B, 411–424.
Sastry, K.V., Gupta, P.K., 1978. Alternations in the activity of somedigestive enzymes of Channa punctatus, exposed to lead nitrate. Bull.Environ. Contam. Toxicol. 19, 549–555.
Sastry, K.V., Gupta, P.K., 1980. Changes in the activities of somedigestive enzymes of Channa punctatus, exposed chronically tomercuric chloride. J. Environ. Sci. Health B 15, 109–119.
Sepulveda, M.S., Quinn, B.P., Denslow, N.D., Holm, S.E., Gross, T.S.,2003. Effects of pulp and paper mill effluents on reproductive success oflargemouth bass. Environ. Toxicol. Chem. 22, 205–213.
Sheridan, M.A., 1988. Lipid dynamics in fish: aspects of absorption,transportation, deposition and mobilization. Comp. Biochem. Physiol.B 90, 679–690.

2304 L.N. Moens et al. / Chemosphere 67 (2007) 2293–2304
Smolders, R., Bervoets, L., De Boeck, G., Blust, R., 2002a. Integratedcondition indices as a measure of whole effluent toxicity in zebrafish(Danio rerio). Environ. Toxicol. Chem. 21, 87–93.
Smolders, R., Bervoets, L., Blust, R., 2002b. Transplanted zebra mussels(Dreissena polymorpha) as active biomonitors in an effluent-dominatedriver. Environ. Toxicol. Chem. 21, 1889–1896.
Smolders, R., 2003. The impact of an industrial effluent on the receivingaquatic ecosystem: an ecological, physico-chemical and ecotoxicolog-ical analysis. PhD thesis, University of Antwerp, 240p.
Smolders, R., De Boeck, G., Blust, R., 2003. Changes in cellular energybudget as a measure of whole effluent toxicity in zebrafish (Danio
rerio). Environ. Toxicol. Chem. 22, 890–899.Smolders, R., Bervoets, L., De Coen, W., Blust, R., 2004a. Cellular energy
allocation in zebra mussels exposed along a pollution gradient: linkingcellular effects to higher levels of biological organization. Environ.Pollut. 129, 99–112.
Smolders, R., Bervoets, L., Blust, R., 2004b. In situ and laboratorybioassays to evaluate the impact of effluent discharges on receivingaquatic ecosystems. Environ. Pollut. 132 (2), 231–243.
Smolders, R., De Coen, W., Blust, R., 2004c. An ecologically relevantexposure assessment for a polluted river using an integrated multivar-iate PLS approach. Environ. Pollut. 132, 245–263.
Soetaert, A., Moens, L.N., Van der Ven, K., Van Leemput, K., Naudts,B., Blust, R., De Coen, W.M., 2006. Molecular impact of propico-
nazole on Daphnia magna using a reproduction-related cDNA array.Comp. Biochem. Physiol. C 142, 66–76.
Teodorakis, C.W., Lee, K.L., Adams, S.M., Law, C.B., 2006. Evidence ofaltered gene flow, mutation rate and genetic diversity in redbreastsunfish from a pulp-mill-contaminated river. Environ. Sci. Technol. 40,377–386.
Tujebajeva, R.M., Harney, J.W., Berry, M.J., 2000. Selenoprotein Pexpression, purification, and immunochemical characterization. J.Biological Chem. 275, 6288–6294.
Vandenbroele, M., Van Sprang, P., Heijerick, D., Janssen, C. Witters, H.,Goyvaerts, M.P., Berckmans, P., Delbeke, K., Van Der Kerken, K.,1998. Ecotoxicologisch onderzoek op effluenten: sectoren textielver-deling en organische chemische nijverheid, Vlaamse Milieumaatschap-pij, 155p. (in Dutch).
van den Heuvel, M.R., Ellis, R.J., 2002. Timing of exposure to a pulp andpaper effluent influences the manifestation of reproductive effects inrainbow trout. Environ. Toxicol. Chem. 21, 2338–2347.
van der Ven, K., De Wit, M., Keil, D., Moens, L., Van Leemput, K.,Naudts, B., De Coen, W., 2005. Development and application of abrain-specific cDNA microarray for effect evaluation of neuro-activepharmaceuticals in zebrafish (Danio rerio). Comp. Biochem. Physiol. B141, 408–417.