Efficient expansion of global protected areas requires simultaneous planning for species and...
11
rsos.royalsocietypublishing.org Research Cite this article: Polak T, Watson JEM, Fuller RA, Joseph LN, Martin TG, Possingham HP, Venter O, Carwardine J. 2015 Efficient expansion of global protected areas requires simultaneous planning for species and ecosystems. R. Soc. open sci. 2: 150107. http://dx.doi.org/10.1098/rsos.150107 Received: 9 March 2015 Accepted: 1 April 2015 Subject Category: Biology (whole organism) Subject Areas: ecology Keywords: ecosystem-based targets, surrogacy, spatial prioritization, geographical range size, adequacy, representation, CBD Aichi targets Author for correspondence: Tal Polak e-mail: [email protected] Electronic supplementary material is available at http://dx.doi.org/10.1098/rsos.150107 or via http://rsos.royalsocietypublishing.org. Efficient expansion of global protected areas requires simultaneous planning for species and ecosystems Tal Polak 1 , James E. M. Watson 2,3 , Richard A. Fuller 1 , Liana N. Joseph 1,3 , Tara G. Martin 1,4 , Hugh P. Possingham 1,5 , Oscar Venter 1,6 and Josie Carwardine 4 1 School of Biological Sciences, and 2 School of Geography, Planning and Environmental Management, University of Queensland, St Lucia, Queensland 4072, Australia 3 Global Conservation Program, Wildlife Conservation Society, Bronx, NY 10460, USA 4 CSIRO Land and Water, PO Box 2583, Brisbane, Queensland 4001, Australia 5 Department of Life Sciences, Imperial College London, Silwood Park, Ascot SL5 7PY, Berkshire, UK 6 Centre for Tropical Environmental and Sustainability Science, James Cook University, Cairns, Queensland 4878, Australia 1. Summary The Convention on Biological Diversity (CBD)’s strategic plan advocates the use of environmental surrogates, such as ecosystems, as a basis for planning where new protected areas should be placed. However, the efficiency and effectiveness of this ecosystem-based planning approach to adequately capture threatened species in protected area networks is unknown. We tested the application of this approach in Australia according to the nation’s CBD-inspired goals for expansion of the national protected area system. We set targets for ecosystems (10% of the extent of each ecosystem) and threatened species (variable extents based on persistence requirements for each species) and then measured the total land area required and opportunity cost of meeting those targets independently, sequentially and simultaneously. We discover that an ecosystem-based approach will not ensure the adequate representation of threatened species in protected areas. Planning simultaneously for species and ecosystem targets delivered the most efficient outcomes for both sets of targets, while planning first for ecosystems and then filling the gaps to meet species targets was the most inefficient conservation strategy. Our analysis highlights the pitfalls of pursuing goals for species and ecosystems non-cooperatively and has significant implications for nations aiming to meet their CBD mandated protected area obligations. 2015 The Authors. Published by the Royal Society under the terms of the Creative Commons Attribution License http://creativecommons.org/licenses/by/4.0/, which permits unrestricted use, provided the original author and source are credited. on April 29, 2015 http://rsos.royalsocietypublishing.org/ Downloaded from
Transcript of Efficient expansion of global protected areas requires simultaneous planning for species and...

rsosroyalsocietypublishingorg
ResearchCite this article Polak T Watson JEM FullerRA Joseph LN Martin TG Possingham HPVenter O Carwardine J 2015 Efficientexpansion of global protected areas requiressimultaneous planning for species andecosystems R Soc open sci 2 150107httpdxdoiorg101098rsos150107
Received 9 March 2015Accepted 1 April 2015
Subject CategoryBiology (whole organism)
Subject Areasecology
Keywordsecosystem-based targets surrogacy spatialprioritization geographical range sizeadequacy representation CBD Aichi targets
Author for correspondenceTal Polake-mail tpolakuqeduau
Electronic supplementary material is availableat httpdxdoiorg101098rsos150107 or viahttprsosroyalsocietypublishingorg
Efficient expansion of globalprotected areas requiressimultaneous planning forspecies and ecosystemsTal Polak1 James E M Watson23 Richard A Fuller1
Liana N Joseph13 Tara G Martin14 Hugh P
Possingham15 Oscar Venter16 and Josie Carwardine4
1School of Biological Sciences and 2School of Geography Planning and EnvironmentalManagement University of Queensland St Lucia Queensland 4072 Australia3Global Conservation Program Wildlife Conservation Society Bronx NY 10460 USA4CSIRO Land andWater PO Box 2583 Brisbane Queensland 4001 Australia5Department of Life Sciences Imperial College London Silwood Park Ascot SL5 7PYBerkshire UK6Centre for Tropical Environmental and Sustainability Science James Cook UniversityCairns Queensland 4878 Australia
1 SummaryThe Convention on Biological Diversity (CBD)rsquos strategicplan advocates the use of environmental surrogates such asecosystems as a basis for planning where new protected areasshould be placed However the efficiency and effectiveness ofthis ecosystem-based planning approach to adequately capturethreatened species in protected area networks is unknown Wetested the application of this approach in Australia according tothe nationrsquos CBD-inspired goals for expansion of the nationalprotected area system We set targets for ecosystems (10 ofthe extent of each ecosystem) and threatened species (variableextents based on persistence requirements for each species) andthen measured the total land area required and opportunitycost of meeting those targets independently sequentially andsimultaneously We discover that an ecosystem-based approachwill not ensure the adequate representation of threatened speciesin protected areas Planning simultaneously for species andecosystem targets delivered the most efficient outcomes for bothsets of targets while planning first for ecosystems and thenfilling the gaps to meet species targets was the most inefficientconservation strategy Our analysis highlights the pitfalls ofpursuing goals for species and ecosystems non-cooperatively andhas significant implications for nations aiming to meet their CBDmandated protected area obligations
2015 The Authors Published by the Royal Society under the terms of the Creative CommonsAttribution License httpcreativecommonsorglicensesby40 which permits unrestricteduse provided the original author and source are credited
on April 29 2015httprsosroyalsocietypublishingorgDownloaded from
2
rsosroyalsocietypublishingorgRSocopensci2150107
2 IntroductionProtected areas are pivotal for conserving both ecosystems and threatened species [1] While thepersistence of biodiversity often requires a suite of management strategies protected areas providea buffer from a myriad of threatening processes [23] Gap analyses of the current global coverageof protected areas (approx 12 of Earthrsquos land surface) highlight that many ecosystems and mostthreatened species are not well represented [4ndash9] In most countries a lack of systematic planning hasgiven rise to significant biases in the location of protected areas [1011] Typically conservation landwas selected in locations that were not required for other more lucrative land uses [11] Systematicconservation planning approaches have sought to redress these biases by using spatial data on speciesdistributions and ecosystems to prioritize locations for new protected areas [12] The expansion ofcurrent protected area networks has the potential to overcome these biases and improve ecosystemprotection and the survival of threatened species populations helping to avoid biodiversity loss andspecies extinctions [561314]
Over the past decade there has been a major shift towards ecosystem-based planning for theexpansion of protected area networks [15ndash18] Ecosystem-based targets use environmental surrogates atvarious scales (eg bioregions and ecoregions) with the intention of efficiently representing biodiversityas a whole including species and processes [1519] Ecosystem-based planning is used as an approach toavoid the often challenging need for unbiased high-resolution information on the spatial distributionsof species [20ndash22] Much of the existing species data have sparse or patchy distributions biased by surveyeffort causing species-driven conservation planning to fail in representing biodiversity as a whole [23]Ecosystem data are typically spatially contiguous and coarser than species data thereby providingmore flexibility for locating new protected areas and more options for avoiding conflicting landuses [8]
Critics of ecosystem-based targets argue that they are too coarse to effectively represent biodiversityallowing many species to fall through the cracks [1202425] For example both Arauacutejo et al [24] andLombard et al [22] found that environmental surrogates perform relatively well for plants but fail toadequately represent vertebrates while Rodrigues amp Brooks [1] found that environmental surrogateswere poor at representing species Further the effectiveness of environmental surrogates decreases forspecies that are rare have patchy or historically driven distribution andor are data deficient which isthe case for many threatened species [2122]
The global goals stated within the Convention on Biological Diversity (CBD) strategic plans in both2004 and 2010 are a primary reason for the shift from species-based to ecosystem-based planning forfuture protected area acquisitions [16] Specifically in the 2010 CBDrsquos Aichi target 11 there is a clear goalto conserve 17 of terrestrial and inland waters and 10 of marine and coastal ecosystems [16] TheCBD states that networks should be ecologically representative but gives no specific stipulation for howmuch habitat for threatened species should be protected [16] The achievement of threatened speciesprotection under Aichi target 11 is therefore open to interpretation by nations considering the expansionof their protected area estate
There are 195 parties that are part of the CBD treaty each with the opportunity to translate these goalsto a national level in ways that may result in various outcomes for biodiversity represented in protectedareas For example ecosystems are the base unit of the South Africa National Protected Area ExpansionStrategy which plans to achieve the 17 representation by targeting different proportions of ecosystemsdepending upon their diversity and protection requirements [18] Similarly Australiarsquos National ReserveSystemrsquos (NRSrsquos) primary goal at the time of research was to protect 10 of each of its 85 bioregions [26]by representing at least 80 of the different types of ecosystems within each bioregion by 2015 witha secondary goal to represent core areas for threatened species by 2030 [26] This plan is an exampleof a coarsefine filter approach which advocates planning for ecosystems and then filling the gaps forspecies [2728] which is also applied in North America [2829]
The use of ecosystem-based targets both in global protected area guidelines and country-levelprotected area expansion policy has occurred in the absence of scientific analyses on how efficiently theecosystem-based surrogates represent threatened species While several studies [13031] have examinedthe comparative benefits of both approaches none have investigated their efficiency in protecting bothspecies and ecosystems in the context of the CBDrsquos strategic plan and country-level priority setting Fullimplementation of the 2010 CBD strategic plan across all signatory countries is likely to take considerabletime and resources but would represent one of the greatest expansions of the global protected areaestate in modern times [8] An improved understanding of how an ecosystem-based approach is likelyto impact conservation outcomes is therefore timely and will assist countries in translating the CBD
on April 29 2015httprsosroyalsocietypublishingorgDownloaded from
3
rsosroyalsocietypublishingorgRSocopensci2150107
goals into protected area expansion that efficiently and effectively conserves threatened species as wellas ecosystems
Here we conduct a novel assessment of the impact of ecosystem-based planning and the globalCBD goals on protected area outcomes for threatened species at the country level upon which they areimplemented We assess the potential for efficiency and effectiveness in threatened species and ecosystemcoverage in the expanding protected area network across Australia arguably the first country to fullyembrace a systematic planning approach using ecosystem-based targets to design the protected areaestate [263233] A recent continent-wide analysis by Watson et al [34] found that despite this relativelysystematic approach threatened species coverage in the protected area estate (which covered 116of the terrestrial surface) is still inadequate with approximately 12 of threatened species completelyabsent from the protected area network The Commonwealth of Australiarsquos plan to expand their reservesystem (known as the NRS [2635]) follows the guidelines and ecosystem-based approach suggested bythe CBD
Specifically we investigate (i) how well threatened species are likely to be captured in the resultantprotected area network if Australia aims to meet its 10 targets for all ecosystems most efficiently (ascurrent policies suggest) by minimizing the area required (ii) how well ecosystem-based targets arelikely to be met if Australiarsquos protected area network is designed to meet targets for threatened speciesonly and finally (iii) the efficiency and effectiveness of planning for both sets of targets simultaneouslyversus sequentially (eg meeting ecosystem targets first and species targets later or vice versa) We defineefficiency as the amount of area required to meet a given set of targets and effectiveness as the level ofrepresentation of a target in a given protected area network
3 Material and methods31 Ecosystem spatial data and targetsAt the time of this research Australia was divided into 85 bioregions hereafter lsquoecosystemsrsquo based on theInterim Biogeographic Regionalization of Australia (IBRA bioregions [33] v 61) at a spatial resolutionof approximately 10 km2 These ecosystems were derived by compiling geographical information oncontinental scale gradients and patterns in climate substrate landform vegetation and fauna and eachbioregion is considered a distinct ecologically and geographically defined area [35] The Commonwealthof Australia [2635] has set a target of at least 10 representation in each ecosystem in the protected areaestate for the NRS which is the ecosystem target adopted in this study
32 Threatened species data and targetsWe considered distributions of 1320 species from the total of 1737 species listed under the EnvironmentalProtection and Biodiversity Conservation Act We used maps of speciesrsquo distributions at a resolution ofapproximately 10 km2 developed for extant terrestrial and freshwater threatened species available inthe Species of National Environmental Significance database [36] We excluded 95 extinct species and367 species that are marine freshwater or migratory or whose distributions are only estimated with lowcertainty The species we considered hereafter referred to as lsquothreatened speciesrsquo are listed as CriticallyEndangered Endangered or Vulnerable [36] (note that the definitions of these categories as appliedwithin Australia differ slightly from those employed globally by the IUCN Red List and also that thereare species on the IUCN Red List that are not listed nationally and vice versa)
Following Watson et al [34] and building on a method developed by Rodrigues et al [13] and Kark etal [37] we set a series of adequacy targets for these 1320 threatened species based on geographical rangesize and level of endangerment This method develops area-based targets that scale with geographicalrange size requiring species with smaller ranges to be increasingly well protected [51338ndash40] A target ofcomplete coverage (ie 100 of remaining extent) by protected areas was set for those species consideredCritically Endangered and those species with a geographical range size of less than 1000 km2 Converselyfor those species with large range sizes (more than 10 000 km2) the target was set to cover 10 of currentrange For species with geographical ranges of intermediate size (between 1000 and 10 000 km2) thetarget was linearly interpolated between these two extremes with decreasing representation targets(smaller percentage of their range) set for species with larger range sizes (electronic supplementarymaterial figure S1)
on April 29 2015httprsosroyalsocietypublishingorgDownloaded from
4
rsosroyalsocietypublishingorgRSocopensci2150107
33 Spatial prioritization analysesWe determined the amount of each of the 85 ecosystems and 1307 threatened species already covered bythe current protected area estate by intersecting the ecosystem maps and threatened species distributionmaps with the map of the Australian protected area estate [41] (this includes IUCN managementcategories IndashVI) For both ecosystems and species we masked out distributions that occurred in clearedareas (ie are not potential for conservation) For some species the area of remaining available intacthabitat was smaller than their set target In such cases we reduced the target for these species torepresent 100 of remaining available intact habitat Thirteen of our 1320 species had none of theirdistribution within areas that were considered intact and available for conservation and were countedas gap species and their targets were set to zero This left 1307 species as our threatened speciestarget set
We created a planning unit layer of 10 times 10 km grid cells covering Australia which was the smallestresolution computationally feasible and approximately matches the scale of the maps of threatenedspecies [34] and ecosystems [42] We intersected the planning unit layer with the protected area layersuch that each existing protected area was a separate planning unit We determined the amount of eachspecies and ecosystem type in each planning unit based on their spatial overlap
We used the systematic conservation planning software MARXAN [43] to identify solutions for theexpansion of Australiarsquos protected area network to meet the above targets for ecosystems and threatenedspecies coverage MARXAN uses a simulated annealing algorithm to select multiple alternative setsof areas that meet pre-specified biodiversity targets while minimizing overall cost [43] It has beenused for identifying proposed conservation areas in Australia and throughout the world (eg [44ndash46])When investigating spatial options for expansion we locked in the current protected area estate andassumed that targets for all species and ecosystems were of equal importance to meet We set thecost of each planning unit as the total area potentially suitable for conservation within the planningunit ie we assumed that only areas of native vegetation would be suitable for inclusion in theprotected area estate and we used area is a universal surrogate for the costs of protected areamanagement [43]
We used MARXAN to identify 500 solutions for each of five scenarios (table 1) First we identifiedthe additional area required to protect all the ecosystem-based targets (by being added to the currentnetwork) and assessed how well the selected network covered the adequacy targets for the 1307threatened species (table 1 scenario 1) Next we determined the minimum amount of newly protectedland needed to meet the range-based targets for threatened species and assessed how well this solutionmet the representation targets set for ecosystems (table 1 scenario 2) In our third and fourth scenarios(table 1) we investigated how much additional land area would be required to be added to the networkformed in scenarios 1 and 2 to achieve all targets for both species and ecosystems ie achieving 100of all targets in a stepwise way Lastly for scenario five we established the minimum amount of landneeded to create a protected area network for both ecosystems and species targets when planningsimultaneously (table 1)
All five scenarios were evaluated by (i) the total number and percentage of targets that were fullymet and (ii) the average proportion of coverage for each set of targets (species and ecosystems) inthe top solution for each scenario (coverage was calculated per target and if more than 100 of atarget was met it was capped at 100 when averaging across all targets in the set) We comparedthe dissimilarity between scenarios (1ndash5) using Jaccard distances for both the added protected areasonly and the entire network including the existing protected areas (electronic supplementary materialtable S1)
We also investigated the sensitivity of our results to (i) the measure of cost we used (area) bycomparing with a cost based on forgone agricultural opportunities [47] and (ii) the possible impactof the reserve expansion being driven by current location of protected areas by testing a scenario whereprotected areas were not locked in First we re-ran scenarios 1ndash5 (table 1) with the cost of protecting aplanning unit based on its current agricultural profitability instead of its area (higher profitability valuesrepresent higher opportunity costs) We used a GIS agricultural profit map ($ haminus1) from Marinoni et al[47] to calculate a per planning unit annual profitability value in $ haminus1 and multiplied it by the areaof the planning unit potentially suitable for conservation and used this value as the planning unit costNegative values were rounded to zero and a transaction cost of $10 000 was added proportionally to theplanning size as the minimum land value [44] Second we re-ran the analysis without locking in existingprotected areas thus capturing a scenario where no fixed current protected areas network exists and allnon-cleared areas are available for conservation
on April 29 2015httprsosroyalsocietypublishingorgDownloaded from
5
rsosroyalsocietypublishingorgRSocopensci2150107
Table1Scenarioresultsareaofproposedprotectedareasandamountofspeciesandecosystemtargetsthatareadequatelyprotected
scenario3
scenario4
scenario5
scenario1
scenario2
achieving10
achievingthreatened
achievingboth
achieving10
achieving
ecosystemtargets
speciescoveragetargets
threatenedspeciesand
current
ecosystem
threatenedspecies
thenaddingspecies
thenadding10
ecosystemtargets
situation
targets
coveragetargets
targets
ecosystemtargets
simultaneously
landcoveredinprotectedareasinha(
ofAustralia)
89115
652(1159)
118629670(1543)
143988700(1873)
168574630(2193)
161689810(2103)
161191100(2096)
threatenedspeciescoverage
nospeciesadequately
protected(oftotalspecies)
284(215
)323(247
)1307(100
)1307(100
)1307(100
)1307(100
)
averageproportion
aofspeciestargetmet
478
522
999
999
999
999
ecosystemscoverage
noecosystemsw
ith10coverage
48(565)
85(100
)60(706
)85(100
)85(100
)85(100
)
averageproportion
aof10ecosystemscoverageachieved
726
100
851
100
100
100
a Som
efeatureshadmorethan100oftheirtargetmetbutfortheanalysisreportedinthis
tableweonlyalloweda
maximum
of100
coverage
on April 29 2015httprsosroyalsocietypublishingorgDownloaded from
6
rsosroyalsocietypublishingorgRSocopensci2150107
4 ResultsThere is a large degree of variation in the coverage of ecosystems (bioregions) and threatened speciesin the current protected area network (table 1) Forty-eight (565) ecosystems have achieved theirtarget of 10 protected however some ecosystems are poorly represented and on average ecosystemshave attained 726 of their target level of protection The protected area estate is performing worsefor threatened species with only 284 (215) threatened species reaching their range-based target Onaverage across all species 473 of the target area is covered in the current network (table 1)
We found that a minimum of 295 million hectares must be added to the existing protected areanetwork to achieve 10 representation of each ecosystem The solution with the sole target of achieving10 of each ecosystem in the smallest amount of area requires approximately 154 (table 1) of terrestrialAustralia to be in protected areas (figure 1a) One of the main reasons that the required national-levelcoverage is greater than the 10 target is because some ecosystems mostly arid ecosystems [48] havebeen protected to a level above 10 Another reason is that many planning units are selected to meettargets for ecosystems that only occur in a small portion of the unit Expansion aimed solely at increasingecosystem representation would incidentally increase the number of threatened species adequatelycaptured by 32 and increase the average proportion of adequacy targets met across all species from473 up to 522 (table 1)
Expanding the current protected area network to represent all threatened species adequately withoutconsidering ecosystem targets would require an additional 549 million hectares This equates to aprotected area system that is approximately 144 million hectares in size (or 187 of Australia table 1and figure 1b) In this scenario the number of ecosystems protected to a 10 level would increase from48 to 60
If the protected area network is expanded to meet ecosystems and threatened species targetssimultaneously an additional 72 million hectares would require protection (approx 210 of Australiarsquosland surface figure 1c and figure 2) Planning to meet these same goals sequentially starting withecosystems targets and then adding areas to meet threatened species targets would require 795 millionhectares (219 of the land table 1 and figure 2) to be added to the existing network which isapproximately 7 million hectares more than the most efficient scenario that integrated these targetsPlanning sequentially starting with threatened species targets and then adding areas to achieve the10 ecosystems representation target will require a similar amount of land as planning simultaneously(table 1 and figure 2)
There are substantial differences in the spatial configuration of the protected areas network expansionbetween the five scenarios (electronic supplementary material table S1) The majority of the differencelies between scenarios 1 and 2 (selection for ecosystems or selection for species figure 1ab Jaccarddissimilarity distance of added protected areas dj = 0982) When planning for ecosystems only (figure 1a)we get a map of protected areas which are arranged relatively evenly throughout Australia as a resultof the nature of the ecosystems which are large non-overlapping spatial features When planning forthreatened species (figure 1b) the resulting network is concentrated around the coastline reflecting thefact that species distributions are usually small dynamic units affected by internal and external processesand reflect past land-use changes [49] Larger protected areas might be more effective in promotingpersistence for biodiversity and might be more robust to climate change [5051] However a species-based approach is likely to protect more areas that are threatened by habitat loss and valuable forrecreational use by society [52]
The same pattern of cost-effectiveness holds when using agricultural profits as the cost layer insteadof land area indicating that our analysis was robust to using either of these costs surrogates (electronicsupplementary material figure S2) Planning for ecosystems only marginally improves protection forthreatened species and filling the gaps to reach 100 of species targets delivered the most costly scenario(electronic supplementary material table S2) Planning for both targets simultaneously again proved themost cost-effective approach followed by sequentially planning first according to species targets andthen adding areas to achieve ecosystem targets (electronic supplementary material table S2)
When performing the same analyses but assuming that no current protected area network existsscenarios follow the same overall pattern with simultaneous planning (scenario 5) being the mostcost-effective closely followed by sequential planning starting with species (scenario 4) Againsequentially planning starting with ecosystems (scenario 3) was the least cost-effective option (electronicsupplementary material table S3) Planning according to ecosystems only (scenario 1) required less areathan the current protected area network but only protected 9 of the species while planning accordingto species achieved 60 of the ecosystems targets (electronic supplementary material table S3)
on April 29 2015httprsosroyalsocietypublishingorgDownloaded from
7
rsosroyalsocietypublishingorgRSocopensci2150107
(a) (b)
(c)
0 200 400 800 1200miles
1600
Figure 1 Spatial distribution of proposed protected areas and existing protected areas for each of the planning scenarios Grey areasrepresent the current protected areas black areas represent the proposed additional protected areas for each scenariorsquos best solution(a) Achieving 10 ecosystem targets (b) achieving threatened species coverage targets and (c) achieving both threatened species andecosystem targets simultaneously
00
5
10
15
20pe
rcen
tage
of
targ
ets
met
(
)
perc
enta
ge o
f Aus
tral
iarsquos
land
are
a (
)
20
40
60
80
100
achieving both sets of targetssimultaneously
achieving threatened speciestargets then ecosystem targets
achieving ecosystem targetsthen species targets
Figure 2 Comparing the efficiency of the two stepwise scenarios and the simultaneous scenario (scenarios 3ndash5) from the existingprotected areas network (dark grey) to the first step of protected areas selection (mid-grey) to the second step (light grey) of fillingthe gaps for the opposite target-type (ecosystem or species) The plain bars (left y-axis) show the increase in land area (as of Australiarsquosland area) The diagonally striped bars represent percentage of species targets met (right y-axis) The horizontally striped bars representpercentage of ecosystem-based targets met (right y-axis)
on April 29 2015httprsosroyalsocietypublishingorgDownloaded from
8
rsosroyalsocietypublishingorgRSocopensci2150107
5 DiscussionIf implemented by signatory nations the CBD 2010 strategic plan will lead to the largest increase inglobal protected area establishment in history [78] Importantly national protected area plans adoptedby governments often follow the global CBD guidelines which have explicitly promoted an ecosystem-based approach to achieve the expansion [1653] We tested whether an ecosystem-based approach byitself would be effective in adequately conserving threatened species using Australia as a case studyWe found that prioritizing future protected areas based on representing the 85 major ecosystems is likelyto fall well short of capturing adequate amounts of many (approx 75) threatened speciesrsquo ranges
We found that planning for the expansion of protected area networks to meet targets for ecosystemsand species at the same time will achieve both sets of targets with fewer resources and less land Thisresult contrasts with the stepwise coarsefine filter approach which we show is likely to be a less efficientway to achieve targets for both species and ecosystems together Our results concur with other analyseswhich show that if the goal is to protect species and ecosystems a dual approach is most effective [212249] Simultaneous planning is most efficient because the planning units that collectively meet both goalsmost efficiently can be identified avoiding the selection of planning units that become redundant once asecondary goal is added
The efficiencies gained by simultaneous planning on a continent the size of Australia are modestbut could become enormous once multiplied up to a global scale Assuming the same patterns holdthe efficiencies gained by planning for threatened species and ecosystems together across the worldwould equal an area the size of a third of all EU countries Our results have significant implicationsfor how nations should interpret the CBD strategic plan Implementation of the ecosystem-based targetsalone is likely to mean future protected areas will not be optimal to meet each countryrsquos commitment toprotecting threatened species nor the overall aim of the CBD Considering the biodiversity crisis mostnations currently face [54] and the limited amount available for conservation [55] future acquisitions ofprotected areas need to be efficient in achieving ecosystem and threatened species representation
The disparity between protected area network expansion for threatened species targets versusecosystem-based targets is due to the differences in the spatial resolution of the two types of featuresEcosystems are large and non-overlapping permitting flexibility in which planning units are selectedfor conservation and promoting a spatially even spread of protected areas Alternatively speciesdistributions are often smaller can overlap are spatially aggregated and reflect land-use history [4952]As such the areas still available to these species are spatially skewed and usually small compared withthe large and widely distributed ecosystems [4956] While many nations do not have extensive spatialdata on their threatened species the IUCN Red List assessments make this freely available when it doesexist [57]
We do not attempt to present a future plan for Australiarsquos protected area network which would entailthe inclusion of further social economic and biological considerations We assume all areas are availablefor protected area expansion but in reality factors such as opportunities for landholder engagementpublic accessibility and feasibility would impact on this availability [395859] Further while a well-managed well-placed protected area network provides a key component required to facilitate thepersistence and recovery of threatened species [5260ndash62] many threatened species require a moreintensive management programme than gazetting of protected areas alone [6364] The full costs ofprotecting and managing areas include the opportunity costs of not developing a site direct costs suchas infrastructure maintenance and salaries and the costs of planning and implementing managementprogrammes [6566]
Additional ecological considerations required in a real-world protected area expansion task alsoinclude the consideration of species distributions under climate change minimum protected area sizeand connectivity and corridors which may be important for improving the likelihood that species willpersist in reserves over the long term Future research will need to consider the dynamic nature of threatssuch as land-use change and climate change presenting a need to assess both species and ecosystemrange shift to these changes Moreover given the role of biodiversity-driven ecosystem services suchas pollination pest control and recreation [67] it may be important for real-world planning to considerecosystem services Data and targets for threatened species ecosystems and protected areas are regularlyupdated but the minor changes that have recently occurred are not likely to affect the conclusions of ouranalyses [366869]
We found that expanding the protected area network to meet the targets used in this study wouldresult in forfeiting (or shifting the locations for generating) almost 5 billion dollars in annual potentialagricultural profit Due to the simplifications we made in our analysis it is likely that a real-world
on April 29 2015httprsosroyalsocietypublishingorgDownloaded from
9
rsosroyalsocietypublishingorgRSocopensci2150107
comprehensive protected area network in Australia would require a larger total area being needed tomeet ecosystem and species targets as the most lsquoefficientrsquo options may not be available nor sufficient toensure species persistence We also note that protected areas can provide alternative sources of incomeby creating jobs helping to develop rural areas and tourism revenues and providing benefits for humanhealth and wellbeing while helping to protect the intrinsic values of nature [70] Regardless of the costand size of the resultant protected area estate an efficiency approach such as the one we present servesto minimize the costs of providing these benefits to society
Biodiversity loss is a global problem However the expansion of protected area networks is typicallyplanned at a national level In countries such as Australia where ecosystem and species databasesexist planning for both ecosystems and species can occur simultaneously to deliver the most efficientsolutions Countries with protected area expansion plans inspired by interpretations of the CBDguidelines [171826] need to consider the best available data on both species and ecosystems if bothare to be efficiently protected
Data accessibility The databases supporting our study are freely available on the web and the appropriate references arecitedAcknowledgements We thank Matthew Watts for his advice and assistance in analysing the data Dr Joseph Bennettand two anonymous reviewers for their valuable comments on the manuscript We acknowledge the support ofthe Australian Governmentrsquos National Environmental Research Program the Australian Research Council Centreof Excellence for Environmental Decisions and the University of QueenslandFunding statement The work was funded by the Australian Governmentrsquos National Environmental Research Program(TP701709) and the Australian Research Council Centre of Excellence for Environmental Decisions (CE110001014)HPP was supported by an Australian Research Council Laureate Fellowship (FL130100090) Australian ResearchCouncil discovery grant (DP140100733) for JEMW and Australian Research Council DECRA fellowship(DE140101624) for VOAuthor contributions All authors contribute to the conceptual idea behind the paper JC and RAF prepared the data TPand JC designed the analyses TP analysed the data TP JC and JEMW wrote the paper All authors commentedon the manuscript and gave final approval for publicationConflict of interests We have no competing interests
References1 Rodrigues AS Brooks TM 2007 Shortcuts for
biodiversity conservation planning theeffectiveness of surrogates Annu Rev Ecol EvolSyst 38 713ndash737 (doi101146annurevecolsys38091206095737)
2 Margules CR Pressey RL 2000 Systematicconservation planning Nature 405 243ndash253(doi10103835012251)
3 Boyd C et al 2008 Spatial scale and the conservationof threatened species Conserv Lett 1 37ndash43 (doi101111j1755-263X200800002x)
4 Jenkins CN Joppa L 2009 Expansion of the globalterrestrial protected area system Biol Conserv 1422166ndash2174 (doi101016jbiocon200904016)
5 Rodrigues ASL et al 2004 Effectiveness of the globalprotected area network in representing speciesdiversity Nature 428 640ndash643 (doi101038nature02422)
6 Dietz RW Czech B 2005 Conservation deficits forthe continental United States an ecosystem gapanalysis Conserv Biol 19 1478ndash1487 (doi101111j1523-1739200500114x)
7 Watson JEM Dudley N Segan DB Hockings M 2014The performance and potential of protected areasNature 515 67ndash73 (doi101038nature13947)
8 Venter O et al 2014 Targeting global protected areaexpansion for imperiled biodiversity PLoS Biol 12e1001891 (doi101371journalpbio1001891)
9 Cantuacute-Salazar L Orme CDL Rasmussen PCBlackburn TM Gaston KJ 2013 The performance ofthe global protected area system in capturingvertebrate geographic ranges Biodivers Conserv
22 1033ndash1047 (doi101007s10531-013-0467-7)
10 Barr LM Pressey RL Fuller RA Segan DBMcDonald-Madden E Possingham HP 2011 A newway to measure the worldrsquos protected areacoverage PLoS ONE 6 e24707 (doi101371journalpone0024707)
11 Joppa LN Pfaff A 2009 High and far biases in thelocation of protected areas PLoS ONE 4 e8273(doi101371journalpone0008273)
12 Moilanen A Wilson KA Possingham HP 2009Spatial conservation prioritization quantitativemethods and computational tools Oxford UKOxford University Press
13 Rodrigues ASL et al 2004 Global gap analysispriority regions for expanding the globalprotected-area network Bioscience 54 1092ndash1100(doi1016410006-3568(2004)054[1092ggaprf]20co2)
14 Chape S Harrison J Spalding M Lysenko I 2005Measuring the extent and effectiveness ofprotected areas as an indicator for meeting globalbiodiversity targets Phil Trans R Soc B 360443ndash455 (doi101098rstb20041592)
15 Margules CR Pressey R Williams P 2002Representing biodiversity data and procedures foridentifying priority areas for conservation J Biosci27 309ndash326 (doi101007BF02704962)
16 CBS Secretariat 2010 Report of the tenth meeting ofthe conference of the parties of the convention onbiological diversity In The tenth meeting of theConference of the Parties to the Convention on
Biological Diversity Nagoya Japan NEPCBDCOP1027 See httpswwwcbdintcop10doc
17 Silva M 2005 The Brazilian protected areasprogram Conserv Biol 19 608ndash611 (doi101111j1523-1739200500707x)
18 Government of South Africa 2010 National protectedarea expansion strategy for South Africa 2008Priorities for expanding the protected area networkfor ecological sustainability and climate changeadaptation Pretoria South Africa the Governmentof South Africa
19 Hoekstra JM Boucher TM Ricketts TH Roberts C2005 Confronting a biome crisis global disparitiesof habitat loss and protection Ecol Lett 8 23ndash29(doi101111j1461-0248200400686x)
20 Brooks TM Da Fonseca GA Rodrigues AS 2004Protected areas and species Conserv Biol18 616ndash618 (doi101111j1523-1739200401836x)
21 Ferrier S 2002 Mapping spatial pattern inbiodiversity for regional conservation planningwhere to from here Syst Biol 51 331ndash363 (doi10108010635150252899806)
22 Lombard AT Cowling RM Pressey RL Rebelo AG2003 Effectiveness of land classes as surrogates forspecies in conservation planning for the CapeFloristic Region Biol Conserv 112 45ndash62 (doi101016S0006-3207(02)00422-6)
23 Neel MC Cummings MP 2003 Genetic consequencesof ecological reserve design guidelines anempirical investigation Conserv Genet 4 427ndash439(doi101023a1024758929728)
on April 29 2015httprsosroyalsocietypublishingorgDownloaded from
10
rsosroyalsocietypublishingorgRSocopensci2150107
24 Arauacutejo MB Humphries CJ Densham PJ Lampinen
R Hagemeijer WJM Mitchell-Jones AJ Gasc JP 2001Would environmental diversity be a good surrogatefor species diversity Ecography 24 103ndash110 (doi101034j1600-05872001240112x)
25 Ferrier S Watson G 1997 An evaluation of theeffectiveness of environmental surrogates andmodelling techniques in predicting the distribution ofbiological diversity Canberra Australia Departmentof Environment Australian Government
26 Commonwealth of Australia 2009 Australiarsquosstrategy for the national reserve system 2009ndash2030Canberra Australia Australian Government
27 Noss RF 1987 From plant communities tolandscapes in conservation inventories a look atthe nature conservancy (USA) Biol Conserv41 11ndash37 (doi1010160006-3207(87)90045-0)
28 TNC 1982 Natural heritage program operationsmanual Arlington VA The Nature Conservancy
29 Alberta Parks Building the Parks System ScientificFramework Alberta Canada See httpwwwalbertaparkscaalbertaparkscamanagement-land-usebuilding-the-parks-systemscientific-frameworkaspx Accessed 10 September 2014
30 Carmel Y Stoller-Cavari L 2006 Comparingenvironmental and biological surrogates forbiodiversity at a local scale Israel J Ecol Evol 5211ndash27 (doi101560IJEE52111)
31 Neel MC Cummings MP 2003 Effectiveness ofconservation targets in capturing genetic diversityConserv Biol 17 219ndash229 (doi101046j1523-1739200301352x)
32 Watson J Fuller RA Barr L 2008 Why are we stillusing a lsquoone size fits allrsquo philosophy for systematicreserve planning in Australia Pac Conserv Biol 14233ndash235
33 SteffenW Burbidge AA Hughes L Kitching RLindenmayer D Musgrave W Stafford Smith MWerne PA 2009 Australiarsquos biodiversity and climatechange a strategic assessment of the vulnerability ofAustraliarsquos biodiversity to climate change CanberraAustralia CSIRO Publishing
34 Watson JE Evans MC Carwardine J Fuller RAJoseph LN Segan DB Taylor MF Fensham RPossingham HP 2011 The capacity of Australiarsquosprotected-area system to represent threatenedspecies Conserv Biol 25 324ndash332 (doi101111j1523-1739201001587x)
35 Natural Resource Management Ministerial Council2004 Directions for the National Reserve System apartnership approach Canberra AustraliaDepartment of the Environment and HeritageThe Australian Government
36 Commonwealth of Australia 2012 Species ofNational Environmental Significance database(SNES) Canberra Australia Department of theEnvironment the Australian Government Seehttpwwwenvironmentgovauscienceerindatabases-mapssnes
37 Kark S Levin N Grantham HS Possingham HP 2009Between-country collaboration and considerationof costs increase conservation planning efficiency inthe Mediterranean Basin Proc Natl Acad Sci USA106 15 368ndash15 373 (doi101073pnas0901001106)
38 Pressey RL Cowling RM Rouget M 2003Formulating conservation targets for biodiversitypattern and process in the Cape Floristic Region
South Africa Biol Conserv 112 99ndash127 (doi101016s0006-3207(02)00424-x)
39 Carwardine J Wilson KA Ceballos G Ehrlich PRNaidoo R Iwamura T Hajkowicz SA Possingham HP2008 Cost-effective priorities for globalmammal conservation Proc Natl Acad Sci USA105 11 446ndash11 450 (doi101073pnas0707157105)
40 Klein CJ Steinback C Watts M Scholz AJPossingham HP 2009 Spatial marine zoning forfisheries and conservation Front Ecol Environ 8349ndash353 (doi101890090047)
41 Commonwealth of Australia 2006 CollaborativeAustralian protected areas database (CAPAD)Canberra Australia Australian GovernmentDepartment of Sustainability Environment WaterPopulation and Communities
42 Fuller RA McDonald-Madden E Wilson KACarwardine J Grantham HS Watson JEM Klein CJGreen DC Possingham HP 2010 Replacingunderperforming protected areas achieves betterconservation outcomes Nature 466 365ndash367(doi101038nature09180)
43 Ball I Possingham H Watts M 2009 Marxan andrelatives software for spatial conservationprioritisation In Spatial conservation prioritisationquantitative methods and computational tools (eds AMoilanen KAWilson HP Possingham) pp 185ndash195Oxford UK Oxford University Press
44 Carwardine J Wilson KA Watts M Etter A Klein CJPossingham HP 2008 Avoiding costly conservationmistakes the importance of defining actions andcosts in spatial priority setting PLoS ONE 3 e2586(doi101371journalpone0002586)
45 Klein CJ Wilson KA Watts M Stein J Carwardine JMackey B Possingham HP 2009 Spatialconservation prioritization inclusive of wildernessquality a case study of Australiarsquos biodiversity BiolConserv 142 1282ndash1290 (doi101016jbiocon200901035)
46 Smith RJ et al 2008 Designing a transfrontierconservation landscape for the Maputaland centreof endemism using biodiversity economic andthreat data Biol Conserv 141 2127ndash2138 (doi101016jbiocon200806010)
47 Marinoni O Navarro Garcia J Marvanek SPrestwidge D Clifford D Laredo L 2012Development of a system to produce maps ofagricultural profit on a continental scale anexample for Australia Agric Syst 105 33ndash45 (doi101016jagsy201109002)
48 Pressey R 1994 Ad hoc reservations forward orbackward steps in developing representativereserve systems Conserv Biol 8 662ndash668 (doi101046j1523-1739199408030662x)
49 Kirkpatrick J Brown M 1994 A comparison of directand environmental domain approaches to planningreservation of forest higher plant communities andspecies in Tasmania Conserv Biol 8 217ndash224 (doi101046j1523-1739199408010217x)
50 Mackey BG Watson JE Hope G Gilmore S 2008Climate change biodiversity conservation and therole of protected areas an Australian perspectiveBiodiversity 9 11ndash18 (doi1010801488838620089712902)
51 Watson JEM Iwamura T Butt N 2013 Mappingvulnerability and conservation adaptationstrategies under climate change Nat Clim Change3 989ndash994 (doi101038nclimate2007)
52 Taylor MF Sattler PS Evans M Fuller RA Watson JEPossingham HP 2011 What works for threatenedspecies recovery An empirical evaluation forAustralia Biodivers Conserv 20 767ndash777 (doi101007s10531-010-9977-8)
53 Secretariat of the Convention on BiologicalDiversity 2004 Programme of work on protectedareas (CBD programmes of work) p31 MontrealCanada Secretariat of the Convention on BiologicalDiversity
54 Olson DM Dinerstein E Powell GV WikramanayakeED 2002 Conservation biology for the biodiversitycrisis Conserv Biol 16 1ndash3 (doi101046j1523-1739200201612x)
55 Sanderson EW Jaiteh M Levy MA Redford KHWannebo AV Woolmer G 2002 The HumanFootprint and the Last of the Wild the humanfootprint is a global map of human influence on theland surface which suggests that human beings arestewards of nature whether we like it or notBioscience 52 891ndash904 (doi1016410006-3568(2002)052[0891THFATL]20CO2)
56 Lawler JJ White D Sifneos JC Master LL 2003 Rarespecies and the use of indicator groups forconservation planning Conserv Biol 17 875ndash882(doi101046j1523-1739200301638x)
57 IUCN 2014 The IUCN Red List of Threatened Speciesv 20142 See httpwwwiucnredlistorg
58 Watson JE et al 2009 Wilderness and futureconservation priorities in Australia Divers Distrib15 1028ndash1036 (doi101111j1472-4642200900601x)
59 Knight AT Cowling RM Campbell BM 2006 Anoperational model for implementing conservationaction Conserv Biol 20 408ndash419 (doi101111j1523-1739200600305x)
60 Wilson KA Evans MC Di Marco M Green DC BoitaniL Possingham HP Chiozza F Rondinini C 2011Prioritizing conservation investments for mammalspecies globally Phil Trans R Soc B 3662670ndash2680 (doi101098rstb20110108)
61 Bruner AG Gullison RE Rice RE Da Fonseca GA 2001Effectiveness of parks in protecting tropicalbiodiversity Science 291 125ndash128 (doi101126science2915501125)
62 Kalamandeen M Gillson L 2007 Demythinglsquowildernessrsquo implications for protected areadesignation and management Biodivers Conserv16 165ndash182 (doi101007s10531-006-9122-x)
63 Leverington F Costa KL Pavese H Lisle A HockingsM 2010 A global analysis of protected areamanagement effectiveness Environ Manage 46685ndash698 (doi101007s00267-010-9564-5)
64 Woinarski JC et al 2011 The disappearing mammalfauna of northern Australia context cause andresponse Conserv Lett 4 192ndash201 (doi101111j1755-263X201100164x)
65 James AN Gaston KJ Balmford A 1999 Balancingthe Earthrsquos accounts Nature 401 323ndash324 (doi10103843774)
66 Bruner AG Gullison RE Balmford A 2004 Financialcosts and shortfalls of managing and expandingprotected-area systems in developing countriesBioscience 54 1119ndash1126 (doi1016410006-3568(2004)054[1119FCASOM]20CO2)
67 Ingram JC Redford KH Watson JE 2012 Applyingecosystem services approaches for biodiversityconservation benefits and challenges SAPIENSSurv Perspect Integr Environ Soc 5 1ndash10
on April 29 2015httprsosroyalsocietypublishingorgDownloaded from
11
rsosroyalsocietypublishingorgRSocopensci2150107
68 Commonwealth of Australia 2012 Collaborative
Australian protected areas database (CAPAD)Canberra Australia Department of EnvironmentAustralian Government
69 Commonwealth of Australia 2010 Australiarsquosbioregions (IBRA) Canberra Australia Departmentof Environment Australian Government
70 Balmford A et al 2002 Economic reasons forconserving wild nature Science 297 950ndash953 (doi101126science1073947)
on April 29 2015httprsosroyalsocietypublishingorgDownloaded from
- Summary
- Introduction
- Material and methods
-
- Ecosystem spatial data and targets
- Threatened species data and targets
- Spatial prioritization analyses
-
- Results
- Discussion
- References
-
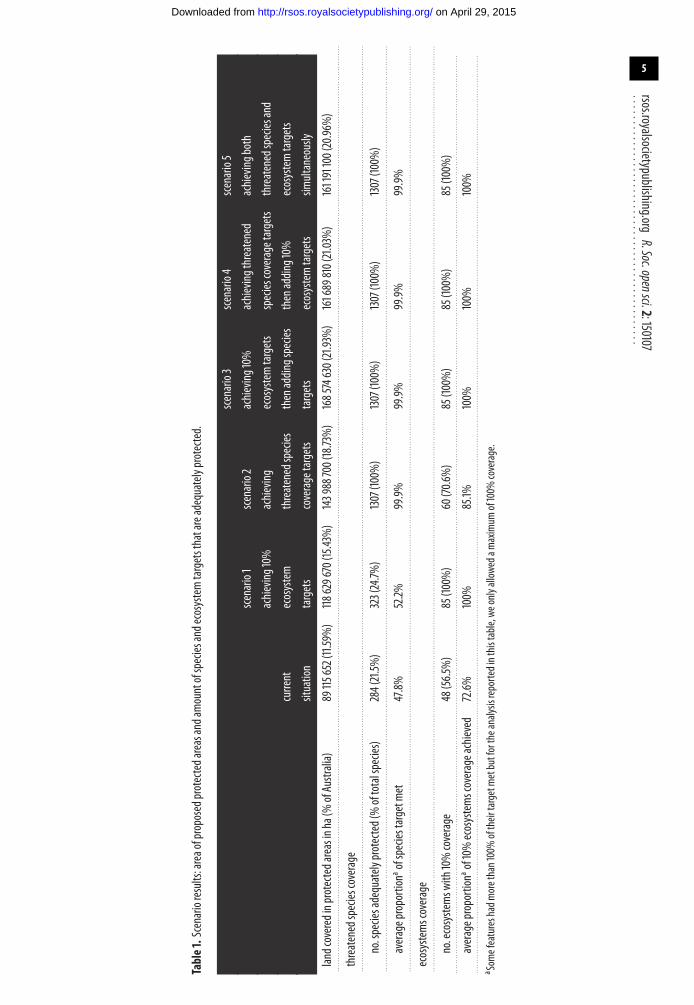
5
rsosroyalsocietypublishingorgRSocopensci2150107
Table1Scenarioresultsareaofproposedprotectedareasandamountofspeciesandecosystemtargetsthatareadequatelyprotected
scenario3
scenario4
scenario5
scenario1
scenario2
achieving10
achievingthreatened
achievingboth
achieving10
achieving
ecosystemtargets
speciescoveragetargets
threatenedspeciesand
current
ecosystem
threatenedspecies
thenaddingspecies
thenadding10
ecosystemtargets
situation
targets
coveragetargets
targets
ecosystemtargets
simultaneously
landcoveredinprotectedareasinha(
ofAustralia)
89115
652(1159)
118629670(1543)
143988700(1873)
168574630(2193)
161689810(2103)
161191100(2096)
threatenedspeciescoverage
nospeciesadequately
protected(oftotalspecies)
284(215
)323(247
)1307(100
)1307(100
)1307(100
)1307(100
)
averageproportion
aofspeciestargetmet
478
522
999
999
999
999
ecosystemscoverage
noecosystemsw
ith10coverage
48(565)
85(100
)60(706
)85(100
)85(100
)85(100
)
averageproportion
aof10ecosystemscoverageachieved
726
100
851
100
100
100
a Som
efeatureshadmorethan100oftheirtargetmetbutfortheanalysisreportedinthis
tableweonlyalloweda
maximum
of100
coverage
on April 29 2015httprsosroyalsocietypublishingorgDownloaded from
6
rsosroyalsocietypublishingorgRSocopensci2150107
4 ResultsThere is a large degree of variation in the coverage of ecosystems (bioregions) and threatened speciesin the current protected area network (table 1) Forty-eight (565) ecosystems have achieved theirtarget of 10 protected however some ecosystems are poorly represented and on average ecosystemshave attained 726 of their target level of protection The protected area estate is performing worsefor threatened species with only 284 (215) threatened species reaching their range-based target Onaverage across all species 473 of the target area is covered in the current network (table 1)
We found that a minimum of 295 million hectares must be added to the existing protected areanetwork to achieve 10 representation of each ecosystem The solution with the sole target of achieving10 of each ecosystem in the smallest amount of area requires approximately 154 (table 1) of terrestrialAustralia to be in protected areas (figure 1a) One of the main reasons that the required national-levelcoverage is greater than the 10 target is because some ecosystems mostly arid ecosystems [48] havebeen protected to a level above 10 Another reason is that many planning units are selected to meettargets for ecosystems that only occur in a small portion of the unit Expansion aimed solely at increasingecosystem representation would incidentally increase the number of threatened species adequatelycaptured by 32 and increase the average proportion of adequacy targets met across all species from473 up to 522 (table 1)
Expanding the current protected area network to represent all threatened species adequately withoutconsidering ecosystem targets would require an additional 549 million hectares This equates to aprotected area system that is approximately 144 million hectares in size (or 187 of Australia table 1and figure 1b) In this scenario the number of ecosystems protected to a 10 level would increase from48 to 60
If the protected area network is expanded to meet ecosystems and threatened species targetssimultaneously an additional 72 million hectares would require protection (approx 210 of Australiarsquosland surface figure 1c and figure 2) Planning to meet these same goals sequentially starting withecosystems targets and then adding areas to meet threatened species targets would require 795 millionhectares (219 of the land table 1 and figure 2) to be added to the existing network which isapproximately 7 million hectares more than the most efficient scenario that integrated these targetsPlanning sequentially starting with threatened species targets and then adding areas to achieve the10 ecosystems representation target will require a similar amount of land as planning simultaneously(table 1 and figure 2)
There are substantial differences in the spatial configuration of the protected areas network expansionbetween the five scenarios (electronic supplementary material table S1) The majority of the differencelies between scenarios 1 and 2 (selection for ecosystems or selection for species figure 1ab Jaccarddissimilarity distance of added protected areas dj = 0982) When planning for ecosystems only (figure 1a)we get a map of protected areas which are arranged relatively evenly throughout Australia as a resultof the nature of the ecosystems which are large non-overlapping spatial features When planning forthreatened species (figure 1b) the resulting network is concentrated around the coastline reflecting thefact that species distributions are usually small dynamic units affected by internal and external processesand reflect past land-use changes [49] Larger protected areas might be more effective in promotingpersistence for biodiversity and might be more robust to climate change [5051] However a species-based approach is likely to protect more areas that are threatened by habitat loss and valuable forrecreational use by society [52]
The same pattern of cost-effectiveness holds when using agricultural profits as the cost layer insteadof land area indicating that our analysis was robust to using either of these costs surrogates (electronicsupplementary material figure S2) Planning for ecosystems only marginally improves protection forthreatened species and filling the gaps to reach 100 of species targets delivered the most costly scenario(electronic supplementary material table S2) Planning for both targets simultaneously again proved themost cost-effective approach followed by sequentially planning first according to species targets andthen adding areas to achieve ecosystem targets (electronic supplementary material table S2)
When performing the same analyses but assuming that no current protected area network existsscenarios follow the same overall pattern with simultaneous planning (scenario 5) being the mostcost-effective closely followed by sequential planning starting with species (scenario 4) Againsequentially planning starting with ecosystems (scenario 3) was the least cost-effective option (electronicsupplementary material table S3) Planning according to ecosystems only (scenario 1) required less areathan the current protected area network but only protected 9 of the species while planning accordingto species achieved 60 of the ecosystems targets (electronic supplementary material table S3)
on April 29 2015httprsosroyalsocietypublishingorgDownloaded from
7
rsosroyalsocietypublishingorgRSocopensci2150107
(a) (b)
(c)
0 200 400 800 1200miles
1600
Figure 1 Spatial distribution of proposed protected areas and existing protected areas for each of the planning scenarios Grey areasrepresent the current protected areas black areas represent the proposed additional protected areas for each scenariorsquos best solution(a) Achieving 10 ecosystem targets (b) achieving threatened species coverage targets and (c) achieving both threatened species andecosystem targets simultaneously
00
5
10
15
20pe
rcen
tage
of
targ
ets
met
(
)
perc
enta
ge o
f Aus
tral
iarsquos
land
are
a (
)
20
40
60
80
100
achieving both sets of targetssimultaneously
achieving threatened speciestargets then ecosystem targets
achieving ecosystem targetsthen species targets
Figure 2 Comparing the efficiency of the two stepwise scenarios and the simultaneous scenario (scenarios 3ndash5) from the existingprotected areas network (dark grey) to the first step of protected areas selection (mid-grey) to the second step (light grey) of fillingthe gaps for the opposite target-type (ecosystem or species) The plain bars (left y-axis) show the increase in land area (as of Australiarsquosland area) The diagonally striped bars represent percentage of species targets met (right y-axis) The horizontally striped bars representpercentage of ecosystem-based targets met (right y-axis)
on April 29 2015httprsosroyalsocietypublishingorgDownloaded from
8
rsosroyalsocietypublishingorgRSocopensci2150107
5 DiscussionIf implemented by signatory nations the CBD 2010 strategic plan will lead to the largest increase inglobal protected area establishment in history [78] Importantly national protected area plans adoptedby governments often follow the global CBD guidelines which have explicitly promoted an ecosystem-based approach to achieve the expansion [1653] We tested whether an ecosystem-based approach byitself would be effective in adequately conserving threatened species using Australia as a case studyWe found that prioritizing future protected areas based on representing the 85 major ecosystems is likelyto fall well short of capturing adequate amounts of many (approx 75) threatened speciesrsquo ranges
We found that planning for the expansion of protected area networks to meet targets for ecosystemsand species at the same time will achieve both sets of targets with fewer resources and less land Thisresult contrasts with the stepwise coarsefine filter approach which we show is likely to be a less efficientway to achieve targets for both species and ecosystems together Our results concur with other analyseswhich show that if the goal is to protect species and ecosystems a dual approach is most effective [212249] Simultaneous planning is most efficient because the planning units that collectively meet both goalsmost efficiently can be identified avoiding the selection of planning units that become redundant once asecondary goal is added
The efficiencies gained by simultaneous planning on a continent the size of Australia are modestbut could become enormous once multiplied up to a global scale Assuming the same patterns holdthe efficiencies gained by planning for threatened species and ecosystems together across the worldwould equal an area the size of a third of all EU countries Our results have significant implicationsfor how nations should interpret the CBD strategic plan Implementation of the ecosystem-based targetsalone is likely to mean future protected areas will not be optimal to meet each countryrsquos commitment toprotecting threatened species nor the overall aim of the CBD Considering the biodiversity crisis mostnations currently face [54] and the limited amount available for conservation [55] future acquisitions ofprotected areas need to be efficient in achieving ecosystem and threatened species representation
The disparity between protected area network expansion for threatened species targets versusecosystem-based targets is due to the differences in the spatial resolution of the two types of featuresEcosystems are large and non-overlapping permitting flexibility in which planning units are selectedfor conservation and promoting a spatially even spread of protected areas Alternatively speciesdistributions are often smaller can overlap are spatially aggregated and reflect land-use history [4952]As such the areas still available to these species are spatially skewed and usually small compared withthe large and widely distributed ecosystems [4956] While many nations do not have extensive spatialdata on their threatened species the IUCN Red List assessments make this freely available when it doesexist [57]
We do not attempt to present a future plan for Australiarsquos protected area network which would entailthe inclusion of further social economic and biological considerations We assume all areas are availablefor protected area expansion but in reality factors such as opportunities for landholder engagementpublic accessibility and feasibility would impact on this availability [395859] Further while a well-managed well-placed protected area network provides a key component required to facilitate thepersistence and recovery of threatened species [5260ndash62] many threatened species require a moreintensive management programme than gazetting of protected areas alone [6364] The full costs ofprotecting and managing areas include the opportunity costs of not developing a site direct costs suchas infrastructure maintenance and salaries and the costs of planning and implementing managementprogrammes [6566]
Additional ecological considerations required in a real-world protected area expansion task alsoinclude the consideration of species distributions under climate change minimum protected area sizeand connectivity and corridors which may be important for improving the likelihood that species willpersist in reserves over the long term Future research will need to consider the dynamic nature of threatssuch as land-use change and climate change presenting a need to assess both species and ecosystemrange shift to these changes Moreover given the role of biodiversity-driven ecosystem services suchas pollination pest control and recreation [67] it may be important for real-world planning to considerecosystem services Data and targets for threatened species ecosystems and protected areas are regularlyupdated but the minor changes that have recently occurred are not likely to affect the conclusions of ouranalyses [366869]
We found that expanding the protected area network to meet the targets used in this study wouldresult in forfeiting (or shifting the locations for generating) almost 5 billion dollars in annual potentialagricultural profit Due to the simplifications we made in our analysis it is likely that a real-world
on April 29 2015httprsosroyalsocietypublishingorgDownloaded from
9
rsosroyalsocietypublishingorgRSocopensci2150107
comprehensive protected area network in Australia would require a larger total area being needed tomeet ecosystem and species targets as the most lsquoefficientrsquo options may not be available nor sufficient toensure species persistence We also note that protected areas can provide alternative sources of incomeby creating jobs helping to develop rural areas and tourism revenues and providing benefits for humanhealth and wellbeing while helping to protect the intrinsic values of nature [70] Regardless of the costand size of the resultant protected area estate an efficiency approach such as the one we present servesto minimize the costs of providing these benefits to society
Biodiversity loss is a global problem However the expansion of protected area networks is typicallyplanned at a national level In countries such as Australia where ecosystem and species databasesexist planning for both ecosystems and species can occur simultaneously to deliver the most efficientsolutions Countries with protected area expansion plans inspired by interpretations of the CBDguidelines [171826] need to consider the best available data on both species and ecosystems if bothare to be efficiently protected
Data accessibility The databases supporting our study are freely available on the web and the appropriate references arecitedAcknowledgements We thank Matthew Watts for his advice and assistance in analysing the data Dr Joseph Bennettand two anonymous reviewers for their valuable comments on the manuscript We acknowledge the support ofthe Australian Governmentrsquos National Environmental Research Program the Australian Research Council Centreof Excellence for Environmental Decisions and the University of QueenslandFunding statement The work was funded by the Australian Governmentrsquos National Environmental Research Program(TP701709) and the Australian Research Council Centre of Excellence for Environmental Decisions (CE110001014)HPP was supported by an Australian Research Council Laureate Fellowship (FL130100090) Australian ResearchCouncil discovery grant (DP140100733) for JEMW and Australian Research Council DECRA fellowship(DE140101624) for VOAuthor contributions All authors contribute to the conceptual idea behind the paper JC and RAF prepared the data TPand JC designed the analyses TP analysed the data TP JC and JEMW wrote the paper All authors commentedon the manuscript and gave final approval for publicationConflict of interests We have no competing interests
References1 Rodrigues AS Brooks TM 2007 Shortcuts for
biodiversity conservation planning theeffectiveness of surrogates Annu Rev Ecol EvolSyst 38 713ndash737 (doi101146annurevecolsys38091206095737)
2 Margules CR Pressey RL 2000 Systematicconservation planning Nature 405 243ndash253(doi10103835012251)
3 Boyd C et al 2008 Spatial scale and the conservationof threatened species Conserv Lett 1 37ndash43 (doi101111j1755-263X200800002x)
4 Jenkins CN Joppa L 2009 Expansion of the globalterrestrial protected area system Biol Conserv 1422166ndash2174 (doi101016jbiocon200904016)
5 Rodrigues ASL et al 2004 Effectiveness of the globalprotected area network in representing speciesdiversity Nature 428 640ndash643 (doi101038nature02422)
6 Dietz RW Czech B 2005 Conservation deficits forthe continental United States an ecosystem gapanalysis Conserv Biol 19 1478ndash1487 (doi101111j1523-1739200500114x)
7 Watson JEM Dudley N Segan DB Hockings M 2014The performance and potential of protected areasNature 515 67ndash73 (doi101038nature13947)
8 Venter O et al 2014 Targeting global protected areaexpansion for imperiled biodiversity PLoS Biol 12e1001891 (doi101371journalpbio1001891)
9 Cantuacute-Salazar L Orme CDL Rasmussen PCBlackburn TM Gaston KJ 2013 The performance ofthe global protected area system in capturingvertebrate geographic ranges Biodivers Conserv
22 1033ndash1047 (doi101007s10531-013-0467-7)
10 Barr LM Pressey RL Fuller RA Segan DBMcDonald-Madden E Possingham HP 2011 A newway to measure the worldrsquos protected areacoverage PLoS ONE 6 e24707 (doi101371journalpone0024707)
11 Joppa LN Pfaff A 2009 High and far biases in thelocation of protected areas PLoS ONE 4 e8273(doi101371journalpone0008273)
12 Moilanen A Wilson KA Possingham HP 2009Spatial conservation prioritization quantitativemethods and computational tools Oxford UKOxford University Press
13 Rodrigues ASL et al 2004 Global gap analysispriority regions for expanding the globalprotected-area network Bioscience 54 1092ndash1100(doi1016410006-3568(2004)054[1092ggaprf]20co2)
14 Chape S Harrison J Spalding M Lysenko I 2005Measuring the extent and effectiveness ofprotected areas as an indicator for meeting globalbiodiversity targets Phil Trans R Soc B 360443ndash455 (doi101098rstb20041592)
15 Margules CR Pressey R Williams P 2002Representing biodiversity data and procedures foridentifying priority areas for conservation J Biosci27 309ndash326 (doi101007BF02704962)
16 CBS Secretariat 2010 Report of the tenth meeting ofthe conference of the parties of the convention onbiological diversity In The tenth meeting of theConference of the Parties to the Convention on
Biological Diversity Nagoya Japan NEPCBDCOP1027 See httpswwwcbdintcop10doc
17 Silva M 2005 The Brazilian protected areasprogram Conserv Biol 19 608ndash611 (doi101111j1523-1739200500707x)
18 Government of South Africa 2010 National protectedarea expansion strategy for South Africa 2008Priorities for expanding the protected area networkfor ecological sustainability and climate changeadaptation Pretoria South Africa the Governmentof South Africa
19 Hoekstra JM Boucher TM Ricketts TH Roberts C2005 Confronting a biome crisis global disparitiesof habitat loss and protection Ecol Lett 8 23ndash29(doi101111j1461-0248200400686x)
20 Brooks TM Da Fonseca GA Rodrigues AS 2004Protected areas and species Conserv Biol18 616ndash618 (doi101111j1523-1739200401836x)
21 Ferrier S 2002 Mapping spatial pattern inbiodiversity for regional conservation planningwhere to from here Syst Biol 51 331ndash363 (doi10108010635150252899806)
22 Lombard AT Cowling RM Pressey RL Rebelo AG2003 Effectiveness of land classes as surrogates forspecies in conservation planning for the CapeFloristic Region Biol Conserv 112 45ndash62 (doi101016S0006-3207(02)00422-6)
23 Neel MC Cummings MP 2003 Genetic consequencesof ecological reserve design guidelines anempirical investigation Conserv Genet 4 427ndash439(doi101023a1024758929728)
on April 29 2015httprsosroyalsocietypublishingorgDownloaded from
10
rsosroyalsocietypublishingorgRSocopensci2150107
24 Arauacutejo MB Humphries CJ Densham PJ Lampinen
R Hagemeijer WJM Mitchell-Jones AJ Gasc JP 2001Would environmental diversity be a good surrogatefor species diversity Ecography 24 103ndash110 (doi101034j1600-05872001240112x)
25 Ferrier S Watson G 1997 An evaluation of theeffectiveness of environmental surrogates andmodelling techniques in predicting the distribution ofbiological diversity Canberra Australia Departmentof Environment Australian Government
26 Commonwealth of Australia 2009 Australiarsquosstrategy for the national reserve system 2009ndash2030Canberra Australia Australian Government
27 Noss RF 1987 From plant communities tolandscapes in conservation inventories a look atthe nature conservancy (USA) Biol Conserv41 11ndash37 (doi1010160006-3207(87)90045-0)
28 TNC 1982 Natural heritage program operationsmanual Arlington VA The Nature Conservancy
29 Alberta Parks Building the Parks System ScientificFramework Alberta Canada See httpwwwalbertaparkscaalbertaparkscamanagement-land-usebuilding-the-parks-systemscientific-frameworkaspx Accessed 10 September 2014
30 Carmel Y Stoller-Cavari L 2006 Comparingenvironmental and biological surrogates forbiodiversity at a local scale Israel J Ecol Evol 5211ndash27 (doi101560IJEE52111)
31 Neel MC Cummings MP 2003 Effectiveness ofconservation targets in capturing genetic diversityConserv Biol 17 219ndash229 (doi101046j1523-1739200301352x)
32 Watson J Fuller RA Barr L 2008 Why are we stillusing a lsquoone size fits allrsquo philosophy for systematicreserve planning in Australia Pac Conserv Biol 14233ndash235
33 SteffenW Burbidge AA Hughes L Kitching RLindenmayer D Musgrave W Stafford Smith MWerne PA 2009 Australiarsquos biodiversity and climatechange a strategic assessment of the vulnerability ofAustraliarsquos biodiversity to climate change CanberraAustralia CSIRO Publishing
34 Watson JE Evans MC Carwardine J Fuller RAJoseph LN Segan DB Taylor MF Fensham RPossingham HP 2011 The capacity of Australiarsquosprotected-area system to represent threatenedspecies Conserv Biol 25 324ndash332 (doi101111j1523-1739201001587x)
35 Natural Resource Management Ministerial Council2004 Directions for the National Reserve System apartnership approach Canberra AustraliaDepartment of the Environment and HeritageThe Australian Government
36 Commonwealth of Australia 2012 Species ofNational Environmental Significance database(SNES) Canberra Australia Department of theEnvironment the Australian Government Seehttpwwwenvironmentgovauscienceerindatabases-mapssnes
37 Kark S Levin N Grantham HS Possingham HP 2009Between-country collaboration and considerationof costs increase conservation planning efficiency inthe Mediterranean Basin Proc Natl Acad Sci USA106 15 368ndash15 373 (doi101073pnas0901001106)
38 Pressey RL Cowling RM Rouget M 2003Formulating conservation targets for biodiversitypattern and process in the Cape Floristic Region
South Africa Biol Conserv 112 99ndash127 (doi101016s0006-3207(02)00424-x)
39 Carwardine J Wilson KA Ceballos G Ehrlich PRNaidoo R Iwamura T Hajkowicz SA Possingham HP2008 Cost-effective priorities for globalmammal conservation Proc Natl Acad Sci USA105 11 446ndash11 450 (doi101073pnas0707157105)
40 Klein CJ Steinback C Watts M Scholz AJPossingham HP 2009 Spatial marine zoning forfisheries and conservation Front Ecol Environ 8349ndash353 (doi101890090047)
41 Commonwealth of Australia 2006 CollaborativeAustralian protected areas database (CAPAD)Canberra Australia Australian GovernmentDepartment of Sustainability Environment WaterPopulation and Communities
42 Fuller RA McDonald-Madden E Wilson KACarwardine J Grantham HS Watson JEM Klein CJGreen DC Possingham HP 2010 Replacingunderperforming protected areas achieves betterconservation outcomes Nature 466 365ndash367(doi101038nature09180)
43 Ball I Possingham H Watts M 2009 Marxan andrelatives software for spatial conservationprioritisation In Spatial conservation prioritisationquantitative methods and computational tools (eds AMoilanen KAWilson HP Possingham) pp 185ndash195Oxford UK Oxford University Press
44 Carwardine J Wilson KA Watts M Etter A Klein CJPossingham HP 2008 Avoiding costly conservationmistakes the importance of defining actions andcosts in spatial priority setting PLoS ONE 3 e2586(doi101371journalpone0002586)
45 Klein CJ Wilson KA Watts M Stein J Carwardine JMackey B Possingham HP 2009 Spatialconservation prioritization inclusive of wildernessquality a case study of Australiarsquos biodiversity BiolConserv 142 1282ndash1290 (doi101016jbiocon200901035)
46 Smith RJ et al 2008 Designing a transfrontierconservation landscape for the Maputaland centreof endemism using biodiversity economic andthreat data Biol Conserv 141 2127ndash2138 (doi101016jbiocon200806010)
47 Marinoni O Navarro Garcia J Marvanek SPrestwidge D Clifford D Laredo L 2012Development of a system to produce maps ofagricultural profit on a continental scale anexample for Australia Agric Syst 105 33ndash45 (doi101016jagsy201109002)
48 Pressey R 1994 Ad hoc reservations forward orbackward steps in developing representativereserve systems Conserv Biol 8 662ndash668 (doi101046j1523-1739199408030662x)
49 Kirkpatrick J Brown M 1994 A comparison of directand environmental domain approaches to planningreservation of forest higher plant communities andspecies in Tasmania Conserv Biol 8 217ndash224 (doi101046j1523-1739199408010217x)
50 Mackey BG Watson JE Hope G Gilmore S 2008Climate change biodiversity conservation and therole of protected areas an Australian perspectiveBiodiversity 9 11ndash18 (doi1010801488838620089712902)
51 Watson JEM Iwamura T Butt N 2013 Mappingvulnerability and conservation adaptationstrategies under climate change Nat Clim Change3 989ndash994 (doi101038nclimate2007)
52 Taylor MF Sattler PS Evans M Fuller RA Watson JEPossingham HP 2011 What works for threatenedspecies recovery An empirical evaluation forAustralia Biodivers Conserv 20 767ndash777 (doi101007s10531-010-9977-8)
53 Secretariat of the Convention on BiologicalDiversity 2004 Programme of work on protectedareas (CBD programmes of work) p31 MontrealCanada Secretariat of the Convention on BiologicalDiversity
54 Olson DM Dinerstein E Powell GV WikramanayakeED 2002 Conservation biology for the biodiversitycrisis Conserv Biol 16 1ndash3 (doi101046j1523-1739200201612x)
55 Sanderson EW Jaiteh M Levy MA Redford KHWannebo AV Woolmer G 2002 The HumanFootprint and the Last of the Wild the humanfootprint is a global map of human influence on theland surface which suggests that human beings arestewards of nature whether we like it or notBioscience 52 891ndash904 (doi1016410006-3568(2002)052[0891THFATL]20CO2)
56 Lawler JJ White D Sifneos JC Master LL 2003 Rarespecies and the use of indicator groups forconservation planning Conserv Biol 17 875ndash882(doi101046j1523-1739200301638x)
57 IUCN 2014 The IUCN Red List of Threatened Speciesv 20142 See httpwwwiucnredlistorg
58 Watson JE et al 2009 Wilderness and futureconservation priorities in Australia Divers Distrib15 1028ndash1036 (doi101111j1472-4642200900601x)
59 Knight AT Cowling RM Campbell BM 2006 Anoperational model for implementing conservationaction Conserv Biol 20 408ndash419 (doi101111j1523-1739200600305x)
60 Wilson KA Evans MC Di Marco M Green DC BoitaniL Possingham HP Chiozza F Rondinini C 2011Prioritizing conservation investments for mammalspecies globally Phil Trans R Soc B 3662670ndash2680 (doi101098rstb20110108)
61 Bruner AG Gullison RE Rice RE Da Fonseca GA 2001Effectiveness of parks in protecting tropicalbiodiversity Science 291 125ndash128 (doi101126science2915501125)
62 Kalamandeen M Gillson L 2007 Demythinglsquowildernessrsquo implications for protected areadesignation and management Biodivers Conserv16 165ndash182 (doi101007s10531-006-9122-x)
63 Leverington F Costa KL Pavese H Lisle A HockingsM 2010 A global analysis of protected areamanagement effectiveness Environ Manage 46685ndash698 (doi101007s00267-010-9564-5)
64 Woinarski JC et al 2011 The disappearing mammalfauna of northern Australia context cause andresponse Conserv Lett 4 192ndash201 (doi101111j1755-263X201100164x)
65 James AN Gaston KJ Balmford A 1999 Balancingthe Earthrsquos accounts Nature 401 323ndash324 (doi10103843774)
66 Bruner AG Gullison RE Balmford A 2004 Financialcosts and shortfalls of managing and expandingprotected-area systems in developing countriesBioscience 54 1119ndash1126 (doi1016410006-3568(2004)054[1119FCASOM]20CO2)
67 Ingram JC Redford KH Watson JE 2012 Applyingecosystem services approaches for biodiversityconservation benefits and challenges SAPIENSSurv Perspect Integr Environ Soc 5 1ndash10
on April 29 2015httprsosroyalsocietypublishingorgDownloaded from
11
rsosroyalsocietypublishingorgRSocopensci2150107
68 Commonwealth of Australia 2012 Collaborative
Australian protected areas database (CAPAD)Canberra Australia Department of EnvironmentAustralian Government
69 Commonwealth of Australia 2010 Australiarsquosbioregions (IBRA) Canberra Australia Departmentof Environment Australian Government
70 Balmford A et al 2002 Economic reasons forconserving wild nature Science 297 950ndash953 (doi101126science1073947)
on April 29 2015httprsosroyalsocietypublishingorgDownloaded from
- Summary
- Introduction
- Material and methods
-
- Ecosystem spatial data and targets
- Threatened species data and targets
- Spatial prioritization analyses
-
- Results
- Discussion
- References
-