The chemical composition of cork and phloem in the rhytidome of Quercus cerris bark

ACTA GEOLOGICA HISPANICA, v. 28 (1993), nq-3 , p. 119-129
Effects on rainfall gradient on tree water consumption and soil fertility on Quercus pyrenaica forests
in the Sierra de Gata (Spain)
Moreno, G.(l); Gallardo, J.F.(l); Ingelmo, F.(2)
(1) LR.N.A.IC.S.1.C. Apdo 257. Salamanca 37071 (España).
(2) LV.LA./Valencia. Apdo. 46113 Moncada, Valencia (España)
ABSTRACT
Calculation of water consumption and nutrient fluxes were made for four Quercus pyrenaica forests along a rainfall gradient, located in the "Sierra de Gata" mountains (CW Spain), to obtain information about the evolution of fertility in long tems.
It is concluded that the water content at the beginning of the acti- ve growth penod of the vegetation depends mainly of the soil charac- teristics; for that, there was a positive correlation between the annual evapotranspiration and the precipitation in the May-August penod, but not with annual precipitation. So, the greater abundance of rainfall in the wet season did not tend substantially to increase water consump- tion by the vegetation. On the other hand, there was a high correlation between the volume of annual rainwater and that of drained water; the excess of water in the soil produced on winter gives as result a nu- tnent leaching of the soil and a consequent l o s ~ of fertility. This was confirmed by the net balance of several bioelements, the CdA1 ratio and pH of the soil solution, and canopy leaching values.
Key words: water balance, nutrient balance, soil fertility, rainfail gradient, forest , ecosystem.
1. INTRODUCTION
Evapotranspiration is a relevant parameter in the un- derstanding of terrestrial ecosystems, especially in Me- diterranean areas, where water availability is scarce du- ring dry periods (Piñol et al. 1991). The soil behaves as a buffered system which receives water intermittently and releases it continually by evapotranspiration (Gar- nier et al. 1986). Thus, in climates with a Mediterranean
influence, a greater winter rainfall may positively affect soil moisture during the active period. Piñol et al. (1991) point out that annual evapotranspiration is positi- vely correlated to annual rainfall in the Mediterranean area. This possible variation in water availability may cause differences in both photosynthetic efficiency and light interception (Jarvis & Leverenz 1983, quoted in Tenhunen et al. 1990), as a consequence of a lesser li- mitation in transpiration.
However, the differences in the volume of rainfall affect the evolution and properties of the soil profile (Birke- land 1984). Low saturation of bases and greater weathe- ring of the original material is usually associated with humid regions (Quilchano 1993); this is due to the diffe- rences in the excess of water in the soil produced by the different pluviometry, giving nse to leaching processes of nutrients in the soil, with the resulting loss of fertility.
This double influence of rainfall on hydric and nutritio- nal availabilities appears to have positive and negative effects, respectively, on forest productivity. The first re- sults found in four Quercus pyrenaica forests, situated along a pluviometric gradient, indicate that neither pro- ductivity (Martín et al. 1993) nor the leaf area index (Gallego et al. 1994) respond to that gradient.
This study is part of a research project on the ecology of Quercus pyrenaica forests. Water fluxes have been con-

Figure 1. Localization map of the studied area.
5,: ~ a v a s f r r a s
S2:El Payo
s3 : Villasrubias PROVINCE OF CACERES S4 : Fuen teguinaldo
sidered as a major determinant of vegetation growth as well as a vector for nutrient transport to and across the ecosystem. In this study we have tried to establish water and several bioelements balances in four Quercus pyre- naica forests along a marked pluviometric gradient, in order to obtain information on the effect of rainfall amounts on annual and surnrner evapotranspiration, and on nutrient leaching from the soils, and their fertility. Results are also related to productivity of these forests.
b
2. METHODS
2 .l. The study area
This study was carried out in Quercus pyrenaica natural forests, classified as Quercus robori-pyrenaicae com- munities, located on the Northem face of the Sierra de Gata (40- 2' 40" N; 3- 0' 5 0 W, Salamanca Province, CW Spain; Figure 1). Quercus pyrenaica is a deciduous Mediterranean species, whose chorology corresponds to the southwestem region of Europe. The climate is hu- rnid Mediterranean, according to Emberger's climo-
gram, most of the rainfall being concentrated in the cold part of the year, and dryness coinciding with the warmer season and the growing penod. The soils are generally humic Carnbisols (Gallardo et al. 1980), over Paleozoic granites and slates.
Four experimental plots, situated close to one another (maximum 15 km), were selected along a pluviometric gradient. The major characteristics of the plots are sum- marized in Table 1.
2.2 Field sampling procedure
The devices used in each plot for collecting water to chemical analysis are:
a) Above the canopy or in a large forest gap close to the plot:
- Three aerodynamically shielded rain gauges ("open gauge") for collecting bulk precipitation (Bp);
- Three funnels surmounted by an inert wind filtering

1 Table 1. Specific characteristics of the plots.
1 Experimental Navasfrías El Payo Villasrubias Fuenteguinaldo plot (SI) (S21 (S3) (S4)
Altitude (m.a.s.1.) 1 O00 940 900 870 p, mm 1,580 1,245 872 720 tm -C 11.4 N.d. N.d. 13.3 Substrate Slates and Calc-alkaline Slates and Calc-alkaline
grauwackes granite grauwackes granite Dominant Q. pyrenaica+ Q. pyrenaica+ Q. pyrenaica+ Q. pyrenaica+ vegetation Ptendium+ grasses. scrubs+ ibundant
grasses. grasses. scrubs. T.d. (NJHa) 820 406 1043 738 M.t.h., m 13 17 8.5 12 D.B.H., cm 15.2 25.4 11.0 16.5 L.A.I. 1.8 1.9 2.0 2.6
P, mm: Mean annual precipitation; tm, -C: Mean annual temperature. T.d.: Tree density.
M.t.h.: Mean tree height The SI, S2, S3, and S4 notation in Table 1 follows D.B.H: Mean tree diameter at a height of 1.3 m. the decreasing order of precipitation and will be L.A.I.: Leaf area index. used hereafter in the text.
of polyethylene coated wire mesh ("filter gauges"), collecting bulk precipitation plus certain amount of dry deposition (Fg).
The 'filter gauge' enhaces the aerosol impaction, and the 'open gauge' minimizes this component in bulk pre- cipitation (Miller & Miller 1980).
b) Beneath the crees: - 12 standard rain gauges, randomly located, for co-
llecting throughfall (Tf); - 12 helicoidal gutters, around trunks, covering the ba-
sal area size ranges, for collecting stemflow (Sf).
c) On and in the soil: - Six non-bounded gerlach type collector troughs in
each plot (Sala, 1988) for measuring surface runoff (Sr).
- Soil solutions were collected using zero-tension lysi- meters; six installed 20 cm below the soil surface, to collect water draining from the humic horizon (SSr), and other six installed at 60-100 cm of depth, to co- llect water of deep drainage (D)
ping-bucket rain-gauges located above the crown in S1 and S4. Global shortwave radiation, air temperature, re- lative humidity and wind velocity were recorded as hourly means, using a data logger (Starlog 7000B Uni- data) also only in S1 and S4.
Soil water content was measured with a neutron moistu- re gauge (Troxler 3321 A 110 mC of AmericiumBen- lium) at 12 access tubes in each stand. Soil moisture was measured every 20 cm from 20 to 100 cm depth, as a maximum, according to the depth of the soil. On the surface, soil moisture was measured by gravirnetric met- hod. Measurements were taken approximately once a month (occasionally every two weeks) over forty months: from March 1990 until September 1993. The calibration curves were determined from gravimetric samples and dry bulk densities, according to Vachaud et al. (1977).
The physical and chemical soil characteristics were stu- died in three selected profiles of each plot. The results have been discussed in previous papers (e.g. Moreno et al. 1993 and Quilchano 1993).
The lysimeters were made from PVC, and the different type of rain gauges consisted of a polyethylene funnel. 3.3. Calculation of water balance Al1 devices were connected to a 5 1 collecting bottle. Different filters were used to prevent contamination of Taking as a basis the hourly record in S1 and S4, the water. daily distribution of rainfall on S2 and S3 was estima-
ted, once the high correlation existing between the dis- Water precipitation was recorded hourly with two tip- tribution of rainfall on the four sites was verified. The

records were also used to estimate the ,daily distribution of throughfall, taking into account the crown capacity for water retention (Zinke 1967). The Penman potential evapotranspiration was estimated following the recom- mendations of the FA0 (Smith 1991).
The water balance equation was used as a basis: dS/dt = Bp - EA - Sr - D; (1)
where S is the soil water storage, Bp the precipitation, EA the actual evapotranspiration, Sr the surface runoff, and D the deep drainage, i.e. the flow of water below the root zone (including almost al1 the roots). This nota- tion will be used hereafter. The precipitation, runoff and changes in soil water storage , e readily measurable, but both EA and D are difficult to measure or to calculate.
Hence a water balance model was used which employed a simplified relationship between the drainage compo- nent and soil water content, characterizing the down- flow of water across a certain level according to the wa- ter content existing above that level (this function is called the drainage characteristic; more detailed infor- mation in Rambal 1984 and Joffre & Rambal 1993).
The equation (1) is solved iteratively, for each period comprised between two readings of soil moisture, with a time step of one day (during periods of heavy precipita- tion, time step of one hour), i.e., starting at Sn and en- ding at Sn+l, fitting the term EA, the only unknown. The iterations continue until the measured and calcula- ted value of Sn+l coincide. It is always considered that EA 5 EP (potential evapotranspiration).
When it is not possible to obtain this equality (l), a term known as "others" is introduced. It is probably a combi- nation of EA, Sr and D. This is because in a rainy period EA can be greater than EP (Rutter 1975); moreover, even when the soil is not humid enough, deep drainage can exist, flowing through paths of rapid circulation, i. e. macropores (Beven & German 198 l), which is not in- cluded in the calculation model used.
3.4.Calculation of nutrient fluxes
The fluxes on a mass basis (kg ha-'), for each parameter, were calculated multiplying the average weighted con- centration (mg 1-') by amount of water (mm), either me- asured (aboveground parameters and surface runoff) or calculated (deep drainage).
The net forest water (i.e., deposition in throughfall + stemflow, minus bulk deposition) is regressed against the gain in the deposition resulting from the aerosol de- position on the "filter gauge7' (Bp - Pf). This regression results in an intercept term representing the mean value of canopy exchange (CE) for equal time periods (Lakha- ni & Miller 1980). Dry deposition (Dd) is calculated thus: Dd = Tf + Sf - Bp - CE, where Tf, Ef, Bp and CE are known. Total deposition (Tdep) from atmosphere is Bp + Dd. More detailed information can be found in Lakhani & Miller (1980) and Bellot (1988).
3.5. Laboratory analytical procedure
pH was measured with a pHmeter Beckman 3500, and dissolved organic carbon (D.O.C.) was measured on a T.O.C.A. (315A Beckrnan). These analyses were perfor- med as soon as possible after collection (within first day). Na and K were analyzed by flame emission; Ca and Mg by atomic absorption spectrometry; Fe, Mn and Al, by ICP; P were determined spectroscopically by molybdenum-blue method; C1-, N03-, S042- and NH4+, were analyzed by ion-chromatography. Complete analy- sis were generally done within about one week.
3.6. Statistical Analyses
Statistical analyses were performed by one-way analysis of variance with repeated measures, followed by a pos- teriori contrasts (Tukey-test) for multiple comparison of means, in order to detect variations between sites and between years. The results were expressed as equality probabilities (p). Simple regresion models were used to assess relationships between P and EA or D. The results were expressed as regression coefficients (r2) and level of significance (p).
Above ground, water fluxes were measured, on an event basis (64 cases), immediately after each rainfall event, over the period 21 September 1990 - 20 September 1993. In 23 events, water was collected for chemical analysis.

Table 2. Annual water balance of the four plots, in mm / year. % in relation to precipitation. The years refer to the period between 21/IX to 20/IX.
4 RESULTS AND DISCUSSION
Year
1990 -91
1991 -92
1992 -93
4.1. Water balance
Precipitation
Flows
Precipitation Interception
Surface Runoff Deep Drainage
Others Actual Evapotr.
Potential Evapotr.
Precipitation Interception
Surface Runoff Deep Drainage
Others Actual Evapotr.
Potential Evapotr.
Precipitation Interception
Surface Runoff Deep Drainage
Others Actual Evapotr.
Potential Evapotr.
Table 2 shows the annual rainfall values for the three years, which, from the point of view of pluviometry and comparing them with the mean annual values (see Table 1) can be defined as normal (1990-91), very dry (1991- 92) and moderately dry (1992-93). During the three stu- died years, the pluviometric gradient from which we started a priori was maintained; the differences between plots remained fairly constant during the three years, in relative terms (88, 78 and 59% of the rainfall in SI, for S2, S3 and S4, respectively). Annual precipitation diffe- red significantly, among al1 plots and among al1 years (ANOVA, p < 0.001 in both cases). Nevertheless, daily rainfall distnbution is similar in al1 the plots, with corre- lation coefficients around 90%. The seasonality of the rainfall and its acute irregularity are outstanding featu- res; in this sense, in the 1990-91 period, rainfall was very abundant during autumn-winter but no important precipitations were recorded after mid-March. On the
S1 S 1 S2 S2 S3 S3 S4 S4 mm % mm % mm % mm %
1306 1188 1045 782 144 11 95 8 112 11 76 1 O 2.1 0.2 1 O. 1 3 0.3 O 0.0 868 66 791 67 626 60 443 57 16 1.2 O 0.0 20 1.9 O 0.0
408 3 1 382 32 385 37 325 42 817 820 822 825
777 658 610 442 147 19 160 24 112 18 96 22 4 0.5 2 0.3 1 0.2 O 0.0
212 27 170 26 111 18 19 4 49 6.3 15 2.3 25 4.1 13 2.9 506 65 475 72 475 78 421 95 806 819 832 845
1086 953 820 650 163 15 131 14 127 15 125 19 6 0.6 1 O. 1 1 O. 1 O 0.0
404 37 373 39 239 29 106 16 54 5.0 18 1.9 20 2.4 8 1.2 525 48 506 53 536 65 509 78 753 763 773 783
other hand, over the following two years the rainfall, although less abundant, was distributed more regularly with important precipitation recorded until the begin- ning of June. Averaged across al1 plots and years, the in- tensity of the precipitation was generally moderate and it was never above 14 mm h-l. The intercepted water was 16% of the annual rainfall, and 14% during leafless period.
Evapotranspiration
EA only differs significantly among S4 - S1 plots (ANOVA, p < 0.05); S4 generally gives lower values, due to less precipitation and its smaller soil water stora- ge (Table 2). These differences are mitigated even more if we subtract from EA the intercepted water, of little value for the vegetation (Rutter 1975). Between years significant differences are, in fact, found (ANOVA, p = 0.001), but with the lowest during the year of highest precipitation. Pooling together al1 plots, anual Bp and EA are uncorrelated (r2 = 0.17, p < 0.05). The annual values of EA in relation to EP average 46% (range 39- 50%), 55% (range 50-61%) and 72% (range 70-74%), in

the years 1990-91, 1991-92 and 1992-93, successively. The moderate amount of water stored in the soil (More- no et al. 1993) does not prevent there being a large wa- ter deficit during the active period. The maximum va- lues of actual evapotranspiration in absolute terms were generally reached in June (sometimes May or July). Consumption begins to decrease generally in July, rea- ching very low values as early as August, when availa- ble soil water is practically depleted, remaining almost constant for approximately one month, depending on when the first autumn rains occur. Paz & Díaz-Fierros (1985) found in Quercus robur that the soil remained dry for two months in a year with 1368 mm of rainfall in the northwest of Spain; Joffre & Rambal (1988, 1993) obtained similar results in southern Spain. The daily mean values of EA, for the May-July period and for August, are shown in Table 3. Polling al1 plots, a po- sitive relationship (r2 = 0.72, p < 0.001) between total precipitation in the May-August period and the EA du- ring this same period was found.
Comparing the monthly EA values of the four plots, sig- nificant differences were obtained between S4 and the other three plots, which showed slightly higher values; however, if the water intercepted is subtracted, these differences become considerably reduced. Daily EA dis- tribution in the four plots is very similar, with correla- tion coeficients above 0.85.
Drainage
Drainage (D) increased with rainfall (Table 2), and sig- nificant differences were established both on the leve1 of years and of plots (ANOVA, p < 0.001 and p = 0.05, respectively). Thus, pooling al1 plots, the existing rela- tionship is: D = 0.997"Bp - 494 (r2 = 0.85; p < 0.001), expressing D and Bp as mm year-l. This relationships did not be set up for each plot indvidually due to a in- sufficient number of data (only 3 years).
These results indicate how easily an excess of water, and therefore deep drainage, can occur in these soils; a precipitation above 490 mm year-' causes an excess of water in the soil, and practically al1 the rainwater over that figure will be drained. In other papers consulted, this limit was (mmyear-') 360 (Avila 1988), 400 (Piñol et al. 1991), 578 (Rambal 1984), 450 (Likens et al. 1977), 420 (Hudson 1988), 470-500 (Lewis 1968). Ad- ditionally, the rapid moistening of the deep horizons could imply the existence of water loss by drainage, due to rapid circulation in macropores (Beven & German
1981), although the soil is still far from reaching field capacity, a fact that is not included in the model used.
Surj4ace runoff
The results indicate that the runoff decreases according to the following order: Sl>S3>S2>S4 (table 2), and is well correlated with the slope of the plots (Table 1); the latter plot, with almost no slope, has null runoff. The greatest amounts were obtained for the year with the le- ast precipitation. It occurs mainly in autumn (when rain intesity is greater); at no time the runoff was due to sa- turation of water in the soil. In these plots, according to our observations, this water did not transport apprecia- ble amounts of sediment. The volume of water lost th- rough surface runoff can also be said to be very low, as is frequently true in forest ecosystems (Rambal 1984; Francis & Thomes 1990; Soler & Sala 1992).
4.2. Nutrient balances
Atmospheric deposition
Amounts of atmospheric deposition can be described as moderate to scarce, in almost al1 the elements (Figure 2), when compared with those obtained in the northeas- tem Spain (e.g., Avila 1988; Bellot 1988; Belillas & Ro- dá 1991 ), Europe (e.g., Miller et al. 1987; van Breemen et al. 1988; Tietema & Verstraten 1991), U.S.A. (e.g., Likens et al. 1977; Lindberg & Owens 1993), and with mean values obtained by Parker (1983). They are espe- cially low for ions such as S042-, NH4+ and N03-. which are mainly anthropogenic (Belillas & Rodá 1991), which in more industnalized regions show cle- arly higher values. There is no evidence of acid or po- lluted depositions of anthropogenic origin in this region. Regarding the differences along the pluviometric gra- dient, when the total deposition is considered (bulk and dry) the amounts were similar arnong plots.
Losses from the soil
The leaching of elements, nutritive or otherwise, from the soil, is a process controlled mainly by the content in anions and hydrogen ions, as the electrochemical equili- brium in the solution draining from the soil is maintai- ned (Johnson et al. 1986).
The results obtained are shown in Table 4 and Figure 2.

Sodium
Potasium
Magnesium
Calcium
O 3 6 9 1 2
Manganese
lron
Aluminium
o 1 2 3
Hydrogen
Cnlor de
Sulphate
Orthophosphate
0 1 2 3 4 0 1 2 3 4 0 1 2 3 4 0 1 2 3 4
Nitrate
O 4 8 12 16 20 O 4 8 12 16 20 O 4 8 12 16 20 O 4 6 12 16 20
Ammonium
= INPUT
= OUTPUT
Figure 2. Annuai balance of dissolved elements in four different plots (S1 to S4), caiculated as the difference between input (bulk and dry deposition, upper bars) minus output (surface mnoff and deep drainage, lower bars). Vaiues expressed as kg ha-1 year-1, except H+ (g ha-1 year-1).
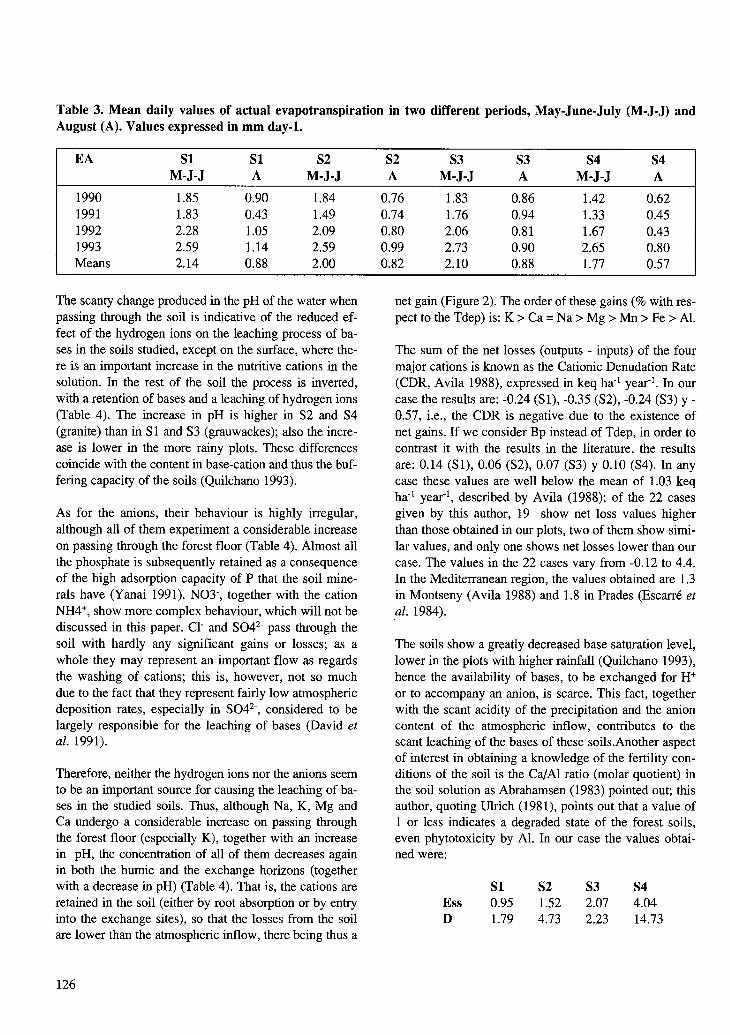
Table 3. Mean daily values of actual evapotranspiration in two different periods, May-June-July (M-J-J) and August (A). Values expressed in mm day-l.
EA S1 S 1 S2 S2 S3 S3 S4 S4 M-J-J A M-J-J A M-J-J A M-J-J A
1990 1.85 0.90 1.84 0.76 1.83 0.86 1.42 0.62 1991 1.83 0.43 1.49 0.74 1.76 0.94 1.33 0.45 1992 2.28 1 .O5 2.09 0.80 2.06 0.81 1.67 0.43 1993 2.59 1.14 2.59 0.99 2.73 0.90 2.65 0.80 Means 2.14 0.88 2.00 0.82 2.10 0.88 1.77 0.57
The scanty change produced in the pH of the water when passing through the soil is indicative of the reduced ef- fect of the hydrogen ions on the leaching process of ba- ses in the soils studied, except on the surface, where the- re is an important increase in the nutntive cations in the solution. In the .rest of the soil the process is inverted, with a retention of bases and a leaching of hydrogen ions (Table 4). The increase in pH is higher in S2 and S4 (granite) than in S1 and S3 (grauwackes); also the incre- ase is lower in the more rainy plots. These differences coincide with the content in base-cation and thus the buf- fering capacity of the soils (Quilchano 1993).
As for the anions, their behaviour is highly irregular, although al1 of them experiment a considerable increase on passing through the forest floor (Table 4). Almost al1 the phosphate is subsequently retained as a consequence of the high adsorption capacity of P that the soil mine- rals have (Yanai 1991). N03-, together with the cation NH4+, show more complex behaviour, which will not be discussed in this paper. C1- and S042- pass through the soil with hardly any significant gains or losses; as a whole they may represent an important flow as regards the washing of cations; this is, however, not so much due to the fact that they represent fairly low atmospheric deposition rates, especially in S042-, considered to be largely responsible for the leaching of bases (David et al. 1991).
Therefore, neither the hydrogen ions nor the anions seem to be an important source for causing the leaching of ba- ses in the studied soils. Thus, although Na, K, Mg and Ca undergo a considerable increase on passing through the forest floor (especially K), together with an increase in pH, the concentration of al1 of them decreases again in both the humic and the exchange honzons (together with a decrease in pH) (Table 4). That is, the cations are retained in the soil (either by root absorption or by entry into the exchange sites), so that the losses from the soil are lower than the atmospheric inflow, there being thus a
net gain (Figure 2). The order of these gains (% with res- pect to the Tdep) is: K > Ca = Na > Mg > Mn > Fe > Al.
The sum of the net losses (outputs - inputs) of the four major cations is known as the Cationic Denudation Rate (CDR, Avila 1988), expressed in keq ha-' year-'. In our case the results are: -0.24 (SI), -0.35 (S2), -0.24 (S3) y - 0.57, i.e., the CDR is negative due to the existence of net gains. If we consider Bp instead of Tdep, in order to contrast it with the results in the literature, the results are: 0.14 (Sl), 0.06 (S2), 0.07 (S3) y 0.10 (S4). In any case these values are well below the mean of 1.03 keq ha-' year-', described by Avila (1988); of the 22 cases given by this author, 19 show net loss values higher than those obtained in our plots, two of them show simi- lar values, and only one shows net losses lower than our case. The values in the 22 cases vary from -0.12 to 4.4. In the Mediterranean region, the values obtained are 1.3 in Montseny (Avila 1988) and 1.8 in Prades (Escarré et al. 1984).
The soils show a greatly decreased base saturation level, lower in the plots with higher rainfall (Quilchano 1993), hence the availability of bases, to be exchanged for H+ or to accompany an anion, is scarce. This fact, together with the scant acidity of the precipitation and the anion content of the atmospheric inflow, contibutes to the scant leaching of the bases of these soils.Another aspect of interest in obtaining a knowledge of the fertility con- ditions of the soil is the Ca/A1 ratio (molar quotient) in the soil solution as Abrahamsen (1983) pointed out; this author, quoting Ulrich (198 l), points out that a value of 1 or less indicates a degraded state of the forest soils, even phytotoxicity by Al. In our case the values obtai- ned were:
S 1 S2 S3 S4 Ess 0.95 1.52 2.07 4.04 D 1.79 4.73 2.23 14.73

Table 4. Volume weigted mean annual chemical concentratios in four different flows (S1 to S4).
mg/I pH DOC CI SO4 PO4 NO3 NH4 Na K Mg Ca Mn Fe Al
Tf-Sl (23) 5.45 9.9 1.9 1.61 0.15 0.53 0.26 0.53 0.85 0.50 1.36 0.050 0.030 0.05
Tf-S2 (23) 5.53 13.9 2.3 1.89 0.46 0.83 0.31 0.67 1.84 0.72 1.48 0.090 0.030 0.06
Tf-S3 (23) 5.64 15.7 2.5 1.92 0.43 0.83 0.32 0.70 1.85 0.85 1.62 0.130 0.040 0.10
Tf-S4 (23) 5.59 23.5 3.5 2.30 1.16 0.73 0.60 0.65 3.19 1.14 2.00 0.100 0.050 0.10
Sr-S1 (17) 5.73 48.8 3.07 2.73 0.40 1.56 0.78 0.73 5.87 1.59 2.58 0.176 0.120 0.34
Sr-S2 (16) 5.81 115.9 5.66 3.54 1.62 6.29 3.11 0.921 7.54 2.18 3.19 0.312 0.172 0.78
Sr-S3 (14) 6.22 81.0 6.75 6.92 2.50 4.12 2.53 1.131 6.35 3.55 4.06 0.348 0.154 0.60
Sr-S4 (7) 6.62 147.2 7.34 11.67 8.71 16.00 9.52 1.83 45.06 4.84 9.97 0.487 0.175 0.26
SSr-S1 (9) 5.74 21.0 3.09 3.81 0.03 0.49 0.60 1.02 1.72 1.08 1.08 0.034 0.038 0.77
SSr-S2 (10) 5.53 28.9 2.84 3.14 0.09 4.43 1.29 0.87 3.38 1.04 1.21 0.054 0.054 0.54
SSr-S3 (8) 5.89 57.2 3.29 2.93 0.25 6.67 1.22 1.00 2.88 1.89 2.74 0.060 0.080 0.90
SSr-S4 (5) 6.01 47.8 5.17 6.15 0.21 16.29 1.38 0.761 0.14 2.70 6.51 0.093 0.081 1.09
D-Sl (9) 5.49 8.4 2.81 2.96 0.04 0.67 0.23 1.06 0.54 0.63 1.22 0.085 0.079 0.46
D-S2 (5) 5.79 4.8 3.97 2.46 0.07 1.64 0.39 1.13 0.84 0.69 1.79 0.074 0.069 0.26
D-S3 (5) 5.72 17.2 4.46 4.22 0.45 3.28 0.49 1.41 1.14 0.94 1.85 0.116 0.152 0.56
D-S4 (3) 6.12 12.3 8.01 6.11 0.07 2.74 0.45 1.20 1.68 1.04 3.70 0.083 0.011 0.17
Tf= Througfall; Sr=Surface runoff; SST= Subsurface runoff; D=Deep drainage.The numbers of analysed events, for each flow and plot, are shown in n parentheses.
Ess is water draining from the humic horizons and Dis water of deep drainage.
Although the Ca/Al values do not indicate a very un-favourable situation, common in areas with much moreacid precipitation than that obtained in this study (Abra-hamsen 1983), they do show the effect of the abundantprecipitation on the soil fertility in this area, with S1 va-lues which indicate a very low level of fertility, andwith high levels of Al in the soil water. The situationimproves (lower relative importance of Al) as the plu-viometric gradient decreases.
In addition to the Ca/Al quotient, the net gains for K,Mg, Na, NH4+, H4PO4-, Fe, Mn, among others, increasewhen precipitation decreases (Figure 2).
5 CONCLUSION
Although the study dealt with situations where theprecipitation was markedly different, both on the levelof years and of plots (range from 442-1306 mm year-1.),the soils had a similar water content in the different ye-ars at the beginning of the active growth period of thevegetation; the water content depends mainly on the soilcharacteristics and not so much on the precipitation re-ceived during the wet season (Moreno et al., 1993).
Taking as a basis the soil water balance, we obtaineddecreasing transpiration rates over the active period, re-aching acutely low levels. Unless the oaks have an effi-cient deep radicular system for extracting water fromthe weathered bedrock, they could be subjected to animportant restriction of water during part of the summerseason. Moreover, the vegetation shows great dependen-ce on the rains of the dry season. The water gradient do-es not seem to define outstanding differences in the wa-ter consumption patterns for the vegetation in this area.
The relative facility with which an excess of water inthe soil is produced in winter, together with the high co-rrelation existing between the volume of rainwater andthat of drained water, cause an important leaching of thesoil and a consequent loss of fertility, which becomesgreater as the pluviometry gradient increases. This factis evident in the figures of the CDR and the Ca/Al ratio.In fact, both on the level of dry matter production andleaf area index, the higher values are obtained in theplots with less precipitation (Martin et al. 1993; Gallegoet al. 1994).
It can be concluded that the greater abundance ofrain in the Wet season did not tend to increase waterconsumption by the vegetation, at least not substan-tially; on the other hand, it did entail a greater leachingof the soil and the consequent loss of fertility, which is
127

especially manifested in a decrease of bases, degree of saturation and pH, as demonstrated by Quilchano (1993) in these same forests.
ACKNOWLEDGEMENTS
This work was possible through the Programs STEP/D.G.XII (EEC), DGCYTIMEC and CICYTDNIA and the colaboration of the Junta de Castilla y León. En- glish version has been revised by D. Garvey and B. Knowles.
REFERENCES
ABRAHAMSEN, G. (1983). Sulphur pollution: Ca, Mg and Al in soil and in soil water and possible effects on forest trees. En: B. Ulrich & J. Pankrath (eds.), Effects of accumulation of air poiiutants in forest ecosystems. D. Reidel Publishing, 207-218.
AVILA, A. (1988). Balanc d'aigua i nutrients en una conca d'alzinar del Montseny. Estudis i monografies 13. Diputació de Barcelona, 219 pp.
BELILLAS, M. C. & RODA, F. (1991) Nutrient budgets in a dry hea- tland watershed in northeastem Spain. Biogeochernistry 13, 137- 157.
BELLOT, J. (1988) Análisis de los flujos de deposición global, trans- colación, escorrentía cortical y deposición seca en el encinar me- diterráneo de L'Avic (Sierra de Prades, Tarragona). Tesis Docto- ral, Univ. Alicante.
BEVEN, K. & GERMANN, P. (1981). Water flow in soil macropores, 11 A combined flow model. J. Soil Sci. 32, 15-29.
BIRKELAND, P.W. (1984). Soil and geomorphology. Oxford Univer- sity Press. New York.
DAVID, M.B., VANCE, G.F., FASTH, W.J. (1991). Forest soil res- ponse to acid and salt additions of sulphate: Aluminium and base cations. Soil Science 151,208-219.
ESCARRE, A., GRACIA, C.A., RODA, F. & TERRADAS, J. (1984). Ecología del bosque esclerófilo mediterraneo. Investigación y Ciencia 95,68-78.
FRANCIS, C.F. & THORNES, J.B. (1990). Matorral erosion and re- clamation. En: J. Albadalejo, M.A. Stocking y E. Díez (Eds.), De- gradación y regeneración del suelo en condiciones ambientales mediterraneas. C.S.I.C., 87-1 16.
GALLARDO, J.F., CUADRADO, S.& PRAT, L. (1980). Caracteristi- cas de los suelos forestales de la sierra de Gata. Stvdia Oecologica 1,241-264.
GALLEGO, H.A., RICO, M., MORENO, G. & SANTA-REGINA, 1. (1994). Leaf water potentials and stomatal conductances in Quer- cus pyrenaica willd. forest: Vertical gradients and response to en- vironmental factors. Tree physiology 14, 1039-1047.
GARNIER, E., BERGER, A. & RAMBAL, S. (1986). Water balance and pattem of soil water uptake in a peach orchard. Agriculture Water Management 1 1, 145-158.
HUDSON, J. (1988). The contribution of soil moisture storage to the water balances of upland forested and grassland catchments. Hy- drol. Sci. J. 33, 289-309.
JOFFRE, R.; RAMBAL, S. (1988). Soil water improvement by trees in the rangelands or southem Spain. Acta OEcologica, OEcol. Plant. 9,405-422.
JOFFRE, R. & RAMBAL, S. (1993). How tree cover influences the water balance of mediterranean rangelands. Ecology 74,570-582.
JOHSON, D.W., COLE, D.W., VAN MIEGROT, H. & HORNG, F.W. (1986). Factors affecting anion movement and retention in four forest soils. Soil Sci. Soc. Am. J. 50, 776-783.
LAKHANI, K.H. & MILLER, H.G. (1980) Assessing the contribution of crown leaching to the element content of rainwater beneath tre- es. In: Hutchinson T.C. & Havas, M. (Eds) Effects of Acid Preci- pitation on Terrestrial Ecosystems (pp 161-171). Plenum Press.
LEWIS, D.C. (1968). Amuai hydrologic response to watershed con- version from oak woodland to annual grassland. Wat. Resour. Res. 4, 59-72.
LIKENS, G.E., BORMANN, F.H., PIERCE, R.S., EATON, J.S. & JOHNSON, N.M. (1977). Biochemistry of a forested ecosystem. Spnnger-Verlag, New York, 148 pp.
LINDBERG, S.E. & OWENS, J.G. (1993) Throughfall studies of de- position to forest edges and gaps in montane ecosystems. Biogeo- chemistry 19, 173-194.
MARTIN, A,; GALLARDO, J.F. & SANTA REGINA, I.(1993). Inte- racción entre la hojarasca y el suelo en ecosistemas forestales de la Sierra de Gata (Provincia de Salamanca, España). En: J.F. Ga- llardo (Ed.), El estudio del suelo y de su degradación en relación con la desertificación. MAPA, Madrid. 1, 1689-1695.
MILLER, H.G. & MILLER, J.D. (1980) Collection and retention of atmospheric pollutants by vegetation. In: Drables, S. & Tollan, A. (Eds) Ecological impact of acid precipitation. Proc. conf. ecol. impact acid precip. Norway, 1980, SNSF project. pp 33-40
MILLER, H.G., MILLER, J.D. & COOPER, J.M. (1987) Transforma- tions in rainwater chemistry on passing through forested ecosys- tems. In: Coughtrey, P., Martin, M., & Unsworth, M. (Eds) Pollu- tant transport and fate in Ecosystems @p 171-180). Blackwell Scientific.
MORENO, G, CUADRADO, S, GALLARDO, J.F. & HERNAN- DEZ, J. (1993). Dinámica estaciona1 de la humedad edáfica en bosques de Quercus pyrenaica considerando un gradiente pluvio- métrico. Procc. Congreso Forestal Español. Lourizán, España, 1, 163-169.
PAZ, A. Y DIAZ-FIERROS, F. (1985). Contribución al conocimiento de la utilización del agua del suelo por las especies forestales (Quercus robur y Pinus pinaster) bajo clima templado húmedo. An. Edaf. y Agrobiol. 64, 1081-1 100.

PARKER, G.G. (1983) Throughfall and stemflow in the forest nu- trient cycling. Adv. Ecol. Res. 13, 58-121.
PINOL, J., LLEDO, M.J. & ESCARRE, A. (1991). Hydrological ba- lance of two Mediterranean forested catchrnents (Prades, northe- ast Spain). Hydrologycal Sciences - Joumal des Sciences Hydro- logiques 36, 95- 107.
QUILCHANO, C. (1993). Contribución al estudio de algunos paráme- tros edáficos relacionados con los ciclos biogeoquímicos en eco- sistemas forestales. Tesis Doctoral. Universidad de Salamanca
RAMBAL, S. (1984). Water balance and pattem of root water uptake by a Quercus coccifera L. evergreen scrub. Oecologia 62, 18-25.
RUTTERS, A.J. (1975). The hidrological cycle in vegetation. In: J.L. Monteith (Ed.), Vegetation and atmosphere. Academic Press, 111-152.
SALA, M. (1988). Lavado superficial de las vertientes. In: S.E.G. (ed.), Metodos y técnicas para la medición en el campo de proce- sos geomorfológicos. Monografia 1, 25-30.
SMITH, M. ( 1991). Report on the expert consultation on procedures for revision of FA0 Guidelines for prediction of crop water requi- rements. Land and Water Development Division. F.A.O., 45 pp.
SOLER, M. & SALA, M. (1992). Effects of fue of clearing in a Medi- terranean Quercus ilex woodland: an experimental approach. Ca- tena 19, 321-332.
TENHUNEN, J.D., SALA, A., HARLEY, P.C., DOUGHERTY, R.L. & REYNOLDS, J.F. (1990). Factors influencing carbon fixation and water use by mediterranean sclerophyll shrubs during sum- mer drougth. Oecologia 82, 381-393.
TIETEMA, A. & VERSTRATEN, J.M. (1991) Nitrogen cycling in an acid forest ecosystems in the Netherlands under increased at- mospheric nitrogen input. The nitrogen budget and the effect of nitrogen transforrnations on the proton budget. Biogeochemistq 15, 21-46.
VACHAUD, G., ROYER, J.M. & COOPER, J.D. (1977). Comparison of methods of calibration of a neutron probe by gravimetric or neutron-capture model. Joumal of Hidrology 34, 343-355.
VAN BREEMEN, N,, VISSER, W.F.J., & PAPE, TH. (1989) Biogeo- chemistry of an oak-woodland ecosystem in the Netherlands af- fected by acid atmosphenc deposition. Agnc. Res. Rep. PUDOC, Wageningen. 197 pp.
YANAI R.D.(1991). Soil solution phosphorous dynamics in a whole- tree harvested northem hardwood forest. Soil Sci. Soc. Am. J. 55, 1746-1752.
ZINKE, P.J. (1967). Forest and water in the light of scientific investi- gation. U.S. Senate Doc. 469, 62d Congr. 2nd Sess. 106 pp.
Copyright © 2022 FDOKUMEN