Estrogen Receptor Genotypes and Haplotypes Associated with Breast Cancer Risk
Upload
independentCategory
view
3download
0
Ann. For. Sci. 66 (2009) 408 Available online at:c© INRA, EDP Sciences, 2009 www.afs-journal.orgDOI: 10.1051/forest/2009010
Original article
Diversity of water use efficiency among Quercus robur genotypes:contribution of related leaf traits
Magali Roussel, Didier Le Thiec, Pierre Montpied, Nathalie Ningre, Jean-Marc Guehl,Oliver Brendel*
INRA, UMR1137 INRA - Nancy-Université “Écologie et Écophysiologie Forestières”, IFR 110 54280 Champenoux, France
(Received 29 April 2008; accepted 4 December 2008)
Keywords:carbon isotope discrimination /intrinsic water use efficiency /pedunculate oak /stomatal conductance /stomatal density
Abstract• Previously, a large intra-specific diversity and a tight genetic control have been shown for Δ13C(carbon isotope discrimination) in a pedunculate oak (Quercus robur L.) family, which is an estima-tor for intrinsic water use efficiency (Wi), a complex trait defined as the ratio of net CO2 assimilationrate (A) to stomatal conductance for water vapour (gs).• In the present study, twelve genotypes with extreme phenotypic values of Δ13C were selected withinthis family to (i) asses the stability of genotype differences across contrasting environments and fordifferent measures Wi; (ii) quantify the relationship between Δ13C and Wi within this family; (iii)identify which leaf traits drive the diversity in Wi observed in this family.• Genetic variability of Δ13C and Wi was largely independent from different temporal integrationscales and their correlation was found to be strong (R2 = 88% for leaf sugars) within this family.• Weak correlations between measures of Wi with estimators of photosynthetic capacity, suggest aminor role of the latter in the diversity of Wi.• However, the tight correlation between gs and Δ13C as well as Wi, and the related genotypic varia-tion in stomatal density, suggest that the genotypic diversity in Wi within this pedunculate oak familymight be due to differences in gs.
Mots-clés :discrimination isotopique du carbone /efficience intrinsèque de l’ullisation del’eau /clêne pedonculé /conductance stomatique /densité stomatique
Résumé – Diversité de l’efficience d’utilisation de l’eau entre différents génotypes de Quercusrobur : contributions des traits foliaires.• Une large diversité intra-spécifique et un fort contrôle génétique ont été mis en évidence pour Δ13C(discrimination isotopique du carbone) dans une famille de chêne pédonculé (Quercus robur L.).Δ13C est un estimateur de l’efficience intrinsèque d’utilisation de l’eau (Wi), un caractère complexedéfini comme le rapport entre l’assimilation nette de CO2 (A) et la conductance stomatique pour lavapeur d’eau (gs).• Douze génotypes présentant des valeurs phénotypiques extrêmes de Δ13C ont été sélectionnésdans cette famille pour (i) évaluer la stabilité des différences génotypiques dans des environnementscontrastés et pour différents estimateurs de l’efficience d’utilisation de l’eau ; (ii) quantifier la relationentre Δ13C et Wi dans cette famille ; (iii) identifier quels caractères foliaires sont impliqués dans ladiversité de Wi observée dans cette famille.• La variabilité génétique de Δ13C et Wi était largement indépendante des différentes échelles d’in-tégration temporelles et leur corrélation était forte dans cette famille (R2 = 88 % lorsque Δ13C étaitmesuré dans les sucres foliaires).• Les faibles corrélations entre Wi (ou Δ13C) et des estimateurs de la capacité photosynthétique sug-gèrent un rôle mineur de celle-ci dans la diversité de Wi.• Par contre, la corrélation étroite entre gs et Δ13C ainsi que Wi et la variation génétique de la densitéstomatique, suggèrent que la diversité génétique de Wi dans cette famille de chêne pédonculé est liéeà des différences de conductance stomatique gs.
* Corresponding author: [email protected]
Article published by EDP Sciences
Ann. For. Sci. 66 (2009) 408 M. Roussel et al.
Abbreviations: Δ13C: 13C isotope discrimination (%�); Δ13Csu: Δ13C of extracted leaf sugars; Δ13Cst: Δ13C of extractedleaf starch; Δ13Cb: Δ13C of bulk leaf material; δ13C: carbon isotope composition (%�); δ13Cair: δ13C of atmospheric CO2
in the greenhouse; ci: CO2 mole fraction in intercellular air spaces (μmol mol−1); ca: atmospheric CO2 mole fraction(μmol mol−1); Wi: intrinsic water use efficiency (μmol mol−1); A: net CO2 assimilation rate (μmol m−2 s−1); Asat: lightsaturated A at ambient CO2 concentration; gs: stomatal conductance for water vapour (mol m−2 s−1); Vcmax: apparentmaximum carboxylation rate of Rubisco (μmol m−2 s−1); Nmass: nitrogen content on a mass basis (mg g−1); Narea:nitrogen content on an area basis (g m−2); Chl: chlorophyll content (g m−2); SD: stomatal density (mm−2); SL: stomatallength (μm); SA: stomatal area (μm2); SAI: stomatal area index (mm−1); LMA: leaf mass-to-area ratio (g m−2); TLT:total leaf thickness (μm); UET: upper epidermis thickness (μm); LET: lower epidermis thickness (μm); PMT: palisademesophyll thickness (μm); SMT: spongy mesophyll thickness (μm).
1. INTRODUCTION
A large intra-specific variability of 13C isotope discrim-ination (Δ13C) has been observed within natural stands ofpedunculate oak (Quercus robur L.; Ponton et al., 2001),a widespread broad-leaved forest tree species from WesternEurope. Leaf Δ13C is a widely used estimator of intrinsic wa-ter use efficiency, Wi, defined as the ratio of net CO2 assimi-lation rate (A) to stomatal conductance for water vapour (gs).The predicted relationship between Δ13C and Wi is negative(Farquhar and Richards, 1984) which has been observed forpedunculate and sessile oaks under different levels of shading(Ponton et al., 2002). Wi is a complex trait related to manyphysiological and structural leaf traits that directly or indi-rectly influence A or gs. Genetic variation in Wi or Δ13C hasbeen shown within many tree species and was ascribed to vari-ations in A (Johnsen and Major, 1995; Major and Johnsen,1996; Xu et al., 2000), in gs (Cregg et al., 2000) or in both(Farquhar et al., 1989).
Brendel et al. (2008) investigated the genetic determinismof water use efficiency in a pedunculate oak full-sib familycomprising 278 siblings. They found in this progeny a 40%variation of Wi as estimated by leaf Δ13C. The genetic controlof Δ13C was oligogenic, with only a few Quantitative TraitLoci (QTL) explaining a large fraction of the observed vari-ability of Δ13C (30% to 50%). The detected QTL pointed totwo major regions on the genetic map of this full-sib family.The first region explained 21–31% of the observed variability,and was detected with independent measurements conductedfor three successive years, suggesting that only low QTL × en-vironment interactions occurred. The second region suggestedan influence of photosynthetic capacity on the observed diver-sity in Δ13C and explained 9% of the observed variability.
Variation in A, when independent from gs, is due to vari-ation in photosynthetic capacity. Theoretical considerationsshow that compounds involved in photosynthesis may accountfor well over three-quarter of total leaf nitrogen (Field andMooney, 1986). Thus for different species photosynthetic ca-pacity was found to correlate with total leaf nitrogen (Evans,1989), including several oak species (Takashima et al., 2004).Leaf anatomy traits such as leaf density and thickness may alsoinfluence photosynthetic capacity (Niinemets, 1999) and mod-ulate the photosynthesis-nitrogen relationships (Reich et al.,1998).
Physiological processes leading to stomatal aperture or clo-sure are well known and recent progress has been made ongenes involved in ABA and Ca+ signalling (Webb and Baker,2002) and stomatal development (Bergmann, 2006). However,the main causes driving diversity in gs in natural populationsare not yet well understood, both within and among species.Franks and Farquhar (2007) found an influence of the stom-atal morphology of different species on maximum stomatalapertures and rapidity of movements. It has also been shownfor temperate deciduous trees that the size of guard cells hasan influence stomatal aperture and therefore contributes to thediversity of gs (Aasamaa et al., 2001). Further it has been sug-gested that maximum stomatal conductance is influenced bystomatal density (Nobel, 1999). Little is however known onthe causes of within species diversity of stomatal conductance.
To study genetic, intraspecific diversity, and to assess ge-netic determinism and control of traits, a large number of sib-lings and vegetative copies (several hundred individuals) arerequired. This puts a severe practical constraint on the numberof leaf traits that can be measured. Therefore we focused ona smaller number of individuals while maximising the differ-ences in Wi and Δ13C. To this end, a few individuals (calledgenotypes hereafter) were selected for their extreme pheno-typic values as observed by Brendel et al. (2008), to coverthe diversity detected within the pedunculate oak full-sib fam-ily. Two strategies were used to sample genotypes: first, usingΔ13C data measured during three successive years and second,using a combination of Δ13C with leaf nitrogen and chloro-phyll content data. With the first sampling strategy genotypeswere selected that have accumulated alleles with positive (ornegative) effects on Δ13C, independently from the physio-logical process affecting discrimination. The second strategyaimed at maximizing the diversity of Δ13C caused by photo-synthetic capacity, by selecting genotypes with simultaneouslyextreme phenotypic values for Δ13C, leaf nitrogen and chloro-phyll content.
Although bulk leaf matter is often used for rapid estimatesof Δ13C (e.g. for QTL studies as in Brendel et al., 2008),it is an aggregate of different carbon containing compounds,each with different integration patterns of Wi. This can causediscrepancies between Wi estimated from leaf bulk Δ13C andWi estimated directly and instantaneously from gas exchangemeasurements. Soluble sugars and starch provide a Δ13C sig-nal with a short time-integration due to their high turn-overrate (few days) (Brugnoli et al., 1988). Δ13C was therefore
408p2
Diversity of water use efficiency in oak Ann. For. Sci. 66 (2009) 408
assessed from three different pools of organic matter (bulkleaf matter, starch, soluble sugars) to downscale from fieldmeasurements (Brendel et al., 2008) to instantaneous gas ex-change. Further, genetic variation of certain leaf traits coulddisturb the relationship between Δ13C and intrinsic water useefficiency (Wi) by affecting the parameters of the theoreticalmodel.
Therefore our main objectives were to:
(i) asses the stability of genotype differences across contrast-ing environments and for different measures of intrinsicwater use efficiency (Wi);
(ii) quantify how genetic variation in Δ13C relates to geneticvariation in Wi within this family;
(iii) identify which leaf traits drive the diversity in Wi ob-served in this family.
2. MATERIAL AND METHODS
2.1. Plant material and growth conditions
Genotypes used in this study were selected within a peduncu-late oak progeny (F1 of 278 clones) which has been used severaltimes for QTL detection (Brendel et al., 2008; Parelle et al., 2007;Scotti-Saintagne et al., 2004; 2005). Selection criteria were based onphenotypic data recorded under natural conditions at Bourran (SouthWestern France) (Brendel et al., 2008). The traits used were carbonisotope discrimination of bulk leaf organic matter (Δ13Cb), chloro-phyll (Chl) and nitrogen content (Narea, Nmass) of leaves. Genotypeswith extreme phenotypes for Δ13C (i.e. “low Δ” or “high Δ”) wereselected on the basis of extreme values of leaf Δ13C recorded duringthree years of measurements (2000 to 2002). Genotypes were cho-sen which showed extreme low or extreme high leaf δ13C data forall three years. In parallel, genotypes with extreme phenotypes con-currently for Δ13C, chlorophyll concentration and leaf N (i.e. “lowN” or “high N”) were selected on the basis of displaying simultane-ously high values of leaf Δ13C and low values of chlorophyll con-centration and leaf nitrogen content recorded in 2001 and inversely.This selection was founded on the hypothesis that genotypes withlow photosynthetic capacity, estimated by low values of leaf nitrogenand chlorophyll would show low Wi , and thus high leaf δ13C. Threegenotypes were chosen for each of the extreme phenotypes: “low Δ”(siblings 159, 171, 287), “high Δ” (136, 170, 263), “low N” (151, 237,351) and “high N” (259, 261, 267), forming a set of twelve genotypesoverall.
Clonal copies of the selected genotypes were produced in summer2003 by UMR BioGECo, INRA Pierroton (South Western France)and then transferred to a greenhouse at Champenoux near Nancy(North Eastern France) during December 2003. The experiment tookplace during summer 2004. The trees were transplanted to 10 L con-tainers with a peat and sand mixture (1/1, v/v). A complete fertil-isation (4.5 g L−1 of slow-release fertiliser Nutricote T100: N, P, K,Mg, 13,13,13,2 + trace elements and 0.2 g L−1 of lime) was provided.All individuals were watered to field capacity three times daily withdeionised water. Air temperature control of the greenhouse was setto a minimum of 15 ◦C and a maximum of 25 ◦C, otherwise withinthis range greenhouse temperature was following outside temperature
variations. Relative humidity (68 ± 12%, average ± standard devia-tion), CO2 concentration (394 ± 12 μmol mol−1) and daily global ir-radiance were continuously recorded in the greenhouse. The plantswere grown under natural photoperiod. As pedunculate oaks show aperiodical growth during the growing season (“flushes”), all measure-ments were done on unshaded adult second flush leaves.
Four vegetative copies (rooted cuttings) of each genotype wereused as replicates. The complete experiment consisted of 40 plantsoverall that were placed in a greenhouse with a randomized completeblock design. One vegetative copy of each gentoype was placed ineach block, with four blocks overall. Due to some mortality of rootedcuttings, especially in the phenotype “high Δ”, the number of clonalcopies of three genotypes was only one or two.
2.2. Extraction of soluble sugars and starchfrom leaves, and carbon isotope analysis
At the beginning of July, one leaf was harvested on each individualplant, oven-dried (60 ◦C) and ball-milled for carbon isotope analysisof bulk leaf matter. Additionally, three to five leaves were harvestedseparately for extraction of soluble sugars and starch, freeze-dried for24 h and then ball-milled. The method of extraction was adapted fromDickson and Larson (1975). Extraction was carried out using 200 mgof leaf powder with 2 mL of a mixture of methanol/chloroform/water(12:5:3, v/v/v). After shaking with a vortex mixer, and 30 min at am-bient temperature, tubes were centrifuged for 10 min at 2 000 g and4 ◦C. The supernatant was recovered, a second extraction was runon the pellet and the second supernatant was added to the first.Then 1 mL of methanol 60% was added to the pellet, and this so-lution was stored at –20 ◦C for starch extraction. Sugar extractioncontinued using the supernatant by addition of 2 mL of a mixturemethanol/chloroform (1:1 v/v) and 1.2 mL of distilled water. Aftervortexing, and centrifugation (5 min, 2 000 g, 4 ◦C), the upper phasewas collected and 0.5 mL of methanol (60%) was added to the re-mainder. After vortexing again, and centrifugation, the supernatantwas retained and added to the first one. Methanol and water werethen evaporated overnight in a vacuum concentration system (1 mbar,30 ◦C, Heto, Denmark). The pellet was rehydrated with 0.5 mLdistilled water and vortexed. Soluble sugars were then separatedfrom the aqueous extract through a multilayer extraction column,consisting of (i) PVPP (Polyvinylpolypyrrolidone, Sigma-Aldrich,Germany) to retain phenols and tannins; (ii) Dowex −50 (H+) resin(Sigma-Aldrich, Germany) used for separation of amino acids fromorganic acids and sugars and (iii) Amberlite IRA-402 (Cl−) resin(Sigma-Aldrich, Germany) used for separation of organic acids fromsugars. The soluble sugars were eluted with 8 mL of distilled water.The eluate was reduced in a vacuum concentration system. The pelletwas stored at −20 ◦C before carbon isotope analysis.
The pellet kept for starch extraction in methanol was centrifuged(10 min, 2 000 g, 4 ◦C), the supernatant was discarded and the residuewas dried for 15 min in a vacuum concentration system. The pelletwas then suspended in 1 mL of HCl 6N. After vortexing and centrifu-gation (5 min, 2 000 g, 4 ◦C), the supernatant was retained and mixedwith 8 mL of 60% methanol. Starch was then precipitated one dayat −20 ◦C and dried with the vacuum concentration system. Samplesof starch were stored at −20 ◦C before carbon isotope analysis. Ex-tracted sugars and starch represented about 9% and 5% of the bulkleaf dry mass, respectively.
408p3

Ann. For. Sci. 66 (2009) 408 M. Roussel et al.
The carbon isotope composition of 1 mg of bulk leaf, solublesugar or starch organic material was measured with a continuousflow isotope ratio mass spectrometer (Delta S; Thermo Finnigan,Bremen, Germany) coupled to an elemental analyser (Carlo Erba NA1 500 NC, Rodano, Italy). The relative abundance of 13C (%�) wasexpressed as (Craig, 1957) :
δ13C = (Rs − Rb)/Rb × 1 000
where Rs and Rb refer to the 13C/12C ratio in the sample and in thePee Dee Belemnite standard, respectively.
Carbon isotope discrimination (Δ13C) was calculated as:
Δ13C ≈ δ13Cair − δ13Csample
where δ13Cair is the carbon isotope composition of atmospheric CO2.δ13Cair was assessed in the greenhouse by growing Zea mays plants,recording the δ13C of leaf organic matter and using the procedure ofMarino and McElroy (1991) to compute δ13Cair which was found tobe equal to −9.80 ± 0.23%� (average ± standard deviation).
The modelled relationship between Δ13C and Wi is (Farquhar andRichards, 1984) :
Δ13Csample = b − (b − a)1.6 Wi
ca
with: a, discrimination during diffusion of CO2 through stomata(4.4%�) and b, discrimination during carboxylation of RuBP (27%�taking into account 10% C fixed by PEPC; Farquhar and Richards,1984) and ca, atmospheric CO2 mole fraction (continuously moni-tored in the greenhouse with a mean value of 394 ± 12 μmol mol−1).The resulting equation is then Δ13Csample ≈ 27 − 0.092Wi .
2.3. Gas exchange measurements
Leaf gas exchange was recorded on one leaf per individual plantduring July 2004, with an open flow gas exchange system (Li-6400,Li-Cor, Lincoln, NE, USA). Leaves were inserted into the chamberand photosynthesis was induced for about 40 min at 25 ◦C, at a CO2
mole fraction of 390 μmol mol−1, a photosynthetic photon flux den-sity of 1 200 μmol m−2 s−1, and an air flux of 300 μmol s−1. Lightsaturated net CO2 assimilation rate (Asat) and stomatal conductancefor water vapour (gs) were recorded and intrinsic water use efficiency(Wi) was computed as the ratio between Asat and gs. Response curvesof net assimilation rate (A) to CO2 mole fraction in intercellular airspaces (ci) were recorded with the following procedure: a decreasein CO2 mole fraction from 390 μmol mol−1 to 50 μmol mol−1 in fivesteps. For each step, four min were allowed for gas exchange sta-bilization before measuring three times environmental parameters, Aand estimating ci. These curves were used to adjust maximal carboxy-lation rate of Rubisco (Vcmax; von Caemmerer and Farquhar, 1981) asdescribed by Dreyer et al. (2001). The adjusted model did not explic-itly include internal conductance to CO2, and the computed valuesrepresent therefore apparent Vcmax.
2.4. Chlorophyll content
Relative chlorophyll content (in CCI unit) was estimated using aCCM-200 (Chlorophyll Content Meter, Opti-Sciences, Hudson, NH,
USA). Total chlorophyll content per leaf area (Chl) was derived us-ing the following relationship calibrated for oak using biochemicalchlorophyll extraction according to Barnes et al. (1992):
Chl (g m−2) = 0.021 (CCI unit) + 0.05.
Total chlorophyll content was measured two times at different dateson three leaves per tree with three to five replicates per leaf. The datapresented in this study are the least-square mean for each gentoypecalculated from an Analysis of Variance model taking into accountthe date effect.
2.5. Leaf nitrogen content and leaf mass-to-area ratio
Leaf mass-to-area ratio (LMA) and leaf nitrogen content (Narea,Nmass) were estimated for the leaves used for δ13C analysis of bulkleaf organic matter. Area of fresh leaves was measured with a LeafArea Meter (Delta-T Devices Ltd., Cambridge, UK), whereas masswas determined after drying and LMA was calculated as the ratio ofleaf mass per area. Nmass was measured during isotopic analysis withthe elemental analyser (Carlo Erba NA 1 500 NC, Rodano, Italy) thatwas coupled to the mass spectrometer. Leaf nitrogen content on anarea basis (Narea) was calculated from Nmass times LMA.
2.6. Leaf anatomy
An additional three leaves were harvested for leaf anatomy. Over-all 14 discs (1 cm2) were punched from three leaves per vegeta-tive copy of each genotype for measuring stomatal density and leafanatomy and were immediately frozen in liquid nitrogen and storedat –80 ◦C. Microphotographs were made with a variable pressurescanning electron microscope (model 1450VP, Leo, Cambridge, UK,20–30 Pa inside chamber, accelerating voltage 15 kV, working dis-tance 12 mm) and analysed for stomatal density and stomatal dimen-sions using the Visilog software (Noesis, France).
One microphotograph of the abaxial epidermis (0.72 mm2) of ninediscs from three different leaves was used to estimate stomatal density(SD). On each of the microphotographs 50 stomata were sampledfor measuring guard cell surface (SA) and length (SL). Stomatal areaindex (SAI; Bruschi et al., 2003) was calculated as stomatal density ×stomatal length, which can be seen as a rough indicator of potentialtotal stomatal opening per leaf surface.
On the five other discs (1 cm2), four semi-thin cryo sections werephotographed to measure total leaf thickness (TLT) and thickness ofpalisade (PMT), or spongy mesophyll (SMT), or upper and lowerepidermal layers (UET and LET, respectively).
2.7. Statistical analyses
Using the whole data-set, correlations between traits were com-puted using STATISTICA software Version 7.1 (StatSoft, Inc. 2005).Correlations are based on genotype means and can therefore be seenas representing genetic differences among siblings within the family.Pearson’s correlation coefficients were estimated with a correlationmatrix or with regression analyses. As all correlations were based onthe combination of two continuous variables, model II regression (ge-ometric mean regression) was used to estimate the equation param-eters (Sokal and Rohlf, 2000). All statistical tests were consideredsignificant when p < 0.05.
408p4
Diversity of water use efficiency in oak Ann. For. Sci. 66 (2009) 408
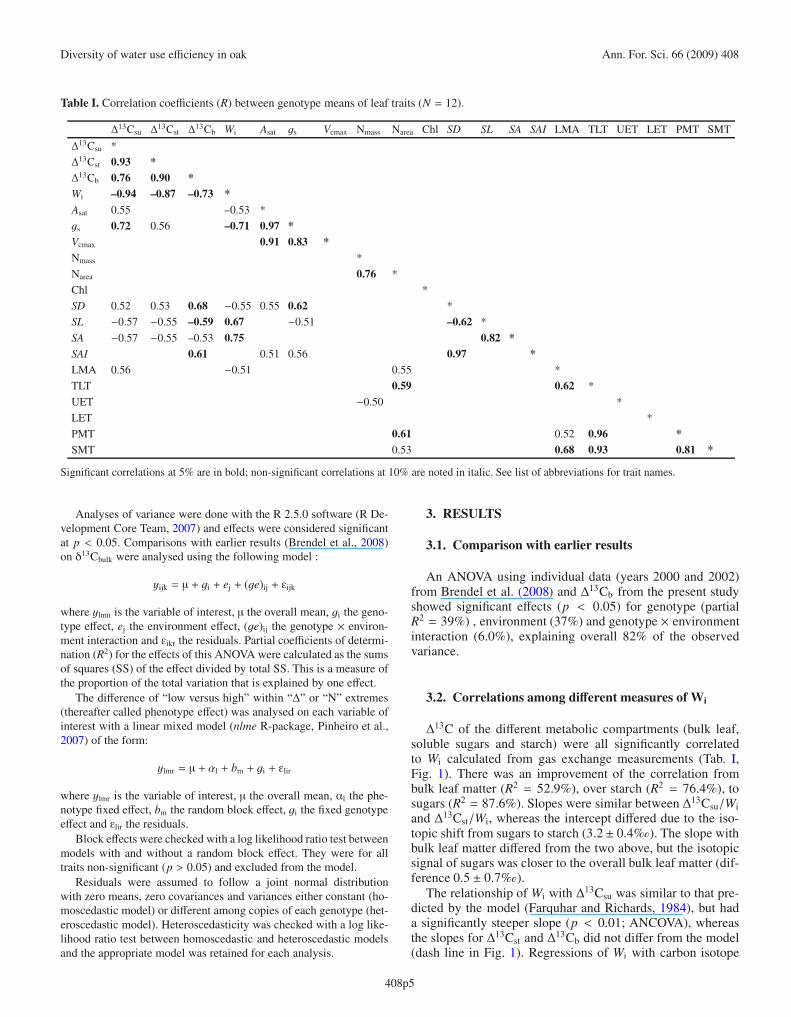
Table I. Correlation coefficients (R) between genotype means of leaf traits (N = 12).
Δ13Csu Δ13Cst Δ
13Cb Wi Asat gs Vcmax Nmass Narea Chl SD SL SA SAI LMA TLT UET LET PMT SMT
Δ13Csu *
Δ13Cst 0.93 *Δ13Cb 0.76 0.90 *Wi –0.94 –0.87 –0.73 *Asat 0.55 –0.53 *
gs 0.72 0.56 –0.71 0.97 *Vcmax 0.91 0.83 *Nmass *
Narea 0.76 *
Chl *
SD 0.52 0.53 0.68 −0.55 0.55 0.62 *
SL −0.57 −0.55 –0.59 0.67 −0.51 –0.62 *
SA −0.57 −0.55 –0.53 0.75 0.82 *SAI 0.61 0.51 0.56 0.97 *LMA 0.56 −0.51 0.55 *
TLT 0.59 0.62 *
UET −0.50 *
LET *
PMT 0.61 0.52 0.96 *SMT 0.53 0.68 0.93 0.81 *
Significant correlations at 5% are in bold; non-significant correlations at 10% are noted in italic. See list of abbreviations for trait names.
Analyses of variance were done with the R 2.5.0 software (R De-velopment Core Team, 2007) and effects were considered significantat p < 0.05. Comparisons with earlier results (Brendel et al., 2008)on δ13Cbulk were analysed using the following model :
yijk = μ + gi + ej + (ge)ij + εijk
where ylmn is the variable of interest, μ the overall mean, gi the geno-type effect, ej the environment effect, (ge)ij the genotype × environ-ment interaction and εikr the residuals. Partial coefficients of determi-nation (R2) for the effects of this ANOVA were calculated as the sumsof squares (SS) of the effect divided by total SS. This is a measure ofthe proportion of the total variation that is explained by one effect.
The difference of “low versus high” within “Δ” or “N” extremes(thereafter called phenotype effect) was analysed on each variable ofinterest with a linear mixed model (nlme R-package, Pinheiro et al.,2007) of the form:
ylmr = μ + αl + bm + gi + εlir
where ylmr is the variable of interest, μ the overall mean, αl the phe-notype fixed effect, bm the random block effect, gi the fixed genotypeeffect and εlir the residuals.
Block effects were checked with a log likelihood ratio test betweenmodels with and without a random block effect. They were for alltraits non-significant (p > 0.05) and excluded from the model.
Residuals were assumed to follow a joint normal distributionwith zero means, zero covariances and variances either constant (ho-moscedastic model) or different among copies of each genotype (het-eroscedastic model). Heteroscedasticity was checked with a log like-lihood ratio test between homoscedastic and heteroscedastic modelsand the appropriate model was retained for each analysis.
3. RESULTS
3.1. Comparison with earlier results
An ANOVA using individual data (years 2000 and 2002)from Brendel et al. (2008) and Δ13Cb from the present studyshowed significant effects (p < 0.05) for genotype (partialR2 = 39%) , environment (37%) and genotype × environmentinteraction (6.0%), explaining overall 82% of the observedvariance.
3.2. Correlations among different measures of Wi
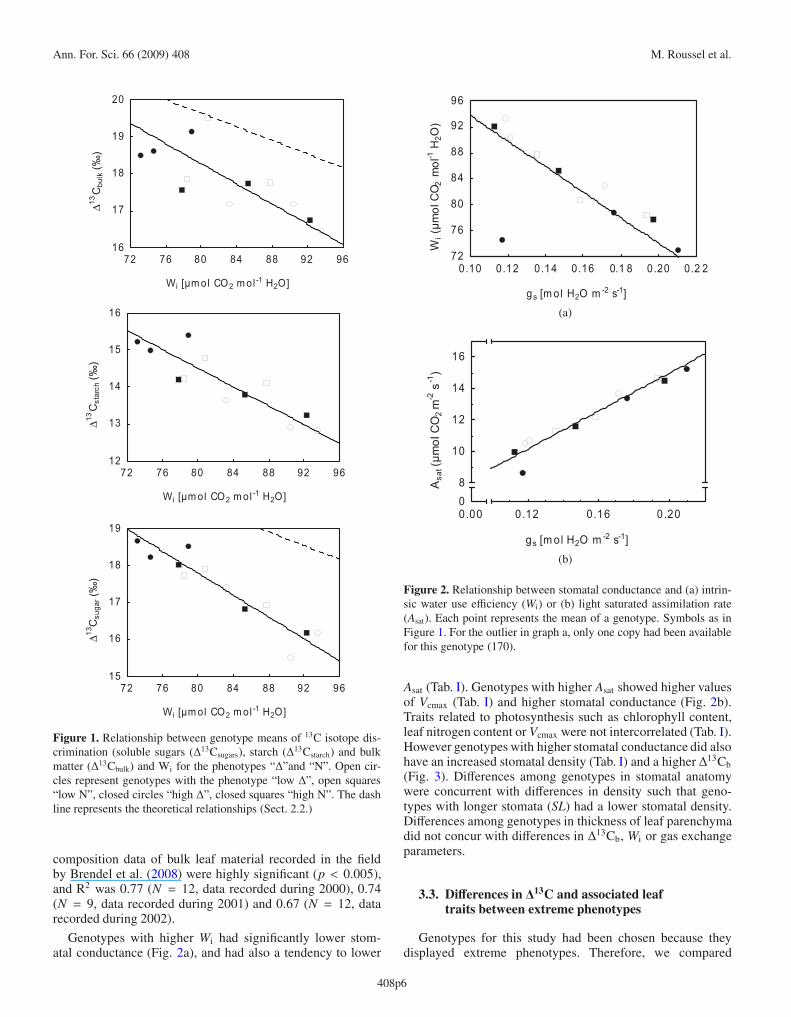
Δ13C of the different metabolic compartments (bulk leaf,soluble sugars and starch) were all significantly correlatedto Wi calculated from gas exchange measurements (Tab. I,Fig. 1). There was an improvement of the correlation frombulk leaf matter (R2 = 52.9%), over starch (R2 = 76.4%), tosugars (R2 = 87.6%). Slopes were similar between Δ13Csu/Wiand Δ13Cst/Wi, whereas the intercept differed due to the iso-topic shift from sugars to starch (3.2± 0.4%�). The slope withbulk leaf matter differed from the two above, but the isotopicsignal of sugars was closer to the overall bulk leaf matter (dif-ference 0.5 ± 0.7%�).
The relationship of Wi with Δ13Csu was similar to that pre-dicted by the model (Farquhar and Richards, 1984), but hada significantly steeper slope (p < 0.01; ANCOVA), whereasthe slopes for Δ13Cst and Δ13Cb did not differ from the model(dash line in Fig. 1). Regressions of Wi with carbon isotope
408p5
Ann. For. Sci. 66 (2009) 408 M. Roussel et al.
Wi [µm ol CO2 m ol -1 H2O]
Δ13C
suga
r (‰
)
72 76 80 84 88 92 9615
16
17
18
19
Wi [µm ol CO2 m ol -1 H2O]
Δ13C
star
ch (‰
)
72 76 80 84 88 92 9612
13
14
15
16
Wi [µm ol CO2 m ol -1 H2O]
Δ13C
bulk
(‰)
72 76 80 84 88 92 9616
17
18
19
20
Figure 1. Relationship between genotype means of 13C isotope dis-crimination (soluble sugars (Δ13Csugars), starch (Δ13Cstarch) and bulkmatter (Δ13Cbulk) and Wi for the phenotypes “Δ”and “N”. Open cir-cles represent genotypes with the phenotype “low Δ”, open squares“low N”, closed circles “high Δ”, closed squares “high N”. The dashline represents the theoretical relationships (Sect. 2.2.)
composition data of bulk leaf material recorded in the fieldby Brendel et al. (2008) were highly significant (p < 0.005),and R2 was 0.77 (N = 12, data recorded during 2000), 0.74(N = 9, data recorded during 2001) and 0.67 (N = 12, datarecorded during 2002).
Genotypes with higher Wi had significantly lower stom-atal conductance (Fig. 2a), and had also a tendency to lower
gs [m ol H2O m -2 s-1]
Wi (
µmol
CO 2
mol
-1 H
2O)
0 .10 0.12 0.14 0.16 0.1 8 0.20 0.2 272
76
80
84
88
92
96
(a)
gs [m ol H2O m -2 s-1]
Asa
t (µm
ol C
O2
m-2
s-1
)
0 .00 0.12 0.16 0.2008
10
12
14
16
(b)
Figure 2. Relationship between stomatal conductance and (a) intrin-sic water use efficiency (Wi) or (b) light saturated assimilation rate(Asat). Each point represents the mean of a genotype. Symbols as inFigure 1. For the outlier in graph a, only one copy had been availablefor this genotype (170).
Asat (Tab. I). Genotypes with higher Asat showed higher valuesof Vcmax (Tab. I) and higher stomatal conductance (Fig. 2b).Traits related to photosynthesis such as chlorophyll content,leaf nitrogen content or Vcmax were not intercorrelated (Tab. I).However genotypes with higher stomatal conductance did alsohave an increased stomatal density (Tab. I) and a higher Δ13Cb(Fig. 3). Differences among genotypes in stomatal anatomywere concurrent with differences in density such that geno-types with longer stomata (SL) had a lower stomatal density.Differences among genotypes in thickness of leaf parenchymadid not concur with differences in Δ13Cb, Wi or gas exchangeparameters.
3.3. Differences in Δ13C and associated leaftraits between extreme phenotypes
Genotypes for this study had been chosen because theydisplayed extreme phenotypes. Therefore, we compared
408p6
Diversity of water use efficiency in oak Ann. For. Sci. 66 (2009) 408
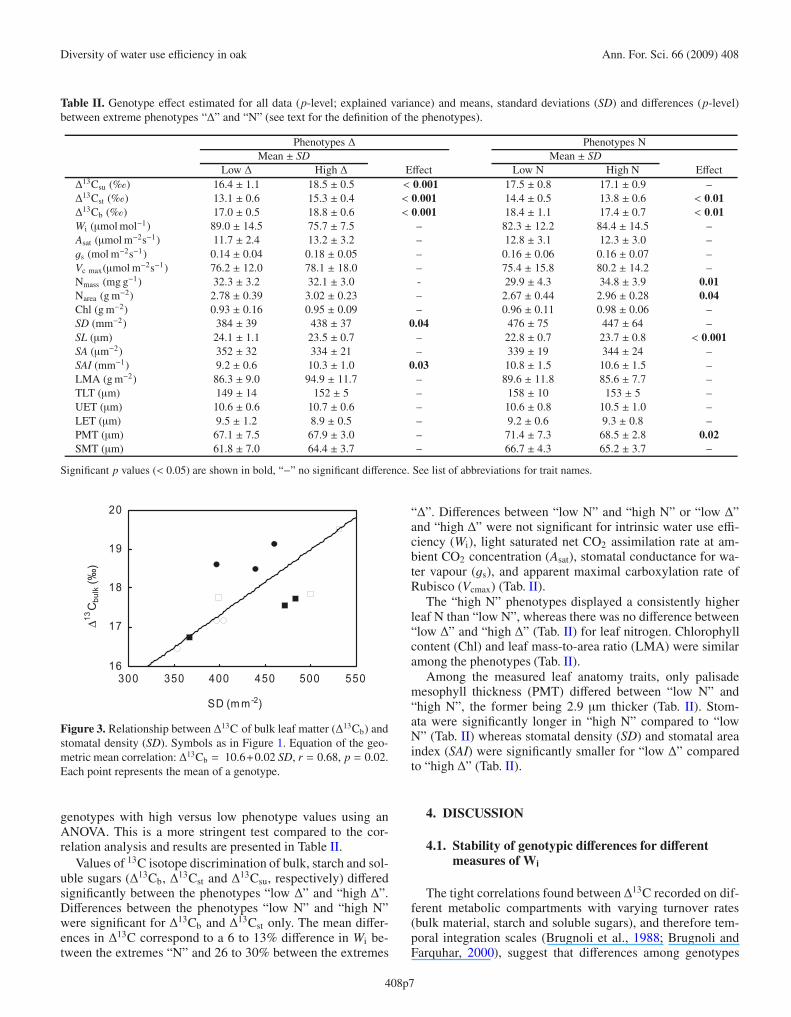
Table II. Genotype effect estimated for all data (p-level; explained variance) and means, standard deviations (SD) and differences (p-level)between extreme phenotypes “Δ” and “N” (see text for the definition of the phenotypes).
Phenotypes Δ Phenotypes NMean ± SD Mean ± SD
Low Δ High Δ Effect Low N High N EffectΔ13Csu (%�) 16.4 ± 1.1 18.5 ± 0.5 < 0.001 17.5 ± 0.8 17.1 ± 0.9 –Δ13Cst (%�) 13.1 ± 0.6 15.3 ± 0.4 < 0.001 14.4 ± 0.5 13.8 ± 0.6 < 0.01Δ13Cb (%�) 17.0 ± 0.5 18.8 ± 0.6 < 0.001 18.4 ± 1.1 17.4 ± 0.7 < 0.01Wi (μmol mol−1) 89.0 ± 14.5 75.7 ± 7.5 – 82.3 ± 12.2 84.4 ± 14.5 –Asat (μmol m−2s−1) 11.7 ± 2.4 13.2 ± 3.2 – 12.8 ± 3.1 12.3 ± 3.0 –gs (mol m−2s−1) 0.14 ± 0.04 0.18 ± 0.05 – 0.16 ± 0.06 0.16 ± 0.07 –Vc max(μmol m−2s−1) 76.2 ± 12.0 78.1 ± 18.0 – 75.4 ± 15.8 80.2 ± 14.2 –Nmass (mg g−1) 32.3 ± 3.2 32.1 ± 3.0 - 29.9 ± 4.3 34.8 ± 3.9 0.01Narea (g m−2) 2.78 ± 0.39 3.02 ± 0.23 – 2.67 ± 0.44 2.96 ± 0.28 0.04Chl (g m−2) 0.93 ± 0.16 0.95 ± 0.09 – 0.96 ± 0.11 0.98 ± 0.06 –SD (mm−2) 384 ± 39 438 ± 37 0.04 476 ± 75 447 ± 64 –SL (μm) 24.1 ± 1.1 23.5 ± 0.7 – 22.8 ± 0.7 23.7 ± 0.8 < 0.001SA (μm−2) 352 ± 32 334 ± 21 – 339 ± 19 344 ± 24 –SAI (mm−1) 9.2 ± 0.6 10.3 ± 1.0 0.03 10.8 ± 1.5 10.6 ± 1.5 –LMA (g m−2) 86.3 ± 9.0 94.9 ± 11.7 – 89.6 ± 11.8 85.6 ± 7.7 –TLT (μm) 149 ± 14 152 ± 5 – 158 ± 10 153 ± 5 –UET (μm) 10.6 ± 0.6 10.7 ± 0.6 – 10.6 ± 0.8 10.5 ± 1.0 –LET (μm) 9.5 ± 1.2 8.9 ± 0.5 – 9.2 ± 0.6 9.3 ± 0.8 –PMT (μm) 67.1 ± 7.5 67.9 ± 3.0 – 71.4 ± 7.3 68.5 ± 2.8 0.02SMT (μm) 61.8 ± 7.0 64.4 ± 3.7 – 66.7 ± 4.3 65.2 ± 3.7 –
Significant p values (< 0.05) are shown in bold, “−” no significant difference. See list of abbreviations for trait names.
SD (m m-2)
Δ13C
bulk
(‰)
300 350 400 450 500 55016
17
18
19
20
Figure 3. Relationship between Δ13C of bulk leaf matter (Δ13Cb) andstomatal density (SD). Symbols as in Figure 1. Equation of the geo-metric mean correlation: Δ13Cb = 10.6+0.02 SD, r = 0.68, p = 0.02.Each point represents the mean of a genotype.
genotypes with high versus low phenotype values using anANOVA. This is a more stringent test compared to the cor-relation analysis and results are presented in Table II.
Values of 13C isotope discrimination of bulk, starch and sol-uble sugars (Δ13Cb, Δ13Cst and Δ13Csu, respectively) differedsignificantly between the phenotypes “low Δ” and “high Δ”.Differences between the phenotypes “low N” and “high N”were significant for Δ13Cb and Δ13Cst only. The mean differ-ences in Δ13C correspond to a 6 to 13% difference in Wi be-tween the extremes “N” and 26 to 30% between the extremes
“Δ”. Differences between “low N” and “high N” or “low Δ”and “high Δ” were not significant for intrinsic water use effi-ciency (Wi), light saturated net CO2 assimilation rate at am-bient CO2 concentration (Asat), stomatal conductance for wa-ter vapour (gs), and apparent maximal carboxylation rate ofRubisco (Vcmax) (Tab. II).
The “high N” phenotypes displayed a consistently higherleaf N than “low N”, whereas there was no difference between“low Δ” and “high Δ” (Tab. II) for leaf nitrogen. Chlorophyllcontent (Chl) and leaf mass-to-area ratio (LMA) were similaramong the phenotypes (Tab. II).
Among the measured leaf anatomy traits, only palisademesophyll thickness (PMT) differed between “low N” and“high N”, the former being 2.9 μm thicker (Tab. II). Stom-ata were significantly longer in “high N” compared to “lowN” (Tab. II) whereas stomatal density (SD) and stomatal areaindex (SAI) were significantly smaller for “low Δ” comparedto “high Δ” (Tab. II).
4. DISCUSSION
4.1. Stability of genotypic differences for differentmeasures of Wi
The tight correlations found between Δ13C recorded on dif-ferent metabolic compartments with varying turnover rates(bulk material, starch and soluble sugars), and therefore tem-poral integration scales (Brugnoli et al., 1988; Brugnoli andFarquhar, 2000), suggest that differences among genotypes
408p7
Ann. For. Sci. 66 (2009) 408 M. Roussel et al.
are robust with respect to these time-scales. The relation-ships found between temporally independent measurementsof Wi and Δ13C are close to the relationship predicted bythe theoretical model (Farquhar and Richards, 1984), whereΔ13C of material with shorter temporal integration results intighter correlation with Wi estimated from instantaneous gasexchange measurements (Fig. 1). It should be stressed thatthese relationships between Wi and Δ13C were due to geneticdifferences among genotypes under common, optimal condi-tions and not due to acclimation of water use efficiency to dif-ferent environmental conditions as observed in earlier studies(Guehl et al., 1994; Picon et al., 1996; Ponton et al., 2002).An observed genetic variability of Δ13C can relate to a vari-ability of Wi as well as to a variability of the parameters of thetheoretical model linking these two traits. In fact, the correla-tion between Δ13C and Wi observed by Brendel et al. (2008)was weak (R2 = 0.07), suggesting that either a large part ofthe variability of Δ13C was not related to Wi or that Wi fromgas exchange measurements were estimated with much noisedue to environmental influence. The here presented data, us-ing more representative gas exchange measurements, showedthat up to 87% of the genetic variability observed in Δ13C canbe related to Wi. Therefore, the closeness between observa-tions and model affirms that measurement of carbon isotopediscrimination on leaf bulk material in this pedonculate oakfamily (e.g. Brendel et al., 2008) reflected to a high degreevariation in Wi.
“Low Δ” and “high Δ” phenotypes showed values for Δ13Cconsistent with the sampling strategy, i.e., “low Δ” displayedsignificantly lower values than “high Δ”. When data fromthe present study and from Brendel et al. (2008) were com-pared, the relative differences among genotypes for Δ13C werefound to be largely independent from environmental condi-tions, that is there was very little genotype × environmentinteraction. The relatively large overall environmental effectis probably due to the climate differences, where the fieldsite in southern France was drier and hotter compared to thewell-irrigated plants in the temperature controlled greenhouse.Thus, genotypic differences in Δ13C were conserved amongyears, through contrasting environments and among differentmetabolic pools, which extends observations made by Johnsenet al. (1999) on Picea mariana and Lauteri et al. (1997) onCastanea sativa.
5. VARIABLES DRIVING VARIATION OF WIWITHIN THIS PEDUNCULATE OAK FAMILY
Wi is calculated as the ratio between assimilation rate andstomatal conductance and therefore systematic variation ofboth traits among genotypes can change Wi. Furthermore, vari-ation in A might be controlled by variation in g and vice versa.Here, variation detected among genotypes for light saturatedgs and Asat suggest a strong control of gs on Asat and thus amajor influence of gs on differences in Wi. Differences in Asatwere representing differences in photosynthetic capacity as es-timated by Vcmax, however, again, there was an overall cor-relation between Vcmax and gs. Variation in leaf nitrogen and
chlorophyll content among genotypes did not have an effecton Vcmax, Asat or on Wi. Also thickness of leaf parenchyma,which could theoretically have an impact on photosyntheticcapacity, did not show any relationship with estimators of Wi.Overall, variation in traits related to photosynthetic capacitydid not seem to be the driver for variation in any of the estima-tors of intrinsic water use efficiency.
Variation in Wi due to photosynthetic capacity had beenstudied specifically by using the selected “low N” and “highN” genotypes. This selection was effective for Δ13C and leafnitrogen content, as the expected differences were observedbetween the extreme phenotypes, whereas it was not effec-tive for leaf chlorophyll content. This might be due to a lowheritability of leaf chlorophyll. To our knowledge, heritabilityof chlorophyll content has not yet been estimated in a tem-perate forest tree species. Narrow sense heritability estimatesfor leaf chlorophyll content for other plant types rarely ex-ceed 50% (e.g. Collaku et al., 2005; Kabanova et al., 2000for wheat, Hervé et al., 2001 for sunflower), suggesting con-siderable environmental influence. This might be due to rapid(within days) acclimation to current irradiance, as shown byFrak et al. (2001) for Juglans nigra x regia seedlings. Addi-tionally to the specific selection of “N” genotypes, the pedun-culate oak saplings in the present study were raised with opti-mal water supply, which should reduce the stomatal limitationof assimilation rate and thus facilitate the expression of differ-ences in photosynthetic capacity. However, “low N” and “highN” did not present difference in Asat or in Vcmax, suggestingthat the diversity of photosynthetic capacity might either notbe well estimated by leaf N and chlorophyll content or not bea driver for variability in Wi within this family.
Otherwise, variation in stomatal conductance was a driverfor the variation of Wi, as suggested by the strong correlationof gs with Wi and Δ13Csu. Brendel et al. (2008) had not de-tected an correlation between δ13C or Wi and gs, probably dueto the difficulties of measuring gas exchange in the field. Fur-ther, the differences among genotypes in gs concur with dif-ferences in stomatal density (SD), i.e. genotypes with highergs also dispayed more stomata per leaf surface. Differencesin stomatal density were also related to differences in Δ13Cb,and a similar tendency was detected for other estimates of Wi.Few publications have analysed the relationship between Δ13Cand stomatal density among genotypes. A positive relationshipbetween Δ13C and stomatal density was also found for Pinusponderosa provenances (Cregg et al., 2000) and among poplarclones from Populus deltoides× nigra hybrids (Monclus et al.,2006), whereas Dillen et al. (2008) found a negative relation-ship for a Populus deltoides × trichocarpa family. Genotypeswith larger stomatal density showed higher gs, which couldlead to lower Wi. The model proposed by Nobel (1999) sug-gests a positive relationship between stomatal density and gs.This was confirmed by Pearce et al. (2006) for several poplarspecies in a common garden and by Kundu and Tigerstedt(1999) for different provenances of Azadirachta indica in agreenhouse. A positive relationship between stomatal densityand gs would thus be the link for the observed positive corre-lation between Δ13C and stomatal density, and could therefore
408p8
Diversity of water use efficiency in oak Ann. For. Sci. 66 (2009) 408
be a cause for the observed diversity in Wi among genotypesof this pedunculate oak family.
We also observed that genotypes with an increased stomataldensity had smaller stomata (based on estimates of stomatalguard cell length SL). A similar relationship was observed byHetherington and Woodward (2003) across different speciesbut also within species. This relationship suggests a compen-sating effect resulting in a stable total stoma opening area.However our data suggest that this trade-off was only of lim-ited extent as stomatal area index (SAI = SL × SD), an es-timator of total stoma opening area, still showed differencesamong genotypes related to differences in Δ13Cb. Aasamaaet al. (2001) have shown for tree species that the size ofguard cells has an influence on stomatal aperture and thus ongs. These results suggest a possible impact of stomatal den-sity on variation in Δ13C and thus Wi via a genetic diversityin maximum stomatal conductance within this family of pe-dunculate oak. According to Bergmann and Sack (2007), fewgene products are required to regulate patterns of stomata inleaves. It has been shown in Arabidopsis thaliana that thegene ERECTA, which influences water use efficiency, can af-fect modulates mesophyll cell proliferation as well as stomataldensity (Masle et al., 2005).
6. CONCLUSIONS
Using a relatively small number of siblings from a large pe-dunculate oak progeny, we showed that the diversity detectedfor Δ13C in this progeny was closely related to instantaneous,intrinsic water use efficiency (Wi), as expected from the theo-retical model linking these two traits (Farquhar and Richards,1984). Genetic variability of Δ13C and Wi was largely inde-pendent from different temporal integration scales and fromdifferent environments. We were not able to substantiate theinfluence of photosynthetic capacity on Wi or Δ13C that hadbeen suggested by the co-localisation of QTL for Δ13C, nitro-gen and chlorophyll content. However, the large genetic vari-ation in stomatal density and stomatal area index, as well asthe tight correlation between stomatal conductance and Δ13Csuggest that differences in water use efficiency within this pe-dunculate oak family might be due to differences in stomatalconductance.
Acknowledgements: We would like to thank Erwin Dreyer aswell as two anonymous reviewers for their abundant suggestionson the manuscript. We are also grateful to Claude Bréchet forthe δ13C measurements and help in sugar and starch extractions,Pascale Maillard for the procedure of sugar and starch extraction,Patrick Gross for greenhouse management, Jean-Marie Gioria andChristophe Bailly for their technical assistance in greenhouse. Wealso thank Evangelista Bertocchi of INRA Pierroton for producingthe rooted cuttings and Antoine Kremer for providing access to thepedunculate oak off-spring family.
REFERENCES
Aasamaa K., Sõber A., and Rahi M., 2001. Leaf anatomical characteris-tics associated with shoot hydraulic conductance, stomatal conduc-
tance and stomatal sensitivity to changes of leaf water status in tem-perate deciduous trees. Aust. J. Plant Physiol. 28: 765–774.
Barnes J.D., Balaguer L., Manrique E., Elvira S., and Davison A.W.,1992. A reappraisal of the use of DMSO for the extraction and de-termination of chlorophylls a and b in lichens and higher plants.Environ. Exp. Bot. 32: 85–100.
Bergmann D., 2006. Stomatal development: from neighborly to globalcommunication. Curr. Opin. Plant Biol. 9: 478–483.
Bergmann D.C. and Sack F.D., 2007. Stomatal Development. Ann. Rev.Plant Biol. 58: 163–181.
Brendel O., Le Thiec D., Saintagne C., Kremer A., and Guehl J.M., 2008.Quantitative trait loci controlling water use efficiency and relatedtraits in Quercus robur L. Tree Genet. Genomes 4: 263–278.
Brugnoli E., Hubick K.T., von Caemmerer S., Wong S.C., and FarquharG.D., 1988. Correlation between the carbon isotope discriminationin leaf starch and sugars of C3 plants and the ratio of intercellularand atmospheric partial pressures of carbon dioxide. Plant Physiol.88: 1418–1424.
Brugnoli E. and Farquhar G.D., 2000. Photosynthetic fractionation ofcarbon isotopes. In: Leegood R.C., Sharkey T.D., von CaemmererS., (Eds.) Photosynthesis: Physiology and Metabolism, KluwerAcademic Publishers, pp. 399–434.
Bruschi P., Grossoni P., and Bussoti F., 2003. Within- and among-treevariation in leaf morphology of Quercus petraea (Matt.) Liebl. natu-ral populations. Trees 17: 164–172.
Collaku A. and Harrison S.A., 2005. Heritability of waterlogging toler-ance in wheat. Crop. Sci. 45: 722–727.
Craig H., 1957. Isotopic standards for carbon and oxygen and correctionfactors for massspectrometric analysis of carbon dioxide. Geochim.Cosmochim. Acta 12: 133–149.
Cregg B.M., Olivas-Garcia J.M., and Hennessey T.C., 2000. Provenancevariation in carbon isotope discrimination of mature ponderosa pinetrees at two locations in the Great Plains. Can. J. For. Res. 30:428–439.
Dickson R.E. and Larson P.R., 1975. Incorporation of 14C-photosynthateinto major chemical fractions of source and sink leaves of cotton-wood. Plant Physiol. 56: 185–193.
Dillen S., Marron N., Koch B., and Ceulemans R., 2008. Genetic varia-tion of stomatal traits and carbon isotope discrimination in two hy-brid poplar families (Populus deltoides “s9-2” × P. nigra “ghoy” andP. deltoides “s9-2” × P. trichocarpa “v24”. Ann. Bot. 102: 399–407.
Dreyer E., Le Roux X., Montpied P., Daudet F.A., Masson F., 2001.Temperature response of leaf photosynthetic capacity in seedlingsfrom seven temperate tree species. Tree Physiol. 21: 223–232.
Evans J.R., 1989. Photosynthesis and nitrogen relationships in leaves ofC3 plants. Oecologia 78: 9–19.
Farquhar G.D. and Richards R.A., 1984. Isotopic composition of plantcarbon correlates with water use efficiency of wheat genotypes. Aust.J. Plant Physiol. 11: 539–552.
Farquhar G.D., Ehleringer J.R., and Hubick K.T., 1989. Carbon isotopediscrimination and photosynthesis. Ann. Rev. Plant Physiol. PlantMol. Biol. 40: 503–537.
Field C. and Mooney H.A., 1986. The photosynthesis-nitrogen relation-ship in wild plants. In: Givnish T.J., (Ed.) On the Economy of PlantForm and Function, Cambridge University Press, Cambridge, pp.25–55.
Frak E., Le Roux X., Millard P., Dreyer E., Jaouen G., Saint-Joanis B.,and Wendler R., 2001. Changes in total leaf nitrogen and partition-ing of leaf nitrogen drive photosynthetic acclimation to light in fullydeveloped walnut leaves. Plant Cell Environ. 24: 1279–1288.
Franks P. and Farquhar G., 2007. The mechanical diversity of stomata andits significance in gas-exchange control. Plant Physiol. 143: 78–87.
Guehl J.M., Picon C., Aussenac G., and Gross P., 1994. Interactive ef-fects of elevated CO2 and soil drought on growth and transpirationefficiency and its determinants in two European forest tree species.Tree Physiol. 14: 707–724.
408p9

Ann. For. Sci. 66 (2009) 408 M. Roussel et al.
Hervé D., Fabre F., Berrios E.F., Leroux N., Alchaarani G., Planchon C.,Sarrafi A., and Gentzbittel L., 2001. QTL analysis of photosynthesisand water use status traits in sunflower (Helianthus annuus L.) undergreenhouse conditions. J. Exp. Bot. 52: 1857–1864.
Hetherington A.M. and Woodward F.I., 2003. The role of stomata in sens-ing and driving environmental change. Nature. 424: 901–908.
Johnsen K.H. and Major J.E., 1995. Gas exchange of 20-year-old blackspruce families displaying a genotype × environment interaction ingrowth rate. Can. J. For. Res. 25: 430–439.
Johnsen K.H., Flanagan L.B., Huber D.A., and Major J.E., 1999. Geneticvariation in growth, carbon isotope discrimination, and foliar N con-centration in Picea mariana: analyses from a half-diallel mating de-sign using field-grown trees. Can. J. For. Res. 29: 1727–1735.
Kabanova, S.N., Kabashnikova, L.F., and Chaika, M.T., 2000. Specifityof genetic determination of content of photosynthetic pigments inTriticale. Biol. Plant. 43: 529–535.
Kundu S.K. and Tigerstedt P.M.A., 1999. Variation in net photosynthesis,stomatal characteristics, leaf area and whole-plant phytomass pro-duction among ten provenances of neem (Azadirachta indica). TreePhysiol. 19: 47–52.
Lauteri M., Scartazza A., Guido M.C., and Brugnoli E., 1997. Geneticvariation in photosynthetic capacity, carbon isotope discriminationand mesophyll conductance in provenances of Castanea sativaadapted to different environments. Funct. Ecol. 11: 675–683.
Major J.E. and Johnsen K.H., 1996. Family variation in photosynthesisof 22-year-old black spruce: A test of two models of physiologicalresponse to water stress. Can. J. For. Res. 26: 1922–1933.
Marino B.D. and McElroy M.B., 1991. Isotopic composition of atmo-spheric CO2 inferred from carbon in C4 plant cellulose. Nature 349:127–131.
Masle J., Gilmore S.R., and Farquhar G.D., 2005. The ERECTA generegulates plant transpiration efficiency in Arabidopsis. Nature 436:866–870.
Monclus R., Dreyer E., Villar M., Delmotte F.M., Delay D., Petit J.M.,Barbaroux C., Le Thiec D., Bréchet C., and Brignolas F., 2006.Impact of drought on productivity and water use efficiency in 29genotypes of Populus deltoides × Populus nigra. New Phytol. 169:765–777.
Niinemets Ü., 1999. Research review. Components of leaf dry mass perarea – thickness and density – alter leaf photosynthetic capacity inreverse direction in woody plants. New Phytol. 144: 35–47.
Nobel P.S., 1999. Resistances and conductances – Transpiration. In:Physicochemical and environmental plant physiology. 2nd ed.Academic Press, San Diego, 635: pp. 301–303.
Parelle J., Zapater M., Scotti-Saintagne C., Kremer A., Jolivet Y., DreyerE., and Brendel O., 2007. Quantitative Trait Loci of tolerance towater-logging in a European oak (Quercus robur L.): physiologi-cal relevance and temporal effect patterns. Plant Cell Environ. 30:422–434.
Pearce D.W., Millard S., Bray D.F., and Rood S.B., 2006. Stomatal char-acteristics of riparian poplar species in a semi-arid environment. TreePhysiol. 26: 211–218.
Picon C., Guehl J.M., and Aussenac G., 1996. Growth dynamics, transpi-ration and water use efficiency in Quercus robur plants submitted toelevated CO2 and drought. Ann. Sci. For. 53: 431–446.
Pinheiro J., Bates D., DebRoy S., and Sarkar D., 2007. nlme: linear andnonlinear mixed effects models. R package version 3.1–81.
Ponton S., Dupouey J.L., Breda N., and Dreyer E., 2001. Carbon iso-tope discrimination and wood anatomy variations in mixed standsof Quercus robur and Quercus petraea. Plant Cell Environ. 24:861–868.
Ponton S., Dupouey J.L., Breda N., and Dreyer E., 2002. Comparisonof water use efficiency of seedlings from two sympatric oak species:genotype × environment interactions. Tree Physiol. 22: 413–422.
R Development Core Team, 2007. R: A language and environment for sta-tistical computing. R Foundation for Statistical Computing, Vienna,Austria. ISBN 3-900051-07-0, URL http://www.R-project.org.
Reich P.B., Ellsworth D.S., and Walters M.B., 1998. Leaf structure (spe-cific leaf area) modulates photosynthesis-nitrogen relations: evidencefrom within and across species and functional groups. Funct. Ecol.12: 948–958.
Scotti-Saintagne C., Bodenes C., Barreneche T., Bertocchi E., PlomionC., and Kremer A., 2004. Detection of quantitative trait loci control-ling bud burst and height growth in Quercus robur L. Theor. Appl.Genet. 109: 1648–1659.
Scotti-Saintagne C., Bertocchi E., Barreneche T., Kremer A., andPlomion C., 2005. Quantitative trait loci mapping for vegetativepropagation in pedunculate oak. Ann. For. Sci. 62: 369–374.
Sokal R.R. and Rohlf F.J., 2000. In: Biometry, 3rd ed. W.H. Freeman andCompany, New York, 887 p.
Takashima T., Hikosaka K., and Hirose T., 2004. Photosynthesis or per-sistence: nitrogen allocation in leaves of evergreen and deciduousQuercus species. Plant Cell Environ. 27: 1047–1054.
Von Caemmerer S. and Farquhar G.D., 1981. Some relationships betweenthe biochemistry of photosynthesis and the gas exchange of leaves.Planta 153: 376–387.
Webb A. and Baker A., 2002. Stomatal biology: new techniques, newchallenges. New Phytol. 153: 365–369.
Xu Z.H., Saffigna P.G., Farquhar G.D., Simpson J.A., Haines R.J.,Walker S., Osborne D.O., and Guinto D., 2000. Carbon isotope dis-crimination and oxygen isotope composition in clones of the F1 hy-brid between slash pine and Caribbean pine in relation to tree growth,water use efficiency and foliar nutrient concentration. Tree Physiol.20: 1209–1217.
408p10
Copyright © 2022 FDOKUMEN