Growth and form of Quercus robur and Fraxinus excelsior respond distinctly different to initial...
14
Journal of Forestry Research (2013) 24(1): 1−14 DOI 10.1007/s11676-013-0320-6 Growth and form of Quercus robur and Fraxinus excelsior respond dis- tinctly different to initial growing space: results from 24-year-old Nelder experiments Christian Kuehne • Edgar Kublin • Patrick Pyttel • Jürgen Bauhus Received: 2012-02-20; Accepted: 2012-04-05 © Northeast Forestry University and Springer-Verlag Berlin Heidelberg 2013 Abstract: Initial growing space is of critical importance to growth and quality development of individual trees. We investigated how mortality, growth (diameter at breast height, total height), natural pruning (height to first dead and first live branch and branchiness) and stem and crown form of 24-year-old pedunculate oak (Quercus robur [L.]) and European ash (Fraxinus excelsior [L.]) were affected by initial spacing. Data were recorded from two replicate single-species Nelder wheels located in southern Germany with eight initial stocking regimes varying from 1,020 to 30,780 seedlings·ha -1 . Mortality substantially decreased with increas- ing initial growing space but significantly differed among the two species, averaging 59% and 15% for oak and ash plots, respectively. In contrast to oak, the low self-thinning rate found in the ash plots over the investigated study period resulted in a high number of smaller intermediate or sup- pressed trees, eventually retarding individual tree as well as overall stand development. As a result, oak gained greater stem dimensions throughout all initial spacing regimes and the average height of ash significantly increased with initial growing space. The survival of lower crown class ashes also appeared to accelerate self-pruning dynamics. In comparison to oak, we observed less dead and live primary branches as well as a smaller number of epicormic shoots along the first 6 m of the lower stem The online version is available at http://link.springer.com Christian Kuehne ( ) • Jürgen Bauhus Institute of Silviculture, University of Freiburg, D-79085 Freiburg i.Br., Germany. E-mail: [email protected] ; Phone : +49-(0)761 203 8606 ; Fax : +49-(0)761 203 3781 Patrick Pyttel Faculty of Forests and Forestry, University of Applied Sciences Wei- henstephan-Triesdorf, Hans-Carl-von-Carlowitz-Platz 3, D-85354 Freising, Germany Edgar Kublin Department of Biometry and Informatics, Forest Research Station Baden-Württemberg, Postfach 708, D-79007 Freiburg, Germany Corresponding editor: Chai Ruihai of dominant and co-dominant ashes in all spacing regimes. Whereas stem form of both species was hardly affected by initial growing space, the percentage of brushy crowns significantly increased with initial spacing in oak and ash. Our findings suggest that initial stockings of ca. 12,000 seedlings per hectare in oak and 2,500 seedlings per hectare in ash will guarantee a sufficient number of at least 300 potential crop trees per hectare in pure oak and ash plantations at the end of the self-thinning phase, respectively. If the problem of epicormic shoots and inadequate self-pruning can be controlled with trainer species, the initial stocking may be reduced significantly in oak. Keywords: spacing trial; stocking; self-thinning; intraspecific competi- tion; qualification; spatially explicit modelling; generalized additive model Introduction Initial stocking or spacing influences tree growth and stand development in a number of important ways. In addition to well known general relationships between average growing space with individual tree volume and total stand yield, quality of trees can be strongly influenced (Savill et al. 1997; Pretzsch 2009). Branchiness, and the related branch free bole length, as well as stem and crown form are classical determinants of tree quality in most stages of stand development (e.g. Hein 2009a). Because of their economical potential, initial spacing is particularly impor- tant for valuable hardwood species. Here, high initial stocking provides a greater number of stems from which to select poten- tial future crop trees while simultaneously inducing self-pruning along the lower trunk sooner (e.g. Nyland 2002; Kerr 2003). However, effects on stem and crown form are not universal and high initial seedling density causes high investment costs if stands are regenerated artificially through planting or sowing. High stocking rates may also result in slow growth of individual trees, thus extending production times (Smith et al. 1997). Hence, forest managers pursuing the production of high quality timber in a classic-traditional manner without pruning (cf. Oosterbaan et al. ORIGINAL PAPER
-
Upload
uni-freiburg -
Category
Documents
-
view
2 -
download
0
Transcript of Growth and form of Quercus robur and Fraxinus excelsior respond distinctly different to initial...
Journal of Forestry Research (2013) 24(1): 1−14 DOI 10.1007/s11676-013-0320-6
Growth and form of Quercus robur and Fraxinus excelsior respond dis-tinctly different to initial growing space: results from 24-year-old Nelder experiments
Christian Kuehne • Edgar Kublin • Patrick Pyttel • Jürgen Bauhus Received: 2012-02-20; Accepted: 2012-04-05
© Northeast Forestry University and Springer-Verlag Berlin Heidelberg 2013
Abstract: Initial growing space is of critical importance to growth and
quality development of individual trees. We investigated how mortality,
growth (diameter at breast height, total height), natural pruning (height to
first dead and first live branch and branchiness) and stem and crown form
of 24-year-old pedunculate oak (Quercus robur [L.]) and European ash
(Fraxinus excelsior [L.]) were affected by initial spacing. Data were
recorded from two replicate single-species Nelder wheels located in
southern Germany with eight initial stocking regimes varying from 1,020
to 30,780 seedlings·ha-1. Mortality substantially decreased with increas-
ing initial growing space but significantly differed among the two species,
averaging 59% and 15% for oak and ash plots, respectively. In contrast to
oak, the low self-thinning rate found in the ash plots over the investigated
study period resulted in a high number of smaller intermediate or sup-
pressed trees, eventually retarding individual tree as well as overall stand
development. As a result, oak gained greater stem dimensions throughout
all initial spacing regimes and the average height of ash significantly
increased with initial growing space. The survival of lower crown class
ashes also appeared to accelerate self-pruning dynamics. In comparison
to oak, we observed less dead and live primary branches as well as a
smaller number of epicormic shoots along the first 6 m of the lower stem
The online version is available at http://link.springer.com
Christian Kuehne ( ) • Jürgen Bauhus
Institute of Silviculture, University of Freiburg, D-79085 Freiburg i.Br.,
Germany. E-mail: [email protected]; Phone :
+49-(0)761 203 8606 ; Fax : +49-(0)761 203 3781
Patrick Pyttel
Faculty of Forests and Forestry, University of Applied Sciences Wei-
henstephan-Triesdorf, Hans-Carl-von-Carlowitz-Platz 3, D-85354
Freising, Germany
Edgar Kublin
Department of Biometry and Informatics, Forest Research Station
Baden-Württemberg, Postfach 708, D-79007 Freiburg, Germany
Corresponding editor: Chai Ruihai
of dominant and co-dominant ashes in all spacing regimes. Whereas stem
form of both species was hardly affected by initial growing space, the
percentage of brushy crowns significantly increased with initial spacing
in oak and ash. Our findings suggest that initial stockings of ca. 12,000
seedlings per hectare in oak and 2,500 seedlings per hectare in ash will
guarantee a sufficient number of at least 300 potential crop trees per
hectare in pure oak and ash plantations at the end of the self-thinning
phase, respectively. If the problem of epicormic shoots and inadequate
self-pruning can be controlled with trainer species, the initial stocking
may be reduced significantly in oak.
Keywords: spacing trial; stocking; self-thinning; intraspecific competi-
tion; qualification; spatially explicit modelling; generalized additive
model
Introduction Initial stocking or spacing influences tree growth and stand development in a number of important ways. In addition to well known general relationships between average growing space with individual tree volume and total stand yield, quality of trees can be strongly influenced (Savill et al. 1997; Pretzsch 2009). Branchiness, and the related branch free bole length, as well as stem and crown form are classical determinants of tree quality in most stages of stand development (e.g. Hein 2009a). Because of their economical potential, initial spacing is particularly impor-tant for valuable hardwood species. Here, high initial stocking provides a greater number of stems from which to select poten-tial future crop trees while simultaneously inducing self-pruning along the lower trunk sooner (e.g. Nyland 2002; Kerr 2003). However, effects on stem and crown form are not universal and high initial seedling density causes high investment costs if stands are regenerated artificially through planting or sowing. High stocking rates may also result in slow growth of individual trees, thus extending production times (Smith et al. 1997). Hence, forest managers pursuing the production of high quality timber in a classic-traditional manner without pruning (cf. Oosterbaan et al.
ORIGINAL PAPER
Journal of Forestry Research (2013) 24(1): 1−14
2
2008) face an optimisation problem in regard to the initial seed-ling number per unit area when artificially regenerating species such as oak (Quercus spp.), ash (Fraxinus spp.) and maple (Acer spp.).
Understanding the relationship between growing space per tree and tree growth has therefore important economic implica-tions. This holds especially true for forest management in west-ern and central Europe, where production costs are of major concern, mainly owing to high wages and the scarcity of land. A common paradigm in Europe is that hardwood management needs to focus on the production of high quality timber to offer competitive goods on the global market (Plochmann 1992; Hein 2004; Spiecker et al. 2009). Published data on the quality devel-opment of different deciduous tree species under varying stock-ing levels, however, are scarce (e.g. Savill and Spillsbury 1991; Hein et al. 2009). There is only little information for major European broadleaved tree species, especially for valuable broadleaved tree species (but see papers on oak by Spellmann and Baderschneider 1988; Gürth and Velasquez 1991; Riley and Nixon 1993; Gaul and Stüber 1996, Schmaltz et al. 1997; Kerr 2003; Nagel and Rumpf 2010). Recommended initial stocking values found in textbooks and management guides vary widely and are mostly based on experience of forestry practice rather than experiments or other scientific evidence (Table 1).
Table 1. Recommended initial stocking levels (seedlings·ha-1) under open field conditions and for pure stands for the production of good to high quality timber of both studied species
Species Reference Country Stocking
Oak Lanier (1988) France 4,000-5,000
Kerr & Evans (1993) Great Britain 3,100
Joyce (1998) Ireland 6,600
(Quercus
robur,
*Q. petraea) Bary-Langer et al. (1999) Belgium 2,500
Burschel & Huss (2003) Germany >7,000 (-15,000*)
Valkonen (2008) Scandinavia 4,000-6,000
European ash Armand (1995) France 1,200
Joyce (1998) Ireland 3,300 (Fraxinus
excelsior) Claessens (2002) Belgium 2,500
Kerr (2003) Great Britain >2,500
Röhrig et al. (2006) Germany (>3,000-) 5,000
Dobrowolska et al. (2008) Poland 4,000-6,000
Systematic spacing plots developed by Nelder (1962) are de-
signed to evaluate a large number of different spacings within a very compact area (Redmond et al. 2005). They may reduce the error attributable to site heterogeneity and offer conservation of experimental material when compared to randomised conven-tional rectangular blocks (Galinski et al. 1994).
This paper presents results from a 22-year-old systematic Nelder spacing trial with two important European tree species, pedunculate oak (Quercus robur L.) and European ash (Fraxinus excelsior L.). The main purpose of the present study was to investigate the effects of initial stocking on growth and form. Primary objectives were (1) to analyse the relationship between planting density and mortality as well as height and diameter growth-patterns, (2) to investigate the effects of varying stocking
levels on tree quality, and (3) to derive silvicultural recommen-dations in terms of optimal initial stocking. Materials and methods Study site and experimental design The study site is situated in the Southern Mooswald forest dis-trict, close to the western outskirts of Freiburg in southwest Germany. It is located on flat terrain at approximately 220 m a.s.l. The study site is enclosed by stands of oaks (Q. robur L. and Q. rubra L.), ash (F. excelsior) and sycamore (Acer pseudoplatanus L.) which are of comparable age and height as the study trees. The warm Atlantic climate is characterized by a mean annual temperature of approx. 11°C and a mean annual precipitation of about 800 mm, with the majority of precipitation occurring during the growing season between May and September (ca. 450 mm, Bläsing 2008). Situated in a former floodplain area of the river Dreisam, a gleyic cambisol (FAO 1998) has developed from the alluvial deposits, which are covered by a layer of loess of variable thickness (Villinger 2008). The well-drained soil is relatively highly decarbonised and of sandy texture. It is influ-enced by a fluctuating ground water table mainly in the winter and spring months (Hügin 1990). Overall, site conditions provide good but variable growth potential for both studied species. Based on inventory data of the studied stand and height meas-urements of dominant study trees of either species, ash exhibits a moderate growth rate resulting in a mean annual increment (over 100 years) of 7 m3·ha-1·a-1 while the average volume growth of pedunculate oak is estimated at 8 m3·ha-1·a-1 (Landesforstverwal-tung Baden-Württemberg 1993).
In spring 1985, three complete Nelder circle plots of type 1a (Nelder 1962) were established for each species by planting 2-year-old, bare-root nursery seedlings of local provenance (Ober-rheingraben). In fall 1986, seedling height averaged 76 and 136 cm for oak and ash, respectively. Each Nelder wheel included 24 spokes of 10 seedlings that were planted in concentric rings and at increasing distances and decreasing densities along the spokes (Table 2). The inner- and outermost spacing rings served as guard rows to prevent edge effects. Although separated by skid-ding trails from the surrounding woodland it cannot be fully ruled out that the growth of a few outer guard trees that were not analysed had been slightly affected by the adjacent stands in recent years. Excluding the guard rows from the data analysis reduced the total of 240 seedlings per Nelder wheel to 192 poten-tial study trees within each of the wheels. This permitted the analyses of eight densities ranging in growing space from 0.33 to 9.8 m2 and in initial stocking from 30,780 to 1,020 seedlings·ha-1. Rectangularity (ratio of inter- and intra-ring distances) within the implemented growing space regimes remained constant at 1.1 (see Nelder 1962 for additional details on spatial arrangement of trees).
Mortality within the first two growing seasons after planting amounted to 17.6% and 2.5% for oak and ash, respectively. Initial losses were attributed to transplant-related root system
Journal of Forestry Research (2013) 24(1): 1−14
3
damages and the resulting planting shock. Replacement of dead seedlings and form pruning (removal of forks) therefore were carried out in fall 1986 to guarantee uniform conditions among all study trees of each spacing regime at the start of the experi-ment. Seedlings planted in 1986 were of the same origin as the ones initially used in 1985. In addition, their height was compa-rable to the height that the initially used seedlings reached after two growing seasons in the field. Because of a nearby skidding trail and a temporary water-bearing drainage ditch, a varying number of seedlings were not replaced within two affected ash plots. We therefore excluded another 15 “non-replaced trees” and, as a consequence of this, 65 trees growing without eight initial direct neighbours from the analysis of the eight investi-gated spacing regimes. This procedure reduced the total number of potential ash study trees to 496 while the final number of oak study trees remained at 576.
Table 2. Design attributes and respective traditional planting equiva-
lents of the experimental Nelder plots in the federal state of Baden-
Wuerttemberg, Germany
Spacing
regime
Distance to
plot center
(m)
Growing
space per
seedling (m2)
Spacing
equivalent
(m × m)
Initial stocking
equivalent
(seedlings·ha-1)
1 (guard) 1.80 0.22 1× 0.2 45,000
2 2.19 0.33 1 × 0.33 30,780
3 2.79 0.53 1 × 0.5 18,765
4 3.55 0.84 1 × 0.8 11,800
5 4.53 1.42 1 × 1.5 7,060
6 5.77 2.28 1 × 2.25 4,385
7 7.36 3.73 2 × 2 2,680
8 9.38 6.00 2 × 3 1,665
9 11.96 9.80 2 × 5 1,020
10 (guard) 15.24 15.84 3 × 5 631
The study site had been fenced till 1995. Mechanical under-
story control was conducted continuously to assure that the influence of the competing vegetation on the growth of the study trees was minimized (pers. communication J. Huss). No other tending or thinning activities have been implemented.
Defoliation events by caterpillars of Tortrix viridana, Erannis defoliaria, Operophtera brumata and associated species were observed in the study area during the investigated period, how-ever study trees were not killed by these disturbances. Data collection and analysis For the following reasons, we did not compute actual growing space or exclude live trees without all eight original neighbours for data analysis as it has been done in previous analyses of younger Nelder plots in ash (Kerr 2003) and in conifer Nelder trials with lower mortality (Peracca and O’Hara 2008):
(1) This study aimed to provide information on the effects of initial growing space on tree growth and quality. Under most common silvicultural regimes for ash and oak, growing space is usually not actively managed between initial establishment and the growth stage observed here. While negative selection, i.e. the removal of wolf trees, is often carried out, this does not aim to
control growing space. (2) Current tree characteristics relate only to some extent to
the actual growing space since the study trees have been shaped continually by varying individual growing space throughout the study period of 22 years.
(3) High mortality rates especially within oak plots resulted in a very low number of trees completely unaffected by neighbour mortality (e.g. a total of five trees in all oak plots).
Using initial growing space as independent variable resolves the problem of the steadily changing growing space of individual trees and the resulting varying effects on tree development in the course of such an experiment. It also forms an applicable basis for the implementation of the findings by forest practitioners.
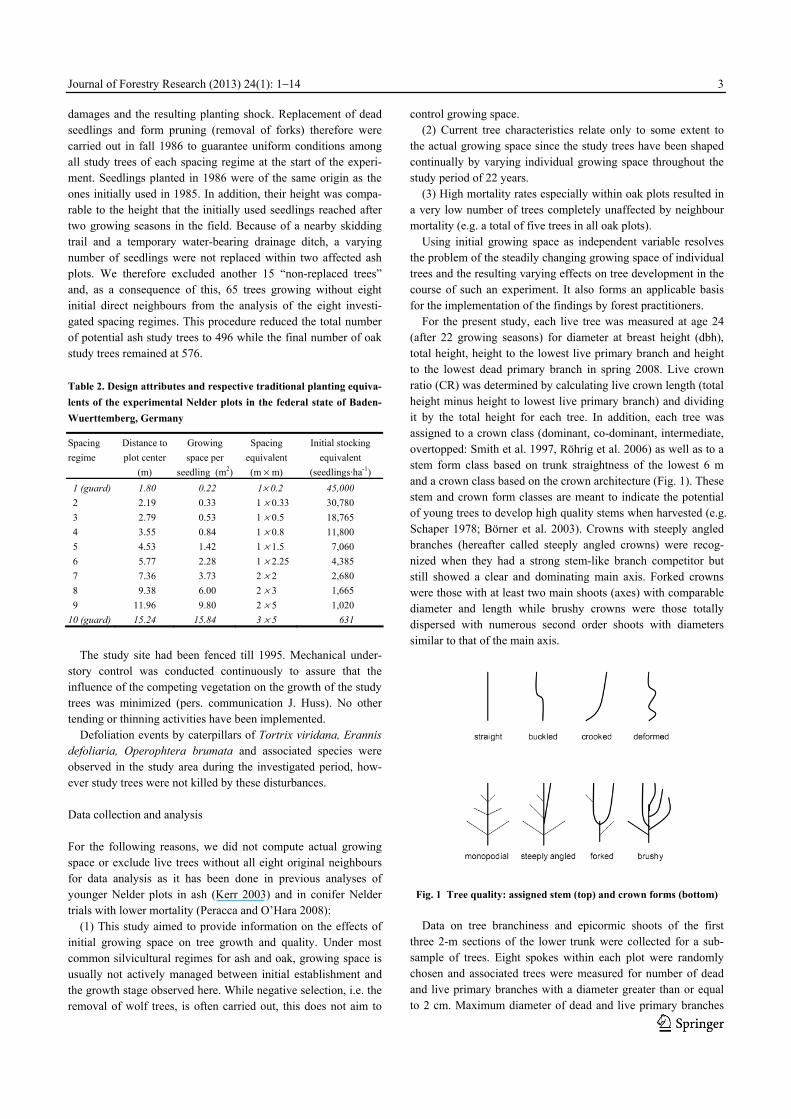
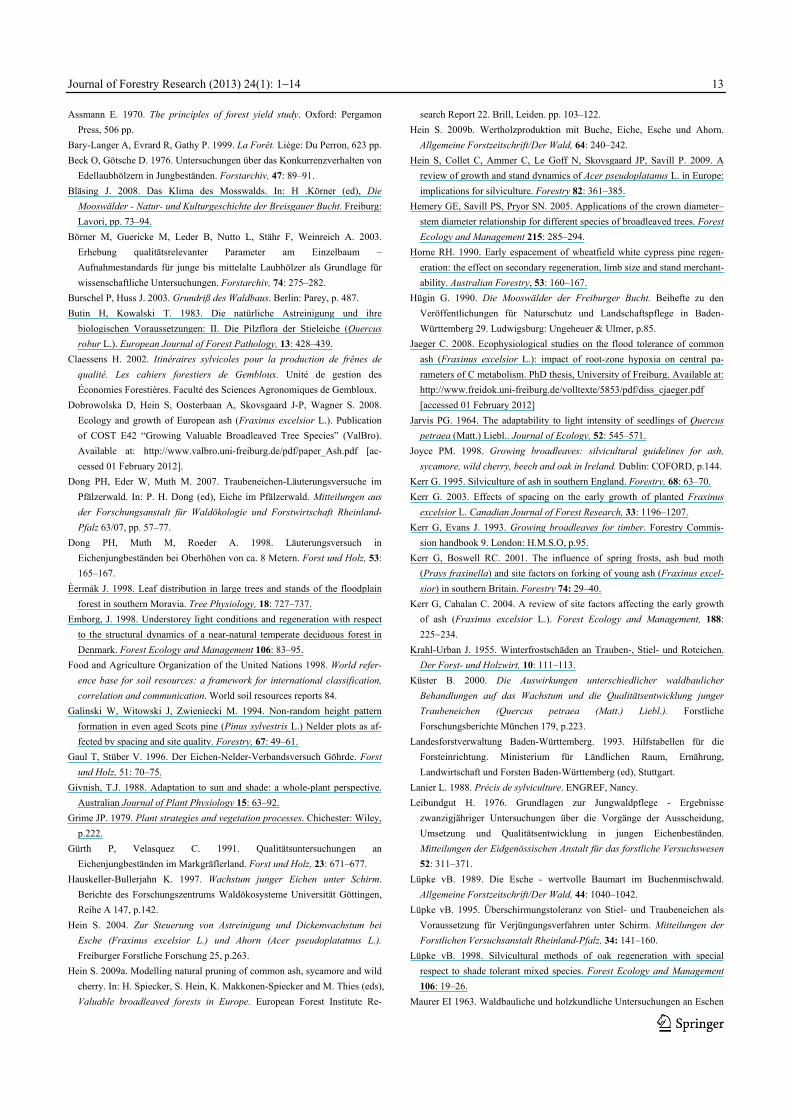
For the present study, each live tree was measured at age 24 (after 22 growing seasons) for diameter at breast height (dbh), total height, height to the lowest live primary branch and height to the lowest dead primary branch in spring 2008. Live crown ratio (CR) was determined by calculating live crown length (total height minus height to lowest live primary branch) and dividing it by the total height for each tree. In addition, each tree was assigned to a crown class (dominant, co-dominant, intermediate, overtopped: Smith et al. 1997, Röhrig et al. 2006) as well as to a stem form class based on trunk straightness of the lowest 6 m and a crown class based on the crown architecture (Fig. 1). These stem and crown form classes are meant to indicate the potential of young trees to develop high quality stems when harvested (e.g. Schaper 1978; Börner et al. 2003). Crowns with steeply angled branches (hereafter called steeply angled crowns) were recog-nized when they had a strong stem-like branch competitor but still showed a clear and dominating main axis. Forked crowns were those with at least two main shoots (axes) with comparable diameter and length while brushy crowns were those totally dispersed with numerous second order shoots with diameters similar to that of the main axis.
Fig. 1 Tree quality: assigned stem (top) and crown forms (bottom)
Data on tree branchiness and epicormic shoots of the first
three 2-m sections of the lower trunk were collected for a sub-sample of trees. Eight spokes within each plot were randomly chosen and associated trees were measured for number of dead and live primary branches with a diameter greater than or equal to 2 cm. Maximum diameter of dead and live primary branches
Journal of Forestry Research (2013) 24(1): 1−14
4
within each 2-m section and the respective angles (vertical devia-tion from stem axis) of these branches were also determined. Epicormic branching was recorded using classes (0, 1–5, 6–10 or more than 10 shoots) after counting all secondary shoots within each of the three 2-m sections. Epicormic shoots occurring in clusters were counted as a single sprout. If a tree of a specific spacing regime was missing along a selected spoke, the next living individual present in clockwise direction was investigated. The sub-sample of trees measured to determine branchiness comprised 192 potential study trees for each species. However, mortality of oaks within inner rings of the Nelder trials reduced tree numbers to a total of 157 trees. Only 8, 14, 18 and 21 trees could be measured for the oak regimes with initial growing space of 0.33, 0.53, 0.84 and 1.42 m2, respectively (see Table 2).
Table 3 lists quality classes and respective assessment criteria considered to calculate values for potential crop trees. Class definitions are partly based upon Butin and Kowalski (1983), Mosandl et al. (1988) and Schmaltz et al. (1997), who studied growth and quality of potential crop trees of sessile oak (Q. petraea) in stands at different development stages and of various initial spacing regimes, respectively. Table 3. Assigned properties of potential crop tree quality classes.
Quality Criteria
High Good Moderate
Crown class Dominant or co-dominant
Stem form Straight or buckled
Crown form Monopodial Steeply angled
or monopodial
Forked above 6
m in tree height
Height to lowest
live branch
Greater than or equal
to 6 m
Greater than or equal to 4 m
Branchinessa No dead branches
greater than 4 cm in
diameter, less than 6
epicormic shoots
No live and dead branches greater
than 4 cm in diameter, less than 11
epicormic shoots
a Along the lower 6 m of the trunk
We tested relationships between initial spacing and tree
growth and quality with regression modelling. Empirical model building is characterized by a general conflict between using a complex model for the mean function and a fairly simple model for the variance-covariance structure of the random error term, and using a simple model for the mean function and a more complex error structure. Spacing effects and other influences on tree growth and quality are captured in the mean function of the regression model. We therefore focused on modelling and under-standing the mean function in a more sophisticated statistical manner.
Initial explorative data analysis with simple scattergrams and box plots calculated separately for each species was initially used for determining the empirical distributions of the various re-sponse variables. Crown class group (dominant and co-dominant individuals vs. intermediate and suppressed ones) was used as a splitting variable.
An additional visual inspection of simple parametric standard regression model fits assuming independent and equally distrib-
uted random errors with contour plots and empirical variograms revealed spatial correlations in the residuals (Pinheiro and Bates, 2000). We therefore used spatially explicit modelling as the assumption of independent random errors would have provided misleading statistical conclusions in the case of correlated errors caused by biased estimates of the error variance-covariance matrix. Moreover, with error correlations in the data the ordinary least squares estimates may be extremely inefficient with possi-bly big mean squared errors.
In classical geostatistics, spatial measurements
, ,
are assumed to be realizations of a Gaussian
random field which is characterized by the mean or trend
function , the variance
and the correlation function
, where s and t are location
variables. Normally the variance and correlation functions are parametric functions with a few numbers of parameters. In the classical model of geostatistics, also known as kriging, the un-derlying regression model for the response is assumed to be
(1)
with a linear spatial trend function , a sta-
tionary Gaussian random field with mean 0 and variance
, an isotropic, parametric correlation function only
depending on the distance between two sample
location s and t and with mutually independent measurement
errors with zero mean and variance . It can be shown
that the classical kriging model is a subset of the much wider and flexible class of penalized radial smoothers (Nychka 2000). With measurements from d different sample locations s(1), … , s(d) the observation equation of the classical kriging model (Eqn. (1)) can be equivalently rewritten in form of a radial smoother
)()(
)()()()()(
ssf
sXssfssy
geo
Tgeo
∈+
+=∈++= βμ (2)
with a spatial random effect
and basis functions obtained from the spatial correlation function,
i.e. . The smoothness of the spatial effect
is controlled by a penalty term with
and
(see Ruppert et al.
2003). The transformation of the kriging model to a penalized
smoothing regression with radial basis functions comes along with some benefits. Estimation of regression and variance pa-rameters, inferential test for covariates effects, confidence inter-vals for the mean function as well as optimal spatial predictions
Journal of Forestry Research (2013) 24(1): 1−14
5
can be calculated within the well-founded framework of linear mixed model theory. Of particular interest for model building is the fact that one can easily extend the smoothing model (Eqn.(2))
in several ways. The parametric spatial trend in the
classical kriging for instance, may be supplemented by nonpara-metric smooth components depending on further covariates
i.e.
with
, where
is a smooth function with a basis representation
for some appropriate basis func-
tions , i = 1, … , q. Moreover, penalized smoothing
regression is also applicable in situations where the response distribution is a member of an exponential family, e.g. with a binomial response distribution. The methodological framework for all these extensions is known as Generalized Additive Model (GAM, Wood 2006).
Following the initial explorative data analysis we therefore used GAM to analyse the correlation between tree growth and quality parameters as response variables and initial growing space (GS) as the main predictor variable:
or
(3) ,
where si = (northingi, eastingi) is the location of sample tree i,
if the crown class of the ith sample tree is
classified inferior (intermediate or suppressed individual) and was defined accordingly. For the two dimensional
smoother which captures the spatial variability an
isotropic thin-plate regression spline basis function was used. This spline basis is independent of the coordinate system actually used. The error terms εi was assumed to be independent and identically distributed random variables with zero mean and variance σ2.
For a proportional response variable, e.g. mortality, we used a logit transformation for the mean response, i.e.
,
, together with a binomial variance function
for measurement error εi.
The models were separately fitted for either tree species with the R package gam{mgcv} (R Development Core Team 2011) and extensively controlled by numerical tests and visual inspec-tions.. The smoothing parameters were selected by cross valida-tion techniques (see Wood 2006). Standard F-tests and plots of the estimated effects combined with 95% confidence limits were used for model selection. In order to avoid arte facts and biased estimates caused by too smooth regression curves, we didn’t penalize wiggly response functions too much in this phase of the analysis. The spatial independence assumption concerning the residual error component was examined again with the help of semivariograms and contour plots.
Spatial structures had disappeared in the final GAM models and the residuals didn’t show any bias. Points in the empirical variograms were scattered randomly around 1 indicating spatial independence (Pinheiro and Bates, 2000).
Overall the final GAM models (Eqn.(3)) and in particular the model for spatial variability and the residual error components proved to be appropriately specified. Therefore, and in contrast to the aforementioned parametric standard regression models, the fitted GAM models could serve as a basis for statistically reliable comparisons of response functions for oak and ash, for valid tests of growing space effects and for a well founded statistical inves-tigation of the differential effect of crown class.
However, as the calculated GAM models included a two-dimensional smooth function for easting and northing the ex-pected response for the same level of growing space, species, crown class group etc. would have varied from location to loca-tion. Hence it was necessary to average out spatial effects to eliminate potential bias caused by unknown local confounders. With the R Software gam{mgcv} we calculated predictions and Bayesian confidence intervals for the smooth regression func-tions on a fine grid of growing space levels for either crown class group and for different levels of other influencing factor vari-ables. The calculations were repeated for every sample location. Averaging the predictions over all sample locations resulted in a final spatially adjusted mean response function. Our statistical inference was mainly based on the comparison of the adjusted mean functions and confidence intervals. Differences between species or crown class groups were reported as statistically sig-nificant when the confidence intervals of the compared models did not overlap.
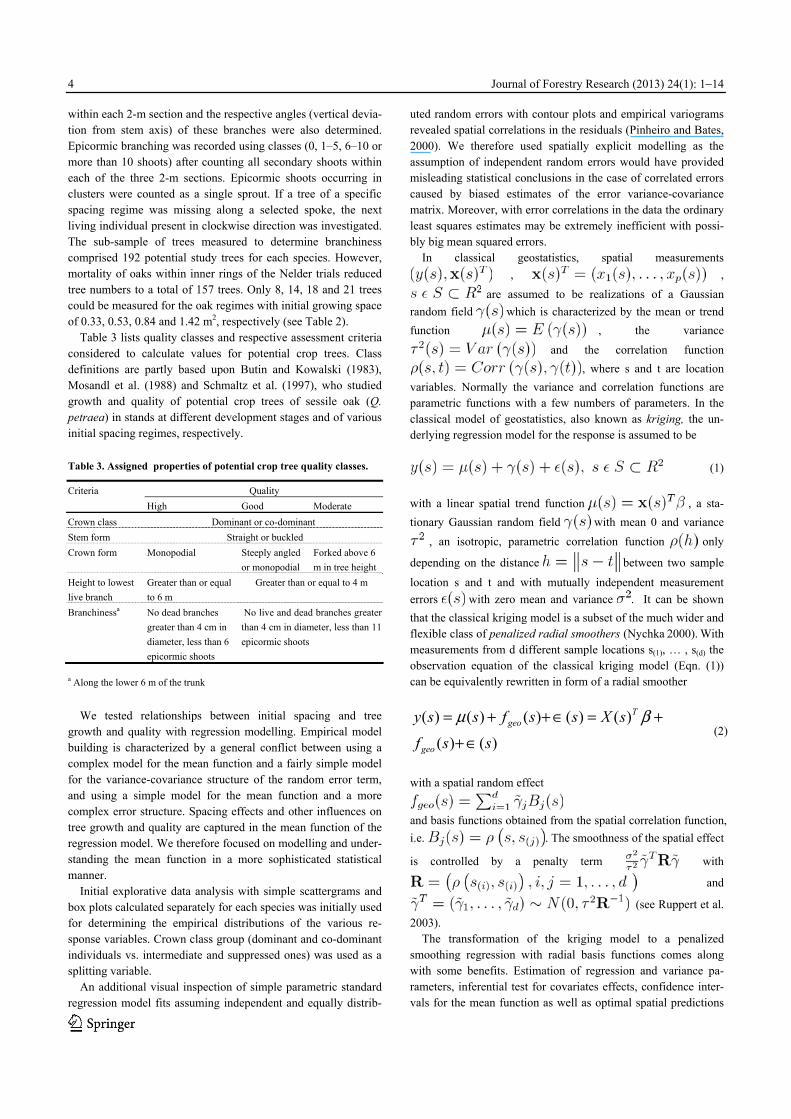
GAM smoothers are well suited for reliable statistical infer-ences but not for general prediction purposes because of there instable prediction behaviour for predictor values lying outside the limits of the experimental data used for model calibration. We therefore double smoothed the mean response curves by fitting a parametric model. We emphasize that the parametric model should not be used for statistical inference but only for prediction. As aforementioned, unbiased regression estimates are available when measurement errors are unbiased but not neces-sarily uncorrelated. Correlated errors, however, will result in invalid confidence intervals and wrong conclusions. If necessary, one could also double smooth the Bayesian confidence intervals with a parametric function to provide approximate error bands for the parametric response curves. A similar approach has already been proposed by Nelder (1962), recommending a block wise re-gression analysis followed by the treatment of the regression pa-rameters as if they were a random sample. Results Mortality We found statistically significant relationships between growing space and oak mortality as well as ash mortality (Table 4 and 5), but the species showed significantly different mortality patterns.
Journal of Forestry Research (2013) 24(1): 1−14
6
In 2008, the average plot mortality totalled nearly 59% for oak but only 15% for ash. Oak had greater mortality rates in all initial
spacings while in ash there was occasionally no mortality at an initial growing space of 1.42 m2 or greater (Fig. 2).
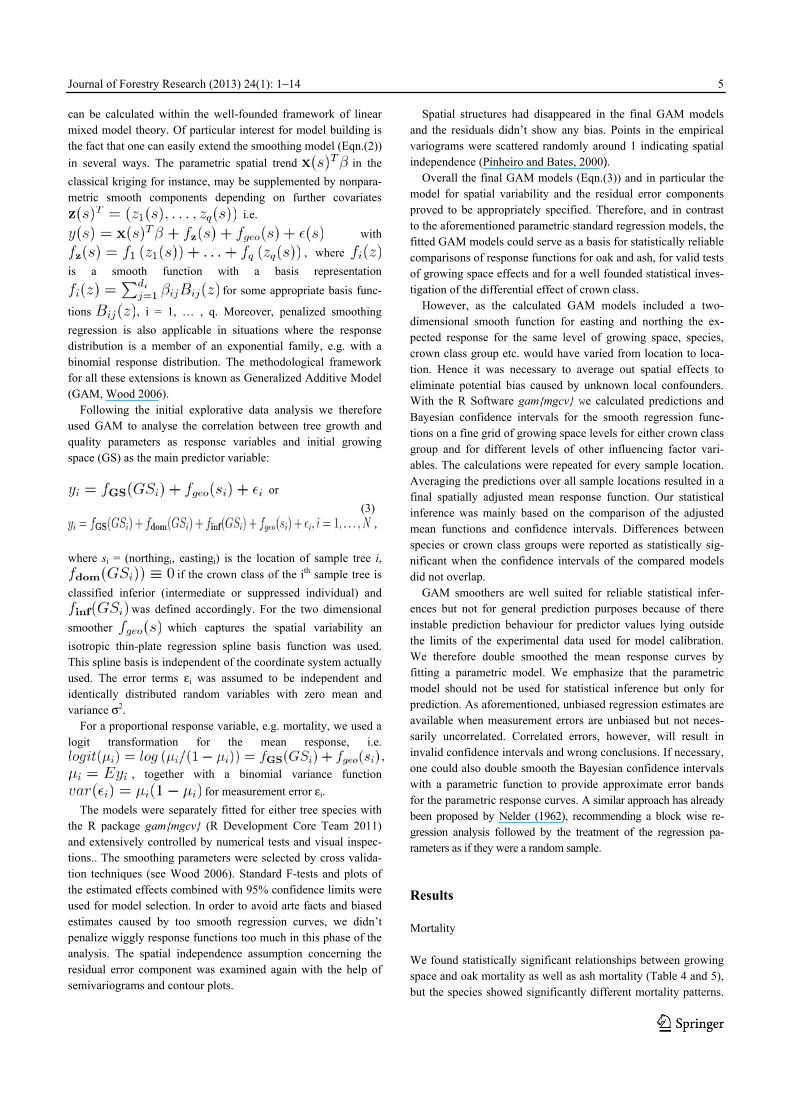
Table 4. Parameters and properties of the generalized additive models for Q. robur.
Parameter* Coefficients of parametric terms Smooth terms Model statistics
Estimate Standard
error
Sign. Edf Sign. R2 (adj.) Deviance
explained (%)
GCV
score
N
Mortality Intercept 0.414 0.087 <0.001 ƒGS 2.890 <0.001 0.881 87.3 0.04 24
DBH Dom 13.925 0.221 <0.001 ƒdom 1.142 <0.001 0.550 95.7 7.50 238
Inf 9.197 0.292 <0.001 ƒinf 0.955 <0.001
ƒgeo 2.828 0.723
Height Dom 12.605 0.106 <0.001 ƒdom 1.107e-09 n.a. 0.594 98.9 1.78 238
Inf 9.504 0.142 <0.001 ƒinf 0.913 0.037
ƒgeo 12.890 <0.001
Height1stlive Dom 4.810 0.093 <0.001 ƒdom 2.653 <0.001 0.397 95.0 1.36 238
Inf 4.621 0.124 <0.001 ƒinf 2.071 <0.001
ƒgeo 4.090 0.002
Height1stdead Dom 2.255 0.064 <0.001 ƒdom 3.793 <0.001 0.492 90.4 0.63 238
Inf 2.078 0.085 <0.001 ƒinf 3.660 <0.001
ƒgeo 1.779 0.042
Height/DBH Dom 94.940 1.377 <0.001 ƒdom 1.157 <0.001 0.468 97.5 297.2 238
Inf 107.944 1.843 <0.001 ƒinf 3.837 <0.001
ƒgeo 5.038 0.647
Crown ratio Dom 0.484 0.036 <0.001 ƒdom 2.790 <0.001 0.471 47.5 0.05 238
Inf 0.042 0.047 0.373 ƒinf 2.013 <0.001
ƒgeo 1.156 0.145
Stem form Intercept 0.543 0.202 0.014 ƒGS 2.111 0.020 0.426 38.8 0.24 24
Crown form Intercept 0.718 0.263 0.012 ƒGS 0.721 0.131 0.135 12.6 0.39 24
* Height1stlive/1stdead: height to lowest live or dead branch, crown ratio: live crown ratio, stem and crown form: cumulative percentage of straight and buckled
stems or cumulative percentage of monopodial and steeply angled crowns, respectively, of dominant and co-dominant trees only
Table 5. Parameters and properties of the generalized additive models for F. excelsior.
Parameter* Coefficients of parametric terms Smooth terms Model statistics
Estimate Standard
error
Sign. Edf Sign. R2 (adj.) Deviance
explained (%)
GCV
score
N
Mortality Intercept -1.844 0.148 <0.001 ƒGS 3.380 0.034 0.558 51.5 0.07 24
DBH Dom 8.753 0.142 <0.001 ƒdom 2.142 0.003 0.738 94.7 3.20 395
Inf 4.441 0.131 <0.001 ƒinf 0.721 0.006
ƒgeo 15.887 <0.001
Height Dom 11.939 0.139 <0.001 ƒdom 1.561 0.573 0.691 97.2 3.13 395
Inf 7.626 0.130 <0.001 ƒinf 2.864 0.008
ƒgeo 14.889 <0.001
Height1stlive Dom 5.367 0.133 <0.001 ƒdom 1.738 <0.001 0.237 88.6 2.85 395
Inf 3.928 0.122 <0.001 ƒinf 0.842 0.049
ƒgeo 5.952 <0.001
Height1stdead Dom 3.543 0.100 <0.001 ƒdom 3.484 <0.001 0.216 85.3 1.51 395
Inf 2.377 0.087 <0.001 ƒinf 0.657 0.172
ƒgeo 2.765 <0.001
Height/DBH Dom 144.345 2.329 <0.001 ƒdom 2.177 <0.001 0.594 97.3 861.6 395
Inf 182.201 2.158 <0.001 ƒinf 3.592 <0.001
ƒgeo 12.101 <0.001
Crown ratio Dom 0.209 0.049 <0.001 ƒdom 1.866 <0.001 0.317 30.8 0.09 395
Inf -0.102 0.045 0.022 ƒinf 1.483 <0.001
ƒgeo 1.440 0.110
Stem form Intercept 0.760 0.190 <0.001 ƒGS 0.839 0.049 0.219 18.9 0.20 24
Crown form Intercept 0.167 0.174 0.345 ƒGS 0.839 0.039 0.227 21.1 0.19 24
* see table 4
Journal of Forestry Research (2013) 24(1): 1−14
7
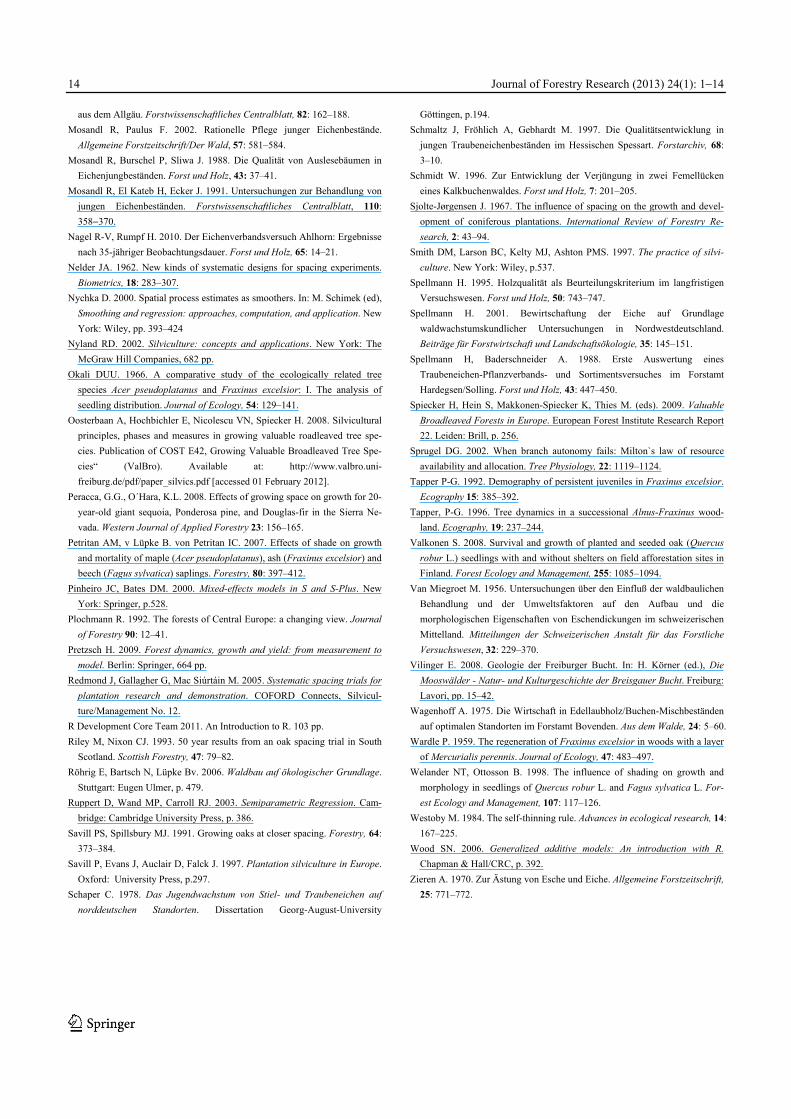
Fig. 2 Relationships between initial growing space and mortality of Q. robur and F. excelsior. Plotted values show plot-specific means. The
solid and dotted lines represent the modelled trends and the confidence
intervals, respectively.
The varying density-dependent mortality rates of the oak plots
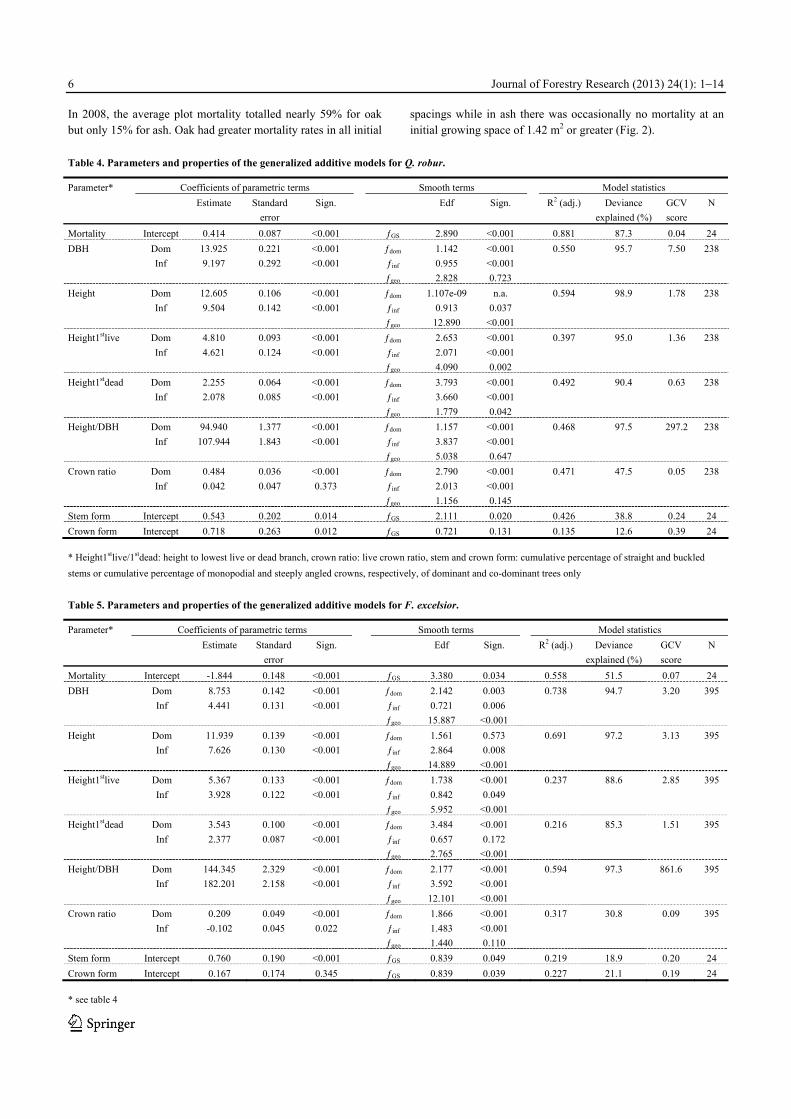
resulted in rapidly converging tree densities among the initial spacing regimes, e.g. dropping from over 30,300 to just 3,400 trees per hectare on average in the innermost spacing ring. Throughout all spacing regimes, oak density ranged from 737 to 3,669 individuals per hectare. Average densities in ash, however, converged much less and still ranged between 951 and 21,164 trees per hectare. Stem diameter Diameter at breast height (dbh) significantly increased with increasing growing space for both species irrespective whether all or only dominant and co-dominant trees were investigated (Table 4 and 5). Differences between species were also statisti-cally significant. Within all spacing regimes, oak showed consis-tently greater diameter growth than ash with current mean and maximum dbh of 12.2 and 25.2 cm, respectively, while radial growth of ash resulted in mean and maximum dbh of 6.4 and 18.7 cm (Fig. 3). When compared to average diameters of the entire tree populations, mean diameters of dominant and co-dominant trees in oak and ash, respectively, were on average about 1.6 and 2.4 cm greater throughout all spacing regimes. Total tree height Initial spacing had no significant influence on total height of all or only the dominant and co-dominant oaks (Table 4). In contrast, total ash height was positively related to increasing initial spac-ing when considering all trees but not if only dominant and co-dominant individuals were analysed (Table 5).
Differences in average total height between all live trees and
the dominant and co-dominant trees averaged 1.1 and 2.6 m for oak and ash, respectively. Height growth substantially differed between species as well with oak reaching current average and maximum values of 11.5 and 17 m, and ash 9.5 and 15.4 m, respectively. However, total tree height models derived for dominant and co-dominant oaks or ashes did not differ signifi-cantly whereas models based on all oak and ash height measure-ments, respectively, revealed statistically significant differences at the four innermost spacing regimes.
Fig. 3 Relationships between initial growing space and diameter at
breast height (dbh) for dominant and co-dominant individuals of Q. robur and F. excelsior. Plotted values and ranges show observed means
and respective standard errors. The solid and dotted lines represent the
modelled trends and the confidence intervals, respectively.
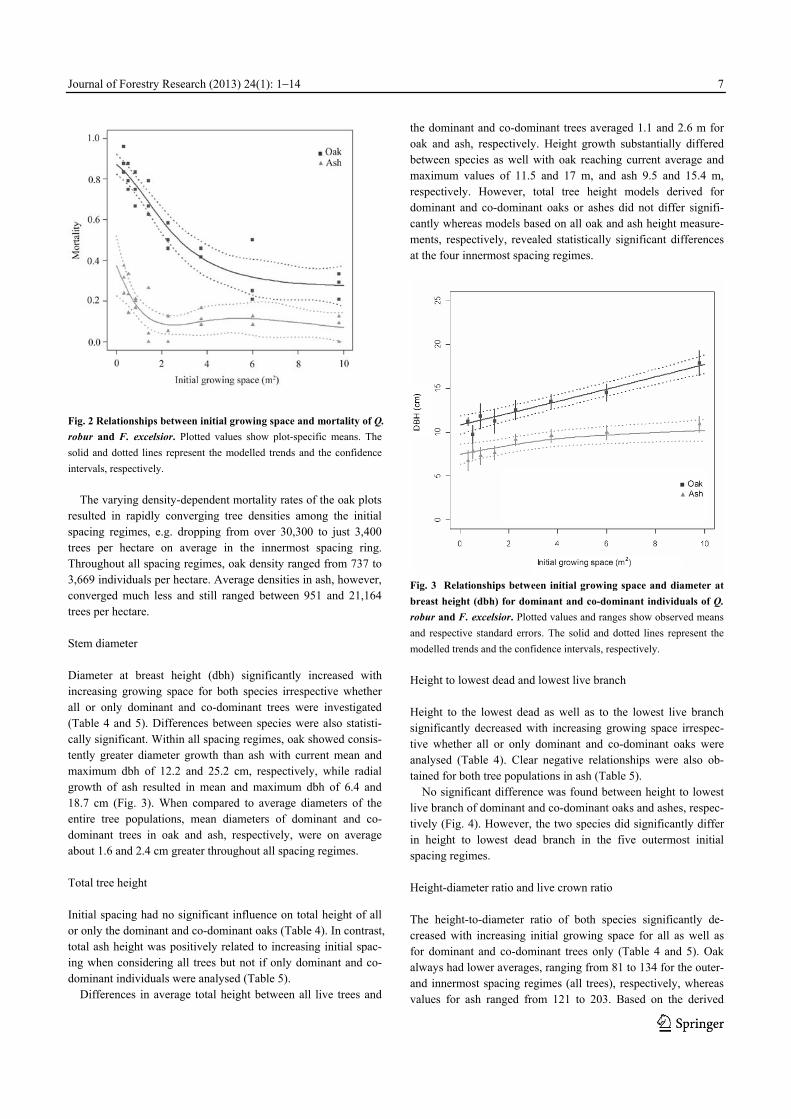
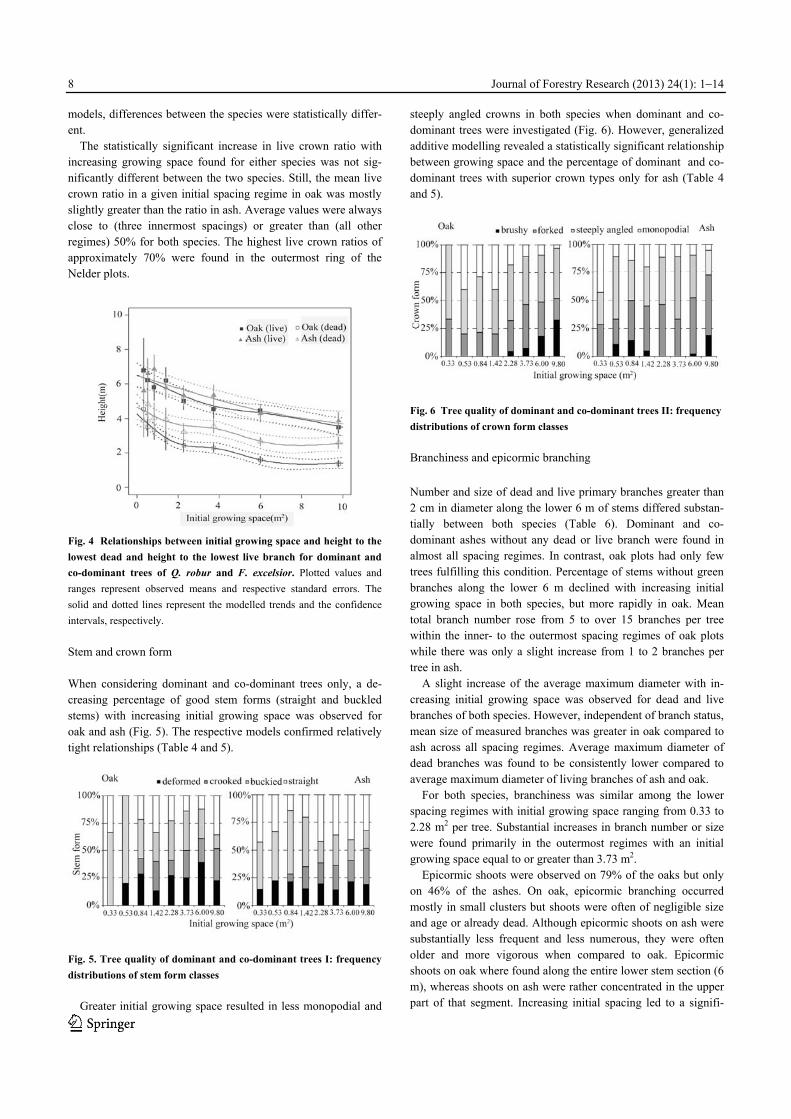
Height to lowest dead and lowest live branch Height to the lowest dead as well as to the lowest live branch significantly decreased with increasing growing space irrespec-tive whether all or only dominant and co-dominant oaks were analysed (Table 4). Clear negative relationships were also ob-tained for both tree populations in ash (Table 5).
No significant difference was found between height to lowest live branch of dominant and co-dominant oaks and ashes, respec-tively (Fig. 4). However, the two species did significantly differ in height to lowest dead branch in the five outermost initial spacing regimes. Height-diameter ratio and live crown ratio The height-to-diameter ratio of both species significantly de-creased with increasing initial growing space for all as well as for dominant and co-dominant trees only (Table 4 and 5). Oak always had lower averages, ranging from 81 to 134 for the outer- and innermost spacing regimes (all trees), respectively, whereas values for ash ranged from 121 to 203. Based on the derived
Journal of Forestry Research (2013) 24(1): 1−14
8
models, differences between the species were statistically differ-ent.
The statistically significant increase in live crown ratio with increasing growing space found for either species was not sig-nificantly different between the two species. Still, the mean live crown ratio in a given initial spacing regime in oak was mostly slightly greater than the ratio in ash. Average values were always close to (three innermost spacings) or greater than (all other regimes) 50% for both species. The highest live crown ratios of approximately 70% were found in the outermost ring of the Nelder plots.
Fig. 4 Relationships between initial growing space and height to the
lowest dead and height to the lowest live branch for dominant and
co-dominant trees of Q. robur and F. excelsior. Plotted values and
ranges represent observed means and respective standard errors. The
solid and dotted lines represent the modelled trends and the confidence
intervals, respectively.
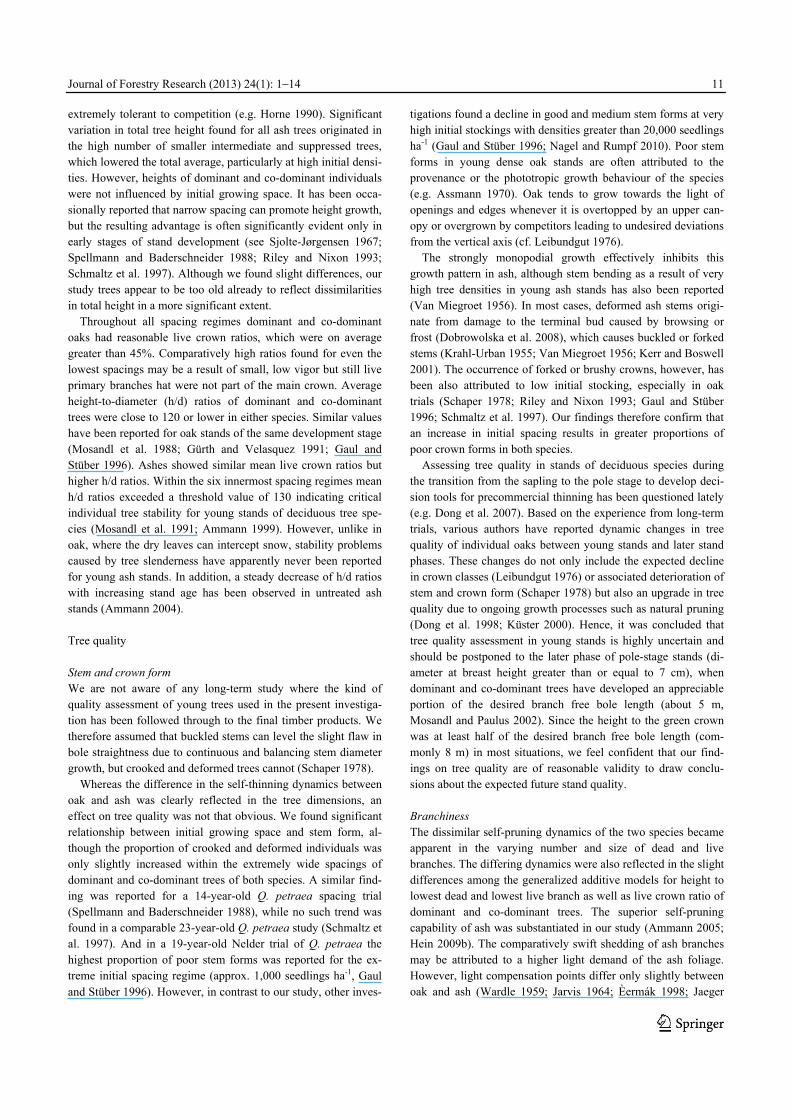
Stem and crown form When considering dominant and co-dominant trees only, a de-creasing percentage of good stem forms (straight and buckled stems) with increasing initial growing space was observed for oak and ash (Fig. 5). The respective models confirmed relatively tight relationships (Table 4 and 5).
Fig. 5. Tree quality of dominant and co-dominant trees I: frequency
distributions of stem form classes
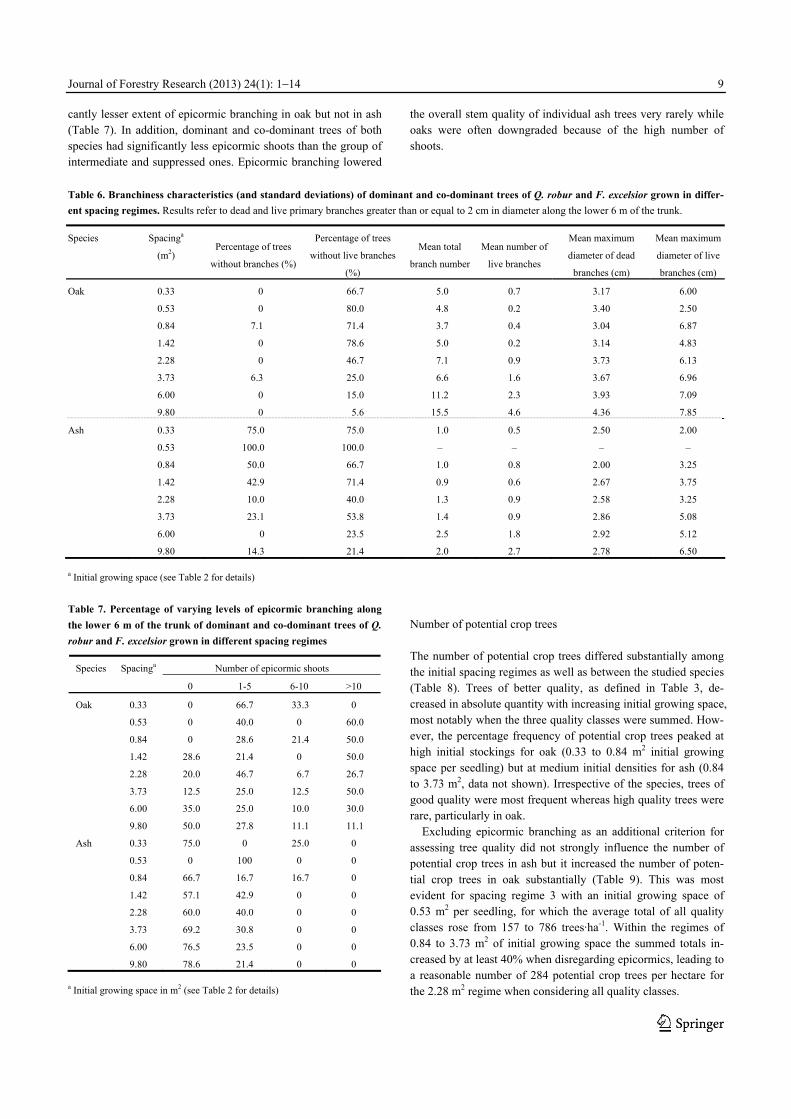
Greater initial growing space resulted in less monopodial and
steeply angled crowns in both species when dominant and co-dominant trees were investigated (Fig. 6). However, generalized additive modelling revealed a statistically significant relationship between growing space and the percentage of dominant and co-dominant trees with superior crown types only for ash (Table 4 and 5).
Fig. 6 Tree quality of dominant and co-dominant trees II: frequency
distributions of crown form classes
Branchiness and epicormic branching
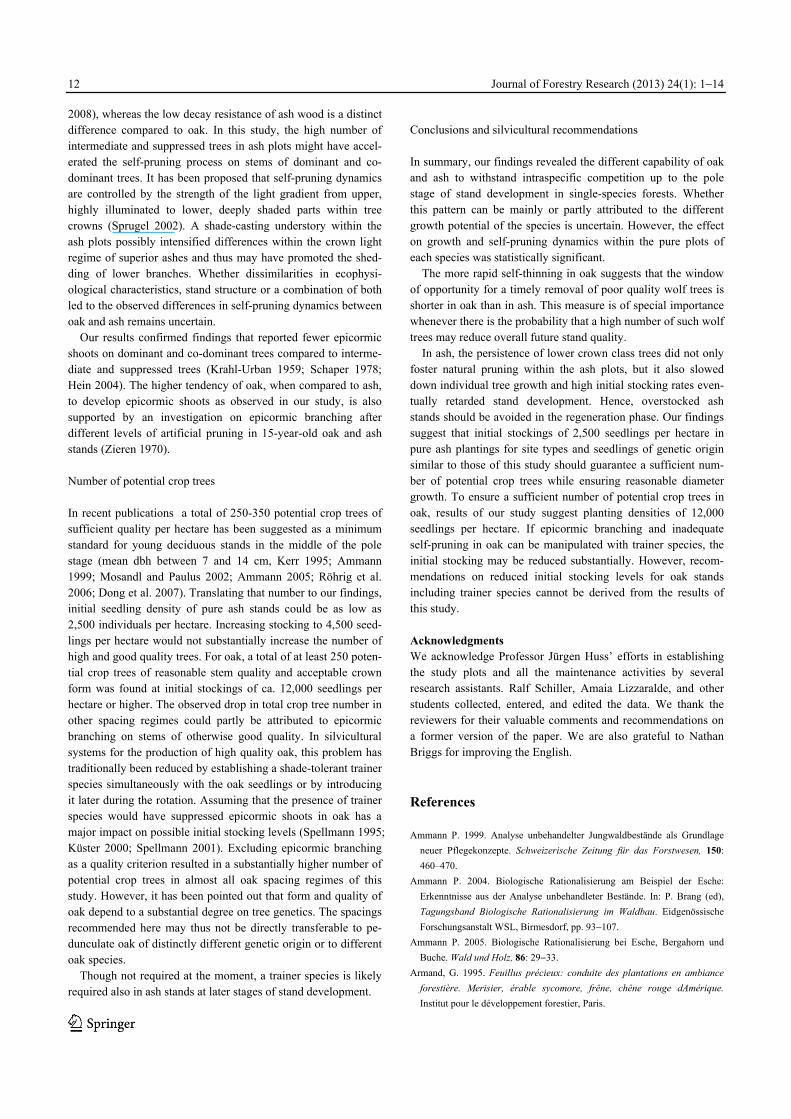
Number and size of dead and live primary branches greater than 2 cm in diameter along the lower 6 m of stems differed substan-tially between both species (Table 6). Dominant and co-dominant ashes without any dead or live branch were found in almost all spacing regimes. In contrast, oak plots had only few trees fulfilling this condition. Percentage of stems without green branches along the lower 6 m declined with increasing initial growing space in both species, but more rapidly in oak. Mean total branch number rose from 5 to over 15 branches per tree within the inner- to the outermost spacing regimes of oak plots while there was only a slight increase from 1 to 2 branches per tree in ash.
A slight increase of the average maximum diameter with in-creasing initial growing space was observed for dead and live branches of both species. However, independent of branch status, mean size of measured branches was greater in oak compared to ash across all spacing regimes. Average maximum diameter of dead branches was found to be consistently lower compared to average maximum diameter of living branches of ash and oak.
For both species, branchiness was similar among the lower spacing regimes with initial growing space ranging from 0.33 to 2.28 m2 per tree. Substantial increases in branch number or size were found primarily in the outermost regimes with an initial growing space equal to or greater than 3.73 m2.
Epicormic shoots were observed on 79% of the oaks but only on 46% of the ashes. On oak, epicormic branching occurred mostly in small clusters but shoots were often of negligible size and age or already dead. Although epicormic shoots on ash were substantially less frequent and less numerous, they were often older and more vigorous when compared to oak. Epicormic shoots on oak where found along the entire lower stem section (6 m), whereas shoots on ash were rather concentrated in the upper part of that segment. Increasing initial spacing led to a signifi-
Journal of Forestry Research (2013) 24(1): 1−14
9
cantly lesser extent of epicormic branching in oak but not in ash (Table 7). In addition, dominant and co-dominant trees of both species had significantly less epicormic shoots than the group of intermediate and suppressed ones. Epicormic branching lowered
the overall stem quality of individual ash trees very rarely while oaks were often downgraded because of the high number of shoots.
Table 6. Branchiness characteristics (and standard deviations) of dominant and co-dominant trees of Q. robur and F. excelsior grown in differ-
ent spacing regimes. Results refer to dead and live primary branches greater than or equal to 2 cm in diameter along the lower 6 m of the trunk.
Species Spacinga
(m2)
Percentage of trees
without branches (%)
Percentage of trees
without live branches
(%)
Mean total
branch number
Mean number of
live branches
Mean maximum
diameter of dead
branches (cm)
Mean maximum
diameter of live
branches (cm)
Oak 0.33 0 66.7 5.0 0.7 3.17 6.00
0.53 0 80.0 4.8 0.2 3.40 2.50
0.84 7.1 71.4 3.7 0.4 3.04 6.87
1.42 0 78.6 5.0 0.2 3.14 4.83
2.28 0 46.7 7.1 0.9 3.73 6.13
3.73 6.3 25.0 6.6 1.6 3.67 6.96
6.00 0 15.0 11.2 2.3 3.93 7.09
9.80 0 5.6 15.5 4.6 4.36 7.85
Ash 0.33 75.0 75.0 1.0 0.5 2.50 2.00
0.53 100.0 100.0 – – – –
0.84 50.0 66.7 1.0 0.8 2.00 3.25
1.42 42.9 71.4 0.9 0.6 2.67 3.75
2.28 10.0 40.0 1.3 0.9 2.58 3.25
3.73 23.1 53.8 1.4 0.9 2.86 5.08
6.00 0 23.5 2.5 1.8 2.92 5.12
9.80 14.3 21.4 2.0 2.7 2.78 6.50
a Initial growing space (see Table 2 for details)
Table 7. Percentage of varying levels of epicormic branching along
the lower 6 m of the trunk of dominant and co-dominant trees of Q. robur and F. excelsior grown in different spacing regimes
Number of epicormic shoots Species Spacinga
0 1-5 6-10 >10
Oak 0.33 0 66.7 33.3 0
0.53 0 40.0 0 60.0
0.84 0 28.6 21.4 50.0
1.42 28.6 21.4 0 50.0
2.28 20.0 46.7 6.7 26.7
3.73 12.5 25.0 12.5 50.0
6.00 35.0 25.0 10.0 30.0
9.80 50.0 27.8 11.1 11.1
Ash 0.33 75.0 0 25.0 0
0.53 0 100 0 0
0.84 66.7 16.7 16.7 0
1.42 57.1 42.9 0 0
2.28 60.0 40.0 0 0
3.73 69.2 30.8 0 0
6.00 76.5 23.5 0 0
9.80 78.6 21.4 0 0
a Initial growing space in m2 (see Table 2 for details)
Number of potential crop trees The number of potential crop trees differed substantially among the initial spacing regimes as well as between the studied species (Table 8). Trees of better quality, as defined in Table 3, de-creased in absolute quantity with increasing initial growing space, most notably when the three quality classes were summed. How-ever, the percentage frequency of potential crop trees peaked at high initial stockings for oak (0.33 to 0.84 m2 initial growing space per seedling) but at medium initial densities for ash (0.84 to 3.73 m2, data not shown). Irrespective of the species, trees of good quality were most frequent whereas high quality trees were rare, particularly in oak.
Excluding epicormic branching as an additional criterion for assessing tree quality did not strongly influence the number of potential crop trees in ash but it increased the number of poten-tial crop trees in oak substantially (Table 9). This was most evident for spacing regime 3 with an initial growing space of 0.53 m2 per seedling, for which the average total of all quality classes rose from 157 to 786 trees·ha-1. Within the regimes of 0.84 to 3.73 m2 of initial growing space the summed totals in-creased by at least 40% when disregarding epicormics, leading to a reasonable number of 284 potential crop trees per hectare for the 2.28 m2 regime when considering all quality classes.

Journal of Forestry Research (2013) 24(1): 1−14
10
Table 8. Number of potential crop trees of different quality classes per hectare for Q. robur and F. excelsior at the age of 24 years
1986b Oak 2008 Ash 2008 Spacinga
Totalc Highd Good Moderate Total High Good Moderate
0.33 30,303 3,367 0 561 281 21,164 361 0 241
0.53 18,868 3,669 0 157 0 14,303 152 913 609
0.84 11,905 2,976 24 283 71 9,647 137 821 411
1.42 7,042 2,152 112 70 35 6,288 72 539 216
2.28 4,386 2,132 0 142 61 4,089 30 364 156
3.73 2,681 1,527 0 16 7 2,356 37 325 25
6.00 1,667 1,134 0 0 0 1,481 0 48 27
9.80 1,020 737 0 0 0 951 0 11 7
a Initial growing space in m2 (see Table 2 for details) b Initial stocking equivalent: number of planted seedlings per hectare c Number of trees per hectare (average of three plots) d See Table 3 for details on quality classes
Table 9 Number of potential crop trees of different quality classes per hectare for Q. robur and F. excelsior at the age of 24 years with-out consideration of epicormic branching along the lower 6 m of the trunk as quality criterion
Oak 2008 Ash 2008 Spacinga 1986b
Totalc Highd Good Moderate Total High Good Moderate
0.33 30,303 3,367 0 561 281 21,164 722 0 241
0.53 18,868 3,669 157 629 0 14,303 152 913 609
0.84 11,905 2,976 118 425 106 9,647 137 821 411
1.42 7,042 2,152 168 112 56 6,288 72 539 216
2.28 4,386 2,132 0 199 85 4,089 30 364 156
3.73 2,681 1,527 0 33 14 2,356 37 325 25
6.00 1,667 1,134 0 21 2 1,481 0 48 27
9.80 1,020 737 0 0 0 951 0 11 7
a-d See Table 8
Discussion Mortality The observed differences in growth dynamics between the two studied species were largely influenced by the significantly different mortality rates. The observed mortality must have been almost exclusively density dependent, since there were no dis-turbance events, which may have caused mortality. Density-dependent mortality rates are a function of the rate of biomass accumulation and of the tolerance of suppressed individuals to competition (Westoby 1984). The differences in height growth between species suggest that oak had a higher growth rate. In contrast to ash, differentiation and subsequent self-thinning among oaks could have been accelerated because of the more rapid height growth and therefore crown expansion of early dominating trees. In addition, different allometries among the two species at early stages of tree development have been re-ported. Oaks with a diameter at breast height up to approxi-mately 20 cm tend to have a wider crown in comparison to ashes of the same size (Hemery et al. 2005). Since crown expansion is
the driver of tree mortality, it may therefore have resulted in increased intraspecific competition within the oak plots.
Ash plots exhibited an intensive differentiation but no strong decline in total tree number, which may be the consequence of a higher tolerance to intraspecific competition when compared to oak. Tolerance to competition comprises shade-tolerance as well as tolerance to competition for water and nutrients. However, owing to the lack of published information, differences in belowground competition between the species cannot be further discussed.
Q. robur and F. excelsior are known to be not shade-tolerant and it has been assumed that both species have a comparable light demand (Dobrowolska et al. 2008). The longevity and persistence of naturally regenerated ash seedlings underneath dense forest canopies, however, is an indication of a greater competition tolerance of juvenile ash compared to oak (Wardle 1959; Okali 1966; Petritan et al. 2007). At least at early stages of stand development, ash seems to withstand intra- as well as interspecific shading more persistently than oak (Jarvis 1964, Welander and Ottosson 1998). Ash (regeneration) appears to be able to survive at lower light levels for a longer time than oak (Maurer 1963; Lüpke 1989; Tapper 1992; Kerr 1995; Schmidt 1996; Emborg 1998; Kerr and Cahalan 2004), which dies off, if the light regime is not enhanced shortly after germination (Di-neur 1951 and Roussel 1972 in Hauskeller-Bullerjahn 1997; Lüpke 1995). Thus the high density-dependent mortality of intermediate and suppressed oaks in this study likely originated from the inability of the species to restrict its growth under unfa-vourable conditions (Grime 1979; Givnish 1988; Lüpke 1998).
To our knowledge, the long-lasting persistence of intermediate and suppressed ash trees within stands at the pole stage as ob-served in this study has not been reported so far (but see Tapper 1996 and Ammann 2004). However, stratification and establish-ment of different crown layers in ash dominated stands at the sapling stage under optimal growth conditions have been de-scribed before (Van Miegroet 1956). The missing competition of more shade tolerant, and therefore shade casting, tree species like sycamore (Acer pseudoplatanus) and European beech (Fagus sylvatica) as commonly found in mixed young ash stands might explain this finding (Maurer 1963; Wagenhoff 1975; Beck and Götsche 1976). Tree growth The different self-thinning rates among the species had multiple effects on tree growth. While significant relationships between initial growing space and diameter growth could be found for both species, oak had gained greater stem dimensions throughout all initial spacing regimes. Variation in tree density was likely to be the major cause for this phenomenon. In any given spacing regime, a higher number of ash trees per unit area relied on the same amount of resources that was shared between substantially fewer individuals within the oak plots (cf. Van Miegroet 1956).
Greater competition for light, nutrients and water within the ash plots inhibited secondary stem thickening but not potential height growth, which can be reduced in some species that are
Journal of Forestry Research (2013) 24(1): 1−14
11
extremely tolerant to competition (e.g. Horne 1990). Significant variation in total tree height found for all ash trees originated in the high number of smaller intermediate and suppressed trees, which lowered the total average, particularly at high initial densi-ties. However, heights of dominant and co-dominant individuals were not influenced by initial growing space. It has been occa-sionally reported that narrow spacing can promote height growth, but the resulting advantage is often significantly evident only in early stages of stand development (see Sjolte-Jørgensen 1967; Spellmann and Baderschneider 1988; Riley and Nixon 1993; Schmaltz et al. 1997). Although we found slight differences, our study trees appear to be too old already to reflect dissimilarities in total height in a more significant extent.
Throughout all spacing regimes dominant and co-dominant oaks had reasonable live crown ratios, which were on average greater than 45%. Comparatively high ratios found for even the lowest spacings may be a result of small, low vigor but still live primary branches hat were not part of the main crown. Average height-to-diameter (h/d) ratios of dominant and co-dominant trees were close to 120 or lower in either species. Similar values have been reported for oak stands of the same development stage (Mosandl et al. 1988; Gürth and Velasquez 1991; Gaul and Stüber 1996). Ashes showed similar mean live crown ratios but higher h/d ratios. Within the six innermost spacing regimes mean h/d ratios exceeded a threshold value of 130 indicating critical individual tree stability for young stands of deciduous tree spe-cies (Mosandl et al. 1991; Ammann 1999). However, unlike in oak, where the dry leaves can intercept snow, stability problems caused by tree slenderness have apparently never been reported for young ash stands. In addition, a steady decrease of h/d ratios with increasing stand age has been observed in untreated ash stands (Ammann 2004). Tree quality Stem and crown form We are not aware of any long-term study where the kind of quality assessment of young trees used in the present investiga-tion has been followed through to the final timber products. We therefore assumed that buckled stems can level the slight flaw in bole straightness due to continuous and balancing stem diameter growth, but crooked and deformed trees cannot (Schaper 1978).
Whereas the difference in the self-thinning dynamics between oak and ash was clearly reflected in the tree dimensions, an effect on tree quality was not that obvious. We found significant relationship between initial growing space and stem form, al-though the proportion of crooked and deformed individuals was only slightly increased within the extremely wide spacings of dominant and co-dominant trees of both species. A similar find-ing was reported for a 14-year-old Q. petraea spacing trial (Spellmann and Baderschneider 1988), while no such trend was found in a comparable 23-year-old Q. petraea study (Schmaltz et al. 1997). And in a 19-year-old Nelder trial of Q. petraea the highest proportion of poor stem forms was reported for the ex-treme initial spacing regime (approx. 1,000 seedlings ha-1, Gaul and Stüber 1996). However, in contrast to our study, other inves-
tigations found a decline in good and medium stem forms at very high initial stockings with densities greater than 20,000 seedlings ha-1 (Gaul and Stüber 1996; Nagel and Rumpf 2010). Poor stem forms in young dense oak stands are often attributed to the provenance or the phototropic growth behaviour of the species (e.g. Assmann 1970). Oak tends to grow towards the light of openings and edges whenever it is overtopped by an upper can-opy or overgrown by competitors leading to undesired deviations from the vertical axis (cf. Leibundgut 1976).
The strongly monopodial growth effectively inhibits this growth pattern in ash, although stem bending as a result of very high tree densities in young ash stands has also been reported (Van Miegroet 1956). In most cases, deformed ash stems origi-nate from damage to the terminal bud caused by browsing or frost (Dobrowolska et al. 2008), which causes buckled or forked stems (Krahl-Urban 1955; Van Miegroet 1956; Kerr and Boswell 2001). The occurrence of forked or brushy crowns, however, has been also attributed to low initial stocking, especially in oak trials (Schaper 1978; Riley and Nixon 1993; Gaul and Stüber 1996; Schmaltz et al. 1997). Our findings therefore confirm that an increase in initial spacing results in greater proportions of poor crown forms in both species.
Assessing tree quality in stands of deciduous species during the transition from the sapling to the pole stage to develop deci-sion tools for precommercial thinning has been questioned lately (e.g. Dong et al. 2007). Based on the experience from long-term trials, various authors have reported dynamic changes in tree quality of individual oaks between young stands and later stand phases. These changes do not only include the expected decline in crown classes (Leibundgut 1976) or associated deterioration of stem and crown form (Schaper 1978) but also an upgrade in tree quality due to ongoing growth processes such as natural pruning (Dong et al. 1998; Küster 2000). Hence, it was concluded that tree quality assessment in young stands is highly uncertain and should be postponed to the later phase of pole-stage stands (di-ameter at breast height greater than or equal to 7 cm), when dominant and co-dominant trees have developed an appreciable portion of the desired branch free bole length (about 5 m, Mosandl and Paulus 2002). Since the height to the green crown was at least half of the desired branch free bole length (com-monly 8 m) in most situations, we feel confident that our find-ings on tree quality are of reasonable validity to draw conclu-sions about the expected future stand quality. Branchiness The dissimilar self-pruning dynamics of the two species became apparent in the varying number and size of dead and live branches. The differing dynamics were also reflected in the slight differences among the generalized additive models for height to lowest dead and lowest live branch as well as live crown ratio of dominant and co-dominant trees. The superior self-pruning capability of ash was substantiated in our study (Ammann 2005; Hein 2009b). The comparatively swift shedding of ash branches may be attributed to a higher light demand of the ash foliage. However, light compensation points differ only slightly between oak and ash (Wardle 1959; Jarvis 1964; Èermák 1998; Jaeger
Journal of Forestry Research (2013) 24(1): 1−14
12
2008), whereas the low decay resistance of ash wood is a distinct difference compared to oak. In this study, the high number of intermediate and suppressed trees in ash plots might have accel-erated the self-pruning process on stems of dominant and co-dominant trees. It has been proposed that self-pruning dynamics are controlled by the strength of the light gradient from upper, highly illuminated to lower, deeply shaded parts within tree crowns (Sprugel 2002). A shade-casting understory within the ash plots possibly intensified differences within the crown light regime of superior ashes and thus may have promoted the shed-ding of lower branches. Whether dissimilarities in ecophysi-ological characteristics, stand structure or a combination of both led to the observed differences in self-pruning dynamics between oak and ash remains uncertain.
Our results confirmed findings that reported fewer epicormic shoots on dominant and co-dominant trees compared to interme-diate and suppressed trees (Krahl-Urban 1959; Schaper 1978; Hein 2004). The higher tendency of oak, when compared to ash, to develop epicormic shoots as observed in our study, is also supported by an investigation on epicormic branching after different levels of artificial pruning in 15-year-old oak and ash stands (Zieren 1970). Number of potential crop trees In recent publications a total of 250-350 potential crop trees of sufficient quality per hectare has been suggested as a minimum standard for young deciduous stands in the middle of the pole stage (mean dbh between 7 and 14 cm, Kerr 1995; Ammann 1999; Mosandl and Paulus 2002; Ammann 2005; Röhrig et al. 2006; Dong et al. 2007). Translating that number to our findings, initial seedling density of pure ash stands could be as low as 2,500 individuals per hectare. Increasing stocking to 4,500 seed-lings per hectare would not substantially increase the number of high and good quality trees. For oak, a total of at least 250 poten-tial crop trees of reasonable stem quality and acceptable crown form was found at initial stockings of ca. 12,000 seedlings per hectare or higher. The observed drop in total crop tree number in other spacing regimes could partly be attributed to epicormic branching on stems of otherwise good quality. In silvicultural systems for the production of high quality oak, this problem has traditionally been reduced by establishing a shade-tolerant trainer species simultaneously with the oak seedlings or by introducing it later during the rotation. Assuming that the presence of trainer species would have suppressed epicormic shoots in oak has a major impact on possible initial stocking levels (Spellmann 1995; Küster 2000; Spellmann 2001). Excluding epicormic branching as a quality criterion resulted in a substantially higher number of potential crop trees in almost all oak spacing regimes of this study. However, it has been pointed out that form and quality of oak depend to a substantial degree on tree genetics. The spacings recommended here may thus not be directly transferable to pe-dunculate oak of distinctly different genetic origin or to different oak species.
Though not required at the moment, a trainer species is likely required also in ash stands at later stages of stand development.
Conclusions and silvicultural recommendations In summary, our findings revealed the different capability of oak and ash to withstand intraspecific competition up to the pole stage of stand development in single-species forests. Whether this pattern can be mainly or partly attributed to the different growth potential of the species is uncertain. However, the effect on growth and self-pruning dynamics within the pure plots of each species was statistically significant.
The more rapid self-thinning in oak suggests that the window of opportunity for a timely removal of poor quality wolf trees is shorter in oak than in ash. This measure is of special importance whenever there is the probability that a high number of such wolf trees may reduce overall future stand quality.
In ash, the persistence of lower crown class trees did not only foster natural pruning within the ash plots, but it also slowed down individual tree growth and high initial stocking rates even-tually retarded stand development. Hence, overstocked ash stands should be avoided in the regeneration phase. Our findings suggest that initial stockings of 2,500 seedlings per hectare in pure ash plantings for site types and seedlings of genetic origin similar to those of this study should guarantee a sufficient num-ber of potential crop trees while ensuring reasonable diameter growth. To ensure a sufficient number of potential crop trees in oak, results of our study suggest planting densities of 12,000 seedlings per hectare. If epicormic branching and inadequate self-pruning in oak can be manipulated with trainer species, the initial stocking may be reduced substantially. However, recom-mendations on reduced initial stocking levels for oak stands including trainer species cannot be derived from the results of this study. Acknowledgments We acknowledge Professor Jürgen Huss’ efforts in establishing the study plots and all the maintenance activities by several research assistants. Ralf Schiller, Amaia Lizzaralde, and other students collected, entered, and edited the data. We thank the reviewers for their valuable comments and recommendations on a former version of the paper. We are also grateful to Nathan Briggs for improving the English.
References
Ammann P. 1999. Analyse unbehandelter Jungwaldbestände als Grundlage
neuer Pflegekonzepte. Schweizerische Zeitung für das Forstwesen, 150:
460–470.
Ammann P. 2004. Biologische Rationalisierung am Beispiel der Esche:
Erkenntnisse aus der Analyse unbehandleter Bestände. In: P. Brang (ed),
Tagungsband Biologische Rationalisierung im Waldbau. Eidgenössische
Forschungsanstalt WSL, Birmesdorf, pp. 93−107.
Ammann P. 2005. Biologische Rationalisierung bei Esche, Bergahorn und
Buche. Wald und Holz, 86: 29−33.
Armand, G. 1995. Feuillus précieux: conduite des plantations en ambiance
forestière. Merisier, érable sycomore, frêne, chêne rouge dAmérique.
Institut pour le développement forestier, Paris.
Journal of Forestry Research (2013) 24(1): 1−14
13
Assmann E. 1970. The principles of forest yield study. Oxford: Pergamon
Press, 506 pp.
Bary-Langer A, Evrard R, Gathy P. 1999. La Forêt. Liège: Du Perron, 623 pp.
Beck O, Götsche D. 1976. Untersuchungen über das Konkurrenzverhalten von
Edellaubhölzern in Jungbeständen. Forstarchiv, 47: 89–91.
Bläsing J. 2008. Das Klima des Mosswalds. In: H .Körner (ed), Die
Mooswälder - Natur- und Kulturgeschichte der Breisgauer Bucht. Freiburg:
Lavori, pp. 73–94.
Börner M, Guericke M, Leder B, Nutto L, Stähr F, Weinreich A. 2003.
Erhebung qualitätsrelevanter Parameter am Einzelbaum –
Aufnahmestandards für junge bis mittelalte Laubhölzer als Grundlage für
wissenschaftliche Untersuchungen. Forstarchiv, 74: 275–282.
Burschel P, Huss J. 2003. Grundriß des Waldbaus. Berlin: Parey, p. 487.
Butin H, Kowalski T. 1983. Die natürliche Astreinigung und ihre
biologischen Voraussetzungen: II. Die Pilzflora der Stieleiche (Quercus
robur L.). European Journal of Forest Pathology, 13: 428–439.
Claessens H. 2002. Itinéraires sylvicoles pour la production de frênes de
qualité. Les cahiers forestiers de Gembloux. Unité de gestion des
Économies Forestières. Faculté des Sciences Agronomiques de Gembloux.
Dobrowolska D, Hein S, Oosterbaan A, Skovsgaard J-P, Wagner S. 2008.
Ecology and growth of European ash (Fraxinus excelsior L.). Publication
of COST E42 “Growing Valuable Broadleaved Tree Species” (ValBro).
Available at: http://www.valbro.uni-freiburg.de/pdf/paper_Ash.pdf [ac-
cessed 01 February 2012].
Dong PH, Eder W, Muth M. 2007. Traubeneichen-Läuterungsversuche im
Pfälzerwald. In: P. H. Dong (ed), Eiche im Pfälzerwald. Mitteilungen aus
der Forschungsanstalt für Waldökologie und Forstwirtschaft Rheinland-
Pfalz 63/07, pp. 57–77.
Dong PH, Muth M, Roeder A. 1998. Läuterungsversuch in
Eichenjungbeständen bei Oberhöhen von ca. 8 Metern. Forst und Holz, 53:
165–167.
Èermák J. 1998. Leaf distribution in large trees and stands of the floodplain
forest in southern Moravia. Tree Physiology, 18: 727–737.
Emborg, J. 1998. Understorey light conditions and regeneration with respect
to the structural dynamics of a near-natural temperate deciduous forest in
Denmark. Forest Ecology and Management 106: 83–95.
Food and Agriculture Organization of the United Nations 1998. World refer-
ence base for soil resources: a framework for international classification,
correlation and communication. World soil resources reports 84.
Galinski W, Witowski J, Zwieniecki M. 1994. Non-random height pattern
formation in even aged Scots pine (Pinus sylvestris L.) Nelder plots as af-
fected by spacing and site quality. Forestry, 67: 49–61.
Gaul T, Stüber V. 1996. Der Eichen-Nelder-Verbandsversuch Göhrde. Forst
und Holz, 51: 70–75.
Givnish, T.J. 1988. Adaptation to sun and shade: a whole-plant perspective.
Australian Journal of Plant Physiology 15: 63–92.
Grime JP. 1979. Plant strategies and vegetation processes. Chichester: Wiley,
p.222.
Gürth P, Velasquez C. 1991. Qualitätsuntersuchungen an
Eichenjungbeständen im Markgräflerland. Forst und Holz, 23: 671–677.
Hauskeller-Bullerjahn K. 1997. Wachstum junger Eichen unter Schirm.
Berichte des Forschungszentrums Waldökosysteme Universität Göttingen,
Reihe A 147, p.142.
Hein S. 2004. Zur Steuerung von Astreinigung und Dickenwachstum bei
Esche (Fraxinus excelsior L.) und Ahorn (Acer pseudoplatatnus L.).
Freiburger Forstliche Forschung 25, p.263.
Hein S. 2009a. Modelling natural pruning of common ash, sycamore and wild
cherry. In: H. Spiecker, S. Hein, K. Makkonen-Spiecker and M. Thies (eds),
Valuable broadleaved forests in Europe. European Forest Institute Re-
search Report 22. Brill, Leiden. pp. 103–122.
Hein S. 2009b. Wertholzproduktion mit Buche, Eiche, Esche und Ahorn.
Allgemeine Forstzeitschrift/Der Wald, 64: 240–242.
Hein S, Collet C, Ammer C, Le Goff N, Skovsgaard JP, Savill P. 2009. A
review of growth and stand dynamics of Acer pseudoplatanus L. in Europe:
implications for silviculture. Forestry 82: 361–385.
Hemery GE, Savill PS, Pryor SN. 2005. Applications of the crown diameter–
stem diameter relationship for different species of broadleaved trees. Forest
Ecology and Management 215: 285–294.
Horne RH. 1990. Early espacement of wheatfield white cypress pine regen-
eration: the effect on secondary regeneration, limb size and stand merchant-
ability. Australian Forestry, 53: 160–167.
Hügin G. 1990. Die Mooswälder der Freiburger Bucht. Beihefte zu den
Veröffentlichungen für Naturschutz und Landschaftspflege in Baden-
Württemberg 29. Ludwigsburg: Ungeheuer & Ulmer, p.85.
Jaeger C. 2008. Ecophysiological studies on the flood tolerance of common
ash (Fraxinus excelsior L.): impact of root-zone hypoxia on central pa-
rameters of C metabolism. PhD thesis, University of Freiburg. Available at:
http://www.freidok.uni-freiburg.de/volltexte/5853/pdf/diss_cjaeger.pdf
[accessed 01 February 2012]
Jarvis PG. 1964. The adaptability to light intensity of seedlings of Quercus
petraea (Matt.) Liebl.. Journal of Ecology, 52: 545–571.
Joyce PM. 1998. Growing broadleaves: silvicultural guidelines for ash,
sycamore, wild cherry, beech and oak in Ireland. Dublin: COFORD, p.144.
Kerr G. 1995. Silviculture of ash in southern England. Forestry, 68: 63–70.
Kerr G. 2003. Effects of spacing on the early growth of planted Fraxinus
excelsior L. Canadian Journal of Forest Research, 33: 1196–1207.
Kerr G, Evans J. 1993. Growing broadleaves for timber. Forestry Commis-
sion handbook 9. London: H.M.S.O, p.95.
Kerr G, Boswell RC. 2001. The influence of spring frosts, ash bud moth
(Prays fraxinella) and site factors on forking of young ash (Fraxinus excel-
sior) in southern Britain. Forestry 74: 29–40.
Kerr G, Cahalan C. 2004. A review of site factors affecting the early growth
of ash (Fraxinus excelsior L.). Forest Ecology and Management, 188:
225−234.
Krahl-Urban J. 1955. Winterfrostschäden an Trauben-, Stiel- und Roteichen.
Der Forst- und Holzwirt, 10: 111–113.
Küster B. 2000. Die Auswirkungen unterschiedlicher waldbaulicher
Behandlungen auf das Wachstum und die Qualitätsentwicklung junger
Traubeneichen (Quercus petraea (Matt.) Liebl.). Forstliche
Forschungsberichte München 179, p.223.
Landesforstverwaltung Baden-Württemberg. 1993. Hilfstabellen für die
Forsteinrichtung. Ministerium für Ländlichen Raum, Ernährung,
Landwirtschaft und Forsten Baden-Württemberg (ed), Stuttgart.
Lanier L. 1988. Précis de sylviculture. ENGREF, Nancy.
Leibundgut H. 1976. Grundlagen zur Jungwaldpflege - Ergebnisse
zwanzigjähriger Untersuchungen über die Vorgänge der Ausscheidung,
Umsetzung und Qualitätsentwicklung in jungen Eichenbeständen.
Mitteilungen der Eidgenössischen Anstalt für das forstliche Versuchswesen
52: 311–371.
Lüpke vB. 1989. Die Esche - wertvolle Baumart im Buchenmischwald.
Allgemeine Forstzeitschrift/Der Wald, 44: 1040–1042.
Lüpke vB. 1995. Überschirmungstoleranz von Stiel- und Traubeneichen als
Voraussetzung für Verjüngungsverfahren unter Schirm. Mitteilungen der
Forstlichen Versuchsanstalt Rheinland-Pfalz, 34: 141–160.
Lüpke vB. 1998. Silvicultural methods of oak regeneration with special
respect to shade tolerant mixed species. Forest Ecology and Management
106: 19–26.
Maurer EI 1963. Waldbauliche und holzkundliche Untersuchungen an Eschen
Journal of Forestry Research (2013) 24(1): 1−14
14
aus dem Allgäu. Forstwissenschaftliches Centralblatt, 82: 162–188.
Mosandl R, Paulus F. 2002. Rationelle Pflege junger Eichenbestände.
Allgemeine Forstzeitschrift/Der Wald, 57: 581–584.
Mosandl R, Burschel P, Sliwa J. 1988. Die Qualität von Auslesebäumen in
Eichenjungbeständen. Forst und Holz, 43: 37–41.
Mosandl R, El Kateb H, Ecker J. 1991. Untersuchungen zur Behandlung von
jungen Eichenbeständen. Forstwissenschaftliches Centralblatt, 110:
358−370.
Nagel R-V, Rumpf H. 2010. Der Eichenverbandsversuch Ahlhorn: Ergebnisse
nach 35-jähriger Beobachtungsdauer. Forst und Holz, 65: 14–21.
Nelder JA. 1962. New kinds of systematic designs for spacing experiments.
Biometrics, 18: 283–307.
Nychka D. 2000. Spatial process estimates as smoothers. In: M. Schimek (ed),
Smoothing and regression: approaches, computation, and application. New
York: Wiley, pp. 393–424
Nyland RD. 2002. Silviculture: concepts and applications. New York: The
McGraw Hill Companies, 682 pp.
Okali DUU. 1966. A comparative study of the ecologically related tree
species Acer pseudoplatanus and Fraxinus excelsior: I. The analysis of
seedling distribution. Journal of Ecology, 54: 129–141.
Oosterbaan A, Hochbichler E, Nicolescu VN, Spiecker H. 2008. Silvicultural
principles, phases and measures in growing valuable roadleaved tree spe-
cies. Publication of COST E42, Growing Valuable Broadleaved Tree Spe-
cies“ (ValBro). Available at: http://www.valbro.uni-
freiburg.de/pdf/paper_silvics.pdf [accessed 01 February 2012].
Peracca, G.G., O´Hara, K.L. 2008. Effects of growing space on growth for 20-
year-old giant sequoia, Ponderosa pine, and Douglas-fir in the Sierra Ne-
vada. Western Journal of Applied Forestry 23: 156–165.
Petritan AM, v Lüpke B. von Petritan IC. 2007. Effects of shade on growth
and mortality of maple (Acer pseudoplatanus), ash (Fraxinus excelsior) and
beech (Fagus sylvatica) saplings. Forestry, 80: 397–412.
Pinheiro JC, Bates DM. 2000. Mixed-effects models in S and S-Plus. New
York: Springer, p.528.
Plochmann R. 1992. The forests of Central Europe: a changing view. Journal
of Forestry 90: 12–41.
Pretzsch H. 2009. Forest dynamics, growth and yield: from measurement to
model. Berlin: Springer, 664 pp.
Redmond J, Gallagher G, Mac Siúrtáin M. 2005. Systematic spacing trials for
plantation research and demonstration. COFORD Connects, Silvicul-
ture/Management No. 12.
R Development Core Team 2011. An Introduction to R. 103 pp.
Riley M, Nixon CJ. 1993. 50 year results from an oak spacing trial in South
Scotland. Scottish Forestry, 47: 79–82.
Röhrig E, Bartsch N, Lüpke Bv. 2006. Waldbau auf ökologischer Grundlage.
Stuttgart: Eugen Ulmer, p. 479.
Ruppert D, Wand MP, Carroll RJ. 2003. Semiparametric Regression. Cam-
bridge: Cambridge University Press, p. 386.
Savill PS, Spillsbury MJ. 1991. Growing oaks at closer spacing. Forestry, 64:
373–384.
Savill P, Evans J, Auclair D, Falck J. 1997. Plantation silviculture in Europe.
Oxford: University Press, p.297.
Schaper C. 1978. Das Jugendwachstum von Stiel- und Traubeneichen auf
norddeutschen Standorten. Dissertation Georg-August-University
Göttingen, p.194.
Schmaltz J, Fröhlich A, Gebhardt M. 1997. Die Qualitätsentwicklung in
jungen Traubeneichenbeständen im Hessischen Spessart. Forstarchiv, 68:
3–10.
Schmidt W. 1996. Zur Entwicklung der Verjüngung in zwei Femellücken
eines Kalkbuchenwaldes. Forst und Holz, 7: 201–205.
Sjolte-Jørgensen J. 1967. The influence of spacing on the growth and devel-
opment of coniferous plantations. International Review of Forestry Re-
search, 2: 43–94.
Smith DM, Larson BC, Kelty MJ, Ashton PMS. 1997. The practice of silvi-
culture. New York: Wiley, p.537.
Spellmann H. 1995. Holzqualität als Beurteilungskriterium im langfristigen
Versuchswesen. Forst und Holz, 50: 743–747.
Spellmann H. 2001. Bewirtschaftung der Eiche auf Grundlage
waldwachstumskundlicher Untersuchungen in Nordwestdeutschland.
Beiträge für Forstwirtschaft und Landschaftsökologie, 35: 145–151.
Spellmann H, Baderschneider A. 1988. Erste Auswertung eines
Traubeneichen-Pflanzverbands- und Sortimentsversuches im Forstamt
Hardegsen/Solling. Forst und Holz, 43: 447–450.
Spiecker H, Hein S, Makkonen-Spiecker K, Thies M. (eds). 2009. Valuable
Broadleaved Forests in Europe. European Forest Institute Research Report
22. Leiden: Brill, p. 256.
Sprugel DG. 2002. When branch autonomy fails: Milton`s law of resource
availability and allocation. Tree Physiology, 22: 1119–1124.
Tapper P-G. 1992. Demography of persistent juveniles in Fraxinus excelsior.
Ecography 15: 385–392.
Tapper, P-G. 1996. Tree dynamics in a successional Alnus-Fraxinus wood-
land. Ecography, 19: 237–244.
Valkonen S. 2008. Survival and growth of planted and seeded oak (Quercus
robur L.) seedlings with and without shelters on field afforestation sites in
Finland. Forest Ecology and Management, 255: 1085–1094.
Van Miegroet M. 1956. Untersuchungen über den Einfluß der waldbaulichen
Behandlung und der Umweltsfaktoren auf den Aufbau und die
morphologischen Eigenschaften von Eschendickungen im schweizerischen
Mittelland. Mitteilungen der Schweizerischen Anstalt für das Forstliche
Versuchswesen, 32: 229–370.
Vilinger E. 2008. Geologie der Freiburger Bucht. In: H. Körner (ed.), Die
Mooswälder - Natur- und Kulturgeschichte der Breisgauer Bucht. Freiburg:
Lavori, pp. 15–42.
Wagenhoff A. 1975. Die Wirtschaft in Edellaubholz/Buchen-Mischbeständen
auf optimalen Standorten im Forstamt Bovenden. Aus dem Walde, 24: 5–60.
Wardle P. 1959. The regeneration of Fraxinus excelsior in woods with a layer
of Mercurialis perennis. Journal of Ecology, 47: 483–497.
Welander NT, Ottosson B. 1998. The influence of shading on growth and
morphology in seedlings of Quercus robur L. and Fagus sylvatica L. For-
est Ecology and Management, 107: 117–126.
Westoby M. 1984. The self-thinning rule. Advances in ecological research, 14:
167–225.
Wood SN. 2006. Generalized additive models: An introduction with R.
Chapman & Hall/CRC, p. 392.
Zieren A. 1970. Zur Ästung von Esche und Eiche. Allgemeine Forstzeitschrift,
25: 771–772.


![Genome Scanning for Interspecific Differentiation Between Two Closely Related Oak Species [Quercus robur L. and Q. petraea (Matt.) Liebl.]](https://static.fdokumen.com/doc/165x107/63330ec8f00804055104bde0/genome-scanning-for-interspecific-differentiation-between-two-closely-related-oak.jpg)