An Investigation of Why Students Do Not Respond to Questions
23
An Investigation of Why Students Do Not Respond to Questions Pamela M. Jakwerth Frances B. Stancavage Ellen D. Reed American Institutes for Research Commissioned by the NAEP Validity Studies (NVS) Panel March 1999 George W. Bohrnstedt, Panel Chair Frances B. Stancavage, Project Director The NAEP Validity Studies Panel was formed by the American Institutes for Research under contract with the National Center for Education Statistics. Points of view or opinions expressed in this paper do not necessarily represent the official positions of the U. S. Department of Education or the American Institutes for Research.
-
Upload
khangminh22 -
Category
Documents
-
view
1 -
download
0
Transcript of An Investigation of Why Students Do Not Respond to Questions

An Investigation of WhyStudents Do Not Respondto Questions
Pamela M. JakwerthFrances B. StancavageEllen D. ReedAmerican Institutes for Research
Commissioned by the NAEP Validity Studies (NVS) PanelMarch 1999
George W. Bohrnstedt, Panel ChairFrances B. Stancavage, Project Director
The NAEP Validity Studies Panel was formed by the American Institutes for Researchunder contract with the National Center for Education Statistics. Points of view oropinions expressed in this paper do not necessarily represent the official positions ofthe U. S. Department of Education or the American Institutes for Research.

The NAEP Validity Studies (NVS) Panel was formed in 1995 to provide a technicalreview of NAEP plans and products and to identify technical concerns and promisingtechniques worthy of further study and research. The members of the panel have beencharged with writing focused studies and issue papers on the most salient of theidentified issues.
Panel Members:
Albert E. BeatonBoston College
John A. DosseyIllinois State University
Robert LinnUniversity of Colorado
R. Darrell BockUniversity of Chicago
Richard P. DuranUniversity of California
Ina V.S. MullisBoston College
George W. Bohrnstedt, ChairAmerican Institutes for Research
Larry HedgesUniversity of Chicago
P. David PearsonMichigan State University
Audrey ChampagneUniversity at Albany, SUNY
Gerunda HughesHoward University
Lorrie ShepardUniversity of Colorado
James R. ChromyResearch Triangle Institute
Richard JaegerUniversity of North Carolina
Zollie Stevenson, Jr.Baltimore City Public Schools
Project Director:
Frances B. StancavageAmerican Institutes for Research
Project Officer:
Patricia DabbsNational Center for Education Statistics
For Information:
NAEP Validity Studies (NVS)American Institutes for Research1791 Arastradero RoadPO Box 1113Palo Alto, CA 94302Phone: 650/ 493-3550Fax: 650/ 858-0958

ContentsIntroduction ............................................................................................... 1
Research Questions ............................................................................ 3
Methodology.............................................................................................. 3Sampling .............................................................................................. 3Procedures .......................................................................................... 4Interview Protocol and Materials .......................................................... 4Background Information ....................................................................... 5
Results ...................................................................................................... 5Participation ......................................................................................... 5Characteristics of the Student Sample ................................................. 6Unanswered Assessment Questions ................................................... 8Reasons for Unanswered Questions ................................................... 9Other Factors Influencing Nonresponse Rates .................................. 12Implications for Scoring Unanswered Questions ............................... 14
Summary ................................................................................................. 15Conclusions ....................................................................................... 15
Recommendations .................................................................................. 17Recommendations for Instrument Development ............................... 17Recommendations forTesting and Test Administration ...................... 18Recommendations for Future Research ............................................ 19
References .............................................................................................. 20

An Investigation of Why Students Do Not Respond to Questions 1
1 Specifically, we reviewed grade 8 item responses from the 1992 reading assessment and the 1996mathematics assessment.
Introduction
Over the past decade, developers of the National Assessment of Educational Progress(NAEP) have changed substantially the mix of item types on the NAEP assessments bydecreasing the numbers of multiple-choice questions and increasing the numbers ofquestions requiring short- or extended-constructed responses. These changes have beenmotivated largely by efforts to encompass the more complex learning outcomes beingcodified by new curriculum and assessment standards in a number of subject areas. That is,NAEP has attempted to align with widely endorsed recommendations for greater focus onthe development and use of higher-order-thinking skills in instruction as well asassessments that better allow students to demonstrate such skills.
With the inclusion of short and extended constructed-response questions on theNAEP assessments, however, researchers have begun to notice unacceptably high studentnonresponse rates (Koretz et al. 1993). As a result, NAEP reports, analyses, and subsequentconclusions may be potentially confounded by the fact that large numbers of students arenot answering some of the questions. Additionally, nonresponse rates seem to vary withstudent characteristics like gender and race, which may further impact the validity of NAEPconclusions.
Koretz and his colleagues (1993) conducted an analysis of nonresponse rates onthe 1990 NAEP mathematics assessment. They found that, across grade levels, 5 to 10percent of the items had omit rates of more than 10 percent. The highest omit rates were atgrade 12, and almost all of the items with high omit rates were open-ended. Our review ofdata from recent eighth-grade NAEP assessments in reading and mathematics confirmedthe high nonresponse rates associated with some constructed-response items.1 On average,a given constructed-response item was omitted, or skipped over in the middle of an itemblock, by about eight percent of these students. In contrast, the average multiple-choiceitem was omitted by about one percent. The maximum omit rates were 18 percent and 4percent, respectively, for constructed-response and multiple-choice items in the readingassessment and 25 percent and 5 percent, respectively, for constructed-response andmultiple-choice items in the mathematics assessment. None of these omit-rate figuresinclude the additional nonresponses of students who stopped short of a given item andfailed to answer any further items in that block.
Other researchers (Swinton 1991; Zhu and Thompson 1995) also have foundsimilar overall omit rates across various types of tests. Additionally, they have found thatomit rates vary with item and student characteristics and that there are small groups ofstudents for whom omit rates are very high. Of the item characteristics explored in paststudies, only format and difficulty seemed to have any significant relationship with thetendency of an item to be skipped. Studies (Koretz et al. 1993; Swinton 1991) haveconcluded that more open-ended questions tend to be skipped, skipped open-endedquestions are often the most difficult, and students seem to stop responding more oftenat a point where the next question is open-ended rather than multiple-choice.

2 An Investigation of Why Students Do Not Respond to Questions
The student characteristics most often examined in relation to high nonresponserates are gender and ethnicity. Gender most often has been found to be not significant(Koretz et al. 1993; Zhu and Thompson 1995); however, race/ethnicity typically issignificant, with Hispanic and African American students omitting answers more often thando Asian and white students (Grandy 1987; Koretz et al. 1993; Swinton 1991; Zhu andThompson 1995). Reasons for these differences may be related to ability and motivation.Studies have confirmed that some of the differences across ethnic groups can be explainedby ability, but
• Grandy (1987) found that 17 percent of high-achieving students stillomitted answers, and Koretz et al. (1993) found that, while thepercentage of omit rates decreased with higher achievement, it was notby a large factor;
• Differences between ethnic groups were still significant when factoringin achievement (Swinton 1991; Zhu and Thompson 1995);
• Item type still showed a large main effect and had an interaction withethnicity (Swinton 1991); and
• Some items do have large differences in omit rates across ethnic groupsregardless of ability (Swinton 1991; Zhu and Thompson 1995).
In this study, we explored potential reasons behind student omission of responsesto assessment questions. Understanding why students fail to answer certain questionsmay help inform the proper treatment of missing data during the estimation of itemparameters and achievement distributions.2 It may also help test developers identifystrategies for increasing response rates for particular types of questions or for particulargroups of students.
The study was exploratory, small in scope, and qualitative in nature. The generalapproach was to visit schools where the 1998 eighth-grade national NAEP assessments inreading and civics were being conducted and interview samples of students about their testtaking behaviors and their reasons for not answering particular questions following theassessment sessions. In our interviews we also attempted to determine whether the studentscould have correctly answered the questions they had left blank. This design was chosenover designs in which the students might take the assessment under more laboratory-likeconditions in order to retain the demand characteristics of a typical NAEP assessment. Inthis way we hoped to obscure as little as possible of the contribution of motivation toNAEP nonresponse.
2 Current practice is to treat items that are skipped over or omitted in the middle of item blocks as incorrectand to treat unanswered items at the end of blocks as not presented.

An Investigation of Why Students Do Not Respond to Questions 3
Research QuestionsFive research questions were investigated. Because of the exploratory nature of the study,we did not expect definitive answers to any of the questions. However, we did hope forinsights that could help set directions for future study, including the quantitative analysisof existing NAEP data sets to determine whether observed patterns of association betweenomissions and student or item characteristics held up over larger numbers of studentsand items.
Our research questions were as follows:
• What are the reasons students give for not answering questions on theeighth-grade reading and civics NAEP assessments?
• Are students leaving particular types of questions unanswered on thesetwo assessments more often than other types?
• How valid is the assumption that students have attempted, and thenpassed over, questions left blank in the middle of an item block, butthat students have not attempted questions left blank at the end of anitem block?
• How valid is the assumption that if students skip items in the middle ofan item block, they do not know the answers?
• What modifications can be made to NAEP assessments to decrease thenumbers of questions left unanswered?
Methodology
SamplingSchools were selected from those participating in the eighth-grade 1998 national NAEPassessments. To contain costs, only schools within reasonable driving distance ofSan Francisco, Los Angeles, or Washington, DC were recruited. In order to maximize thesize and diversity of the potential pool of students with unanswered test questions, ourinitial intent had been to oversample schools that were racially and ethnically diverse andthat were anticipated to have significant numbers of lower-performing students. However,because national data collection had already begun by the time the study was launched, theselection of schools was somewhat more limited than originally anticipated. Ultimately, weended up inviting all public schools within our prescribed geographic areas that testedeighth-grade students during our data collection period. (Three private schools wereeliminated from the potential sample because experience with our first pilot site suggestedthat private school students were less likely than others to leave any questions unanswered.)
One trained AIR staff member visited each participating school on the day oftesting and selected students, from the pool of eighth-grade students taking the reading andcivics assessments, to participate in debriefing interviews after the testing session. Theoriginal intention was to select five students at differing levels of achievement and withdiffering patterns of nonresponse at each school. However, certain factors complicated theselection process. First, at some schools not all students had parental consent to

4 An Investigation of Why Students Do Not Respond to Questions
participate in the study. This occurred when schools required written permission fromparents or, in one case, because the school had only sought permission for a pre-selectedsubsample of students. Second, at several schools few or no students had omitted anyquestions. To compensate, more than five students were interviewed at some schools wherelarger numbers of students met our selection criteria.
ProceduresPrior to the scheduled NAEP administration, schools sent letters to the parents of studentsparticipating in the reading or civics assessment informing them of our study. Schools wereprovided with sample letters and given the choice between letters that asked for active orpassive parental consent. We also provided Spanish versions of the letters to one school,and at least one other school sent out its own translation.
In order to make the data collection as nonreactive as possible, schools andstudents were not told the precise nature of the study, but only that we were interested inhow students answer test questions and that we were seeking information that would helpimprove future test questions. Also, individual students did not know until after theassessment was over whether or not they would be selected to participate in an interview.
On the day of the assessment, the AIR interviewer observed the testing sessionand then reviewed student test booklets and selected students to participate in theinterviews. Selection of students was based on their answer patterns. Ideally, every studentinterviewed was to have omitted (skipped over in the middle of an item block) at least onequestion. If fewer than five students at the site had omitted answers to questions, additionalstudents were interviewed, but their data were not used in the final analyses. At sites wheremore than five students had omitted answers to questions, students were chosen torepresent a range in the number and type of questions left unanswered and to representboth the civics and reading assessments.
Test booklets for the selected students were pulled and used in the interviews.Most students were interviewed separately, 3 and interviews were audiotaped. All studentsparticipating in the study were given a small gift upon completion of the interview.The majority of the interviews were completed by the project director, and two otherpeople were trained (one in Washington, DC and the other in California) to conductadditional interviews.
Interview Protocol and MaterialsStandardized interview protocols were developed. The interviews entailed asking studentsquestions about what they thought about particular questions and why they either answeredthem as they did or did not answer them. The interview protocol was based on protocolsdeveloped in AIR’s cognitive laboratory for prior studies of student test-taking behaviors.Several staff at AIR reviewed the protocol. A draft version of the protocol was pilot-testedat one of the selected sites, and a second version was pilot-tested at one additional site.
3 Three students at one school were interviewed as a group to see whether this strategy would elicit newtypes of information.
An Investigation of Why Students Do Not Respond to Questions 5
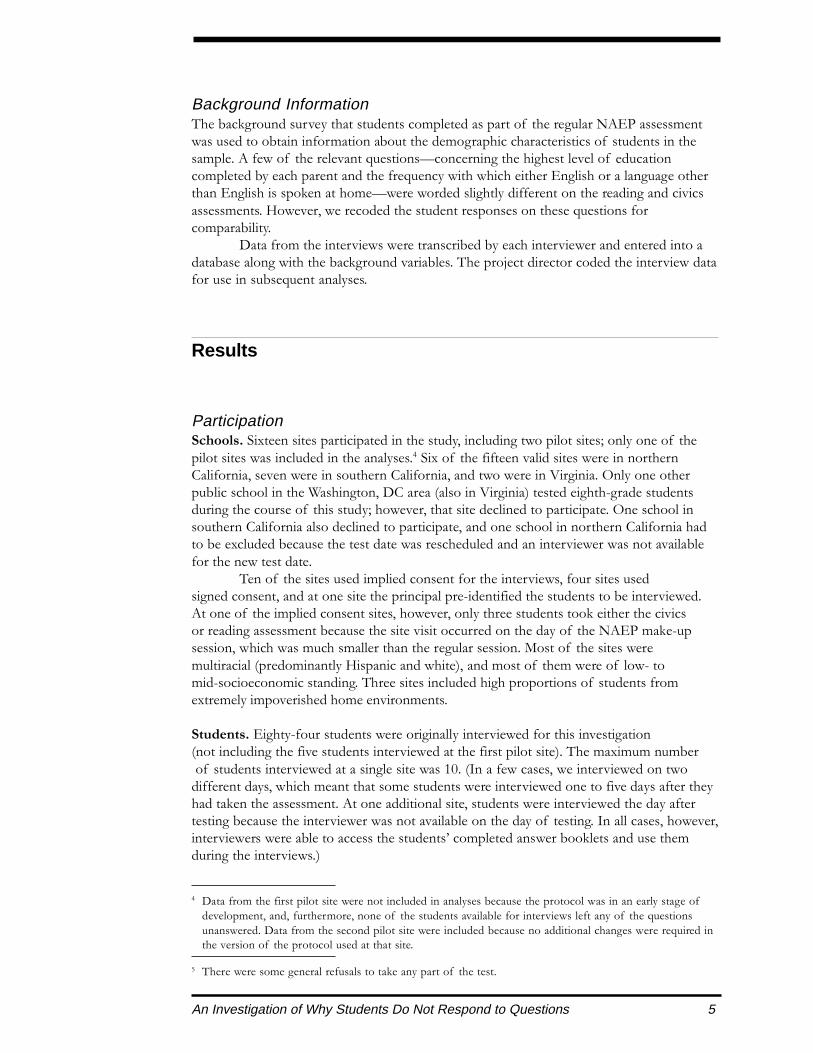
Background InformationThe background survey that students completed as part of the regular NAEP assessmentwas used to obtain information about the demographic characteristics of students in thesample. A few of the relevant questions—concerning the highest level of educationcompleted by each parent and the frequency with which either English or a language otherthan English is spoken at home—were worded slightly different on the reading and civicsassessments. However, we recoded the student responses on these questions forcomparability.
Data from the interviews were transcribed by each interviewer and entered into adatabase along with the background variables. The project director coded the interview datafor use in subsequent analyses.
Results
ParticipationSchools. Sixteen sites participated in the study, including two pilot sites; only one of thepilot sites was included in the analyses.4 Six of the fifteen valid sites were in northernCalifornia, seven were in southern California, and two were in Virginia. Only one otherpublic school in the Washington, DC area (also in Virginia) tested eighth-grade studentsduring the course of this study; however, that site declined to participate. One school insouthern California also declined to participate, and one school in northern California hadto be excluded because the test date was rescheduled and an interviewer was not availablefor the new test date.
Ten of the sites used implied consent for the interviews, four sites usedsigned consent, and at one site the principal pre-identified the students to be interviewed.At one of the implied consent sites, however, only three students took either the civicsor reading assessment because the site visit occurred on the day of the NAEP make-upsession, which was much smaller than the regular session. Most of the sites weremultiracial (predominantly Hispanic and white), and most of them were of low- tomid-socioeconomic standing. Three sites included high proportions of students fromextremely impoverished home environments.
Students. Eighty-four students were originally interviewed for this investigation(not including the five students interviewed at the first pilot site). The maximum number of students interviewed at a single site was 10. (In a few cases, we interviewed on twodifferent days, which meant that some students were interviewed one to five days after theyhad taken the assessment. At one additional site, students were interviewed the day aftertesting because the interviewer was not available on the day of testing. In all cases, however,interviewers were able to access the students’ completed answer booklets and use themduring the interviews.)
4 Data from the first pilot site were not included in analyses because the protocol was in an early stage ofdevelopment, and, furthermore, none of the students available for interviews left any of the questionsunanswered. Data from the second pilot site were included because no additional changes were required inthe version of the protocol used at that site.
5 There were some general refusals to take any part of the test.

6 An Investigation of Why Students Do Not Respond to Questions
Characteristics of the Student SampleNineteen of the 84 students who were interviewed had no omitted questions. The followinganalyses, however, focus exclusively on the 65 students who omitted at least one question inthe middle of an item block.
The breakdown of this 65-person sample by several demographic variables(i.e., race/ethnicity, gender, mother’s and father’s level of education, and frequency ofspeaking another language at home) is presented in table 1. The observed demographics area function both of the composition of the sampled schools and the characteristics of thestudents at those schools who omitted questions. In addition, at sites where the potentialsample of interviewees (students with omitted questions) was large, the interview samplewas chosen to be diverse rather than representative. Consequently, it is not possible to drawstatistically meaningful conclusions about the demographic characteristics of students likelyto omit questions based on the makeup of our sample. Such questions are better answeredby analyzing omit patterns in the full NAEP database.
White and Hispanic students together accounted for over 60 percent of our sample,and males were somewhat more heavily represented than females. With regard to parents’education, the sample was skewed toward those reporting lower or unknown educationalattainment. However, one-fifth of the students reported that their mothers had graduatedfrom college and one-quarter reported this level of education for their fathers.

An Investigation of Why Students Do Not Respond to Questions 7
Table 1— Demographic Characteristics of Sampled Students, N=65
Number and Percent
Race/Ethnicity
White 16 (25%)African American 10 (15%)
Hispanic 25 (39%)Asian 8 (12%)Other 6 ( 9%)
Gender
Male 39 (60%)Female 26 (40%)
Mother’s Education
Did Not Finish High School 11 (17%)Graduated From High School 14 (22%)
Some Education After High School 15 (23%)Graduated From College 13 (20%)
Don’t Know 11 (19%)
Father’s Education
Did Not Finish High School 5 ( 8%)Graduated From High School 14 (22%)
Some Education After High School 12 (19%) Graduated From College 17 (26%)
Don’t Know 16 (25%)
Other Language
Never 18 (28%)Sometimes 25 (39%)
Always 21 (32%)
Over two-thirds of the students reported that they spoke a language other thanEnglish at home at least some of the time, and over 25 percent reported always speaking alanguage other than English at home.

8 An Investigation of Why Students Do Not Respond to Questions
Unanswered Assessment QuestionsNumbers of unanswered questions. Reading booklets included either two separatelytimed reading passages with corresponding questions or one extended reading passage withquestions. The shorter passages included 8 to 13 questions and the extended passageincluded 13 questions. Civics booklets included two separately timed question blocks, witheach block containing 18 or 19 questions. Thus, reading booklets contained approximately20 to 25 test questions (except for booklets containing the extended passage), and civicsbooklets contained approximately 40 test questions. Reading blocks contained moreconstructed-response questions than did civics blocks.
As shown in table 2, the number of omitted questions ranged from 1 to 12 forstudents in this sample who took the reading assessment, and from 1 to 6 for studentswho took the civics assessment. There was also a wide range in the number of questionsnot reached (left unanswered at the ends of item blocks). These numbers ranged from0 to 16 on the reading assessment, and from 0 to 17 on the civics assessment.
Table 2— Average Numbers of Questions Omitted and Not Reached
Reading, ~20 test itemsN=33 students
Omitted questions 2.8 2.5 1–12Not-reached questions 3.0 3.8 0–16
Civics, ~40 test itemsN=32 students
Omitted questions 2.6 1.2 1–6Not-reached questions 2.2 3.7 0–17
Among Sampled Students
Mean SD Range
On average, these students omitted two to three questions and did not reach two tothree questions. Numbers of omitted responses and not-reached questions were similar forthose taking the reading or civics assessment. However, because the civics assessmentbooklets contained approximately twice as many questions as the reading assessmentbooklets, a larger percentage of reading than civics questions were left unanswered withineach booklet.
Types of specific questions omitted. Almost all omitted questions were short orextended constructed-response questions. Only a few students omitted multiple-choicequestions. On the reading assessment, extended constructed-response questions did notseem to be omitted with any more frequency than short constructed-response questions.The civics assessment did not include extended constructed-response questions; however,many of the civics short constructed-response questions, and many of those omitted byhigher numbers of students, were questions with two scorable parts (e.g., the student wasasked two related questions or was asked to provide two examples of something). For theselatter questions, we counted the question as unanswered if either part was left blank.

An Investigation of Why Students Do Not Respond to Questions 9
Students were tested on two blocks of questions each, and unanswered questionscame from all assessment blocks. Specific questions were left unanswered by 1 to 8 studentsfor civics questions and 1 to 4 students for reading questions. Nine civics questions andonly one reading question were left unanswered by more than three students.
The civics question with the highest omission rate (8 out of the 9 students who leftany questions unanswered in that question block) asked a question about the purpose oflabor unions. Students who left that question unanswered stated that they did not knowwhat a labor union, was and, when pushed to guess, could not guess correctly. Two othercivics questions that were left unanswered by relatively large numbers of students usedphrases that students said they did not understand and that probably could have beenparaphrased without violating the intent of the question. One of these, left unanswered by6 of 10 the students who had left any question unanswered within that block, referred to“the democratic process.” The other question, left unanswered by 5 of the 6 studentsleaving questions unanswered within that block, used the phrase “civil disobedience.” Manyof the students who had skipped over these two questions were able to answer them whenthe terms were defined. Another civics question, left unanswered by 6 of the 9 studentsleaving questions unanswered within that block, assessed an understanding of the conceptof a constitution for a government.
The reading question that was left unanswered by the most students (4 of 6 whofailed to answer at least one of the questions in that block) had to do with the organizationof a set of classified ads. One additional reading question that was left unanswered by3 of 6 students asked students to compare two descriptions of the same character in a storythey had read.
Reasons for Unanswered QuestionsLack of knowledge/understanding. Students were questioned about why they leftquestions unanswered. Of the 65 students in our sample, 30 students (46 percent) indicatedomitting at least one of these questions because they understood the question but did notknow the answer. Thirty-three (51 percent) indicated omitting at least one of the questionsbecause they either did not understand what the question was asking or they did notunderstand one or some of the words. One student stated, “These tests confuse me. I don’tunderstand them. I don’t understand the sentences and sometimes I don’t know what thewords mean.” Others said,
• “I didn’t really get the questions.”
• “…well the words, it’s kind of like hard to understand.”
• “…for most of it, I couldn’t figure out what the question was asking.”
Students who took the civics assessment were more likely to say they did not knowthe answer to a question than were students who took the reading assessment. A fewstudents actually had identified correct answers to questions they left unanswered, but theywere not sure that they had understood the questions correctly, so they decided not to writethe answer.

10 An Investigation of Why Students Do Not Respond to Questions
Missed questions. Six students claimed not to have seen all or part of a question that theyhad skipped or said that they did not realize they were supposed to answer it. For example,one of the reading questions asked students to fill out a form and two students did notrealize it was a question. Three other students said they had their arm over a question andmissed it. A few students answered only one part of a two-part constructed-responsequestion (i.e., a question that asked for two reasons, examples, etc.) and stated that they didnot realize they had to do both parts. Most students who claimed to have not seen aquestion were able to answer the question correctly when given the opportunity. Missedquestions occurred in both the reading and civics assessments.
Motivation. On the background survey completed as part of the main NAEP assessment,students were asked how important it was for them to do well on the test they took andhow hard they had tried on the test compared to other school tests covering similar content.Among the 65 students in our sample, 66 percent of those taking the civics assessment and73 percent of those taking the reading assessment indicated that doing well on the test waseither important or very important. By comparison, across the full national samples for the1994 and 1992 reading assessments and the 1994 geography and history assessments,approximately 50–55 percent of the eighth-grade students indicated that doing well on thetest was important or very important.
Over 80 percent of our sample gave background survey responses indicating thatthey tried at least as hard as on other tests; this number was similar to those found on otherNAEP assessments. During the interview, 63 percent (including 78 percent of the civicsand 49 percent of the reading students) said that they would not try harder if the test weregraded. Of those students who said that they would try harder, some said that they wouldtake more time reading the questions (and passages), and others said that they would havetried to answer all the questions. A few of the students indicated that they would havestudied in advance if the test had been graded.
For most of the students in the sample, therefore, lack of motivation appearednot to be a significant factor. However, eight students did give a specific reason why theydid not answer a particular question that indicated a lack of motivation (e.g., they did nothave an opinion, they thought it would take too long), and, at two particularly low-incomesites, most of the students interviewed indicated being generally unmotivated to answerthe test questions. Furthermore, lack of motivation was apparent in the behavior of manyother students in these same schools during the testing session (e.g., talking, inattention).Thus, while lack of motivation did not seem to be prevalent in the entire sample ofstudents interviewed, at particular sites—those with the lowest achieving students—itwas problematic.
For these students, lack of motivation generally manifested itself in failing toanswer constructed-response questions or writing answers such as “I don’t care” on thetest booklets. Furthermore, while most of these same students would mark answers tomultiple-choice questions, they indicated to the interviewers that these were often randommarks or guesses.5
For example, a student from one of these sites admitted that she did not takethe test seriously. She wrote responses like “I don’t know and I don’t care,” and “Hey,whazz-up? I don’t know what I am writing because I don’t understand nothing.” She toldthe interviewer that she picked her answers to multiple-choice questions by saying “eeny,meany, miny, mo, bubble gum, bubble gum in a dish, how many pieces do you wish, and

An Investigation of Why Students Do Not Respond to Questions 11
you will not be it for the rest of your life, you dirty old dish rag!” The student gave up in themiddle of the test, and she did not consider herself a good writer because “I don’t know howto express myself.” She said that she was talking to her friends during the test. When askedwhy she did not answer a question that asked her to write a letter, she said that she did notread the article that preceded the question because, “I thought if I read it I wouldn’tunderstand it.” She also said that the question itself was not interesting because she did notthink she would ever write this type of letter.
The following are examples of the motivation-related reasons for nonresponsesgiven by students at the other sites. One student answered part of a multipart,constructed-response question on the civics assessment but did not answer the other partsbecause he “got bored.” The part of the question that he did answer was correct.
Another student, who took the reading assessment, omitted five questions—allconstructed-response. He said that he did not like either of the passages he read and indicatedthat the first passage, an article that presented a sample of a poet’s work, was “odd.” For thefirst question he skipped, the task was to write about images he was left with from the poems.When asked why he did not answer, he said, “No images lingered in my mind.” When queriedabout how he would have answered another (omitted) question if he had been getting a gradeon the test, he answered that he would tell them to “ask somebody else.” This student wasable to answer most of the questions that he omitted when pushed. However, when queriedabout his preferences among item types, this student indicated that he did not like theextended-response questions because “they put in so much lines, they make you think theyexpect more…I don’t know enough to fill (them up).”
One LEP student who had had particular difficulty with the assessment also admittedto not reading one of the passages because it was too difficult and “there were no picturesand it looked boring.” When asked why he did not answer an extended-response question, hereplied, “I had to write a really long answer and it seemed like a lot of work.” About anotherquestion he said that he thought the question was too long and “there are too many words.”
Time. Seventy-nine percent of the students in our sample indicated not having enough timeto finish the test. Slightly more than half of the students (34) did not reach at least onequestion. This percentage was around 60 percent for those taking the reading assessment and40 percent for those taking the civics assessment. Other students indicated skipping overquestions and not having enough time to return and finish them. Some of these students readthrough all of the test questions at least once, but did not have time to return to unansweredquestions. Others did not have enough time to reach all of the questions the first timethrough. This seems to indicate that the tests may be speeded—at least for some groups ofstudents. However, in observations of the testing sessions, interviewers noted that moststudents finished the test before time was called.
Some students indicated spending a lot of their time on formulating or writing downanswers to constructed-response questions, and some indicated spending a lot of timereading either the passage or test questions. Again, there were some responses that wereanomalous in this sample. One student ran out of time because he read the passage, thenread the questions, and then read the passage again. Another student thought the firstconstructed-response question was the only question for the section and spent almost all ofhis time on that question before realizing that there were additional questions. Yet anotherstudent indicated being so nervous throughout the testing that he had difficulty concentratingon many of the questions. He also said that he ran out of time because he read all of thequestions and was just thinking about them. In fact, when asked what he felt about the test,he replied, “it made me think.”

12 An Investigation of Why Students Do Not Respond to Questions
Other Factors Influencing Nonresponse RatesTest-taking strategy. Test-taking strategies impacted the numbers and locations of questionsthat students left unanswered. Students who worked through their questions in order withoutskipping questions tended to have more questions left unanswered at the end of the blocks.Some of these students ran out of time because they spent so much time on an earlyextended constructed-response question. On the other hand, students who skipped questionsdid not always return back to them—generally, they ran out of time, but sometimes theydecided not to go back.
Most of the students interviewed indicated working through the test questions inorder without skipping questions. Students who did skip questions often skipped only thosequestions to which they did not know the answer.
Students were more apt to skip constructed-response questions. However, only 10of the students interviewed indicated purposefully skipping constructed-response questionswithout reading them first. Most students at least read the questions that they skipped, andmost said that they read the question at least twice before moving on. Apparently, studentswere reluctant to attempt an answer to a constructed-response question if they were unsureabout the correct answer, and when they perceived that a question would take time to figureout, decided to skip it and go on to other questions, intending to return later.
Over 75 percent of the students indicated guessing on some questions; thispercentage was higher among the students who took the civics assessment (88 percent) thanreading (67 percent). Close to 40 percent told us that they would always guess on amultiple-choice question, even if they had no idea of the answer and were not able to narrowdown the answer choices. Consequently, very few multiple-choice questions were left blank,even on the first pass through the test booklet. Generally, if a student did not know theanswer to a multiple-choice question, he/she would guess before going on to another. Insharp contrast, few students presented any evidence of “guessing” (i.e., writing somethingdown when they really did not know the answer) on constructed-response questions.
Testing conditions. The conditions in the testing sessions varied widely. Because civics andwriting were tested together, and because the writing assessment sample was the largest ofthe three, these sessions tended to be larger and to be conducted in larger rooms, such aslunchrooms, multipurpose rooms, or auditoriums, that were less conducive to concentration.Reading sessions, by contrast, tended to be smaller and were conducted in rooms such aslibraries that were quieter and had fewer disruptions.
Students were often seated four or five to a table in both the reading and civicssessions. Some schools, however, had the capacity to test smaller groups of students inseparate classrooms and to seat students at separate desks. Students in these sessions werequieter than were students in other sessions, and they seemed more likely to answer all their questions.
Conditions at some schools were particularly problematic. At one low-income school,all students were tested together in the same room with separate time being kept for each ofthe two subjects. At some sites, students were crammed into tables with little room to movetheir arms. In the sessions where there was a lot of disruption or other factors inhibitinggeneral concentration, it was easier to find students who had left questions unanswered.

An Investigation of Why Students Do Not Respond to Questions 13
One interesting observation was that it was more difficult to find booklets withomitted questions in the schools where the principals had prepared the students ahead oftime for the testing session and had stressed the importance of the students doing theirbest. However, the physical testing conditions also tended to be more favorable in theseschools (e.g., smaller rooms, separate desks), and these also were factors found to beassociated with higher response rates.
Item formats. Preference for, and past experience with, item format may also impact astudent’s tendency to leave or not leave a question unanswered. Two-thirds of the studentssaid that they liked multiple-choice questions, and less than one-quarter said that they likedconstructed-response questions. Students gave many reasons for their preferences. Reasonsfor liking multiple-choice questions were:
1) One can guess or get more clues to figure out the answer or understand thequestion (22 percent);• “I like them best because if you don’t know you just pick one.”
• “It gives you a hint at the answer and you can check if what you arethinking is wrong.”
• “When I was thinking of the ones I had to write, I really didn’t knowanything to write so it was kind of easier with the ones that already saidsomething because then you could get a better idea of what it wastalking about.”
• “They give you like a choice and you don’t have to answer themby yourself.”
2) They are easier (15 percent);• “They have limited choice.”
• “Easier because you don’t have to write so much.”
3) One of the answers is always right (14 percent).• “Because they give you a couple of choices and one of them has to be
right, but on (extended response) we have to guess.”
• “There is always an answer and there is always a chance that you couldget it right.”
• “They give you like choices so you don’t have to get stressed and findout your own answer.”
• “Because there’s a right answer in there and you just have to find it.”
Students who said that they liked constructed-response questions usually indicatedliking them because they are free to write whatever they want:
• “Because you can write mostly what’s in like. . . if the question waslike ‘how did you feel when so-and-so was um. . .’ you could justwrite anything.”
• “You get to explain it in your own words, but if you have only fourchoices it’s pretty hard to pick it out of four.”

14 An Investigation of Why Students Do Not Respond to Questions
Seventeen percent of the students said that they did not like answeringconstructed-response questions because they take too long or made them thinktoo hard:
• “You have to think longer most times.”
• “They’re like hard to answer because they make you think a lot.”
• “Short answers have to come out of your mind.”
• “…writing takes too much time.”
Other responses included:• “Has to like have a lot of information.”
• “I find them kind of harder because you feel like you have to have theright answer.”
• “Worth a lot of points, and if you don’t get all the details youlose points.”
• “When I was thinking of the ones I had to write, I really didn’t knowanything to write so it was kind of easier with the ones that already saidsomething because then you could get a better idea of what it wastalking about.”
Most students felt that they had adequate experience with all question types andsaid that they get all question types in classes and on tests. Students did not seem to beunfamiliar with the question formats on the test. However, some students said most ofthe open-ended questions they get are “fill-in-the-blank” or that they usually have only onelong essay at the end of a test. A few students also stated that the NAEP tests had moreopen-ended questions or more writing than they are used to having on one test.
Implications for Scoring Unanswered QuestionsIn order to have the time to interview five students before the end of the school day,interviews were kept to less than 30 minutes. Therefore, it was not possible to ask studentsto attempt to answer all unanswered questions. However, approximately two-thirds of thestudents who had skipped questions could correctly answer (at least for partial credit) atleast one of the unanswered questions we queried them about. About one-quarter of thestudents could do so without any help, seeming only to need time or a little prodding toanswer correctly. Others needed questions paraphrased or words defined.
Most students indicated reading the questions they omitted, and many said theyread them a couple of times. Most intended to go back to the question(s), but did not havetime. By contrast, in most cases, the questions left unanswered at the end of blocks weretruly not reached because all but a few students indicated not having the time to even readthese questions.
The students who had larger numbers of unanswered questions also seemedto have had difficulty on other questions. However, they tended to guess on themultiple-choice questions and to write something on the open-ended questions that askedfor opinions or did not seem to have a right or wrong answer. Many of these studentsalso appeared not to be reading questions carefully.

An Investigation of Why Students Do Not Respond to Questions 15
Summary
ConclusionsWhat are the reasons students give for not answering questions on the eighth-gradereading and civics NAEP? In general, on these two assessments, students indicated thatthey left questions unanswered because they either did not have enough time to finish thetest or they could not figure out the answer to a particular question. Some students couldnot figure out the answer to a particular question because they did not understand what thequestion was asking. However, others understood the question but did not know the answerto the question. The two issues may go hand-in-hand. Students who are less knowledgeablein a specific area may have more difficulty understanding the questions related to that area.Some students were able to answer the question correctly when the question was rephrased.Many students would have been able to get some credit on the question if they hadattempted to write something down, but they were reluctant to “guess” on open-endedquestions, and it was difficult even to get them to take a guess during the interviews.
The students who had omitted the constructed-response questions most likelywould not have done so had they been written as multiple-choice questions. Furthermore,some students would have been able to answer the multiple-choice version of the questioncorrectly because 1) the response options would have clarified the question for somestudents, and 2) some students knew enough about the question that they probably wouldhave been able to take an educated guess. However, rewording a constructed-responsequestion as a multiple-choice question may change the construct being measured.
Overt lack of motivation to answer the test questions was widespread at only twoparticularly disadvantaged sites. For many students, however, there seemed to have been anoverarching motivation issue—students seemed not to be reading carefully, and many wererushing through the test. The interview responses of some of the students suggested thatthey might have been more careful if they were being “graded,” but self-report on this kindof question may not be a valid indicator of actual behavior.
Are students leaving particular types of questions unanswered on these twoassessments more than other types? Just a handful of students left multiple-choicequestions unanswered. This is consistent with analysis of recent NAEP mathematics andreading assessments, mentioned in the introduction, which showed that few students wereomitting answers to multiple-choice questions. The constructed-response questions thatwere omitted tended to be longer and more complex questions, and they often werecomposed of more than one subquestion. Typically, it was a word or phrase in the questionthat gave a student difficulty.
How valid is the assumption that students have attempted, and then passed over,questions left blank in the middle of an item block, but that students have notattempted questions left blank at the end of an item block? For most studentsinterviewed, questions that were left unanswered in the middle of blocks, technically,should be treated as reached questions (there were very few exceptions of students who didnot read these questions at least once). However, it seemed in many cases that if studentsdid not immediately know an answer to a constructed-response question, they skipped it,intending to return to it later if they had time. Thus, they put no real effort into trying to

16 An Investigation of Why Students Do Not Respond to Questions
figure out the answer to the question. Sometimes they did not have time to return back tothe question. Students would, on the other hand, put time into trying to figure out theanswers to the multiple-choice questions that they could not readily solve. Thus, studentsseem to be spending less time on constructed-response questions that they cannotimmediately answer than they are on multiple-choice questions that they cannotimmediately answer. When students feel they are running out of time, they are apt to skipthe constructed-response questions.
By contrast, questions left unanswered at the end of blocks of questions were, forthe most part, not reached.
How valid is the assumption that if students skip items in the middle of an itemblock, they do not know the answer? Over half the students could answer at least one ofthe unanswered questions correctly during the interview. Approximately one-third of thestudents could do so without any assistance—they just needed time or prodding. Otherstudents needed to have the questions paraphrased or needed to have words defined.Whether this should count against the student is difficult to conclude and must beaddressed on a question-by-question basis to determine whether the high readingcomprehension level or unfamiliar vocabulary is intrinsic to the construct being measured.
Notably, a large part of the civics test seemed to rely on reading comprehension.For example, students were given a poem and were asked to identify two important ideasthe poet was telling others. One student, who did not answer the question said, “I’m notgood at poems.” Another point to consider vis-à-vis the reading comprehension demandsof the civics assessment is that, for good readers, answers to some of the questions couldbe determined from contextual clues in passages without any prior knowledge. Onequestion, for example, asked what was meant by a term used in a quote.
One could argue that reading ability should not be prerequisite for demonstratingmastery in civics; on the other hand, it may be difficult to address many of the constructsidentified in the civics framework without fairly heavy reliance on language. Furthermore,the comprehension problems displayed by many of the students we interviewed wentbeyond simple decoding; they did not understand the language even when the questionswere read to them. Finally, there is a good deal of specialized vocabulary that is arguablyintrinsic to the study of civics, and paraphrasing into lay terms may alter the constructbeing measured.
Language load is a more difficult issue to address in reading. Clearly readingcomprehension is the construct being measured. However, is it appropriate for part of thereading score to be determined by ability to understand the phrasing or vocabulary used inthe questions themselves? For example, some students did not know what the word“constituents” meant in one of the reading questions and skipped the question, but mayhave been able to answer it correctly, had another word been used. If this happened oftenand across many students, then we may end up reaching inaccurate conclusions aboutstudents’ reading abilities.
An Investigation of Why Students Do Not Respond to Questions 17
Recommendations
Recommendations for Instrument Development• Pay attention to vocabulary. Students had difficulty with several words
or phrases that, for the most part, were probably construct irrelevant.Some of these words included: (on reading) constituents, (on civics)democratic process, benefit from, civil disobedience, media. It isimportant for the test developers to determine if understanding of theparticular term or phrase used in the question is essential fordemonstrating achievement of the construct. Many students were ableto respond to questions correctly once they were paraphrased and wordswere defined.
• Use simpler phrasing and formatting for the open-ended questions.Many sentences were long and difficult. On the civics test, somestudents indicated not reading the directions or stimulus text thatpreceded a question. Instead, they would go straight to the question.Additionally, students seemed to have difficulty with questions thatwere made up of several subquestions. We suggest that test developerstake care to ensure that the reading demands of the questions do notexceed, or are not more difficult than, those of the passage to which theycorrespond. Twenty-three percent of the students in our sample suggestedthat the questions be written more clearly so they were easier tounderstand. Among some of the suggestions were:
— “I think they could write it a little more clearly and not usesuch big words.”
— “Some of the words in there are pretty big and you can’tunderstand. . . If they could expand a little bit.”
— “Explain it more like what you mean to give ‘em more ofquestions that you can understand, more smaller words.”
— “Use words that we can actually understand about.”
• Add examples. Examples might help with question clarity. Additionally,test developers could consider using some kind of a combinationmultiple-choice, open-ended item: such as possibly giving students a wronganswer and asking them to supply a correct one or asking students toexplain a multiple-choice answer.
• Improve relevance. The suggestions of 11 percent of the studentsrelated to improving the reading passages by making them easier ormore interesting:
— “They should put in articles that make kids want to write.”

18 An Investigation of Why Students Do Not Respond to Questions
Approximately fifteen percent of the students suggested that the items bemore interesting or more related to the lives of the students:
— “Talk more about us. Don’t ask questions about things we don’tknow about.”
— “Ask me about what I think we should do about graffiti and I(would) have a lot of ideas.”
Recommendations for Testing and Test Administration• Promote the teaching of test-taking strategies for constructed-response
questions. Many students seemed not to know how to attack open-endedquestions when they were unsure of the answer or could not understandthe question. Students may need training in skills such as breakingquestions apart or brainstorming ideas for the answer.
• Consider giving more time or clarify procedures for using time as anaccommodation. Ten percent of the students thought they should havemore time when asked how the test could be improved. Time seemed to bea factor for most of these students, especially the LEP students. (Schools arerequired to complete additional background questionnaires for identifiedLEP students who are eligible for exclusion or for accommodations such asextra time. Several test coordinators indicated that in schools with manyLEP students, the schools may choose to have the students testedunaccommodated rather than fill out the supplemental questionnaires.One coordinator stated that he sometimes pulls students himself if he findsthey obviously do not understand English. It seems probable that some ofthe LEP students interviewed—and even some of the non-LEP non-nativespeakers—could have answered more of the questions, at least with partialcredit, if they had had more time.)
• Reconsider the placement of some extended-response questions. Somestudents who had a long constructed-response question at the beginningof the booklet spent too much time on the question and then ran out oftime later. For example, one question asked students to write a letter—ofwhich the format, not the content, would be evaluated for scoring. Somestudents indicated spending so much time on the content of this letter(which was the third of 12 questions) that they ran out of time beforecompleting the item block.
• Improve and standardize testing conditions. One significant finding inthis study was the fact that testing conditions varied widely across sitesand that student nonresponse seemed to be related to these conditions.Students were more likely to exhibit behaviors associated with lowmotivation and were more likely to skip questions under noisier andmore crowded conditions. Unfortunately, these conditions occurredmore frequently in lower income schools. Thus, it is likely that in theschools that need the most resources, we are obtaining the least validindications of performance.

An Investigation of Why Students Do Not Respond to Questions 19
Recommendations for Future Research• Conduct interviews in other subject areas. The percentage of students
omitting answers to questions in the testing session observed seemednot to be high. However, in the 1996 NAEP mathematics assessment,omission rates at grade 8 were as high as 25 percent on some questions.Additionally, in mathematics, the extended-response questions weremuch more complex than were the other two types of questions, andrequired, to varying degrees, both language and mathematics skills.Thus, it is likely that a replication of this study with the mathematicsassessment might yield different results.
• Develop a better picture of the variation in testing conditions and therelationship between performance and testing conditions, when otherschool and student characteristics are held constant. (Westat testcoordinators and quality control monitors currently record someinformation regarding testing conditions; these data may be sufficient forthe proposed analysis.)
• Review student performance in laboratory-like settings. One difficultissue to determine was exactly how much time and effort studentsdevoted to constructed-response questions before leaving themunanswered. Most students said they did read the questions, but it isunclear whether they truly tried to answer them. If there was evidencethat students did not try, then treating the questions as incorrect ratherthan not reached might be questionable. Perhaps, videotaping students inthe process of completing the assessment would provide some indicationof the effort applied. However, generalizability from the experimentalsituation to NAEP testing conditions might be low. Another possibilitywould be having students rate their effort for each question.
• Try out modifications to test forms. Various modifications to test formscould be made to assess the impact on omission rates. One suchmodification would be to group all extended-response questions togetherin a separately-timed block, not giving the student the option of skippingthem in favor of multiple-choice questions. Another modification wouldbe to embed scaffolding into the questions, which would provide moredata on lower achieving students. This last option may be made morefeasible with the use of computer adapted testing.

20 An Investigation of Why Students Do Not Respond to Questions
References
Grandy, J. 1987. Characteristics of examinees who leave questions unanswered on the GRE GeneralTest under rights-only scoring. (GRE Board Professional Report No. 83-16P). Princeton, NJ:Educational Testing Service.
Koretz, D., Lewis, E., Skewes-Cox, T., and Burstein, L. 1993. Omitted and not-reached itemsin mathematics in the 1990 National Assessment of Educational Progress (CRE Technical Report347). Los Angeles, CA: Center for Research on Evaluation, Standards, and StudentTesting (CRESST).
O’Neil, H. F., Sugrue, B., Abedi, J., Baker, E. L., and Golan, S. 1997. Final report ofexperimental studies on motivation and NAEP test performance. (CRE Technical Report 427).Los Angeles, CA: Center for Research on Evaluation, Standards, and StudentTesting (CRESST).
Swinton, S. 1991. Differential response rates to open-ended and multiple-choice NAEP items by ethnicgroups. Unpublished manuscript, Oct. 23. Princeton, NJ: Educational Testing Service.
Zhu, D., and Thompson, T. D. 1995. Gender and ethnic differences in tendencies to omit responseson multiple-choice tests using number-right scoring. (ERIC Document Reproduction Service No.ED 382 689).