
Response of Quercus pubescens leaves exposed to geothermal pollutant input in southern Tuscany...
13
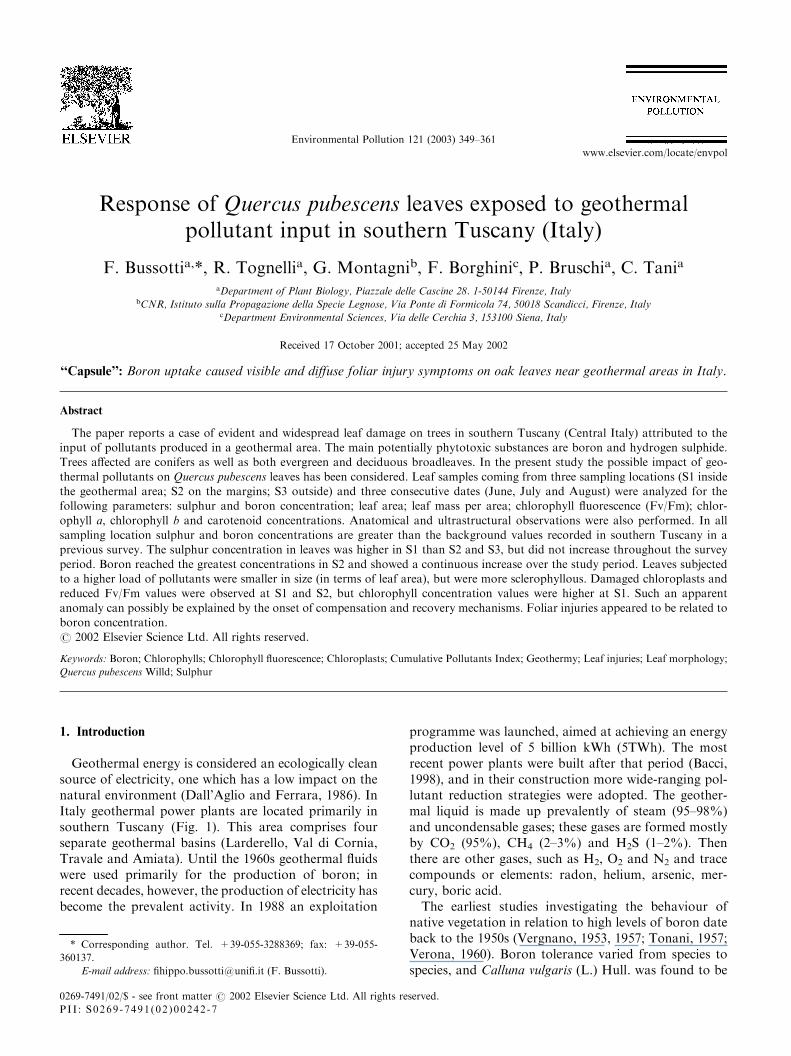
Response of Quercus pubescens leaves exposed to geothermal pollutant input in southern Tuscany (Italy) F. Bussotti a, *, R. Tognelli a , G. Montagni b , F. Borghini c , P. Bruschi a , C. Tani a a Department of Plant Biology, Piazzale delle Cascine 28. 1-50144 Firenze, Italy b CNR, Istituto sulla Propagazione della Specie Legnose, Via Ponte di Formicola 74, 50018 Scandicci, Firenze, Italy c Department Environmental Sciences, Via delle Cerchia 3, 153100 Siena, Italy Received 17 October 2001; accepted 25 May 2002 ‘‘Capsule’’: Boron uptake caused visible and diffuse foliar injury symptoms on oak leaves near geothermal areas in Italy. Abstract The paper reports a case of evident and widespread leaf damage on trees in southern Tuscany (Central Italy) attributed to the input of pollutants produced in a geothermal area. The main potentially phytotoxic substances are boron and hydrogen sulphide. Trees affected are conifers as well as both evergreen and deciduous broadleaves. In the present study the possible impact of geo- thermal pollutants on Quercus pubescens leaves has been considered. Leaf samples coming from three sampling locations (S1 inside the geothermal area; S2 on the margins; S3 outside) and three consecutive dates (June, July and August) were analyzed for the following parameters: sulphur and boron concentration; leaf area; leaf mass per area; chlorophyll fluorescence (Fv/Fm); chlor- ophyll a, chlorophyll b and carotenoid concentrations. Anatomical and ultrastructural observations were also performed. In all sampling location sulphur and boron concentrations are greater than the background values recorded in southern Tuscany in a previous survey. The sulphur concentration in leaves was higher in S1 than S2 and S3, but did not increase throughout the survey period. Boron reached the greatest concentrations in S2 and showed a continuous increase over the study period. Leaves subjected to a higher load of pollutants were smaller in size (in terms of leaf area), but were more sclerophyllous. Damaged chloroplasts and reduced Fv/Fm values were observed at S1 and S2, but chlorophyll concentration values were higher at S1. Such an apparent anomaly can possibly be explained by the onset of compensation and recovery mechanisms. Foliar injuries appeared to be related to boron concentration. # 2002 Elsevier Science Ltd. All rights reserved. Keywords: Boron; Chlorophylls; Chlorophyll fluorescence; Chloroplasts; Cumulative Pollutants Index; Geothermy; Leaf injuries; Leaf morphology; Quercus pubescens Willd; Sulphur 1. Introduction Geothermal energy is considered an ecologically clean source of electricity, one which has a low impact on the natural environment (Dall’Aglio and Ferrara, 1986). In Italy geothermal power plants are located primarily in southern Tuscany (Fig. 1). This area comprises four separate geothermal basins (Larderello, Val di Cornia, Travale and Amiata). Until the 1960s geothermal fluids were used primarily for the production of boron; in recent decades, however, the production of electricity has become the prevalent activity. In 1988 an exploitation programme was launched, aimed at achieving an energy production level of 5 billion kWh (5TWh). The most recent power plants were built after that period (Bacci, 1998), and in their construction more wide-ranging pol- lutant reduction strategies were adopted. The geother- mal liquid is made up prevalently of steam (95–98%) and uncondensable gases; these gases are formed mostly by CO 2 (95%), CH 4 (2–3%) and H 2 S (1–2%). Then there are other gases, such as H 2 ,O 2 and N 2 and trace compounds or elements: radon, helium, arsenic, mer- cury, boric acid. The earliest studies investigating the behaviour of native vegetation in relation to high levels of boron date back to the 1950s (Vergnano, 1953, 1957; Tonani, 1957; Verona, 1960). Boron tolerance varied from species to species, and Calluna vulgaris (L.) Hull. was found to be 0269-7491/02/$ - see front matter # 2002 Elsevier Science Ltd. All rights reserved. PII: S0269-7491(02)00242-7 Environmental Pollution 121 (2003) 349–361 www.elsevier.com/locate/envpol * Corresponding author. Tel. +39-055-3288369; fax: +39-055- 360137. E-mail address: fihippo.bussotti@unifi.it (F. Bussotti).
Transcript of Response of Quercus pubescens leaves exposed to geothermal pollutant input in southern Tuscany...
Response of Quercus pubescens leaves exposed to geothermalpollutant input in southern Tuscany (Italy)
F. Bussottia,*, R. Tognellia, G. Montagnib, F. Borghinic, P. Bruschia, C. Tania
aDepartment of Plant Biology, Piazzale delle Cascine 28. 1-50144 Firenze, ItalybCNR, Istituto sulla Propagazione della Specie Legnose, Via Ponte di Formicola 74, 50018 Scandicci, Firenze, Italy
cDepartment Environmental Sciences, Via delle Cerchia 3, 153100 Siena, Italy
Received 17 October 2001; accepted 25 May 2002
‘‘Capsule’’: Boron uptake caused visible and diffuse foliar injury symptoms on oak leaves near geothermal areas in Italy.
Abstract
The paper reports a case of evident and widespread leaf damage on trees in southern Tuscany (Central Italy) attributed to theinput of pollutants produced in a geothermal area. The main potentially phytotoxic substances are boron and hydrogen sulphide.Trees affected are conifers as well as both evergreen and deciduous broadleaves. In the present study the possible impact of geo-
thermal pollutants on Quercus pubescens leaves has been considered. Leaf samples coming from three sampling locations (S1 insidethe geothermal area; S2 on the margins; S3 outside) and three consecutive dates (June, July and August) were analyzed for thefollowing parameters: sulphur and boron concentration; leaf area; leaf mass per area; chlorophyll fluorescence (Fv/Fm); chlor-
ophyll a, chlorophyll b and carotenoid concentrations. Anatomical and ultrastructural observations were also performed. In allsampling location sulphur and boron concentrations are greater than the background values recorded in southern Tuscany in aprevious survey. The sulphur concentration in leaves was higher in S1 than S2 and S3, but did not increase throughout the survey
period. Boron reached the greatest concentrations in S2 and showed a continuous increase over the study period. Leaves subjectedto a higher load of pollutants were smaller in size (in terms of leaf area), but were more sclerophyllous. Damaged chloroplasts andreduced Fv/Fm values were observed at S1 and S2, but chlorophyll concentration values were higher at S1. Such an apparent
anomaly can possibly be explained by the onset of compensation and recovery mechanisms. Foliar injuries appeared to be related toboron concentration.# 2002 Elsevier Science Ltd. All rights reserved.
Keywords: Boron; Chlorophylls; Chlorophyll fluorescence; Chloroplasts; Cumulative Pollutants Index; Geothermy; Leaf injuries; Leaf morphology;
Quercus pubescensWilld; Sulphur
1. Introduction
Geothermal energy is considered an ecologically cleansource of electricity, one which has a low impact on thenatural environment (Dall’Aglio and Ferrara, 1986). InItaly geothermal power plants are located primarily insouthern Tuscany (Fig. 1). This area comprises fourseparate geothermal basins (Larderello, Val di Cornia,Travale and Amiata). Until the 1960s geothermal fluidswere used primarily for the production of boron; inrecent decades, however, the production of electricity hasbecome the prevalent activity. In 1988 an exploitation
programme was launched, aimed at achieving an energyproduction level of 5 billion kWh (5TWh). The mostrecent power plants were built after that period (Bacci,1998), and in their construction more wide-ranging pol-lutant reduction strategies were adopted. The geother-mal liquid is made up prevalently of steam (95–98%)and uncondensable gases; these gases are formed mostlyby CO2 (95%), CH4 (2–3%) and H2S (1–2%). Thenthere are other gases, such as H2, O2 and N2 and tracecompounds or elements: radon, helium, arsenic, mer-cury, boric acid.The earliest studies investigating the behaviour ofnative vegetation in relation to high levels of boron dateback to the 1950s (Vergnano, 1953, 1957; Tonani, 1957;Verona, 1960). Boron tolerance varied from species tospecies, and Calluna vulgaris (L.) Hull. was found to be
0269-7491/02/$ - see front matter # 2002 Elsevier Science Ltd. All rights reserved.
PI I : S0269-7491(02 )00242-7
Environmental Pollution 121 (2003) 349–361
www.elsevier.com/locate/envpol
* Corresponding author. Tel. +39-055-3288369; fax: +39-055-
360137.
E-mail address: [email protected] (F. Bussotti).
the most tolerant species in that it did not display anyvisible injury even when foliar concentrations roseabove 400 ppm. The leaves of deciduous oaks (Quer-cus cerris L.) showed no damage when boron con-centrations in the tissues were lower than 300 ppm.Vergnano (1953, 1957) was especially concerned withthe toxicity of boron absorbed through the rootsfrom the soil solution; while Verona (1960) recog-nized the important role played by atmospheric inputnear the power plants, indicating absorption via thestomata.More recent surveys (Dani and Loppi, 1994; Bussottiet at., 1997) in the Travale basin have revealed the pre-sence of visible damage to the native forest vegetation inthe vicinity of the extraction shafts and the pipelines.This damage, however, was extremely localized, i.e. didnot extend to more than a few metres from the source; itwas attributed to the accumulation of boron in the leaftissues following the occasional leakage of gas andsteam from the pipelines. In the remaining forest vege-tation the impact of the geothermal activities consisted
only in a slight accumulation of boron and sulphur inthe leaves which had no consequence on leaf and crownstatus. The same conclusions were reached by an analy-sis of the lichen distribution (Loppi and Bargagli, 1996;Loppi et al., 1997), i.e. that the impact was extremelylocalized. Observations carried out in the geothermalLarderello basin, however, call for a reconsideration ofthose conclusions. In this area, in fact, damage to foresttrees is widespread and the distribution shows little orno correlation to the distance between trees and thesources of pollutants. The symptoms have beenobserved in both evergreen species (conifers such asPinus pinea L., Pinus pinaster Ait., Pinus halepensisMill., and broadleaves such as Quercus ilex L., Phillyreaspp., Smilax aspera L.) and deciduous ones (Quercuscerris L., Quercus pubescens Willd., Castanea sativaMill., Acer campestre L., Robinia pseudacacia L. Ostryacarpinifolia Scop. etc.). Damage consists in necrosis ofthe distal portion of needles in conifers and in theappearance of marginal and interveinal necrosis inbroadleaves.
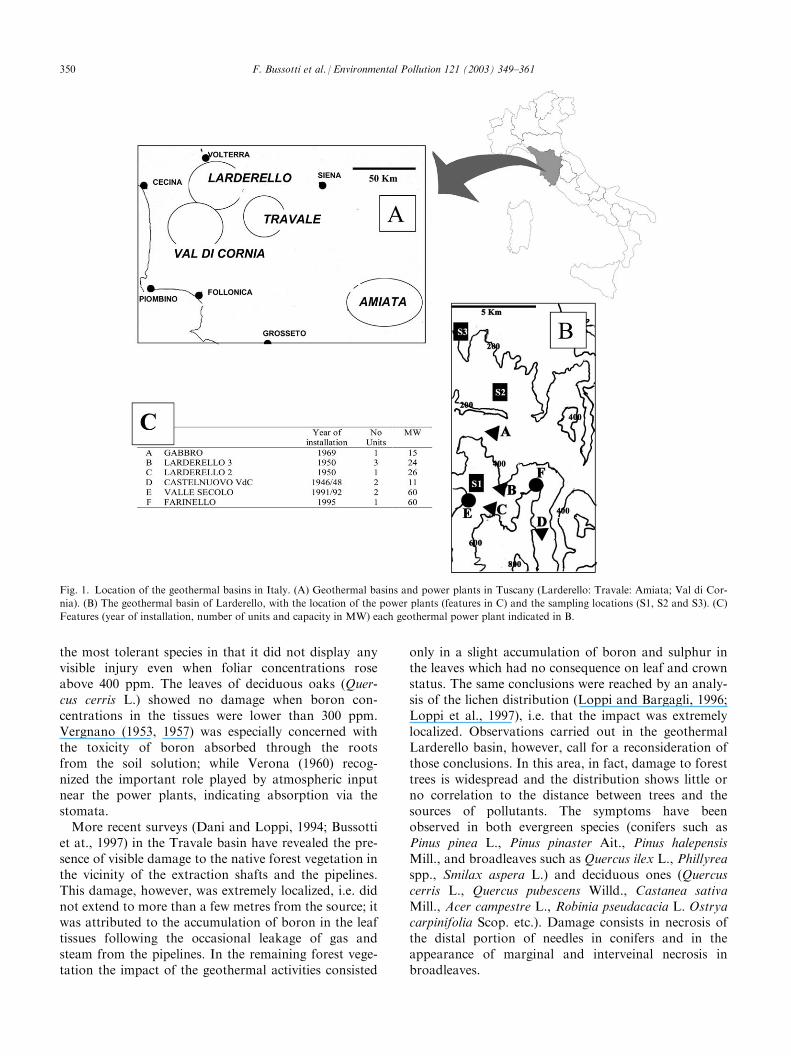
Fig. 1. Location of the geothermal basins in Italy. (A) Geothermal basins and power plants in Tuscany (Larderello: Travale: Amiata; Val di Cor-
nia). (B) The geothermal basin of Larderello, with the location of the power plants (features in C) and the sampling locations (S1, S2 and S3). (C)
Features (year of installation, number of units and capacity in MW) each geothermal power plant indicated in B.
350 F. Bussotti et al. / Environmental Pollution 121 (2003) 349–361
The present survey was carried out on Q. pubescens,the most widespread tree in the area. The purpose wasto determine the best indicator (boron or sulphur) withwhich to assess the environmental impact of geothermalplants and the possible relationships between the con-centration of pollutants in leaves and their vitality.
2. Materials and methods
2.1. Study area
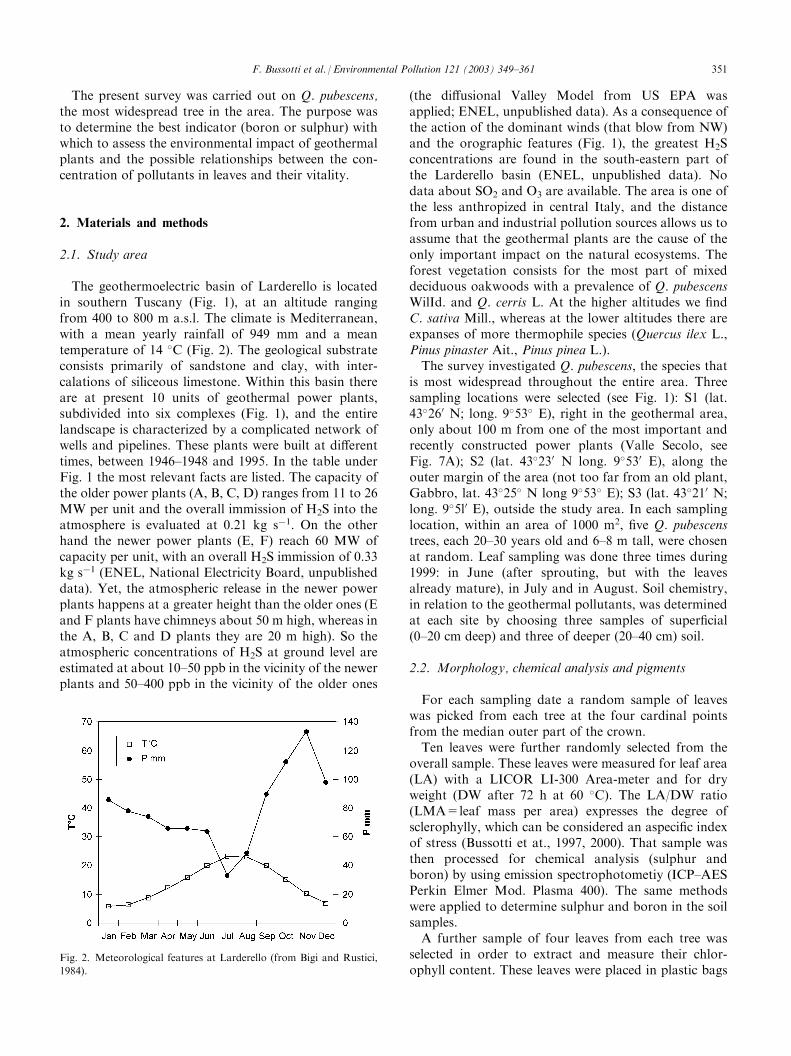
The geothermoelectric basin of Larderello is locatedin southern Tuscany (Fig. 1), at an altitude rangingfrom 400 to 800 m a.s.l. The climate is Mediterranean,with a mean yearly rainfall of 949 mm and a meantemperature of 14 �C (Fig. 2). The geological substrateconsists primarily of sandstone and clay, with inter-calations of siliceous limestone. Within this basin thereare at present 10 units of geothermal power plants,subdivided into six complexes (Fig. 1), and the entirelandscape is characterized by a complicated network ofwells and pipelines. These plants were built at differenttimes, between 1946–1948 and 1995. In the table underFig. 1 the most relevant facts are listed. The capacity ofthe older power plants (A, B, C, D) ranges from 11 to 26MW per unit and the overall immission of H2S into theatmosphere is evaluated at 0.21 kg s�1. On the otherhand the newer power plants (E, F) reach 60 MW ofcapacity per unit, with an overall H2S immission of 0.33kg s�1 (ENEL, National Electricity Board, unpublisheddata). Yet, the atmospheric release in the newer powerplants happens at a greater height than the older ones (Eand F plants have chimneys about 50 m high, whereas inthe A, B, C and D plants they are 20 m high). So theatmospheric concentrations of H2S at ground level areestimated at about 10–50 ppb in the vicinity of the newerplants and 50–400 ppb in the vicinity of the older ones
(the diffusional Valley Model from US EPA wasapplied; ENEL, unpublished data). As a consequence ofthe action of the dominant winds (that blow from NW)and the orographic features (Fig. 1), the greatest H2Sconcentrations are found in the south-eastern part ofthe Larderello basin (ENEL, unpublished data). Nodata about SO2 and O3 are available. The area is one ofthe less anthropized in central Italy, and the distancefrom urban and industrial pollution sources allows us toassume that the geothermal plants are the cause of theonly important impact on the natural ecosystems. Theforest vegetation consists for the most part of mixeddeciduous oakwoods with a prevalence of Q. pubescensWilId. and Q. cerris L. At the higher altitudes we findC. sativa Mill., whereas at the lower altitudes there areexpanses of more thermophile species (Quercus ilex L.,Pinus pinaster Ait., Pinus pinea L.).The survey investigated Q. pubescens, the species thatis most widespread throughout the entire area. Threesampling locations were selected (see Fig. 1): S1 (lat.43�260 N; long. 9�53� E), right in the geothermal area,only about 100 m from one of the most important andrecently constructed power plants (Valle Secolo, seeFig. 7A); S2 (lat. 43�230 N long. 9�530 E), along theouter margin of the area (not too far from an old plant,Gabbro, lat. 43�25� N long 9�53� E); S3 (lat. 43�210 N;long. 9�5l0 E), outside the study area. In each samplinglocation, within an area of 1000 m2, five Q. pubescenstrees, each 20–30 years old and 6–8 m tall, were chosenat random. Leaf sampling was done three times during1999: in June (after sprouting, but with the leavesalready mature), in July and in August. Soil chemistry,in relation to the geothermal pollutants, was determinedat each site by choosing three samples of superficial(0–20 cm deep) and three of deeper (20–40 cm) soil.
2.2. Morphology, chemical analysis and pigments
For each sampling date a random sample of leaveswas picked from each tree at the four cardinal pointsfrom the median outer part of the crown.Ten leaves were further randomly selected from theoverall sample. These leaves were measured for leaf area(LA) with a LICOR LI-300 Area-meter and for dryweight (DW after 72 h at 60 �C). The LA/DW ratio(LMA=leaf mass per area) expresses the degree ofsclerophylly, which can be considered an aspecific indexof stress (Bussotti et at., 1997, 2000). That sample wasthen processed for chemical analysis (sulphur andboron) by using emission spectrophotometiy (ICP–AESPerkin Elmer Mod. Plasma 400). The same methodswere applied to determine sulphur and boron in the soilsamples.A further sample of four leaves from each tree wasselected in order to extract and measure their chlor-ophyll content. These leaves were placed in plastic bags
Fig. 2. Meteorological features at Larderello (from Bigi and Rustici,
1984).
F. Bussotti et al. / Environmental Pollution 121 (2003) 349–361 351
and stored at �80 �C immediately, on the same day theywere collected. The extraction was carried out accordingto the methodologies described by Porra (1991). For thedetermination of the pigments a spectrophotometerShimadzu UV-1204 was used, working at the followingwavelengths: 665.2 nm for chlorophyll a; 652.4 nm forchlorophyll b and 470 nm for carotenoids. Data areexpressed as mg g�1 of dry weight.
2.3. Leaf fluorescence
The trend of the photochemical efficiency of PS II wasmeasured at each sampling in leaves belonging to thesame branchlets (20 leaves per sampling location, fourleaves per tree). A portable ADC-FIM 1500 fluorimeterwas used; before each measurement the leaves werepreadapted to the dark for 30 mm with leaf clips. Thefluorescence parameter Fv/Fm was calculated as(Fm�Fo)/Fm, to measure the PSII photochemicaltrapping efficiency of the dark-adapted state (Butler,1978; Genty et al., 1989). The darkness adaptationinterval allows complete relaxation of all the fast com-ponents of fluorescence quenching (Krause and Weis,1991). Fv/Fm is considered a stress index by manyauthors (Schreiber and Bilger, 1987; Epron et al., 1992;Methy et al., 1996).
2.4. Observations by light microscope (LM) andtransmission electron microscope (TEM)
Foliar samples to be analyzed by light and transmis-sion microscopic analysis were only taken once and thatwas during the July sampling period. Three leaves pertree and two small pieces (2�3 mm) per leaf were pickedfrom the central interveinal leaf area.The observations by light and fluorescent microscopywere performed with a Zeiss Axioplan (Oberckochen,Germany) microscope on fresh sections (40 mm thick)cut with freezing microtome (Reichert-Yung, Wien,Austria), and on sections embedded in historesin (2 mmthick) cut with ultramicrotome Ultracut S (Reichert-Yung, Wien, Austria). The tests performed included:toluidine blue, pH 4.4, on 40 l.Lm thick sections, for thestructure (O’Brien and Mc Cully, 1981); primary fluo-rescence (40 mm thick sections) using a blue excitation450–490 nm filter, a 515 nm blocking filter and a 510 nmdichroic mirror, to determine the chlorophyll response(Adams and Lintilhac, 1993); aniline blue-black, on2 mm thick sections, for proteic substances (Fisher,1968).Foliar samples to be analyzed by transmission elec-tron microscope (TEM) were prefixed in phosphatebuffer (pH 7.2) containing 2.5% glutaraldehyde+4%paraformaldehyde. After 20 h at 5 �C, samples wererinsed twice (2�10 min) in the same buffer, then post-fixed (2 h) in 2% osmium tetroxide prepared in the same
buffer. Subsequently, samples were dehydrated in anincreasing ethanol series (10 min at each stage of thefixation series). Finally, after two 5 min rinses in pro-pylene oxide (100%), the samples were embedded inresin, according to Spurr’s procedure (Spurr, 1969). AReichert Ultracut S microtome was used to cut ultra-thin sections (0.09 mm) with a diamond knife. Thesesections were stained with uranyl acetate and leadcitrate, and then observed with a Philips EM-300microscope.
2.5. Statistics
Descriptive statistics are provided for each parameterassessed. Analysis of variance (ANOVA) with post-hocLSD (least significant difference) mean comparisons wasused for univariate analysis of all parameters. Dis-criminant analysis was used to assess how well samplinglocations and data can be separated by multivariatemeasurements and to test the impact of individual vari-ables on the discrimination. Correlations were non-para-metric (Spearman r coefficient). All statistical routineswere calculated with the program Statistica Statsoft forWindows (Statistica AXXI, Statsoft, Tulsa, OK). Inorder to calculate an overall load index (CPI=Cumu-lative Pollutants Index), the relativized percentage con-centrations of each element were calculated using theformula:
Crelia ¼ 100 Cia=Cmaxð Þ ð1Þ
where Crelia=relative concentration of element i atsampling location and date a; Cia=measured con-centration of element i at sampling location and date a;Cmax=maximum measured concentration of elementamong all sampling locations and all dates.CPI is the sum total of the relativized concentrationsof B and S for each of the three sampling locations (S1,S2 and S3) and the three sampling dates (June, July andAugust):
CPI ¼ 100 Bia=Bmaxð Þ½ þ 100 Sia=Smaxð Þ½ ð2Þ
This index was used in previous biomonitoring sur-veys in urban areas (Ferretti et al., 1998).
3. Results
The concentrations of boron and sulphur in the soilare shown in Fig. 3. Boron was higher at S3, whereassulphur was higher at S1. In most cases (except boron atS1), the concentrations of both elements were higher inthe superficial than in the deeper soil.Foliar symptoms (marginal and interveinal necrosis,see Fig. 7B) became visible at the third sampling
352 F. Bussotti et al. / Environmental Pollution 121 (2003) 349–361

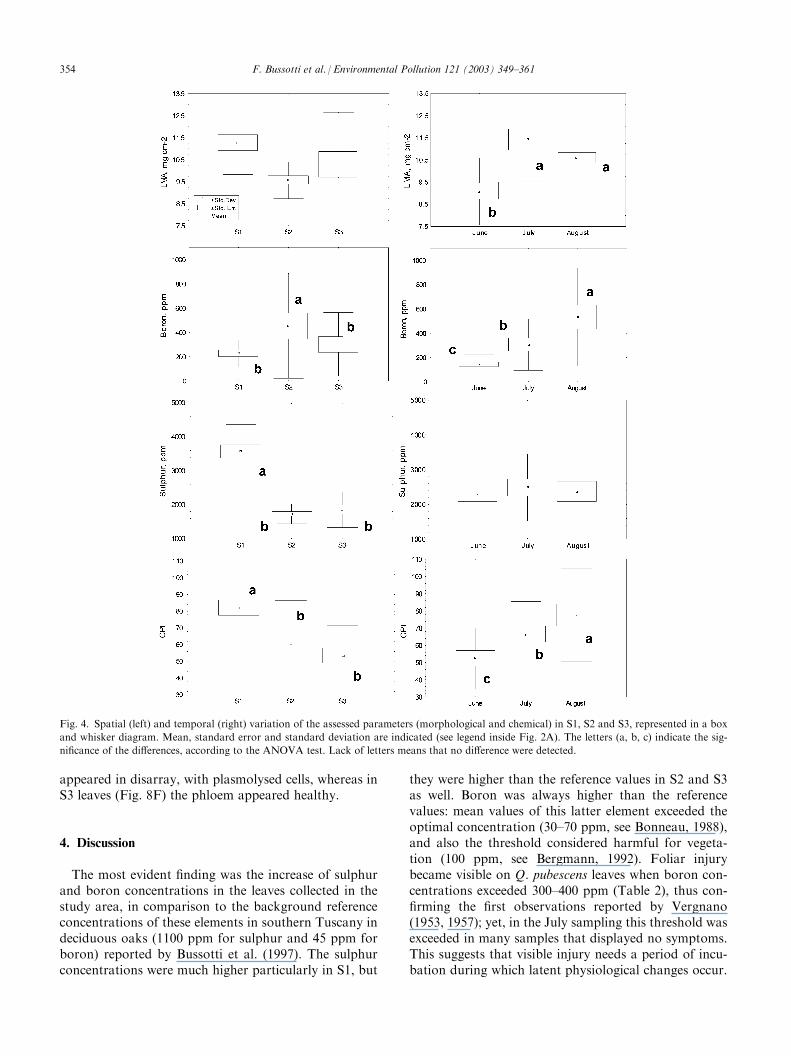
(August). These symptoms were widespread in S1 andS2, but trees growing in S3 also showed mild marginalnecrosis. Statistic figs. are given in Table 1 and Figs. 4and 5. At S1 the leaves had a significantly smaller surfacethan at S2 and S3 (10 leaves measured 149 cm2 at S1 ascompared to 185 cm2 at S2 and S3, P<0.05). Leaf massper area was on average greater at S1, but the differencewas not statistically significant (Fig. 4A). Leaf mass perarea increased during the growth season (Fig. 4B).Foliar sulphur and boron displayed a very differentpattern. Sulphur concentrations in Q. pubescens leaveswere very much higher in S1 than S2 and S3 (Fig. 4C),but these concentrations did not increase during thestudy period (Fig. 4C,D). Boron concentrations werevery variable, ranging from a minimum of 63 ppm to amaximum of 1622 ppm. The coefficient of variation forthis element was 94% (Table 1). The highest levels of Bwere found in S2 (Fig. 4E), and the concentrations ofthis element increased during the study period (Fig. 4F).Applying the Cumulative Pollutants Index [Eq. (2)], S1was found to be the area subjected to the greatest load,whereas S2 and S3 presented rather similar values.There was a noticeable trend (albeit not significant) ofpollutant load reduction as the distance from the geo-thermal area increased (Fig. 4G) to the outer sites. CPIincreased during the study period (Fig. 4H).The possible injuries to the photosynthetic apparatuswere assessed by measuring the chlorophyll content and
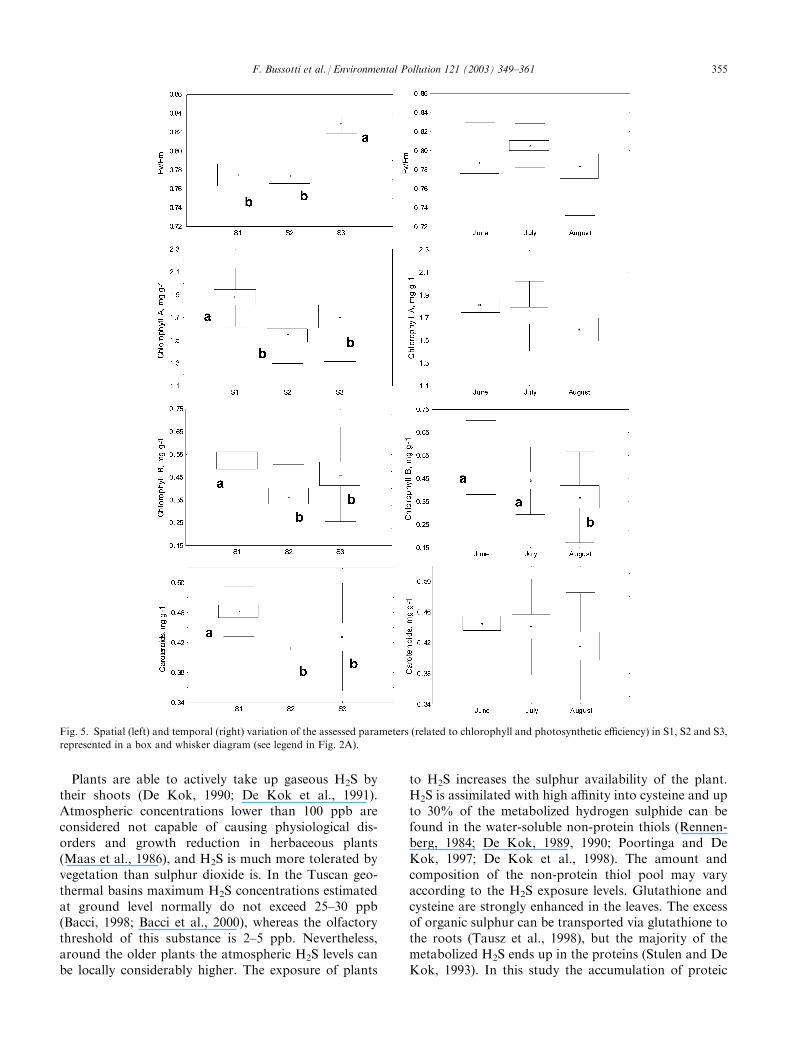
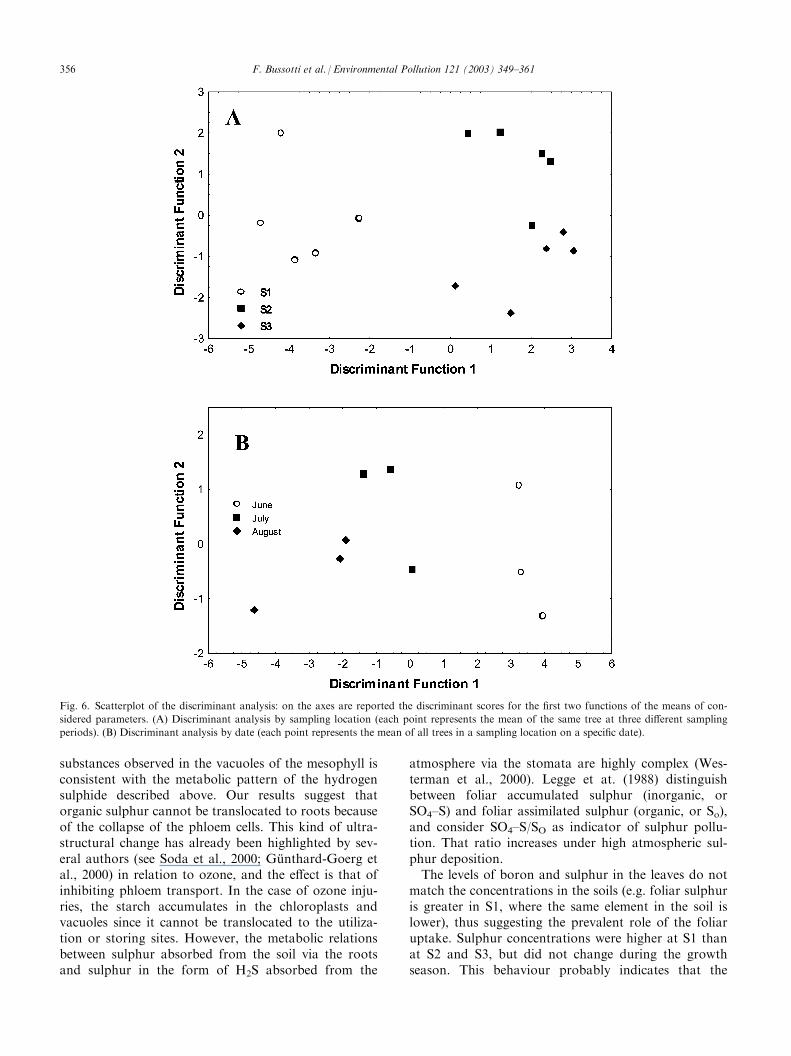
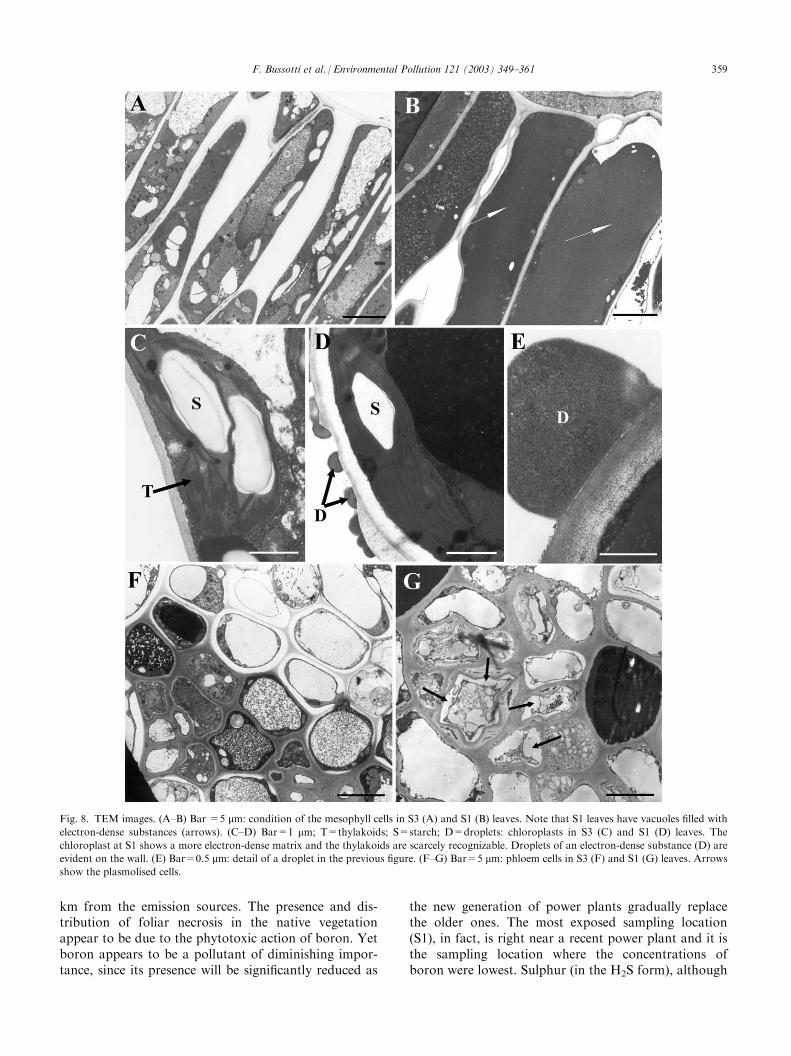
the efficiency of the PSI II. The value of the parameterFv/Fm did not change during the study period, and washigher at S3 compared to the other two sampling loca-tions (Fig. 5A). No changes were detected during thegrowth season (Fig. 5B). On the other hand, chlorophyll(a and b) and carotenoid concentration followed a dif-ferent pattern, being higher at S1 (Fig. 5C,E,G). Chlor-ophylls and carotenoids tended to decrease during thestudy period (Fig. 5D,F,H).Table 2 shows the correlation (Spearman’s R coeffi-cient) between the parameters assessed. Sulphur corre-lated positively with leaf mass per area and chlorophyllconcentration, but negatively with leaf area; whereasboron correlated negatively with chlorophyll con-centration. The Cumulative Pollutants Index correlatedwith leaf morphology (positively with leaf mass per areaand negatively with leaf area), but not with the chlor-ophylls concentration. Fv/Fm did not correlate withany pollutant. Discriminant analysis (Fig. 6) wasapplied to highlight differences between sampling loca-tions (Fig. 6A) and sampling dates (Fig. 6B). One canobserve that S1 was markedly different from S2 and S3:the main parameters causing this differentiation werefoliar sulphur concentration, Fv/Fm, leaf mass per areaand boron concentration (Table 3). Examining thesampling dates, one can observe (Fig. 6B) that the maindifference was between the June samples and the othertwo. The parameters determining this difference werechlorophyll a, leaf mass per area and boron (Table 3).Figs. 7 and 8 show the main findings observed by LM(Fig. 7) and TEM (Fig. 8). They compare the conditionof leaves from the two extreme sampling locations, S1and S3, since the situation at S2 was found to be inter-mediate. Primary fluorescence tests at S1 yield a com-pact red response (Fig. 7C), suggesting that the status ofchloroplasts and chlorophyll content was good. At S3,on the other hand, primary fluorescence was sig-nificantly reduced and this effect was even more markedin the cells of the spongy parenchyma (Fig. 7D). In thistissue the most evident injury (collapsed cells) occurrednear the substomatal chamber (Fig. 7E, arrows). Lastly,in S1 the mesophyll cells appear to be filled with matterof a proteic nature (Fig. 7F, arrow). This feature wasexamined by TEM (Fig. 8). Fig. 8B shows markedlyelectron-dense contents (corresponding to those alreadyobserved by LM and illustrated in Fig. 7F) in thevacuoles of the mesophyll cells of leaves from S1,whereas these contents were absent in leaves from S3(Fig. 8A). The chloroplasts in S1 leaves also had a moreelectron-dense appearance (Fig. 8D) and the structureof the thylakoids was less recognizable than in leavesfrom S3 (Fig. 8C). Outside the walls of the mesophyllcells of the S1 leaves, droplets of substances of a prob-able proteic nature were observed (Fig. 8C, arrows, and8D). These droplets appeared to exude from the cellularcontent. Lastly, the phloem cells in Sl leaves (Fig. 8G)
Fig. 3. Concentration of boron and sulphur in the soil of the three
sampling locations, at two different depths (0–20 and 20–40 cm).
F. Bussotti et al. / Environmental Pollution 121 (2003) 349–361 353
appeared in disarray, with plasmolysed cells, whereas inS3 leaves (Fig. 8F) the phloem appeared healthy.
4. Discussion
The most evident finding was the increase of sulphurand boron concentrations in the leaves collected in thestudy area, in comparison to the background referenceconcentrations of these elements in southern Tuscany indeciduous oaks (1100 ppm for sulphur and 45 ppm forboron) reported by Bussotti et al. (1997). The sulphurconcentrations were much higher particularly in S1, but
they were higher than the reference values in S2 and S3as well. Boron was always higher than the referencevalues: mean values of this latter element exceeded theoptimal concentration (30–70 ppm, see Bonneau, 1988),and also the threshold considered harmful for vegeta-tion (100 ppm, see Bergmann, 1992). Foliar injurybecame visible on Q. pubescens leaves when boron con-centrations exceeded 300–400 ppm (Table 2), thus con-firming the first observations reported by Vergnano(1953, 1957); yet, in the July sampling this threshold wasexceeded in many samples that displayed no symptoms.This suggests that visible injury needs a period of incu-bation during which latent physiological changes occur.
Fig. 4. Spatial (left) and temporal (right) variation of the assessed parameters (morphological and chemical) in S1, S2 and S3, represented in a box
and whisker diagram. Mean, standard error and standard deviation are indicated (see legend inside Fig. 2A). The letters (a, b, c) indicate the sig-
nificance of the differences, according to the ANOVA test. Lack of letters means that no difference were detected.
354 F. Bussotti et al. / Environmental Pollution 121 (2003) 349–361
Plants are able to actively take up gaseous H2S bytheir shoots (De Kok, 1990; De Kok et al., 1991).Atmospheric concentrations lower than 100 ppb areconsidered not capable of causing physiological dis-orders and growth reduction in herbaceous plants(Maas et al., 1986), and H2S is much more tolerated byvegetation than sulphur dioxide is. In the Tuscan geo-thermal basins maximum H2S concentrations estimatedat ground level normally do not exceed 25–30 ppb(Bacci, 1998; Bacci et al., 2000), whereas the olfactorythreshold of this substance is 2–5 ppb. Nevertheless,around the older plants the atmospheric H2S levels canbe locally considerably higher. The exposure of plants
to H2S increases the sulphur availability of the plant.H2S is assimilated with high affinity into cysteine and upto 30% of the metabolized hydrogen sulphide can befound in the water-soluble non-protein thiols (Rennen-berg, 1984; De Kok, 1989, 1990; Poortinga and DeKok, 1997; De Kok et al., 1998). The amount andcomposition of the non-protein thiol pool may varyaccording to the H2S exposure levels. Glutathione andcysteine are strongly enhanced in the leaves. The excessof organic sulphur can be transported via glutathione tothe roots (Tausz et al., 1998), but the majority of themetabolized H2S ends up in the proteins (Stulen and DeKok, 1993). In this study the accumulation of proteic
Fig. 5. Spatial (left) and temporal (right) variation of the assessed parameters (related to chlorophyll and photosynthetic efficiency) in S1, S2 and S3,
represented in a box and whisker diagram (see legend in Fig. 2A).
F. Bussotti et al. / Environmental Pollution 121 (2003) 349–361 355
substances observed in the vacuoles of the mesophyll isconsistent with the metabolic pattern of the hydrogensulphide described above. Our results suggest thatorganic sulphur cannot be translocated to roots becauseof the collapse of the phloem cells. This kind of ultra-structural change has already been highlighted by sev-eral authors (see Soda et al., 2000; Gunthard-Goerg etal., 2000) in relation to ozone, and the effect is that ofinhibiting phloem transport. In the case of ozone inju-ries, the starch accumulates in the chloroplasts andvacuoles since it cannot be translocated to the utiliza-tion or storing sites. However, the metabolic relationsbetween sulphur absorbed from the soil via the rootsand sulphur in the form of H2S absorbed from the
atmosphere via the stomata are highly complex (Wes-terman et al., 2000). Legge et at. (1988) distinguishbetween foliar accumulated sulphur (inorganic, orSO4–S) and foliar assimilated sulphur (organic, or So),and consider SO4–S/SO as indicator of sulphur pollu-tion. That ratio increases under high atmospheric sul-phur deposition.The levels of boron and sulphur in the leaves do notmatch the concentrations in the soils (e.g. foliar sulphuris greater in S1, where the same element in the soil islower), thus suggesting the prevalent role of the foliaruptake. Sulphur concentrations were higher at S1 thanat S2 and S3, but did not change during the growthseason. This behaviour probably indicates that the
Fig. 6. Scatterplot of the discriminant analysis: on the axes are reported the discriminant scores for the first two functions of the means of con-
sidered parameters. (A) Discriminant analysis by sampling location (each point represents the mean of the same tree at three different sampling
periods). (B) Discriminant analysis by date (each point represents the mean of all trees in a sampling location on a specific date).
356 F. Bussotti et al. / Environmental Pollution 121 (2003) 349–361
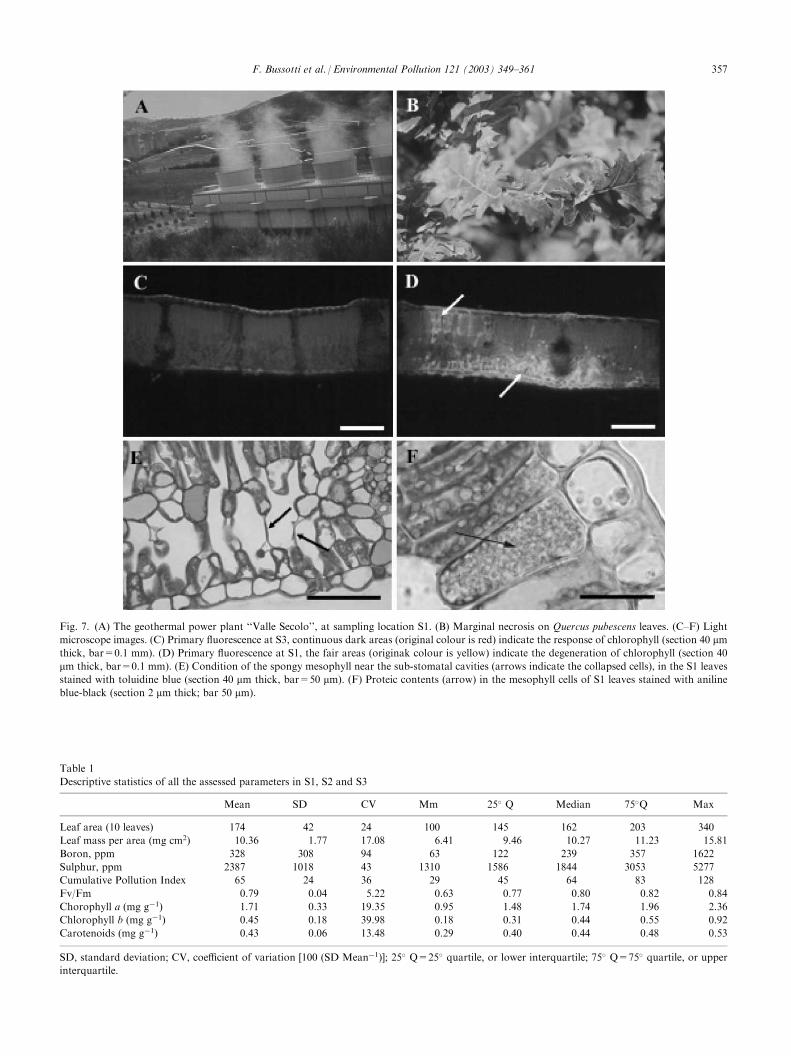
Fig. 7. (A) The geothermal power plant ‘‘Valle Secolo’’, at sampling location S1. (B) Marginal necrosis on Quercus pubescens leaves. (C–F) Light
microscope images. (C) Primary fluorescence at S3, continuous dark areas (original colour is red) indicate the response of chlorophyll (section 40 mmthick, bar=0.1 mm). (D) Primary fluorescence at S1, the fair areas (originak colour is yellow) indicate the degeneration of chlorophyll (section 40
mm thick, bar=0.1 mm). (E) Condition of the spongy mesophyll near the sub-stomatal cavities (arrows indicate the collapsed cells), in the S1 leavesstained with toluidine blue (section 40 mm thick, bar=50 mm). (F) Proteic contents (arrow) in the mesophyll cells of S1 leaves stained with anilineblue-black (section 2 mm thick; bar 50 mm).
Table 1
Descriptive statistics of all the assessed parameters in S1, S2 and S3
Mean SD CV Mm 25� Q Median 75�Q Max
Leaf area (10 leaves) 174 42 24 100 145 162 203 340
Leaf mass per area (mg cm2) 10.36 1.77 17.08 6.41 9.46 10.27 11.23 15.81
Boron, ppm 328 308 94 63 122 239 357 1622
Sulphur, ppm 2387 1018 43 1310 1586 1844 3053 5277
Cumulative Pollution Index 65 24 36 29 45 64 83 128
Fv/Fm 0.79 0.04 5.22 0.63 0.77 0.80 0.82 0.84
Chorophyll a (mg g�1) 1.71 0.33 19.35 0.95 1.48 1.74 1.96 2.36
Chlorophyll b (mg g�1) 0.45 0.18 39.98 0.18 0.31 0.44 0.55 0.92
Carotenoids (mg g�1) 0.43 0.06 13.48 0.29 0.40 0.44 0.48 0.53
SD, standard deviation; CV, coefficient of variation [100 (SD Mean�1)]; 25� Q=25� quartile, or lower interquartile; 75� Q=75� quartile, or upper
interquartile.
F. Bussotti et al. / Environmental Pollution 121 (2003) 349–361 357
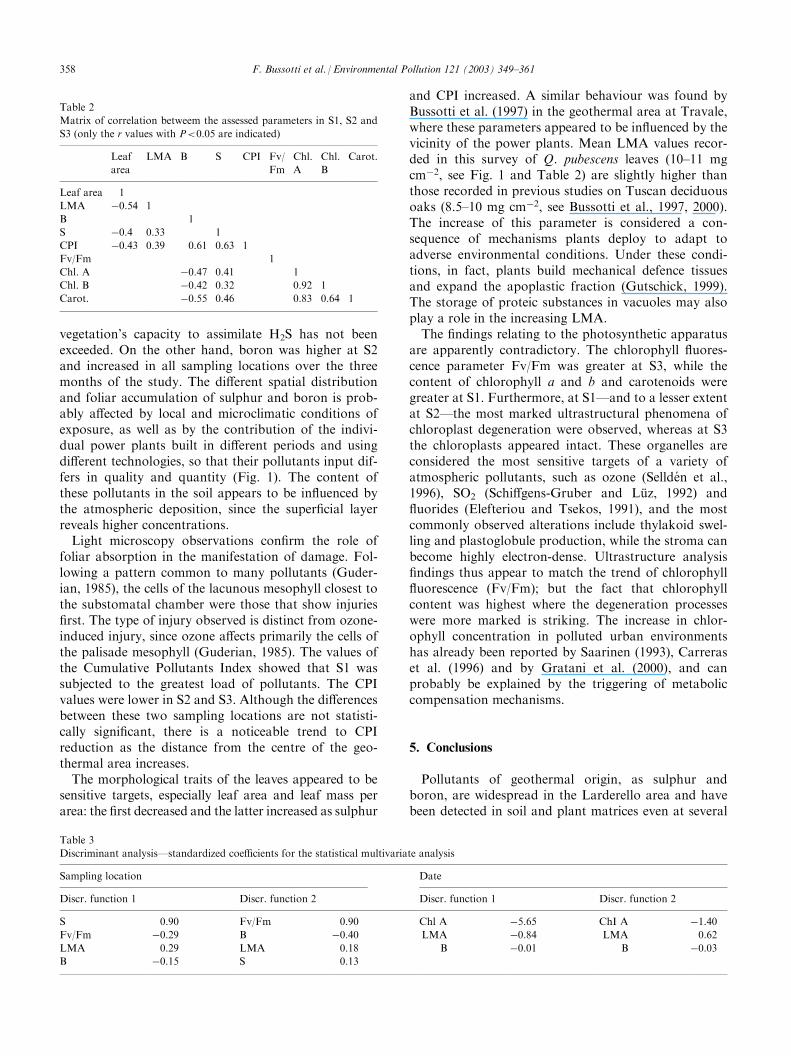
vegetation’s capacity to assimilate H2S has not beenexceeded. On the other hand, boron was higher at S2and increased in all sampling locations over the threemonths of the study. The different spatial distributionand foliar accumulation of sulphur and boron is prob-ably affected by local and microclimatic conditions ofexposure, as well as by the contribution of the indivi-dual power plants built in different periods and usingdifferent technologies, so that their pollutants input dif-fers in quality and quantity (Fig. 1). The content ofthese pollutants in the soil appears to be influenced bythe atmospheric deposition, since the superficial layerreveals higher concentrations.Light microscopy observations confirm the role offoliar absorption in the manifestation of damage. Fol-lowing a pattern common to many pollutants (Guder-ian, 1985), the cells of the lacunous mesophyll closest tothe substomatal chamber were those that show injuriesfirst. The type of injury observed is distinct from ozone-induced injury, since ozone affects primarily the cells ofthe palisade mesophyll (Guderian, 1985). The values ofthe Cumulative Pollutants Index showed that S1 wassubjected to the greatest load of pollutants. The CPIvalues were lower in S2 and S3. Although the differencesbetween these two sampling locations are not statisti-cally significant, there is a noticeable trend to CPIreduction as the distance from the centre of the geo-thermal area increases.The morphological traits of the leaves appeared to besensitive targets, especially leaf area and leaf mass perarea: the first decreased and the latter increased as sulphur
and CPI increased. A similar behaviour was found byBussotti et al. (1997) in the geothermal area at Travale,where these parameters appeared to be influenced by thevicinity of the power plants. Mean LMA values recor-ded in this survey of Q. pubescens leaves (10–11 mgcm�2, see Fig. 1 and Table 2) are slightly higher thanthose recorded in previous studies on Tuscan deciduousoaks (8.5–10 mg cm�2, see Bussotti et al., 1997, 2000).The increase of this parameter is considered a con-sequence of mechanisms plants deploy to adapt toadverse environmental conditions. Under these condi-tions, in fact, plants build mechanical defence tissuesand expand the apoplastic fraction (Gutschick, 1999).The storage of proteic substances in vacuoles may alsoplay a role in the increasing LMA.The findings relating to the photosynthetic apparatusare apparently contradictory. The chlorophyll fluores-cence parameter Fv/Fm was greater at S3, while thecontent of chlorophyll a and b and carotenoids weregreater at S1. Furthermore, at S1—and to a lesser extentat S2—the most marked ultrastructural phenomena ofchloroplast degeneration were observed, whereas at S3the chloroplasts appeared intact. These organelles areconsidered the most sensitive targets of a variety ofatmospheric pollutants, such as ozone (Sellden et al.,1996), SO2 (Schiffgens-Gruber and Luz, 1992) andfluorides (Elefteriou and Tsekos, 1991), and the mostcommonly observed alterations include thylakoid swel-ling and plastoglobule production, while the stroma canbecome highly electron-dense. Ultrastructure analysisfindings thus appear to match the trend of chlorophyllfluorescence (Fv/Fm); but the fact that chlorophyllcontent was highest where the degeneration processeswere more marked is striking. The increase in chlor-ophyll concentration in polluted urban environmentshas already been reported by Saarinen (1993), Carreraset al. (1996) and by Gratani et al. (2000), and canprobably be explained by the triggering of metaboliccompensation mechanisms.
5. Conclusions
Pollutants of geothermal origin, as sulphur andboron, are widespread in the Larderello area and havebeen detected in soil and plant matrices even at several
Table 2
Matrix of correlation betweem the assessed parameters in S1, S2 and
S3 (only the r values with P<0.05 are indicated)
Leaf
area
LMA B S CPI Fv/
Fm
Chl.
A
Chl.
B
Carot.
Leaf area 1
LMA �0.54 1
B 1
S �0.4 0.33 1
CPI �0.43 0.39 0.61 0.63 1
Fv/Fm 1
Chl. A �0.47 0.41 1
Chl. B �0.42 0.32 0.92 1
Carot. �0.55 0.46 0.83 0.64 1
Table 3
Discriminant analysis—standardized coefficients for the statistical multivariate analysis
Sampling location Date
Discr. function 1 Discr. function 2 Discr. function 1 Discr. function 2
S 0.90 Fv/Fm 0.90 Chl A �5.65 ChI A �1.40
Fv/Fm �0.29 B �0.40 LMA �0.84 LMA 0.62
LMA 0.29 LMA 0.18 B �0.01 B �0.03
B �0.15 S 0.13
358 F. Bussotti et al. / Environmental Pollution 121 (2003) 349–361
km from the emission sources. The presence and dis-tribution of foliar necrosis in the native vegetationappear to be due to the phytotoxic action of boron. Yetboron appears to be a pollutant of diminishing impor-tance, since its presence will be significantly reduced as
the new generation of power plants gradually replacethe older ones. The most exposed sampling location(S1), in fact, is right near a recent power plant and it isthe sampling location where the concentrations ofboron were lowest. Sulphur (in the H2S form), although
Fig. 8. TEM images. (A–B) Bar =5 mm: condition of the mesophyll cells in S3 (A) and S1 (B) leaves. Note that S1 leaves have vacuoles filled withelectron-dense substances (arrows). (C–D) Bar=1 mm; T=thylakoids; S=starch; D=droplets: chloroplasts in S3 (C) and S1 (D) leaves. Thechloroplast at S1 shows a more electron-dense matrix and the thylakoids are scarcely recognizable. Droplets of an electron-dense substance (D) are
evident on the wall. (E) Bar=0.5 mm: detail of a droplet in the previous figure. (F–G) Bar=5 mm: phloem cells in S3 (F) and S1 (G) leaves. Arrowsshow the plasmolised cells.
F. Bussotti et al. / Environmental Pollution 121 (2003) 349–361 359
it is theoretically a less phytotoxic pollutant, appears tobe capable of interfering with the metabolism of thenative vegetation. Although the new generation ofpower plants have reduced the soil concentrations. thequantities of atmospheric sulphur absorbed by theleaves are still considerable. For every kWh created,geothermal power plants produce (Bacci, 1998) 100–400g of CO2 (compared to gas-powered plants that produce550, combustible oil plants 850, coal plants 1000) and6–7 g of sulphur (more than gas-powered plants thatonly produce 0.005, but less than oil or coal plants thatproduce 11 g of sulphur). Despite the problems high-lighted in this survey, there is no doubt that this is asource of energy that presents considerable advantages.It will be important to keep under control all unwantedeffects on the ecosystem and to monitor any changesover time induced by technological progress in theextraction and processing procedures.
Acknowledgements
This study was carried out with the financial supportof MURST (Ministero dell’ Universita e della RicercaScientifica). The authors are grateful to Dr. AngeloMarrucci for the documentation provided.
References
Adams, T., Lintilhac, M., 1993. Fluorescence microscopy of fresh tis-
sue as a rapid technique for assessing early injury to mesophyll.
Biotech. Histochem. 68, 3–7.
Bacci, E., 1998. Energia geotermica. Impieghi, implicazioni ambien-
tati, minimizzazione d’impatto. Cedif, ARPAT, Firenze.
Bacci, E., Gaggi, C., Lanzillotti, E., Ferrozzi, S., Valli, L., 2000. Geo-
thermal power plants at Mt. Amiata (Tuscany—Italy): mercury and
hydrogen sulphide deposition revealed by vegetation. Chemosphere
40, 907–911.
Bergmann, W., 1992. Nutritional Disorder of Plants. Development,
Visual and Analytical Diagnosis. Fisher Verlag, Jena, Germany.
Bigi, L., Rustici, L., 1984. Regime idrico dei suoti e tipi climatici in
Toscana. Regione Toscana, Dipartimento di Agricoltura e Foreste,
Firenze, Italy.
Bonneau, M., 1988. La diagnostic foliaire. Rev. For. Fr. 40, 19–28.
Bussotti, F., Cenni, E., Cozzi, A., Ferretti, M., 1997. The impact of
geothermal power plants on forest vegetation. A case study at Tra-
vale (Tuscany, Central Italy). Environ. Monit. Assess. 45, 181–194.
Bussotti, F., Borghini, F., Celesti, C., Leonzio, C., Brusehi, P., 2000.
Leaf morphology and macronutrients in broadleaved trees in Cen-
tral Italy. Trees 14, 361–368.
Butler, W.L., 1978. Energy distribution in the photochemical appara-
tus of photosynthesis. Ann. Rev. Plant Physiol. 29, 345–378.
Carreras, H.A., Canas, M.S., Pignata, M.L., 1996. Differences in
responses to urban air pollutants by Ligustrum lucidum Ait. and
Ligustrum lucidum Ait. F. tricolor (Rehd.). Rehd. Environ. Pollut.
93, 211–218.
Dall’Aglio, M., Ferrara, G.C., 1986. Impatto ambientale dell’energia
geotermica. Acqua-Aria 10, 1031–1041.
Dani, D., Loppi, S., 1994. Danneggiamenti macroscopici in piante
situate in prossimita di centrali geotermiche. Acqua-Aria 6, 513–519.
De Kok, L.J., 1989. Responses of sulphur metabolism in plants to
atmospheric hydrogen sulfide. Phyton 29, 189–201.
De Kok, L.J., 1990. Sulfur metabolism in plants exposed to atmo-
spheric sulfur. In: Rennenberg, H., Brunold, C., De Kok, L.J., Stu-
len, I. (Eds.), Sulfur Nutrition and Sulfur Assimilation in Higher
Plants; Fundamental, Environmental and Agricultural Aspects. SPB
Academic Publishing, The Hague, pp. 111–130.
De Kok, L.J., Rennenberg, H., Kuiper, P.J.C., 1991. The internal
resistance in spinach shoots to atmospheric H2S deposition is
determined by metabolic processes. Plant Physiol. Biochem. 29,
463–470.
De Kok, L.J., Stuiver, C.E.E., Stulen, I., 1998. Impact of atmospheric
H2S on plants. In: De Kok, L.J., Stulen, I. (Eds.), Responses of
Plant Metabolism to Air Pollution and Global Change. Backhuys
Publishers, Leiden, pp. 51–63.
Eleftheriou, E.P., Tsekos, I., 1991. Fluoride effects on leaf ultra-
structure of olive trees growing in the vicinity of the aluminum fac-
tory in Greece. Trees 5, 83–89.
Epron, D., Dreyer, E., Breda, N., 1992. Photosynthesis of oak trees
[Quercus petraea (Matt.) Liebl.] during drought under field condi-
tions: diurnal course of net CO2 assimilation and photochemical
efficiency of photosystem II. Plant Cell Environ. 15, 809–820.
Ferretti, M., Gavilli, G., Grossoni, P., Lorenzini, G., Pellegrini, M.,
1998. Biomonitoraggio di ozono, metalli in traccia, zolfo e cloro a
Firenze net 1996. In: Ferretti, M., Pellegrini, M. (Eds.), Vegetali
come indicatori di inquinamento atmosferico in citta italiane.
Risultati, problemi e prospettive. Comune di Bologna, META Spa
Modena, Provincia di Firenze. Modena, pp. 21–33.
Fisher, D.B., 1968. Protein staining of ribboned epon sections for light
microscopy. Histochem. 16, 92–96.
Genty, B., Briantais, J.M., Baker, N.R., 1989. The relationship
between the quantum yield of photosynthetic electron transport and
quenching of chlorophyll fluorescence. Biochim. Biophys. Acta 990,
253–260.
Gratani, L., Crescente, M.F., Petruzzi, M., 2000. Relationship
between leaf life-span and photosynthetic activity of Quercus ilex in
polluted urban areas (Rome). Environmental Pollution 110, 19–28.
Guderian, R. (Ed.), 1985. Air Pollution by Photochemical Oxidants.
Formation, Transport, Control and Effects on Plants (Ecological
Studies, Vol. 52). Springer Verlag, Berlin.
Gunthard-Goerg, M.S., McQuattie, C.J., Maurer, S., Frey, B., 2000.
Visible and microscopic injury in leaves of five deciduous tree spe-
cies related to current critical ozone levels. Environmental Pollution
109, 489–500.
Gutschick, V.P., 1999. Biotic and abiotic consequences of differences
in leaf structure. New Phytol. 144, 3–18.
Krause, G.H., Weis, E., 1991. Chlorophyll fluorescence and photo-
synthesis: the basic. Ann. Rev. Plant Physiol. Plant Mol. Biol. 42,
313–349.
Legge, A.H., Bogner, J.C., Krupa, S.V., 1988. Foliar sulphur species
in pine: a new indicator of a forest ecosystem under air pollution
stress. Environmental Pollution 55, 15–27.
Loppi, S., Bargagli, R., 1996. Lichen biomonitoring of trace elements
in a geothermal area (central Italy). Wat. Air Soil Pollut. 88, 177–
187.
Loppi, S., Cenni, E., Bussotti, F., Ferretti, M., 1997. Epiphytic lichens
and tree leaves as biomonitors of trace elements released by geo-
thermal power plants. Chem. Ecol. 14, 31–38.
Maas, F.M., De Kok, L.J., Kuiper, P.J.C., 1986. A comparative study
on the effects of H2S and SO2 fumigation on the accumulation of
sulphate and suiphydril compounds in Trifolium pratense L., Glycine
maxMerr. and Phaseoulus vulgaris L. J. Exp. Bot. 38, 1459–1469.
Methy, M., Damesin, C., Rambal, S., 1996. Drought and photosystem
II activity in two Mediterranean oaks. Ann. Sci. For. 53, 255–262.
O’Brien, T.P., Mc Cully, M.E., 1981. The Study of Plant Structure.
Principles and Selected Methods. Termacarphii, Melbourne,
Australia.
360 F. Bussotti et al. / Environmental Pollution 121 (2003) 349–361
Poortinga, A.M., De Kok, L.J., 1997. Utilization of H2S by Spinacea
oleracea L. and consequences for thiol content and composition in
shoots and roots. In: Cram, W.J., De Kok, J.L., Brunold, C.,
Rennenberg, H. (Eds.), Sulphur Metabolism in Higher Plants;
Molecular, Ecophysiological and Nutritional Aspects. Backhuys
Publishers, Leiden, pp. 285–289.
Porra, R.J., 1991. Recent advances and re-assessments in chlorophyll
extration and assay procedures for terrestrial, aquatic and marine
organism, including recalcitrant algae. In: Sheer, H. (Ed.), Chlor-
ophylls. CRC Press, Boca Raton, FL, USA, pp. 31–57.
Rennenberg, H., 1984. The fate of excess sulphur in higher plants.
Ann. Rev. Plant Physiol. 35, 121–153.
Saarinen, T., 1993. Chlorophyll fluorescence, and nitrogen and pig-
ment content of Scots pine (Pinus sylvestris) needles in polluted
urban habitats. Ann. Bot. Fenn. 30, 1–7.
Schiffgens-Gruber, A., Lutz, C., 1992. Ultrastructure of mesophyll cell
chloroplasts of spruce needles exposed to O3, SO2 and NO2 alone
and in combination. Environ. Exp. Bot. 32, 234–254.
Schreiber, U., Bilger, W., 1987. Rapid assessment of stress effects on
plant leaves by chlorophyll fluorescence measurement. In: Tenhu-
nen, J.D., Catarino, F.M., Lange, O.L., Oechel, W.C. (Eds.), Plant
Responses to Stress. Functional Analysis in Mediterranean Ecosys-
tems. NATO ASI Series. Serie G: Ecological Sciences, Vol. 15.
Springer-Verlag, Berlin, Germany, pp. 27–53.
Sellden, G., Sutinen, S., Skarbi, L., 1996. Controlled ozone exposure
and field observations in Fennoscandia. In: Sandermann, H., Well-
burn, A.R., Heath, R.L. (Eds.), Forest Decline and Ozone. A
Comparison of Controlled Chamber and Field Experiments. Eco-
logical Studies, vol. 127. Springer, Berlin, pp. 249–276.
Soda, C., Bussotti, F., Grossoni, P., Barnes, J.D., Mori, B., Tani, C.,
2000. Impacts of urban levels of ozone on Pinus halepensis Mill.
foliage. Environmental and Experimental Botany 44, 69–82.
Spurr, A., 1969. A low viscosity epoxy resin embedding medium for
electron microscopy. J. Ultr. Res. 26, 31–43.
Stulen, I., De Kok, L.J., 1993. Whole plant regulation of sulfur meta-
bolism. In: De Kok, L.J., Stulen, I., Rennenberg, H., Brunold, C.,
Rauser, W.E. (Eds.), Sulfur Nutrition and Assimilation in Higher
Plants; Regulatory, Agricultural and Environmental Aspects. SPB
Academic Publishing, The Hague, pp. 77–91.
Tausz, M., Van der Kooij, T.A.W., Muller, M., De Kok, L.J., Grill,
D., 1998. Uptake and metabolism of oxidized and reduced sulfur
pollutants by spruce trees. In: De Kok, L.J., Stuten, I. (Eds.),
Responses of Plant Metabolism to Air Pollution and Global
Change. Backhuys Publishers, Leiden, pp. 457–460.
Tonani, F., 1957. Ricerche sulla nutrizione minerale delle piante delta
regione borifera toscana. Dosaggio del boro in piante della regione
borifera toscana. Metodo spettrografico. Giorn. Bot. Ital. 64, 641–651.
Vergnano, O., 1953. Caratteristici effetti del boro su piante di olmo e
di pioppo nella zona dei soffioni boraciferi di Travale (Catena
Metallifera Toscana). Giorn. Bot. Ital. 60, 225–229.
Vergnano, O., 1957. Ricerche sulla nutrizione minerale delle piante
della regione borifera toscana. Effetti del boro sul metabolismo degli
elementi macronutritivi. Giorn. Bot. Ital. 564, 652–672.
Verona, O., 1960. Il particolare ambiente ecologico prossimo alle cen-
trali boracifere di Larderello e la boro-tolleranza di alcune specie
vegetali. Giorn. Bot. Ital. 67, 226–237.
Westerman, S., De Kok, L.J., Stuiver, C.E.E., Stulen, I., 2000. Inter-
action between metabolism of atmospheric H2S in the shoot and
sulphate uptake by the roots of curly kale (Brassica oleracea). Phy-
siol. Plant. 109, 443–449.
F. Bussotti et al. / Environmental Pollution 121 (2003) 349–361 361