Effects of Trichoderma asperellum 6S-2 on Apple Tree Growth ...
18
Citation: Wang, H.; Zhang, R.; Mao, Y.; Jiang, W.; Chen, X.; Shen, X.; Yin, C.; Mao, Z. Effects of Trichoderma asperellum 6S-2 on Apple Tree Growth and Replanted Soil Microbial Environment. J. Fungi 2022, 8, 63. https://doi.org/10.3390/jof8010063 Academic Editors: Jennifer Geddes-McAlister and Samantha C. Karunarathna Received: 15 December 2021 Accepted: 6 January 2022 Published: 7 January 2022 Publisher’s Note: MDPI stays neutral with regard to jurisdictional claims in published maps and institutional affil- iations. Copyright: © 2022 by the authors. Licensee MDPI, Basel, Switzerland. This article is an open access article distributed under the terms and conditions of the Creative Commons Attribution (CC BY) license (https:// creativecommons.org/licenses/by/ 4.0/). Fungi Journal of Article Effects of Trichoderma asperellum 6S-2 on Apple Tree Growth and Replanted Soil Microbial Environment Haiyan Wang, Rong Zhang, Yunfei Mao, Weitao Jiang, Xuesen Chen, Xiang Shen, Chengmiao Yin * and Zhiquan Mao * State Key Laboratory of Crop Biology, College of Horticultural Science and Engineering, Shandong Agricultural University, Tai’an 271018, China; [email protected] (H.W.); [email protected] (R.Z.); [email protected] (Y.M.); [email protected] (W.J.); [email protected] (X.C.); [email protected] (X.S.) * Correspondence: [email protected] (C.Y.); [email protected] (Z.M.); Tel.: +86-186-5388-0060 (C.Y.); +86-139-5382-2958 (Z.M.) Abstract: Trichoderma asperellum strain 6S-2 with biocontrol effects and potential growth-promoting properties was made into a fungal fertilizer for the prevention of apple replant disease (ARD). 6S-2 fertilizer not only promoted the growth of Malus hupehensis Rehd seedlings in greenhouse and pot experiments, but also increased the branch elongation growth of young apple trees. The soil microbial community structure changed significantly after the application of 6S-2 fertilizer: the relative abundance of Trichoderma increased significantly, the relative abundance of Fusarium (especially the gene copy numbers of four Fusarium species) and Cryptococcus decreased, and the relative abundance of Bacillus and Streptomyces increased. The bacteria/fungi and soil enzyme activities increased significantly after the application of 6S-2 fertilizer. The relative contents of alkenes, ethyl ethers, and citrullines increased in root exudates of M. hupehensis Rehd treated with 6S-2 fertilizer and were positively correlated with the abundance of Trichoderma. The relative contents of aldehydes, nitriles, and naphthalenes decreased, and they were positively correlated with the relative abundance of Fusarium. In addition, levels of ammonium nitrogen (NH 4 -N), nitrate nitrogen (NO 3 -N), available phosphorus (AP), available potassium (AK), organic matter (SOM), and pH in rhizosphere soil were also significantly related to changes in the microbial community structure. In summary, the application of 6S-2 fertilizer was effective in alleviating some aspects of ARD by promoting plant growth and optimizing the soil microbial community structure. Keywords: ARD; 6S-2 Trichoderma fertilizer; microbial community structure; root exudates; high- throughput sequencing 1. Introduction Apple replant disease (ARD) is a common occurrence in apple-growing regions [1,2]. Both biotic and abiotic factors can cause ARD, but an imbalance in the soil microbial community structure is considered to play a major role [3,4]. Some studies have shown that Fusarium is one of the key causes of ARD in China [5,6]. The specialized Fusarium proliferatum f. sp. malus domestica MR5 (MW600437.1), which is associated with ARD in China, was recently screened and identified in our laboratory; it has been shown to cause serious damage to the apple root system (in review). With the elimination of broad- spectrum chemical fumigants, green and sustainable biological control measures have begun to emerge [4,7–9]. Trichoderma, Bacillus, and Pseudomonas have been made into microbial fertilizers that exhibit broad-spectrum antagonism against pathogens. They are also used to compensate for the deterioration in soil physical and chemical properties caused by the excessive application of chemical fertilizers [10–12]. Compared with other species used to make microbial fertilizer, Trichoderma has ex- hibited a greater tolerance to environmental conditions [10,13,14]. To date, T. harzianum, J. Fungi 2022, 8, 63. https://doi.org/10.3390/jof8010063 https://www.mdpi.com/journal/jof
-
Upload
khangminh22 -
Category
Documents
-
view
0 -
download
0
Transcript of Effects of Trichoderma asperellum 6S-2 on Apple Tree Growth ...
�����������������
Citation: Wang, H.; Zhang, R.; Mao,
Y.; Jiang, W.; Chen, X.; Shen, X.; Yin,
C.; Mao, Z. Effects of Trichoderma
asperellum 6S-2 on Apple Tree Growth
and Replanted Soil Microbial
Environment. J. Fungi 2022, 8, 63.
https://doi.org/10.3390/jof8010063
Academic Editors:
Jennifer Geddes-McAlister and
Samantha C. Karunarathna
Received: 15 December 2021
Accepted: 6 January 2022
Published: 7 January 2022
Publisher’s Note: MDPI stays neutral
with regard to jurisdictional claims in
published maps and institutional affil-
iations.
Copyright: © 2022 by the authors.
Licensee MDPI, Basel, Switzerland.
This article is an open access article
distributed under the terms and
conditions of the Creative Commons
Attribution (CC BY) license (https://
creativecommons.org/licenses/by/
4.0/).
FungiJournal of
Article
Effects of Trichoderma asperellum 6S-2 on Apple Tree Growthand Replanted Soil Microbial EnvironmentHaiyan Wang, Rong Zhang, Yunfei Mao, Weitao Jiang, Xuesen Chen, Xiang Shen, Chengmiao Yin *and Zhiquan Mao *
State Key Laboratory of Crop Biology, College of Horticultural Science and Engineering, Shandong AgriculturalUniversity, Tai’an 271018, China; [email protected] (H.W.); [email protected] (R.Z.);[email protected] (Y.M.); [email protected] (W.J.); [email protected] (X.C.);[email protected] (X.S.)* Correspondence: [email protected] (C.Y.); [email protected] (Z.M.); Tel.: +86-186-5388-0060 (C.Y.);
+86-139-5382-2958 (Z.M.)
Abstract: Trichoderma asperellum strain 6S-2 with biocontrol effects and potential growth-promotingproperties was made into a fungal fertilizer for the prevention of apple replant disease (ARD).6S-2 fertilizer not only promoted the growth of Malus hupehensis Rehd seedlings in greenhouseand pot experiments, but also increased the branch elongation growth of young apple trees. Thesoil microbial community structure changed significantly after the application of 6S-2 fertilizer:the relative abundance of Trichoderma increased significantly, the relative abundance of Fusarium(especially the gene copy numbers of four Fusarium species) and Cryptococcus decreased, and therelative abundance of Bacillus and Streptomyces increased. The bacteria/fungi and soil enzymeactivities increased significantly after the application of 6S-2 fertilizer. The relative contents of alkenes,ethyl ethers, and citrullines increased in root exudates of M. hupehensis Rehd treated with 6S-2fertilizer and were positively correlated with the abundance of Trichoderma. The relative contentsof aldehydes, nitriles, and naphthalenes decreased, and they were positively correlated with therelative abundance of Fusarium. In addition, levels of ammonium nitrogen (NH4-N), nitrate nitrogen(NO3-N), available phosphorus (AP), available potassium (AK), organic matter (SOM), and pH inrhizosphere soil were also significantly related to changes in the microbial community structure.In summary, the application of 6S-2 fertilizer was effective in alleviating some aspects of ARD bypromoting plant growth and optimizing the soil microbial community structure.
Keywords: ARD; 6S-2 Trichoderma fertilizer; microbial community structure; root exudates; high-throughput sequencing
1. Introduction
Apple replant disease (ARD) is a common occurrence in apple-growing regions [1,2].Both biotic and abiotic factors can cause ARD, but an imbalance in the soil microbialcommunity structure is considered to play a major role [3,4]. Some studies have shownthat Fusarium is one of the key causes of ARD in China [5,6]. The specialized Fusariumproliferatum f. sp. malus domestica MR5 (MW600437.1), which is associated with ARDin China, was recently screened and identified in our laboratory; it has been shown tocause serious damage to the apple root system (in review). With the elimination of broad-spectrum chemical fumigants, green and sustainable biological control measures havebegun to emerge [4,7–9]. Trichoderma, Bacillus, and Pseudomonas have been made intomicrobial fertilizers that exhibit broad-spectrum antagonism against pathogens. They arealso used to compensate for the deterioration in soil physical and chemical propertiescaused by the excessive application of chemical fertilizers [10–12].
Compared with other species used to make microbial fertilizer, Trichoderma has ex-hibited a greater tolerance to environmental conditions [10,13,14]. To date, T. harzianum,
J. Fungi 2022, 8, 63. https://doi.org/10.3390/jof8010063 https://www.mdpi.com/journal/jof
J. Fungi 2022, 8, 63 2 of 18
T. atroviride, and T. virens are the most commonly used Trichoderma species [15,16]. Recentstudies have shown that T. asperellum can not only better prevent plant diseases but can alsopromote crop growth [17,18]. T. asperellum has been used for the biological control of dis-eases caused by F. verticillioides [18], and the application of T. asperellum strains reduced thedisease severity of F. oxysporum f. sp. lycopersici in tomato stems and promoted tomato plantgrowth [17]. T. asperellum inoculation has shown potential as an alternative to syntheticfungicide application for the protection of onion from infection by Stemphylium vesicar-ium [19]. The soil application of T. asperellum GDFS1009 granules promoted the growthof maize and inhibited the mycelial growth of F. graminearum by approximately 60% [20].T. asperellum GDFS1009 degrades fungal cells by secreting chitinase, glucanase, and pro-tease and can parasitize harmful fungi; it also produces polyketides, alkanes, and otherantifungal secondary metabolites and peptides that inhibit the growth of pathogens [21].Xylanase secreted by T. asperellum ACCC30536 can stimulate the systemic resistance of hostplants against pathogenic fungi and promote plant growth [22].
Based on these previous findings, T. asperellum shows great potential for use in sus-tainable agriculture. However, domestic biocontrol agents produced from T. asperellum arecurrently used primarily for the prevention and control of annual crop diseases [23,24], andthere have been relatively few studies on its use for ARD. In particular, its effects on the mi-crobial community structure in the apple rhizosphere have not previously been reported. Inearlier research, we isolated an apple root endophyte designated strain 6S-2 and identifiedit as T. asperellum. 6S-2 was shown to be an efficient biocontrol agent against ARD in Chinaand had potential plant-growth-promoting activity [25]. The aims of the present studywere therefore (i) to characterize the effects of 6S-2 fertilizer application on the growth ofapple plants in greenhouse, pot, and field experiments; (ii) to analyze changes in the soilmicrobial community structure after 6S-2 fertilizer application (especially the abundancesof Trichoderma and harmful Fusarium species); (iii) to document changes in root exudates ofM. hupehensis Rehd seedlings after 6S-2 fertilizer application and the relationship betweenthese exudates and the soil microbial community structure; and (iv) to gain insight into themechanisms by which 6S-2 fertilizer alleviates ARD.
2. Materials and Methods2.1. Experimental Sites
The soils for the greenhouse and pot experiments were obtained from a 35-year-oldapple orchard in Manzhuang (36.04◦ N, 117.11◦ E), Tai’an City, Shandong Province, China.The field experiment was performed at three sites in major apple-producing areas ofShandong: Laizhou (37.07◦ N, 119.82◦ E), Qixia (37.34◦ N, 120.85◦ E), and Yiyuan (36.19◦ N,118.17◦ E). The physical and chemical properties of the soils are shown in SupplementaryTable S1.
2.2. Production of 6S-2 Trichoderma Fertilizer
6S-2 was cultivated on PDA medium at 28 ◦C until the spores had grown for approx-imately 6 days; 10 mL of sterile water was then added to the plate, and the spores weregently scraped with a coating rod to make a spore suspension. After removing excesshyphae by filtering through four layers of sterilized lens-cleaning paper, we calculated thespore concentration under a microscope using a hemacytometer. Sterile water was used todilute the spore solution to a concentration of 3.05 × 10⁷ CFU/mL. The spores were thenexpanded using the shallow plate fermentation method [26]. Four hundred grams of sterilemedium (wheat bran and corn flour in a 4:1 volume ratio with 45% sterile water added) wasplaced in a shallow dish (30 cm × 20 cm × 5 cm), and 2% 6S-2 spore solution was added.The dish was covered with sterilized double gauze, incubated at 28 ◦C, and turned onceevery 2 d. After 10 days of fermentation, the culture was air-dried, pulverized, and sievedto obtain T. asperellum 6S-2 spore powder. The concentration of the resulting spore powderwas 9.5 × 10⁸ CFU/mL. The 6S-2 spore powder was mixed with the blank fertilizer carrier(high-temperature sterilized, fully decomposed cow dung) at a ratio of 5%, and the water
J. Fungi 2022, 8, 63 3 of 18
content was kept at 30% to promote natural fermentation. The concentration of spores wasmeasured every day until it reached 1010 CFU/mL. Finally, the spore concentration of 6S-2fertilizer was 2.1 × 10¹⁰ CFU/mL, and it was mixed with replanted soil at a volume ratioof 1%. In the blank carrier, the available nitrogen content was 0.36 mg/g, the availablephosphorus content was 1.49 mg/g, and the available potassium content was 1.03 mg/g.
2.3. Experimental Design
Replanted soil was used for the controls, which were denoted GR (greenhouse), PR(pot), LR (Laizhou), QR (Qixia), and YR (Yiyuan). Treatments that received replanted soilwith blank fertilizer carrier were denoted GC, PC, LC, QC, and YC, and treatments thatreceived replanted soil with 6S-2 fertilizer were denoted GT, PT, LT, QT, and YT.
In mid-January 2021, M. hupehensis Rehd seeds were stratified at 4 ◦C for approximately45 days until they became white. The seeds were then sown into nursery substrate in March2021, and seedlings were selected when they had grown 5–6 true leaves in late April.Seedlings with no diseases or insect pests and uniform growth were selected for use in thesubsequent experiments. Some seedlings were transplanted into white plastic pots (15 cm× 9 cm × 11.5 cm) that contained 4.0 kg of soil (amended with or without the treatmentsabove) for the greenhouse experiment, and others were transplanted into clay basin pots(42 cm × 38 cm × 32 cm) that contained 13.5 kg of soil (with or without treatments) forthe outdoor pot experiments. Each treatment was replicated 20 times, pots were randomlyarranged, and all plants received the same management. For the field experiments, two-year-old grafted apple trees (‘T337’ rootstock and ‘Yanfu No.3’ scion) were planted at thethree field sites with different soil treatments in early March 2021.
Samples were harvested from the greenhouse experiment in early July 2021; sampleswere harvested from the pot experiment in the middle of July, August, and September in2021; and samples were harvested from the field experiment in late October 2021. Whensampling, five samples were obtained from the upper soil layer around each tree, mixedtogether, passed through a 2 mm sieve, and separated into three parts. One was stored in arefrigerator at 4 ◦C and used to determine the numbers of culturable microorganisms. Thesecond was naturally air-dried and used to measure soil enzyme activities. The third wasquickly placed in liquid nitrogen, returned to the laboratory, stored at −80 ◦C, and used forDNA extraction and RT-qPCR analysis. DNA samples from the greenhouse experimentswere sent for high-throughput sequencing.
All measurements were performed using three biological replicates from each treat-ment, and three technical replicates were performed per biological replicate.
2.4. Measurement Indices2.4.1. Plant Related Indicators
The plant heights, stem diameters, and branch lengths were measured in the fieldexperiment using a tower ruler, vernier caliper, and tape measure, respectively; the shootnumbers were also counted. Plant heights and stem diameters of M. hupehensis Rehdseedlings were measured using a meter ruler and vernier caliper, respectively. Dry andfresh weights were measured with an electronic balance. Images of roots were obtainedwith a Scan Maker i800 Plus scanner (Microtek. Shanghai, China), and various root systemparameters were measured using an LA-S plant image analyzer (Hengmei ElectronicTechnology, Weifang, China).
2.4.2. Soil-Related Indicators
Culturable bacteria, fungi, and actinomycetes in the soil were counted using thedilution plate method [27]. The activities of urease, sucrase, neutral phosphatase, andcatalase in the soil were determined using the method of Yang and Wu [28]. Total DNAwas extracted from soil using an E.Z.N.A. soil DNA kit (Omega Bio-tek, Norcross, GA,USA), and the gene copy numbers of four Fusarium species (F. oxysporum, F. proliferatum,F. solani, and F. moniliforme) in the soil were determined using a CFX96TM Thermal Cy-
J. Fungi 2022, 8, 63 4 of 18
cler (Bio-Rad, Beijing, China) [29]. The analysis of the bacterial 16S rRNA gene and thefungal ITS region was performed on the Illumina MiSeq platform (www.i-sanger.com,accessed on 25 November 2021). The sequences of the 16S rRNA primers were 338F (5′-ACTCCTACGGGAGGCAGCAG-3′) and 806R (5′-GGACTACHVGGGTWTCTAAT-3′) [30];the sequences of the ITS primers were ITS1F (5′-CTTGGTCATTTAGAGGAAGTAA-3′) andITS2R (5′-GCTGCGTTCTTCATCGATGC-3′) [31].
2.4.3. Bioinformatics Analysis
Three soil samples from each treatment in the greenhouse experiment were usedfor DNA extraction, PCR, and sequencing on the Illumina platform. Raw fastq fileswere demultiplexed and quality-filtered with Uparse (version 7.0.1090 http://drive5.com/uparse/, accessed on 30 November 2021). The 300 bp reads were truncated at any sitethat received an average quality score of <20 over a 50 bp sliding window, and truncatedreads shorter than 50 bp were discarded. Exact barcode matching was required; readswith a 2-nucleotide mismatch in primer matching and reads that contained ambiguouscharacters were removed. Only sequences that overlapped by more than 10 bp wereassembled according to their overlapping sequence. Operational taxonomic units (OTUs)were clustered with a 97% similarity cutoff. A total of 534,996 high-quality 16S rDNAsequences and 508,218 high-quality ITS sequences were obtained from the nine soil samples(three samples each from the three soil treatments). These sequences were distributedamong 4047 bacterial OTUs and 1004 fungal OTUs. The rarefaction curves showed that thesequencing work was relatively comprehensive in covering bacterial and fungal diversity,as the curves tended to approach saturation (Supplementary Figure S1a,c). The Shannon–Wiener curve indicated that the dataset from the diversity analysis was large enough toreflect the full microbial diversity information in the samples (Supplementary Figure S1b,d).
2.4.4. Determination of Root Exudate Composition
We optimized the methods of Liu et al. [32] and Wang [6] to collect and analyze rootexudates from M. hupehensis Rehd seedlings. Three replicate seedlings from each treatmentfrom greenhouse experiment were removed from their containers in early July 2021, andsurface impurities were washed from their root systems in running water. The roots werethen rinsed with sterile water, and care was taken not to damage them. Each plant wasplaced into a glass flask filled with 1 L sterile water, and all plants were placed in a growthchamber for 48 h (16-h light/8-h dark) at 25 ± 5 ◦C with gentle shaking (50 rpm). Plantswere then removed from their flasks, and the resulting exudate solution was filtered usinga 0.45-µm filter (Millipore) and extracted 3 times with ethyl acetate at a volume ratio of1:1. The three extracts were combined and concentrated to 5 mL under reduced pressureat 30 ◦C. After passing again through a 0.45 µm organic membrane, the crude extract wasused for GC-MS analysis.
Chromatography was performed using an Rtx-5MS column (30 m × 0.32 mm ×0.25 µm) with a column oven temperature of 50 ◦C and an injection port temperature of230 ◦C. The sample was injected with a split ratio of 10.0, and the injection volume was 1 µL.High purity He was used as the carrier gas at a pressure of 117.6 kPa and a column flowrate of 2.4 mL/min. The temperature program was as follows: 50 ◦C for 2 min, increasedto 250 ◦C at 6 ◦C/min, and held for 10 min. The mass spectrometry conditions includedQ3 scan acquisition mode, relative value EMV mode, a full scan acquisition mass range of45–550 amu, ion source EI of 70 eV, and a temperature of 200 ◦C. The experimental resultswere compared with spectra at the NIST 17 database, and the peak area normalizationmethod was used to express the relative content of each metabolite as the ratio of itspeak area relative to the total peak area. The triple quadrupole gas chromatograph–massspectrometer (GCMS-TQ8040 NX) and peak processing software were all from Shimadzu(Beijing, China). The retention time was used for qualitative identification, and the peakareas of external standards were used for quantification.
J. Fungi 2022, 8, 63 5 of 18
2.5. Statistical Analysis
A heatmap of microbial abundance data was constructed using the gplot packagein R. The edge-weighted spring-embedding algorithm pulled together similar relatedproperties and systems with similar structures. Networkx was used to calculate the nodedegree distribution, network diameter, average shortest path, node connectivity (degree),closeness centrality, betweenness centrality, and other network attributes to obtain relevantinformation within or between groups of species and samples. Principal coordinate analysis(PCoA) was performed based on the Bray–Curtis distance matrix calculated from thegenus information of each sample. Hierarchical clustering analysis at the genus level wasperformed using the UPGMA (unweighted pair group method with arithmetic mean)algorithm based on Bray–Curtis distances generated by mothur. LEfSe analysis was alsoperformed; this metagenomic approach uses linear discriminant analysis to determinethe taxa that were most likely to explain differences among treatments. Distance-basedredundancy analysis (db-RDA), a constrained extension of PCoA, was used to show therelationships of environmental factors and treatments to microbial community structureand was performed with the capscale function in the vegan R package. The establishedbiological correlation network was analyzed based on an understanding of graph theory.The data were digitized using Microsoft Excel 2010. Analysis of variance was performedusing IBM SPSS 19.0, and Duncan’s new complex range method was used to assess thesignificance of differences. Data were presented as mean ± SE (standard error). Graph PadPrism 7 was used to construct the figures.
To facilitate subsequent descriptions, the names of the experimental treatments weresimplified and abbreviated as follows: GR (control replant soil in the greenhouse exper-iment); GC (replant soil with blank carrier in the greenhouse experiment); GT (replantsoil with 6S-2 fertilizer in the greenhouse experiment); PR (control replant soil in the potexperiment); PC (replant soil with blank carrier in the pot experiment); PT (replant soilwith 6S-2 fertilizer in the pot experiment); LR (control replant soil in Laizhou); LC (replantsoil with blank carrier in Laizhou); LT (replant soil with 6S-2 fertilizer in Laizhou); QR(control replant soil in Qixia); QC (replant soil with blank carrier in Qixia); QT (replant soilwith 6S-2 fertilizer in Qixia); YR (control replant soil in Yiyuan); YC (replant soil with blankcarrier in Yiyuan); YT (replant soil with 6S-2 fertilizer in Yiyuan).
3. Results3.1. Growth of M. hupehensis Rehd Seedlings and Young Apple Trees
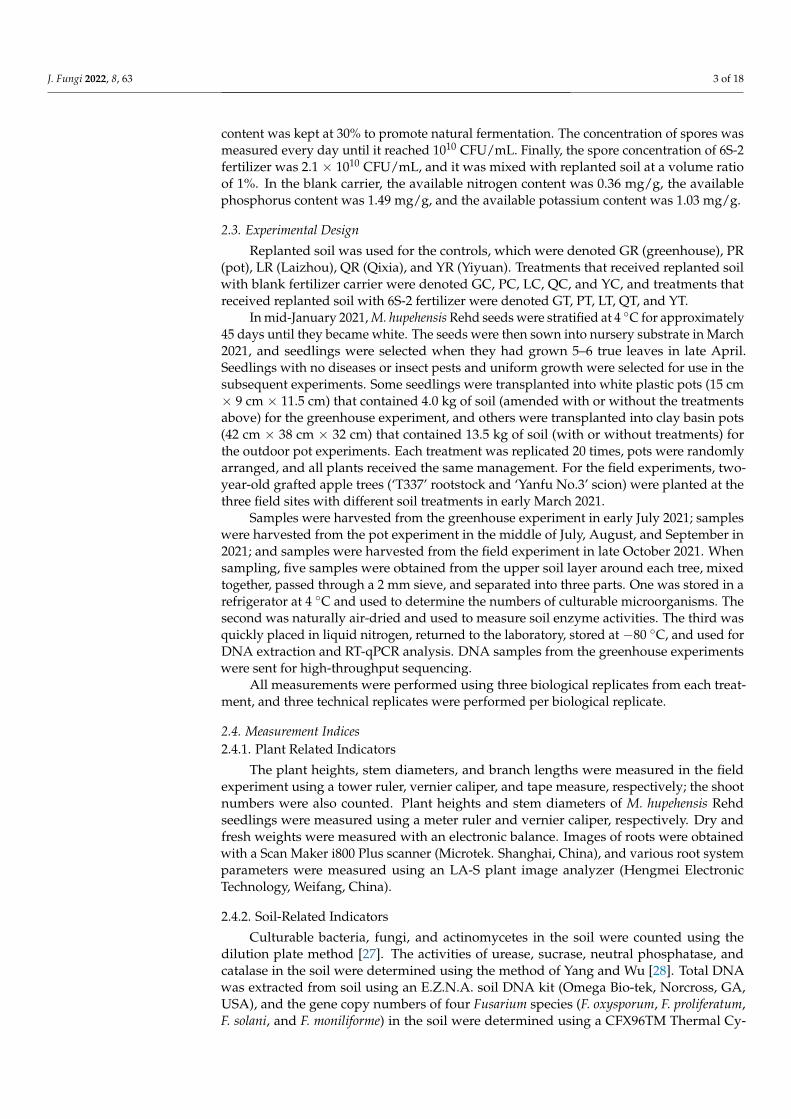
The application of 6S-2 fertilizer promoted the growth of M. hupehensis Rehd seedlingsand two-year-old grafted apple trees (Figure 1). There was a significant difference in plantheight between control plants grown in replant soil and plants grown in replant soil with6S-2 fertilizer (Figure 1b,j,l). Under greenhouse conditions, the root dry and fresh weightsof M. hupehensis Rehd seedlings grown with 6S-2 fertilizer were 1.82- and 1.70-fold higherthan those of the control, and 1.37- and 1.66-fold higher than those of blank carrier-treatedplants (Figure 1h–i). Under field conditions, the application of 6S-2 fertilizer significantlyincreased the number of branches and branch elongation of young apple trees (Figure 1n,o).
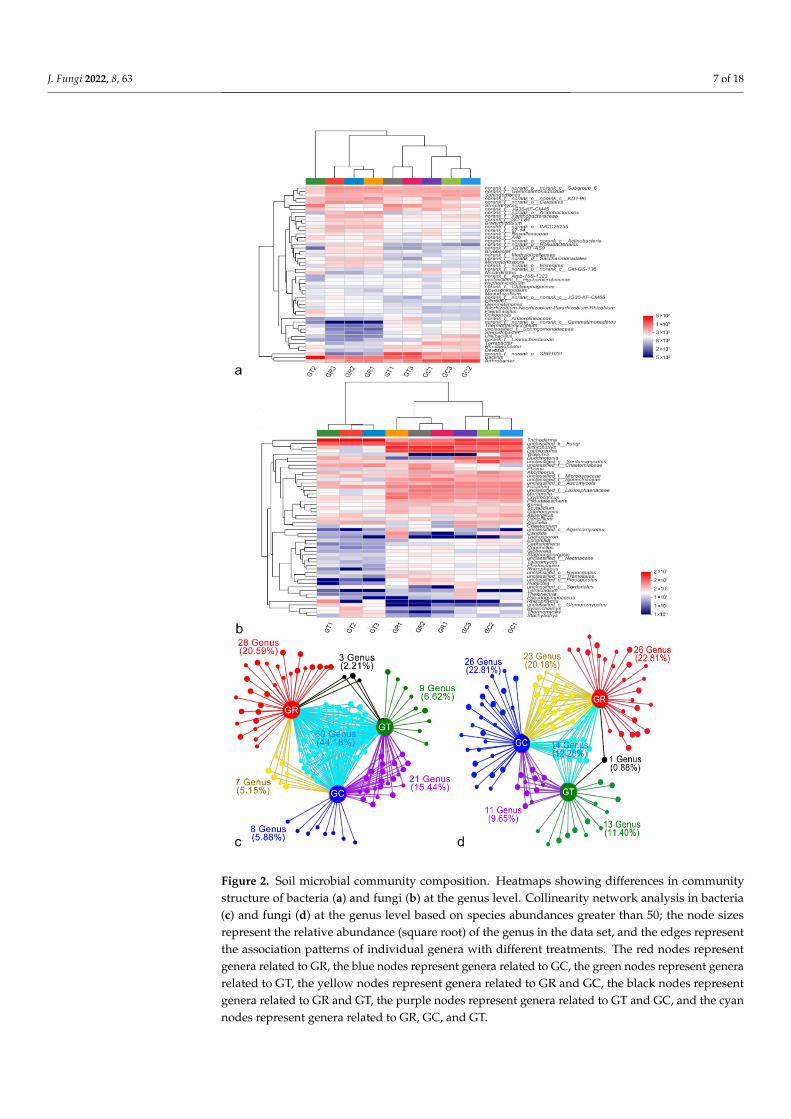
3.2. Analysis of Soil Microbial Community Composition at the Genus Level
The top 50 dominant bacterial and fungal genera across all samples were used toconstruct an abundance heatmap, and differences in the abundances of soil bacteria andfungi were apparent after the application of 6S-2 fertilizer (Figure 2). The fungal com-positions of GT and GC were not clustered on the same branch, indicating that theirfungal communities differed significantly (Figure 2b). At the genus level (after removal ofunidentified strains), Bacillus, Arthrobacter, Streptomyces, Sphingomonas, and Terrabacter werethe dominant bacterial species (Figure 2a; Supplementary Figure S2a), and Trichoderma,Arthrobotrys, Lophiostoma, Duddingtonia, and Fusarium were the dominant fungal species(Figure 2b; Supplementary Figure S2b). After the application of 6S-2 fertilizer, the relativeabundances of Bacillus and Trichoderma increased to 6.91% and 70.48%, respectively, but the
J. Fungi 2022, 8, 63 6 of 18
relative abundance of Fusarium decreased significantly (Figure 2; Supplementary Figure S3).Collinearity network analysis at the genus level showed that the GR and GT groups sharedthe smallest proportion of specific bacteria and fungi, accounting for only 2.21% and 0.88%,respectively (Figure 2c,d).
J. Fungi 2022, 8, x FOR PEER REVIEW 6 of 20
Figure 1. Phenotypes of plants that received different soil treatments in greenhouse, pot, and field experiments (a). Plant height (b), stem diameter (c), aboveground fresh weight (d), aboveground dry weight (e), root surface area (f), root volume (g), aboveground fresh weight (h), and below-ground dry weight (i) of M. hupehensis Rehd seedlings in the greenhouse experiment. Plant height (j) and stem diameter (k) of M. hupehensis Rehd grown in pots from July to September 2021. Plant height (l), stem diameter (m), branch number (n), and branch length (o) of young apple trees in the field experiment in October 2021. GR, control replant soil in the greenhouse experiment; GC, replant soil with blank carrier in the greenhouse experiment; GT, replant soil with 6S-2 fertilizer in the greenhouse experiment; PR, control replant soil in the pot experiment; PC, replant soil with blank carrier in the pot experiment; PT, replant soil with 6S-2 fertilizer in the pot experiment; LR, control replant soil in Laizhou; LC, replant soil with blank carrier in Laizhou; LT, replant soil with 6S-2 fertilizer in Laizhou; QR, control replant soil in Qixia; QC, replant soil with blank carrier in Qixia; QT, replant soil with 6S-2 fertilizer in Qixia; YR, control replant soil in Yiyuan; YC, replant soil with blank carrier in Yiyuan; YT, replant soil with 6S-2 fertilizer in Yiyuan. The displayed data were presented as mean ± SE (standard error). Different lowercase letters in the same column indicate a significant difference at p ≤ 0.05 level by Duncan’s new multiple range test. The same treatment names and statistical tests were used in subsequent figures.
3.2. Analysis of Soil Microbial Community Composition at the Genus Level The top 50 dominant bacterial and fungal genera across all samples were used to
construct an abundance heatmap, and differences in the abundances of soil bacteria and fungi were apparent after the application of 6S-2 fertilizer (Figure 2). The fungal compo-sitions of GT and GC were not clustered on the same branch, indicating that their fungal
Figure 1. Phenotypes of plants that received different soil treatments in greenhouse, pot, and fieldexperiments (a). Plant height (b), stem diameter (c), aboveground fresh weight (d), aboveground dryweight (e), root surface area (f), root volume (g), aboveground fresh weight (h), and belowgrounddry weight (i) of M. hupehensis Rehd seedlings in the greenhouse experiment. Plant height (j) andstem diameter (k) of M. hupehensis Rehd grown in pots from July to September 2021. Plant height(l), stem diameter (m), branch number (n), and branch length (o) of young apple trees in the fieldexperiment in October 2021. GR, control replant soil in the greenhouse experiment; GC, replant soilwith blank carrier in the greenhouse experiment; GT, replant soil with 6S-2 fertilizer in the greenhouseexperiment; PR, control replant soil in the pot experiment; PC, replant soil with blank carrier in thepot experiment; PT, replant soil with 6S-2 fertilizer in the pot experiment; LR, control replant soil inLaizhou; LC, replant soil with blank carrier in Laizhou; LT, replant soil with 6S-2 fertilizer in Laizhou;QR, control replant soil in Qixia; QC, replant soil with blank carrier in Qixia; QT, replant soil with6S-2 fertilizer in Qixia; YR, control replant soil in Yiyuan; YC, replant soil with blank carrier in Yiyuan;YT, replant soil with 6S-2 fertilizer in Yiyuan. The displayed data were presented as mean ± SE(standard error). Different lowercase letters in the same column indicate a significant difference atp ≤ 0.05 level by Duncan’s new multiple range test. The same treatment names and statistical testswere used in subsequent figures.
J. Fungi 2022, 8, 63 7 of 18
J. Fungi 2022, 8, x FOR PEER REVIEW 7 of 20
communities differed significantly (Figure 2b). At the genus level (after removal of uni-dentified strains), Bacillus, Arthrobacter, Streptomyces, Sphingomonas, and Terrabacter were the dominant bacterial species (Figure 2a; Supplementary Figure S2a), and Trichoderma, Arthrobotrys, Lophiostoma, Duddingtonia, and Fusarium were the dominant fungal species (Figure 2b; Supplementary Figure S2b). After the application of 6S-2 fertilizer, the relative abundances of Bacillus and Trichoderma increased to 6.91% and 70.48%, respectively, but the relative abundance of Fusarium decreased significantly (Figure 2; Supplementary Fig-ure S3). Collinearity network analysis at the genus level showed that the GR and GT groups shared the smallest proportion of specific bacteria and fungi, accounting for only 2.21% and 0.88%, respectively (Figure 2c,d).
Figure 2. Soil microbial community composition. Heatmaps showing differences in communitystructure of bacteria (a) and fungi (b) at the genus level. Collinearity network analysis in bacteria(c) and fungi (d) at the genus level based on species abundances greater than 50; the node sizesrepresent the relative abundance (square root) of the genus in the data set, and the edges representthe association patterns of individual genera with different treatments. The red nodes representgenera related to GR, the blue nodes represent genera related to GC, the green nodes represent generarelated to GT, the yellow nodes represent genera related to GR and GC, the black nodes representgenera related to GR and GT, the purple nodes represent genera related to GT and GC, and the cyannodes represent genera related to GR, GC, and GT.
J. Fungi 2022, 8, 63 8 of 18
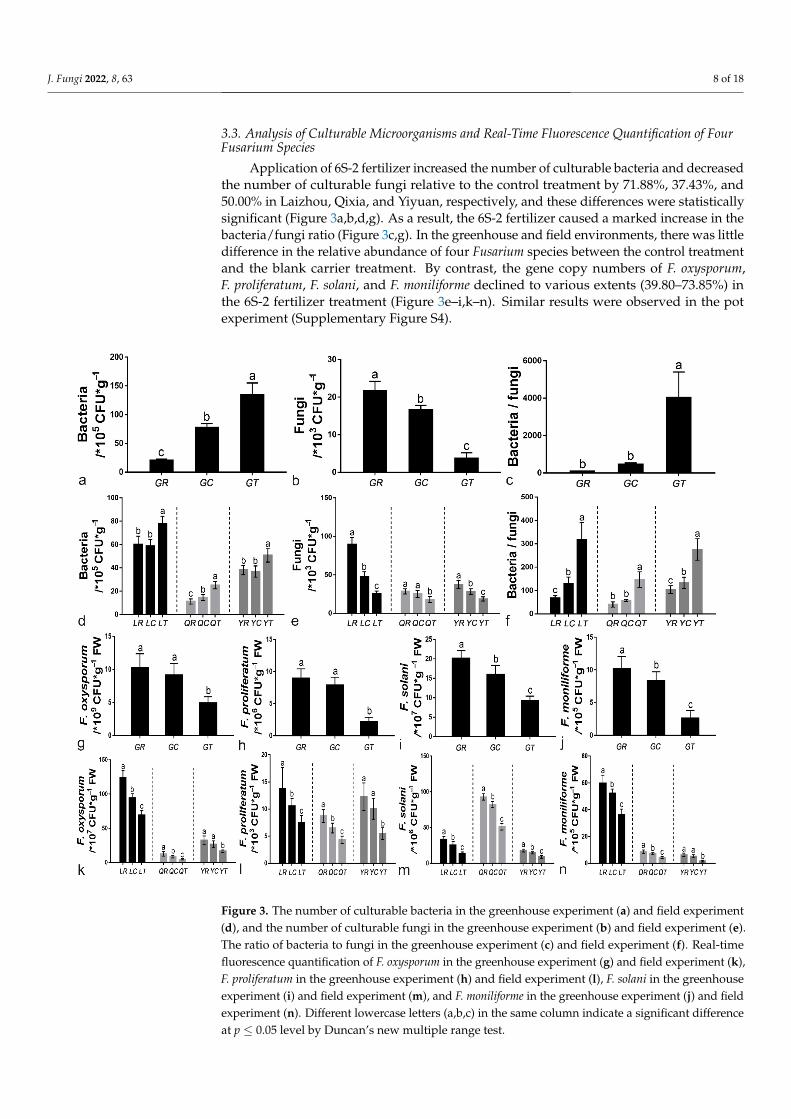
3.3. Analysis of Culturable Microorganisms and Real-Time Fluorescence Quantification of FourFusarium Species
Application of 6S-2 fertilizer increased the number of culturable bacteria and decreasedthe number of culturable fungi relative to the control treatment by 71.88%, 37.43%, and50.00% in Laizhou, Qixia, and Yiyuan, respectively, and these differences were statisticallysignificant (Figure 3a,b,d,g). As a result, the 6S-2 fertilizer caused a marked increase in thebacteria/fungi ratio (Figure 3c,g). In the greenhouse and field environments, there was littledifference in the relative abundance of four Fusarium species between the control treatmentand the blank carrier treatment. By contrast, the gene copy numbers of F. oxysporum,F. proliferatum, F. solani, and F. moniliforme declined to various extents (39.80–73.85%) inthe 6S-2 fertilizer treatment (Figure 3e–i,k–n). Similar results were observed in the potexperiment (Supplementary Figure S4).
J. Fungi 2022, 8, x FOR PEER REVIEW 8 of 20
Figure 2. Soil microbial community composition. Heatmaps showing differences in community structure of bacteria (a) and fungi (b) at the genus level. Collinearity network analysis in bacteria (c) and fungi (d) at the genus level based on species abundances greater than 50; the node sizes repre-sent the relative abundance (square root) of the genus in the data set, and the edges represent the association patterns of individual genera with different treatments. The red nodes represent genera related to GR, the blue nodes represent genera related to GC, the green nodes represent genera related to GT, the yellow nodes represent genera related to GR and GC, the black nodes represent genera related to GR and GT, the purple nodes represent genera related to GT and GC, and the cyan nodes represent genera related to GR, GC, and GT.
3.3. Analysis of Culturable Microorganisms and Real-Time Fluorescence Quantification of Four Fusarium Species
Application of 6S-2 fertilizer increased the number of culturable bacteria and de-creased the number of culturable fungi relative to the control treatment by 71.88%, 37.43%, and 50.00% in Laizhou, Qixia, and Yiyuan, respectively, and these differences were statis-tically significant (Figure 3a,b,d,g). As a result, the 6S-2 fertilizer caused a marked increase in the bacteria/fungi ratio (Figure 3c,g). In the greenhouse and field environments, there was little difference in the relative abundance of four Fusarium species between the control treatment and the blank carrier treatment. By contrast, the gene copy numbers of F. ox-ysporum, F. proliferatum, F. solani, and F. moniliforme declined to various extents (39.80–73.85%) in the 6S-2 fertilizer treatment (Figure 3e–i,k–n). Similar results were observed in the pot experiment (Supplementary Figure S4).
Figure 3. The number of culturable bacteria in the greenhouse experiment (a) and field experiment(d), and the number of culturable fungi in the greenhouse experiment (b) and field experiment (e).The ratio of bacteria to fungi in the greenhouse experiment (c) and field experiment (f). Real-timefluorescence quantification of F. oxysporum in the greenhouse experiment (g) and field experiment (k),F. proliferatum in the greenhouse experiment (h) and field experiment (l), F. solani in the greenhouseexperiment (i) and field experiment (m), and F. moniliforme in the greenhouse experiment (j) and fieldexperiment (n). Different lowercase letters (a,b,c) in the same column indicate a significant differenceat p ≤ 0.05 level by Duncan’s new multiple range test.
J. Fungi 2022, 8, 63 9 of 18
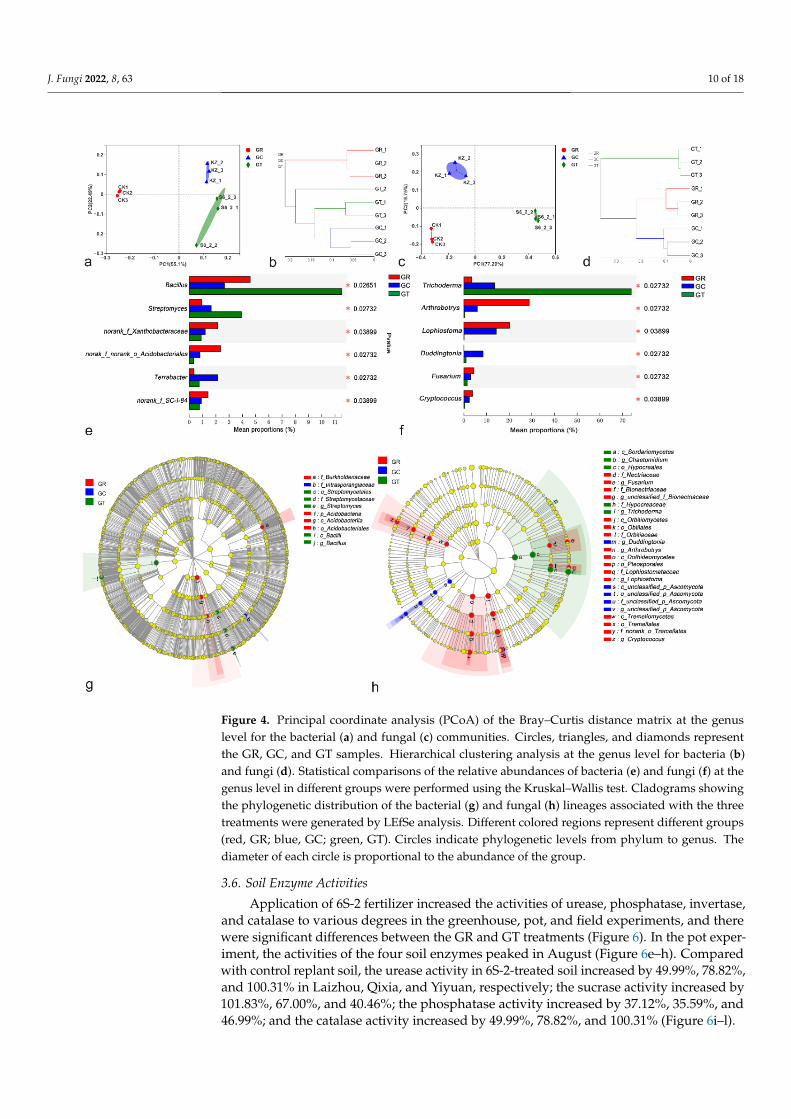
3.4. Differences in Microbial Species among Treatments
A PCoA of Bray–Curtis distance matrix distances between samples revealed differ-ences in their bacterial and fungal communities. The first two principal component scoresaccounted for 77.59% of the total variation in bacteria (Figure 4a) and for 94.04% of thetotal variation in fungi (Figure 4c), suggesting that the application of 6S-2 fertilizers may beone of the important factors driving changes in the microbial community structure. Basedon their different microbial communities, samples were clustered into two groups, one ofwhich corresponded to GR in bacteria (Figure 4b) and the other to GT in fungi (Figure 4d).Overall, the results demonstrated a clear division between GR and GT. At the genus level,the top six genera of both bacteria and fungi differed significantly among the three groups.Bacillus, Streptomyces, and Trichoderma were more abundant after 6S-2 fertilizer application,whereas Arthrobotrys, Lophiostoma, and Fusarium declined markedly (Figure 4e,f). Groupswere displayed in cladograms, and LDA scores of 4 or greater were confirmed by LEfSe(Figure 4g,h; Supplementary Figure S5). Two groups of bacteria and five groups of fungiwere significantly enriched in GR: Acidobacteriales (from phylum to order), Burkholderiaceae(family), Cryptococcus (from class to genus), Lophiostoma (from class to genus), Arthrobotrys(from class to genus), Fusarium (from family to genus), and Bionectriaceae (from family togenus). Fewer microbes were significantly enriched in GC. Two groups of bacteria andtwo groups of fungi were significantly enriched in GT: Streptomyces (from order to genus),Bacillus (genus and its class Bacilli), Chaetomidium (genus, the class Sordariomycetes andthe order Hypocreales), and Trichoderma (from family to genus). These results showedthat there was a significant difference in the composition of the soil microbial communitybetween GR and GT.
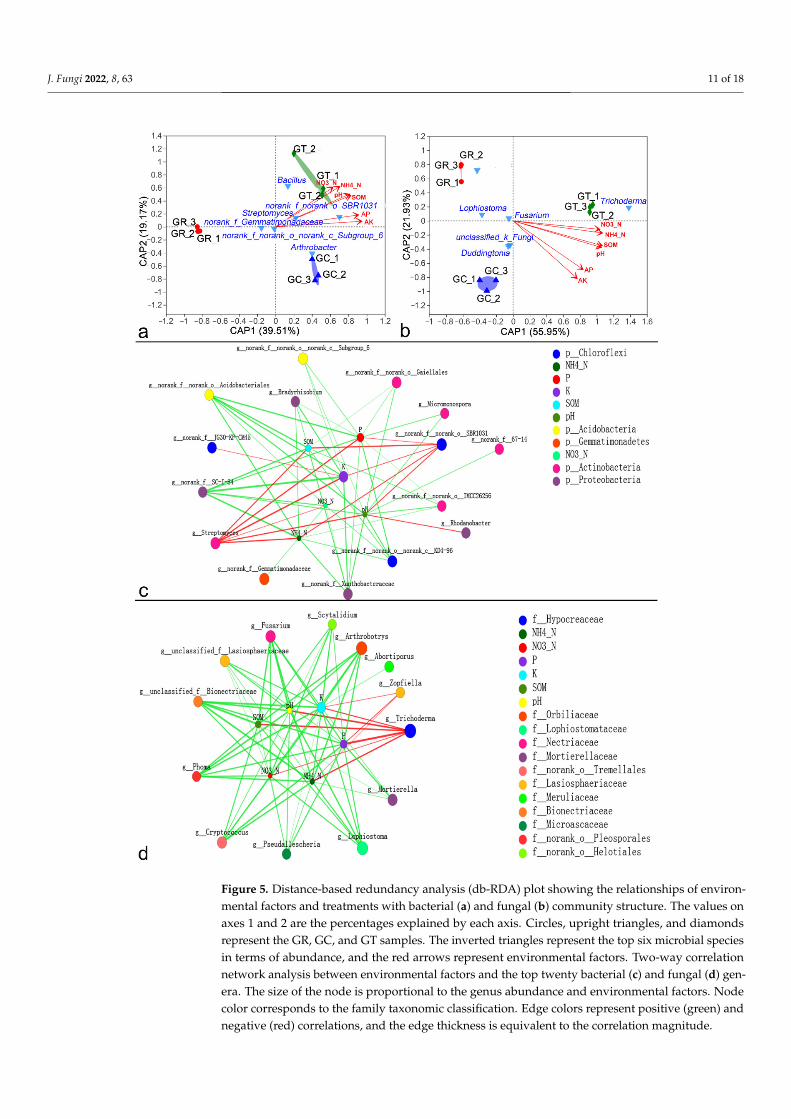
3.5. Relationships between Microbial Community Structure and Environmental Factors
Db-RDA revealed that the soil microbial community structure was influenced byenvironmental factors, including ammonium nitrogen (NH4-N), nitrate nitrogen (NO3-N),available phosphorus (AP), available potassium (AK), soil organic matter (SOM), and pH inrhizosphere soil. All these factors significantly affected the bacterial and fungal communitystructure (p ≤ 0.05) (Figure 5a,b; Supplementary Table S2). The GT groups were positivelycorrelated with environmental factors, but the GR groups were negatively correlated withthem (Figure 5a,b). Two-way correlation network analysis showed that bacterial generaand fungal genera had different relationships with environmental factors (Figure 5c,d).Streptomyces and Trichoderma showed significant positive correlations with all environmen-tal factors, whereas Fusarium, Lophiostoma, Arthrobotrys, and Cryptococcus showed a highlysignificant negative correlation with NH4-N, NO3-N, AP, AK, SOM, and pH (Supplemen-tary Figure S6). There were antagonistic or synergistic effects between different microbialgenera, and the top six most abundant bacterial species showed fewer associations. Fusar-ium, Lophiostoma, Arthrobotrys, and Cryptococcus showed synergistic relationships with oneanother but showed strong antagonism toward Trichoderma (Supplementary Figure S7).
J. Fungi 2022, 8, 63 10 of 18J. Fungi 2022, 8, x FOR PEER REVIEW 10 of 20
Figure 4. Principal coordinate analysis (PCoA) of the Bray–Curtis distance matrix at the genus level for the bacterial (a) and fungal (c) communities. Circles, triangles, and diamonds represent the GR, GC, and GT samples. Hierarchical clustering analysis at the genus level for bacteria (b) and fungi (d). Statistical comparisons of the relative abundances of bacteria (e) and fungi (f) at the genus level in different groups were performed using the Kruskal–Wallis test. Cladograms showing the phylo-genetic distribution of the bacterial (g) and fungal (h) lineages associated with the three treatments were generated by LEfSe analysis. Different colored regions represent different groups (red, GR; blue, GC; green, GT). Circles indicate phylogenetic levels from phylum to genus. The diameter of each circle is proportional to the abundance of the group.
3.5. Relationships between Microbial Community Structure and Environmental Factors Db-RDA revealed that the soil microbial community structure was influenced by en-
vironmental factors, including ammonium nitrogen (NH4-N), nitrate nitrogen (NO3-N), available phosphorus (AP), available potassium (AK), soil organic matter (SOM), and pH in rhizosphere soil. All these factors significantly affected the bacterial and fungal com-munity structure (p ≤ 0.05) (Figure 5a,b; Supplementary Table S2). The GT groups were positively correlated with environmental factors, but the GR groups were negatively cor-related with them (Figure 5a,b). Two-way correlation network analysis showed that bac-terial genera and fungal genera had different relationships with environmental factors (Figure 5c,d). Streptomyces and Trichoderma showed significant positive correlations with all environmental factors, whereas Fusarium, Lophiostoma, Arthrobotrys, and Cryptococcus showed a highly significant negative correlation with NH4-N, NO3-N, AP, AK, SOM, and
Figure 4. Principal coordinate analysis (PCoA) of the Bray–Curtis distance matrix at the genuslevel for the bacterial (a) and fungal (c) communities. Circles, triangles, and diamonds representthe GR, GC, and GT samples. Hierarchical clustering analysis at the genus level for bacteria (b)and fungi (d). Statistical comparisons of the relative abundances of bacteria (e) and fungi (f) at thegenus level in different groups were performed using the Kruskal–Wallis test. Cladograms showingthe phylogenetic distribution of the bacterial (g) and fungal (h) lineages associated with the threetreatments were generated by LEfSe analysis. Different colored regions represent different groups(red, GR; blue, GC; green, GT). Circles indicate phylogenetic levels from phylum to genus. Thediameter of each circle is proportional to the abundance of the group.
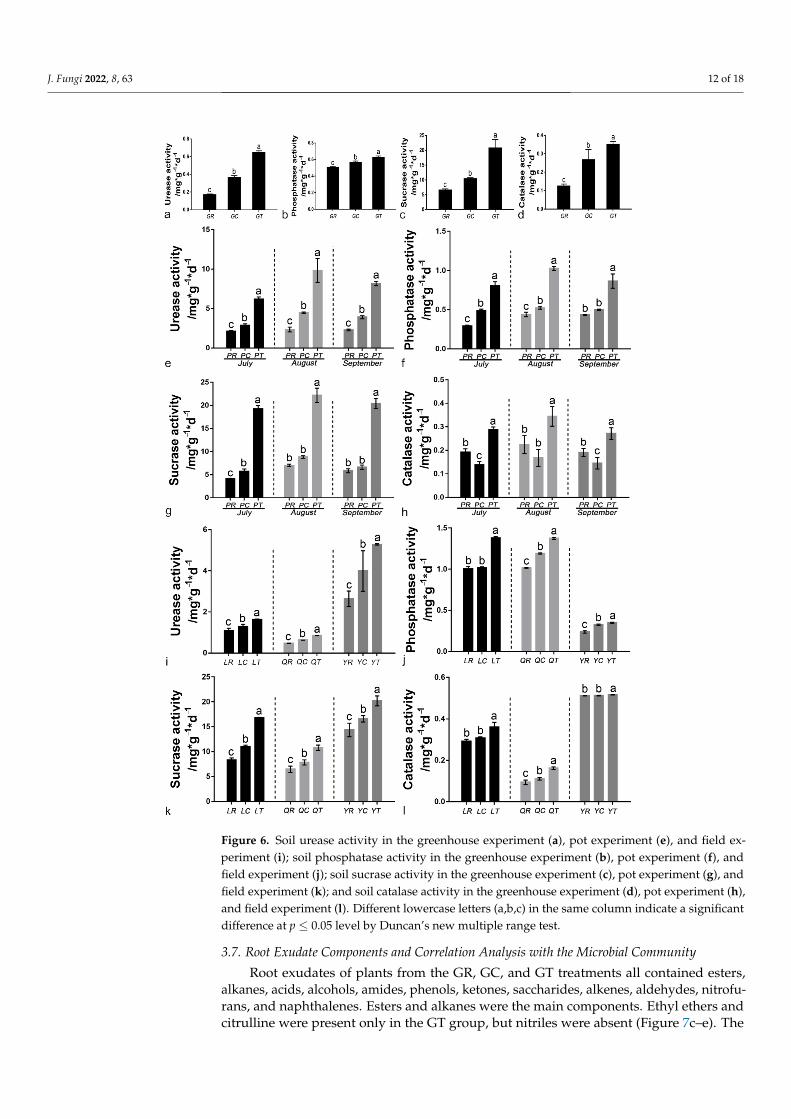
3.6. Soil Enzyme Activities
Application of 6S-2 fertilizer increased the activities of urease, phosphatase, invertase,and catalase to various degrees in the greenhouse, pot, and field experiments, and therewere significant differences between the GR and GT treatments (Figure 6). In the pot exper-iment, the activities of the four soil enzymes peaked in August (Figure 6e–h). Comparedwith control replant soil, the urease activity in 6S-2-treated soil increased by 49.99%, 78.82%,and 100.31% in Laizhou, Qixia, and Yiyuan, respectively; the sucrase activity increased by101.83%, 67.00%, and 40.46%; the phosphatase activity increased by 37.12%, 35.59%, and46.99%; and the catalase activity increased by 49.99%, 78.82%, and 100.31% (Figure 6i–l).
J. Fungi 2022, 8, 63 11 of 18
J. Fungi 2022, 8, x FOR PEER REVIEW 11 of 20
pH (Supplementary Figure S6). There were antagonistic or synergistic effects between dif-ferent microbial genera, and the top six most abundant bacterial species showed fewer associations. Fusarium, Lophiostoma, Arthrobotrys, and Cryptococcus showed synergistic re-lationships with one another but showed strong antagonism toward Trichoderma (Supple-mentary Figure S7).
Figure 5. Distance-based redundancy analysis (db-RDA) plot showing the relationships of environ-mental factors and treatments with bacterial (a) and fungal (b) community structure. The values on Figure 5. Distance-based redundancy analysis (db-RDA) plot showing the relationships of environ-
mental factors and treatments with bacterial (a) and fungal (b) community structure. The values onaxes 1 and 2 are the percentages explained by each axis. Circles, upright triangles, and diamondsrepresent the GR, GC, and GT samples. The inverted triangles represent the top six microbial speciesin terms of abundance, and the red arrows represent environmental factors. Two-way correlationnetwork analysis between environmental factors and the top twenty bacterial (c) and fungal (d) gen-era. The size of the node is proportional to the genus abundance and environmental factors. Nodecolor corresponds to the family taxonomic classification. Edge colors represent positive (green) andnegative (red) correlations, and the edge thickness is equivalent to the correlation magnitude.
J. Fungi 2022, 8, 63 12 of 18J. Fungi 2022, 8, x FOR PEER REVIEW 13 of 20
Figure 6. Soil urease activity in the greenhouse experiment (a), pot experiment (e), and field exper-iment (i); soil phosphatase activity in the greenhouse experiment (b), pot experiment (f), and field experiment (j); soil sucrase activity in the greenhouse experiment (c), pot experiment (g), and field experiment (k); and soil catalase activity in the greenhouse experiment (d), pot experiment (h), and
Figure 6. Soil urease activity in the greenhouse experiment (a), pot experiment (e), and field ex-periment (i); soil phosphatase activity in the greenhouse experiment (b), pot experiment (f), andfield experiment (j); soil sucrase activity in the greenhouse experiment (c), pot experiment (g), andfield experiment (k); and soil catalase activity in the greenhouse experiment (d), pot experiment (h),and field experiment (l). Different lowercase letters (a,b,c) in the same column indicate a significantdifference at p ≤ 0.05 level by Duncan’s new multiple range test.
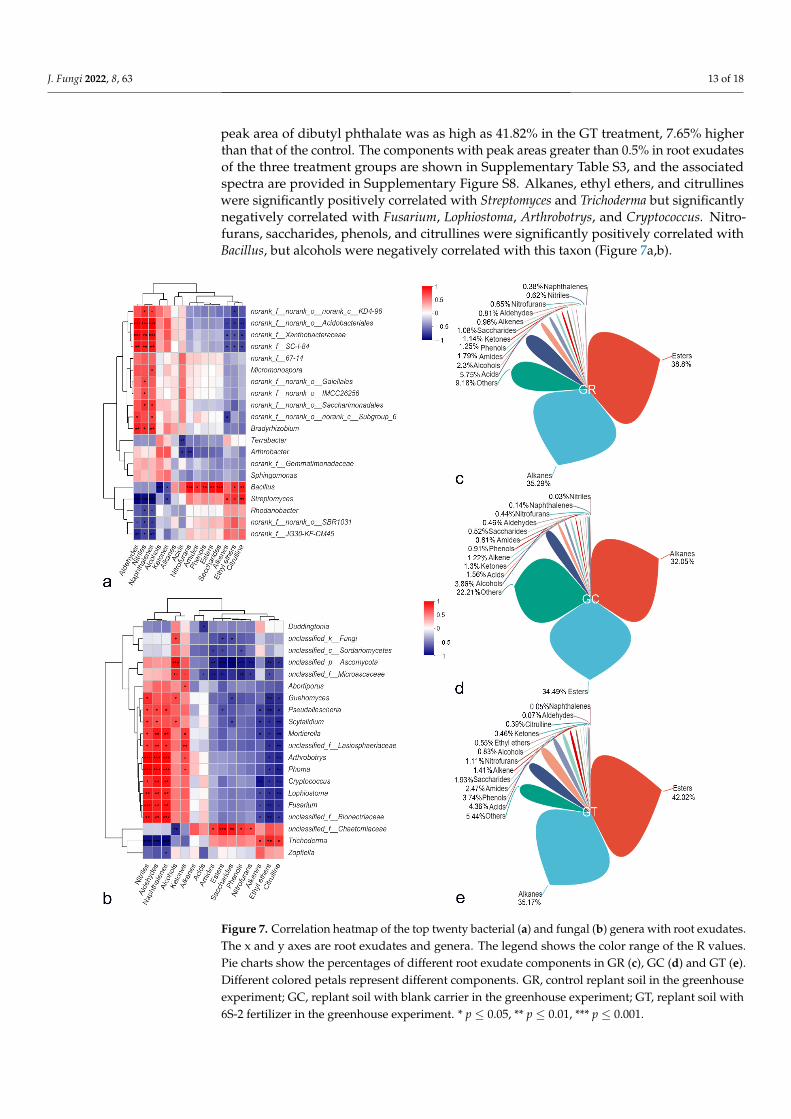
3.7. Root Exudate Components and Correlation Analysis with the Microbial Community
Root exudates of plants from the GR, GC, and GT treatments all contained esters,alkanes, acids, alcohols, amides, phenols, ketones, saccharides, alkenes, aldehydes, nitrofu-rans, and naphthalenes. Esters and alkanes were the main components. Ethyl ethers andcitrulline were present only in the GT group, but nitriles were absent (Figure 7c–e). The
J. Fungi 2022, 8, 63 13 of 18
peak area of dibutyl phthalate was as high as 41.82% in the GT treatment, 7.65% higherthan that of the control. The components with peak areas greater than 0.5% in root exudatesof the three treatment groups are shown in Supplementary Table S3, and the associatedspectra are provided in Supplementary Figure S8. Alkanes, ethyl ethers, and citrullineswere significantly positively correlated with Streptomyces and Trichoderma but significantlynegatively correlated with Fusarium, Lophiostoma, Arthrobotrys, and Cryptococcus. Nitro-furans, saccharides, phenols, and citrullines were significantly positively correlated withBacillus, but alcohols were negatively correlated with this taxon (Figure 7a,b).
J. Fungi 2022, 8, x FOR PEER REVIEW 14 of 20
field experiment (l). Different lowercase letters (a,b,c) in the same column indicate a significant dif-ference at p ≤ 0.05 level by Duncan’s new multiple range test.
Figure 7. Correlation heatmap of the top twenty bacterial (a) and fungal (b) genera with root exu-dates. The x and y axes are root exudates and genera. The legend shows the color range of the R values. Pie charts show the percentages of different root exudate components in GR (c), GC (d) and GT (e). Different colored petals represent different components. GR, control replant soil in the green-house experiment; GC, replant soil with blank carrier in the greenhouse experiment; GT, replant soil with 6S-2 fertilizer in the greenhouse experiment. * p ≤ 0.05, ** p ≤ 0.01, *** p ≤ 0.001.
Figure 7. Correlation heatmap of the top twenty bacterial (a) and fungal (b) genera with root exudates.The x and y axes are root exudates and genera. The legend shows the color range of the R values.Pie charts show the percentages of different root exudate components in GR (c), GC (d) and GT (e).Different colored petals represent different components. GR, control replant soil in the greenhouseexperiment; GC, replant soil with blank carrier in the greenhouse experiment; GT, replant soil with6S-2 fertilizer in the greenhouse experiment. * p ≤ 0.05, ** p ≤ 0.01, *** p ≤ 0.001.
J. Fungi 2022, 8, 63 14 of 18
4. Discussion
The root system is the link between the plant and the soil. A healthy soil environmentcan promote the development of the root system, which, in turn, promotes the growth ofplants [33]. After 6S-2 fertilizer was applied to the soil, the relative abundance of Trichodermain the rhizosphere increased significantly, whereas the relative abundance of harmful fungisuch as Fusarium decreased (Figures 2b and 4e). This result suggested that 6S-2 canrapidly multiply in apple rhizosphere soil and can inhibit the propagation of pathogenicFusarium [34] through direct niche competition [35]. This result may also reflect a directinteraction between 6S-2 and Fusarium, whereby 6S-2 exhibits antagonism, reparasitism,and bacteriolysis that reduces the relative abundance of Fusarium [36]. Previous work hasshown that the diversity of the soil microbial community was enriched after Trichodermacolonization, resulting in a significant reduction in the population of Fusarium [37,38]. After6S-2 fertilizer was applied to replanted apple orchards soil, the bacteria/fungi increasedsignificantly (Figure 3c,j), demonstrating that 6S-2 fertilizer can effectively regulate the ratioof bacteria to fungi in the apple rhizosphere [39]. The soil community structure changedfrom a fungal type to a bacterial type; this may improve the structure and function of thesoil microbial flora [39,40] and may stimulate the proliferation of beneficial bacteria such asBacillus and Streptomyces (Figures 2a and 4f). In a previous report, colony multiplicationdrove interactions among the soil microflora, reduced the number of harmful Fusarium, andeffectively controlled the occurrence of soil-borne diseases [41]. Trichoderma has also showna variety of positive effects on plant growth, resilience, and yield [42,43]. In the experimentsreported here, the application of 6S-2 fertilizer promoted the growth of young apple treesand M. hupehensis Rehd seedlings (Figure 1). Changes in microbial species may also dependon the symbiotic interaction between plants and their surrounding microorganisms [42].After the application of microbial fertilizer, biocontrol microorganisms can quickly form a“substrate–microorganism” ecosystem with the help of the carrier [44]; this process helps toregulate the soil micro-ecological environment, promotes the restoration of soil enzymeactivities, and changes the ecology of the rhizosphere through its effects on the physical andchemical properties of soil microorganisms [45,46]. The new optimized soil environmentcan, in turn, promote the further growth and development of 6S-2 and other biocontrolmicroorganisms [39,47]; it can also enhance the secretion of biocontrol enzymes, IAA, andother secondary metabolites and can improve plant growth [40] and stress resistance [48].
Root exudates are the bridge between plants, soil, and microbes and play an importantrole in the interaction between plants and the environment [49]. The type and quantityof root exudates determine the type and quantity of rhizosphere microorganisms [41,50],and rhizosphere microorganisms in turn affect the production of root exudates [41]. Rootexudates of different crops can regulate different aspects of the rhizosphere microbialcommunity [51]. Under continuous cropping conditions, watermelon root exudates cansignificantly increase the number of germinated Fusarium spores and enhance their re-productive ability [52]. The accumulation of phloridzin and other phenolic autotoxicsubstances in replanted apple soil hinders apple growth [53]. In this experiment, thecomposition of M. hupehensis Rehd seedlings root exudates changed after the applicationof 6S-2 fertilizer (Figure 7c–e). Previous works raise the possibility that 6S-2 applicationmay adjust the root exudate composition to promote the recruitment and aggregationof specific beneficial microorganisms [54], thereby optimizing the rhizosphere microbialcommunity structure [55] and inducing plant resistance to pathogenic fungi such as Fusar-ium [56]. The accumulation of dibutyl phthalate and other substances has been shownto directly inhibit the growth of harmful fungi such as Fusarium and the germination ofspores, thereby helping to limit pathogen damage [57]. The relative contents of sugarsand amino acids increased in root exudates after the application of 6S-2 fertilizer. Thismay have provided the carbon and energy required for 6S-2 growth [58,59], enhanced theabsorption and utilization of nutrients under stress conditions [58], and thus promotedplant growth. Perhaps because of the different extraction methods, detection methods,and plant species, we did not detect large amounts of sugars, fatty acids, amino acids, and
J. Fungi 2022, 8, 63 15 of 18
other substances, in contrast to the results of previous studies [60,61]. Related methodsneed to be continuously optimized in follow-up research to more accurately determine thecomposition of root exudates [62]. The relationships between root exudates and rhizospheresoil microorganisms also require further study [60].
The effects of Trichoderma fertilizers were closely related to the application environ-ment [63]. At the same application rate, 6S-2 fertilizers showed greater effects in greenhouseand pot experiments than in the field experiment. To improve its biological control effect,it will be necessary to determine which environmental conditions are most conducive tothe colonization of Trichoderma and enhance its ability to compete with the indigenousmicrobial flora. It is unclear whether the changes in the soil microbial community structureand plant root exudates caused by the application of 6S-2 fertilizer will continue for a longtime [61]. The duration of the fertilizer effects and whether they can directly control ARDwill require additional testing [64]. Further experiments are also needed to separate andidentify chemotactic substances in root exudates and to determine whether their combi-nation with 6S-2 is more effective for the prevention and treatment of ARD. The optimalapplication rate, timing, and frequency for 6S-2 fertilizer are also important issues thatmust be considered in field production. The effects of Trichoderma are related not only to thespecies itself but also to its application method [65]. The application of solid Trichodermafertilizers, liquid fungal agents, or spore suspensions have all been shown to alleviatecontinuous cropping obstacles to some extent [66]. Therefore, reducing the number ofprocessing procedures, lowering production costs, extending shelf life, and optimizing theapplication rate are the top priorities for subsequent research.
5. Conclusions
The application of 6S-2 Trichoderma fertilizer to replanted soil promoted increasesin apple biomass and increased the ratio of bacteria to fungi in the soil. In particular, itincreased the relative abundance of Trichoderma, Bacillus, and Streptomyces and reducedthe relative abundance of harmful Fusarium. 6S-2 fertilizer thus altered the soil microbialcommunity structure, perhaps through its marked effects on the relative content of multipleroot exudate components. Therefore, the application of 6S-2 fertilizers to replanted soil canboth promote plant growth and optimize the soil microbial community structure and canhelp to alleviate ARD.
Supplementary Materials: The following supporting information can be downloaded at: https://www.mdpi.com/article/10.3390/jof8010063/s1. Figure S1: Dilution curve at the OTU level. Sobsindex of bacteria (a) and fungi (c); Shannon index of bacteria (b) and fungi (d); Figure S2: Speciescompositions of different treatments at the genus level for bacteria (a) and fungi (b); Figure S3:Circos diagrams of the relative abundance and distribution of soil bacteria (a) and fungi (b) at thegenus level for different groups. The width of the bar indicates the relative abundance of the genus;Figure S4: The number of culturable bacteria (a) and fungi (b) and the bacteria/fungi (c) in the potexperiment. Real-time fluorescence quantification of F. oxysporum (d), F. proliferatum (e), F. solani (f),and F. moniliforme (g) in the pot experiment; Figure S5: LDA scores of enriched taxa from Figure 4(g and h). Indicator bacteria (a) and fungi (b) with LDA scores of 4 or greater in communities ofthe three treatment groups. GR (red), GC (blue), and GT (green); Figure S6: Correlation heatmapof the top fifty bacterial (a) and fungal (b) genera with environmental factors. The x and y axes areenvironmental factors and genera. The legend shows the color range of the R values. * p ≤ 0.05, ** p≤ 0.01, *** p ≤ 0.001.; Figure S7: Single-way correlation network among the top twenty bacterial (c)and fungal (d) genera. Node size is proportional to genus abundance. Node color corresponds tofamily taxonomic classification. Edge colors represent positive (green) and negative (red) correlations,and the edge thickness is equivalent to the correlation value; Figure S8: The spectrum of exudatesfrom roots of M. hupehensis Rehd seedlings under different treatments. The x and y axes are time andcontents; Table S1: Physical and chemical properties of soils from four apple orchards; Table S2: Theenvironmental factors used in db-RDA analysis; Table S3: Components with peak area greater than0.5% in the root exudates of M. hupehensis Rehd under different treatments.
J. Fungi 2022, 8, 63 16 of 18
Author Contributions: H.W.: data curation, formal analysis, validation, writing—original draft; R.Z.and Y.M.: investigation and validation; W.J.: investigation; X.C.: funding acquisition; X.S.: fundingacquisition; C.Y.: funding acquisition, writing—review and editing; Z.M.: conceptualization, fundingacquisition, writing—review and editing. All authors have read and agreed to the published versionof the manuscript.
Funding: This research was supported by China Agriculture Research System of MOF and MARA(CARS-27), Shandong Agricultural Major Applied Technology Innovation Project (SD2019ZZ008),Qingchuang Science and Technology Support Project of Shandong Colleges and Universities (2019KJF020);Natural Science Foundation of Shandong Province (ZR2020MC131); the National Key Researchand Development Program of China (2020YFD1000201), Taishan Scholars Funded Project (NO.ts20190923); the National Natural Science Foundation of China (32072510), the Fruit Innovation Teamin Shandong Province, China (SDAIT-06-07).
Institutional Review Board Statement: Not applicable.
Informed Consent Statement: Not applicable.
Data Availability Statement: The study did not report any data.
Acknowledgments: Sincere thanks to Yanan Duan for providing specialized ARD-associated Fusar-ium proliferatum f. sp. malus domestica MR5.
Conflicts of Interest: The authors declare no conflict of interest.
References1. Tewoldemedhin, Y.T.; Mazzola, M.; Labuschagne, I.; McLeod, A. A multi-phasic approach reveals that apple replant disease is
caused by multiple biological agents, with some agents acting synergistically. Soil Biol. Biochem. 2011, 43, 1917–1927. [CrossRef]2. Winkelmann, T.; Smalla, K.; Amelung, W.; Baab, G.; Grunewaldt-Stocker, G.; Kanfra, X.; Meyhofer, R.; Reim, S.; Schmitz, M.;
Vetterlein, D. Apple replant disease: Causes and mitigation strategies. Curr. Issues Mol. Biol. 2019, 30, 89–106. [CrossRef][PubMed]
3. Mazzola, M.; Reardon, C.L.; Brown, J. Initial Pythium species composition and Brassicaceae seed meal type influence extent ofPythium-induced plant growth suppression in soil. Soil Biol. Biochem. 2012, 48, 20–27. [CrossRef]
4. Spath, M.; Insam, H.; Peintner, U.; Kelderer, M.; Kuhnert, R.; Franke-Whittle, I.H. Linking soil biotic and abiotic factors to applereplant disease: A greenhouse approach. J. Phytopathol. 2015, 163, 287–299. [CrossRef]
5. Ju, R.C.; Zhao, Y.H.; Li, J.Y.; Jiang, H.X.; Liu, P.; Yang, T.; Bao, Z.Z.; Zhou, B.Q.; Zhou, X.Y.; Liu, X.L. Identification and evaluation ofa potential biocontrol agent, Bacillus subtilis, against Fusarium sp. in apple seedlings. Ann. Microbiol. 2014, 64, 377–383. [CrossRef]
6. Wang, G.S. Studies on Fungal Community in Replanted Soil around Bohai Gulf and Alleviation Apple Replanted Disease byMixed Cropping with Allium fistulosum L. Ph.D. Thesis, Shandong Agricultural University, Tai’an, China, 2018. (In Chinese).
7. Mazzola, M.; Manici, L.M. Apple replant disease: Role of microbial ecology in cause and control. Annu. Rev. Phytopathol. 2012, 50,45–65. [CrossRef] [PubMed]
8. Lu, Z.X.; Tu, G.P.; Zhang, T.; Li, Y.Q.; Wang, X.H.; Zhang, Q.G.; Song, W.; Chen, J. Screening of antagonistic Trichoderma strainsand their application for controlling stalk rot in maize. J. Integr. Agric. 2020, 19, 145–152. [CrossRef]
9. Hewedy, O.A.; Abdel, L.K.S.; Seleiman, M.F.; Shami, A.; Albarakaty, F.M.M.; El-Meihy, R. Phylogenetic diversity of Trichodermastrains and their antagonistic potential against soil-borne pathogens under stress conditions. Biology 2020, 9, 189. [CrossRef]
10. Harman, G.; Howell, C.; Viterbo, A.; Chet, I.; Lorito, M. Trichoderma species—Opportunistic, avirulent plant symbionts. Nat. Rev.Microbiol. 2004, 2, 43–56. [CrossRef]
11. Maciag, T.; Krzyzanowska, D.M.; Jafra, S.; Siwinska, J.; Czajkowski, R. The Great Five—An artificial bacterial consortium withantagonistic activity towards Pectobacterium spp. and Dickeya spp.: Formulation, shelf life, and the ability to prevent soft rot ofpotato in storage. Appl. Microbiol. Biot. 2020, 104, 4547–4561. [CrossRef]
12. Andrzejak, R.; Janowska, B.; Renska, B.; Kosiada, T. Effect of Trichoderma spp. and fertilization on the glowering of Begonia ×tuberhybrida Voss. ‘Picotee Sunburst’. Agronomy 2021, 11, 1278. [CrossRef]
13. Poveda, J.; Abril-Urias, P.; Escobar, C. Biological control of plant-parasitic nematodes by filamentous fungi inducers of resistance:Trichoderma, mycorrhizal and endophytic fungi. Front. Microbiol. 2020, 11, 992. [CrossRef]
14. Kthiri, Z.; Jabeur, M.B.; Harbaoui, K.; Karmous, C.; Chamekh, Z.; Chairi, F.; Serret, M.D.; Araus, J.L.; Hamada, W. Comparativeperformances of beneficial microorganisms on the induction of durum wheat tolerance to Fusarium Head Blight. Microorganisms2021, 9, 2410. [CrossRef]
15. Doni, F.; Isahak, A.; CheMohd Zain, C.R.; Wan Yusoff, W.M. Physiological and growth response of rice plants (Oryza sativa L.) toTrichoderma spp. inoculants. AMB Express 2014, 4, 45. [CrossRef] [PubMed]
J. Fungi 2022, 8, 63 17 of 18
16. Yassin, M.T.; Mostafa, A.A.; Al-Askar, A.A.; Sayed, S.R.M.; Rady, A.M. Antagonistic activity of Trichoderma harzianum andTrichoderma viride strains against some fusarial pathogens causing stalk rot disease of maize, in vitro. J. King Saud Univ. Sci. 2021,33, 101363. [CrossRef]
17. El-Komy, M.H.; Saleh, A.A.; Ibrahim, Y.E.; Hamad, Y. Trichoderma asperellum strains confer tomato protection and induce itsdefense-related genes against the Fusarium wilt pathogen. Trop. Plant Pathol. 2016, 41, 277–287. [CrossRef]
18. Veenstra, A.; Rafudeen, M.; Murray, S.L. Trichoderma asperellum isolated from African maize seed directly inhibits Fusariumverticillioides growth in vitro. Eur. J. Plant Pathol. 2018, 153, 279–283. [CrossRef]
19. Zapata-Sarmiento, D.H.; Palacios-Pala, E.F.; Rodríguez-Hernández, A.A.; Medina-Melchor, D.L.; Rodríguez-Monroy, M.;Sepúlveda-Jiménez, G. Trichoderma asperellum, a potential biological control agent of Stemphylium vesicarium, on onion (Al-lium cepa L.). Biol. Control 2020, 140, 1049–9644. [CrossRef]
20. He, A.L.; Liu, J.; Wang, X.H.; Zhang, Q.G.; Song, W.; Chen, J. Soil application of Trichoderma asperellum GDFS1009 granulespromotes growth and resistance to Fusarium graminearum in maize. J. Integr. Agric. 2019, 18, 599–606. [CrossRef]
21. Wu, Q.; Sun, R.; Ni, M.; Yu, J.; Li, Y.; Yu, C.; Dou, K.; Ren, J.; Chen, J. Identification of a novel fungus, Trichoderma asperellumGDFS1009, and comprehensive evaluation of its biocontrol efficacy. PLoS ONE 2017, 12, e0179957. [CrossRef]
22. Guo, R.T.; Ji, S.D.; Wang, Z.Y.; Zhang, H.F.; Wang, Y.C.; Liu, Z.H. Trichoderma asperellum xylanases promote growth and induceresistance in poplar. Microbiol. Res. 2021, 248, 126767. [CrossRef]
23. Sant, D.; Casanova, E.; Segarra, G.; Avilés, M.; Reis, M.; Trillas, M.I. Effect of Trichoderma asperellum strain T34 on Fusarium wiltand water usage in carnation grown on compost-based growth medium. Biol. Control 2010, 53, 291–296. [CrossRef]
24. Qi, W.Z.; Zhao, L. Study of the siderophore-producing Trichoderma asperellum Q1 on cucumber growth promotion under saltstress. J. Basic Microb. 2013, 53, 355–364. [CrossRef]
25. Wang, H.Y.; Zhang, R.; Duan, Y.N.; Jiang, W.T.; Chen, X.S.; Shen, X.; Yin, C.M.; Mao, Z.Q. The endophytic strain Trichodermaasperellum 6S-2: An efficient biocontrol agent against apple replant disease in China and a potential plant-growth-promotingfungus. J. Fungi 2021, 7, 1050. [CrossRef]
26. Zhang, C.; Liao, W.M.; Xue, M.; Chen, D.; Hou, J.M.; Liu, T. Conidia of Trichoderma asperellum DQ-1 fermented by solid state andits growth effect on four crop seedlings. Chin. J. Biol. Control. 2021, 37, 315–322. Available online: https://kns.cnki.net/kcms/detail/11.3515.S.20201027.0931.002.html (accessed on 1 November 2021). (In Chinese).
27. Shen, P.; Chen, X.D. Microbiology Experiment, 4th ed.; Education Press: Beijing, China, 2007. (In Chinese)28. Yang, Y.Q.; Wu, B.Z. Research of intercropping benefit of crop intercropping systems. Chin. Agric. Sci. Bull. 2007, 11, 192–196. (In
Chinese)29. Wang, G.S.; Yin, C.M.; Pan, F.B.; Wang, X.B.; Xiang, L.; Wang, Y.F.; Wang, J.Z.; Tian, C.P.; Chen, J.; Mao, Z.Q. Analysis of the fungal
community in apple replanted soil around Bohai Gulf. Hortic. Plant J. 2018, 4, 175–181. [CrossRef]30. Xu, N.; Tan, G.C.; Wang, H.Y.; Gai, X.P. Effect of biochar additions to soil on nitrogen leaching, microbial biomass and bacterial
community structure. Eur. J. Soil Biol. 2016, 74, 1–8. [CrossRef]31. Adams, R.I.; Miletto, M.; Taylor, J.W.; Bruns, T.D. Dispersal in microbes: Fungi in indoor air are dominated by outdoor air and
show dispersal limitation at short distances. ISME J. 2013, 7, 1262–1273. [CrossRef] [PubMed]32. Liu, Y.; Zhang, N.; Qiu, M.; Feng, H.; Vivanco, J.M.; Shen, Q.; Zhang, R. Enhanced rhizosphere colonization of beneficial Bacillus
amyloliquefaciens SQR9 by pathogen infection. FEMS Microbiol. Lett. 2014, 353, 49–56. [CrossRef] [PubMed]33. Pierret, A.; Moran, C.J. Plant roots and soil structure. In Encyclopedia of Agrophysics; Encyclopedia of Earth Sciences Series; Glinski,
J., Horabik, J., Lipiec, J., Eds.; Springer: Dordrecht, The Netherlands, 2011. [CrossRef]34. Pimentel, M.F.; Arnão, E.; Warner, A.J.; Subedi, A.; Rocha, L.F.; Srour, A.; Bond, J.P.; Fakhoury, A.M. Trichoderma isolates inhibit
Fusarium virguliforme growth, reduce root rot, and induce defense-related genes on soybean seedlings. Plant Dis. 2020, 104,1949–1959. [CrossRef]
35. Sivan, A.; Chet, I. The possible role of competition between Trichoderma harzianum and Fusarium oxysporum on rhizospherecolonization. Phytopathology 1989, 79, 198–203. [CrossRef]
36. He, Z.D.; Song, S.Q.; Gao, Y.F.; Shi, Y.X.; Li, B.J. Detection of Trichoderma asperellum colonization in soils by real-time fluorescentquantitative PCR. J. Plant Prot. 2016, 43, 552–555. (In Chinese) [CrossRef]
37. Saravanakumar, K.; Li, Y.Q.; Yu, C.J.; Wang, Q.Q.; Wang, M.; Sun, J.N.; Gao, J.X.; Chen, J. Effect of Trichoderma harzianum on maizerhizosphere microbiome and biocontrol of Fusarium stalk rot. Sci. Rep. 2017, 7, 1771. [CrossRef] [PubMed]
38. Zhang, X.; Xue, C.; Fang, D.; He, X.H.; Wei, M.Y.; Zhuo, C.J.; Jin, J.Y.; Shen, B.; Li, R.; Ling, N.; et al. Manipulating thesoil microbiomes during a community recovery process with plant beneficial species for the suppression of Fusarium wilt ofwatermelon. AMB Express 2021, 11, 87. [CrossRef] [PubMed]
39. He, Z.D.; Wu, C.C.; Shen, J.J.; Gao, Y.F.; Chang, L.S.; Gao, Z.G. Effects of Trichoderma asperellum bio-fertilizer on cucumber Fusariumwilt and microbial population in continuous cucumber cropping rhizosphere soil. J. Plant Prot. 2018, 45, 528–535. (In Chinese)[CrossRef]
40. Liu, Y.X.; Shi, J.X.; Feng, Y.G.; Yang, X.M.; Li, X.; Shen, Q.R. Tobacco bacterial wilt can be biologically controlled by the applicationof antagonistic strains in combination with organic fertilizer. Biol. Fert. Soils 2013, 49, 447–464. [CrossRef]
41. Vora, S.M.; Joshi, P.; Belwalkar, M.; Archana, G. Root exudates influence chemotaxis and colonization of diverse plant growthpromoting rhizobacteria in the pigeon pea-maize intercropping system. Rhizosphere 2021, 18, 100331. [CrossRef]
J. Fungi 2022, 8, 63 18 of 18
42. Doni, F.; Zain, C.R.C.M.; Isahak, A.; Fathurrahman, F.; Sulaiman, N.; Uphoff, N.; Yusoff, W.M.W. Relationships observed betweenTrichoderma inoculation and characteristics of rice grown under System of Rice Intensification (SRI) vs. conventional methods ofcultivation. Symbiosis 2017, 72, 45–59. [CrossRef]
43. Khadka, R.B.; Uphoff, N. Effects of Trichoderma seedling treatment with system of rice intensification management and withconventional management of transplanted rice. Peer J. 2019, 11, e5877. [CrossRef]
44. Kovachev, S. Defence factors of vaginal lactobacilli. Crit. Rev. Microbiol. 2018, 44, 31–39. [CrossRef]45. Raiesi, F.; Salek-Gilani, S. The potential activity of soil extracellular enzymes as an indicator for ecological restoration of rangeland
soils after agricultural abandonment. Appl. Soil Ecol. 2018, 126, 140–147. [CrossRef]46. Kompała-Baba, A.; Bierza, W.; Sierka, E.; Błonska, A.; Besenyei, L.; Wozniak, G. The role of plants and soil properties in the
enzyme activities of substrates on hard coal mine spoil heaps. Sci. Rep. 2011, 11, 5155. [CrossRef]47. Cheng, H.Y.; Zhang, D.Q.; Huang, B.; Ren, L.R.; Hao, B.Q. Research progress on the effect of microbial fertilizers on soil
microecology after soil fumigation. Chin. J. Pestic. Sci. 2020, 22, 734–741. (In Chinese) [CrossRef]48. Zeilinger, S.; Gruber, S.; Bansal, R.; Mukherjee, P.K. Secondary metabolism in Trichoderma—Chemistry meets genomics. Fungal
Biol. Rev. 2016, 30, 74–90. [CrossRef]49. Nazir, N.; Kamili, A.; Zargar, M.; Khan, I.; Shah, D.; Parray, J.; Tyub, S. Effect of Root Exudates on rhizosphere soil microbial
communities. J. Rehabil. Res. Dev. 2016, 16, 88–95. Available online: https://www.researchgate.net/publication/33187624(accessed on 29 November 2021).
50. Kawasaki, A.; Donn, S.; Ryan, P.R.; Mathesius, U.; Devilla, R.; Jones, A.; Watt, M. Microbiome and exudates of the root andrhizosphere of Brachypodium distachyon, a model for wheat. PLoS ONE 2016, 11, e0164533. [CrossRef]
51. Haicha, F.Z.; Santaella, C.; Heulin, T. Root exudates mediated interactions belowground. Soil Biol. Biochem. 2014, 77, 69–80.[CrossRef]
52. Hao, W.Y.; Ren, L.X.; Ran, W.; Shen, Q.R. Allelopathic effects of root exudates from watermelon and rice plants on Fusariumoxysporum f.sp. niveum. Plant Soil. 2010, 336, 485–497. [CrossRef]
53. Wang, H.Y.; Zhao, L.; Jiang, W.T.; Zhang, R.; Chen, R.; Mao, Y.F.; Chen, X.S.; Shen, X.; Yin, C.M.; Mao, Z.Q. Effects of Alliumfistulosum-Brassica juncea-Triticum aestivum rotation a year on the soil microbial environment and the subsequent growth of youngapple trees. Sci. Hortic. 2021, 290, 110549. [CrossRef]
54. Yuan, J.; Zhao, J.; Wen, T.; Zhao, M.L.; Li, R.; Goossens, P.; Huang, Q.W.; Bai, Y.; Vivanco, J.M.; Kowalchuk, G.A.; et al. Rootexudates drive the soil-borne legacy of aboveground pathogen infection. Microbiome 2018, 6, 156. [CrossRef]
55. Sun, H.S.; Jiang, S.X.; Jiang, C.C.; Wu, C.F.; Gao, M.; Wang, Q.H. A review of root exudates and rhizosphere microbiome for cropproduction. Environ. Sci. Pollut. Res. 2021, 28, 54497–54510. [CrossRef] [PubMed]
56. Baetz, U.; Martinoia, E. Root exudates: The hidden part of plant defense. Trends Plant Sci. 2014, 19, 90–98. [CrossRef] [PubMed]57. Wu, X.T.; Lai, R.Q.; Mi, Y.E.; Gu, G.; Zhang, B.; Wang, Q.N. Control effects of garlic root exudates on Fusarium oxysporum root rot
of Tobacco. Chin. J. Biol. Control. 2021, 37, 555–563. (In Chinese) [CrossRef]58. Zhou, X.G.; Yu, G.B.; Wu, F.Z. Responses of soil microbial communities in the rhizosphere of cucumber (Cucumis sativus L.) to
exogenously applied p-hydroxybenzoic acid. J. Chem. Ecol. 2012, 38, 975–983. [CrossRef] [PubMed]59. Vives-Peris, V.; Molina, L.; Segura, A.; Gómez-Cadenas, A.; Pérez-Clemente, R.M. Root exudates from citrus plants subjected to
abiotic stress conditions have a positive effect on rhizobacteria. J. Plant Physiol. 2018, 228, 208–217. [CrossRef]60. Iannucci, A.; Canfora, L.; Nigro, F.; de Vita, P.; Beleggia, R. Relationships between root morphology, root exudate compounds and
rhizosphere microbial community in durum wheat. Appl. Soil Ecol. 2021, 158, 103781. [CrossRef]61. Huang, X.F.; Chaparro, J.; Reardon, K.; Zhang, R.; Shen, Q.R.; Vivanco, J. Rhizosphere interactions: Root exudates, microbes, and
microbial communities. Botany 2014, 92, 267–275. [CrossRef]62. Guo, Q.Q.; Yu, J.; Sun, J.G.; Wang, C.J.; Chen, S.W.; Yang, C.L.; Yang, Y. Exogenous inoculation of microorganisms effect on root
exudates and rhizosphere microorganism of tobaccos. Adv. Appl. Microbiol. 2021, 11, 510–528. [CrossRef]63. Shida Ji, S.D.; Liu, Z.H.; Liu, B.; Wang, Y.C.; Wang, J.J. The effect of Trichoderma biofertilizer on the quality of flowering Chinese
cabbage and the soil environment. Sci. Hortic. 2020, 262, 109069. [CrossRef]64. Harman, G.E.; Uphoff, N. Symbiotic root-endophytic soil microbes improve crop productivity and provide environmental
benefits. Scientifica 2019, 25, 9106395. [CrossRef] [PubMed]65. Brotman, Y.; Landau, U.; Cuadros-Inostroza, Á.; Takayuki, T.; Fernie, A.R.; Chet, I.; Viterbo, A.; Willmitzer, L. Trichoderma-Plant
root colonization: Escaping early plant defense responses and activation of the antioxidant machinery for saline stress tolerance.PLoS Pathog. 2013, 9, e1003221. [CrossRef]
66. Ferreira, F.V.; Musumeci, M.A. Trichoderma as biological control agent: Scope and prospects to improve efficacy. World J. Microbiol.Biotechnol. 2021, 37, 90. [CrossRef] [PubMed]