Evaluation of Cellulase Activity from Trichoderma spp. and Xylanolytic Bacteria
Upload
khangminh22Category
view
3download
0
COMBINED EFFECT OF VERMICAST-TRICHODERMA-SAWDUST ON --
---KALE, SWISS CHARD, AND PAK CHOY GROWTH
By
Suwen Lin
Submitted in Partial Fulfilment of The Requirements
for The Degree of Master of Science
Dalhousie University
Halifax, Nova Scotia
July 2020
© Copyright by Suwen Lin, 2020

ii
DEDICATION This thesis is dedicated to God the Almighty source of divine wisdom and to all in pursuit of
academic excellence.

iii
Contents
DEDICATION ................................................................................................................................................................... ii
LIST OF TABLES ........................................................................................................................................................... vi
LIST OF FIGURES ...................................................................................................................................................... viii
ABSTRACT ........................................................................................................................................................................ x
LIST OF ABBREVIATIONS AND SYMBOLS USED ...................................................................................... xi
ACKNOWLEDGEMENTS ........................................................................................................................................ xiv
CHAPTER 1 INTRODUCTION ................................................................................................................................ 1
1.0 THESIS OVERVIEW ................................................................................................................................................ 1
1.1 THESIS OBJECTIVES ............................................................................................................................................. 3
1.2 OUTLINE OF THESIS AND ORGANIZATION .............................................................................................. 3
1.3 REFENRENCES ......................................................................................................................................................... 4
CHAPTER 2 LITERATURE REVIEW .................................................................................................................. 6
2.1 EFFECTS OF VERMICAST ON PLANTS ......................................................................................................... 6
2.1.0 Nature of Natural Amendments ....................................................................................................................... 6
2.1.1.1 Microorganisms ........................................................................................................................................... 7
2.1.1.2 Organic matter ............................................................................................................................................. 8
2.1.1.3 Mineral nutrients ......................................................................................................................................... 8
2.1.2 Relationships Between Organic Amendments and Microbial Communities ......................................... 9
2.1.3 Earthworms and Their Functions ................................................................................................................... 10
2.1.4 Nutritional Quality and Functional Property ............................................................................................... 10
2.1.5 Vermicast as A Suitable Nutrient Source for Crops .................................................................................. 11
2.2 EFFECTS OF SAWDUST ON PLANTS ........................................................................................................... 13
2.2.1 Effect of Non-treated Sawdust on Plant Growth ........................................................................................ 13
2.2.2 Effect of Thermally Treated Sawdust on Plant Growth ........................................................................... 15
2.3 TRICHODERMA ....................................................................................................................................................... 15
2.4 MIXTURE OF VERMICAST-TRICHODERMA-SAWDUST ...................................................................... 16
2.5 REFERENCES .......................................................................................................................................................... 16
CHAPTER 3 NUTRIENTS MINERALIZATION AND NUTRIENT-RELEASE PATTERNS OF
VERMICAST-TRICHODERMA-SAWDUST MEDIA ..................................................................................... 23

iv
3.0 ABSTRACT ............................................................................................................................................................... 23
3.1 INTRODUCTION .................................................................................................................................................... 24
3.2 MATERIALS AND METHODS .......................................................................................................................... 26
3.2.1 Media Preparation ............................................................................................................................................. 27
3.2.2 Growing Media Incubation ............................................................................................................................. 28
3.2.3 Incubation and Nutrients Mineralization ..................................................................................................... 29
3.2.4 Nutrient-release.................................................................................................................................................. 29
3.2.5 Statistical Analysis ............................................................................................................................................ 30
3.4 RESULTS AND DISCUSSION ............................................................................................................................ 31
3.5 CONCLUSION .......................................................................................................................................................... 49
3.6 REFERENCES .......................................................................................................................................................... 50
CHAPTER 4 MICROBIAL ACTIVITIES OF VERMICAST-TRICHODERMA-SAWDUST
MIXED MEDIA ............................................................................................................................................................. 79
4.0 ABSTRACT ............................................................................................................................................................... 79
4.1 INTRODUCTION .................................................................................................................................................... 80
4.2 MATERIALS AND METHODS .......................................................................................................................... 82
4.2.1 Study Site and Sampling .................................................................................................................................. 82
4.2.2 Nutrient Mineralization .................................................................................................................................... 84
4.2.3 Lipid Extraction ................................................................................................................................................. 84
4.2.4 GC-FID/MS Analysis of Microbial PLFAs ................................................................................................ 85
4.2.5 LC-MS Analysis of Intact Microbial Lipids ............................................................................................... 86
4.2.5.1 Analysis of the intact lipids using C30 reverse-phase liquid chromatography coupled to high-
resolution accurate mass tandem mass spectrometry (C30-RPLC-HRAM-MS/MS) ............................... 87
4.2.5.2 High-resolution accurate mass tandem mass spectrometry analysis ............................................ 87
4.2.6 Data Processing and Statistical Analysis ..................................................................................................... 88
4.3 RESULTS AND DISCUSSION ............................................................................................................................ 88
4.3.1 Comparison of Media Active Microbial Composition Following the Addition of Trichoderma ... 90
4.3.2 Relationship Between Mineral Nutrients and Active Microbial Community ..................................... 94
4.3.3 Temporal Changes in Microbial Community Composition...................................................................103
4.4 CONCLUSIONS .....................................................................................................................................................109
4.5 REFERENCES ........................................................................................................................................................110

v
4.6 Supplementary .........................................................................................................................................................116
CHAPTER 5 ACTIVE MICROBIAL COMPOSITION AND MICROGREENS PLANT GROWTH
RESPONSE TO VERMICAST-SAWDUST MIXED MEDIA .....................................................................123
5.0 ABSTRACT .............................................................................................................................................................123
5.1 INTRODUCTION ..................................................................................................................................................124
5.2 MATERIALS AND METHODS ........................................................................................................................126
5.2.1 Growing Media Composition .......................................................................................................................127
5.2.3 Raising and Transplanting of Seedlings .....................................................................................................127
5.2.4 Plant Growth Analysis ...................................................................................................................................128
5.2.5 Leaf Chlorophyll Indices ...............................................................................................................................129
5.2.6 Experimental Design and Statistical Analysis ..........................................................................................129
5.3 RESULTS AND DISCUSSION ..........................................................................................................................130
5.4 CONCLUSION ........................................................................................................................................................144
5.5 REFERENCES ........................................................................................................................................................144
CHAPTER 6 CONCLUSION ..................................................................................................................................150
REFERENCES .............................................................................................................................................................155

vi
LIST OF TABLES Chapter 3
Table 1. Combined growing media treatments and codes for the mineralization and nutrient-
release pattern experiments during December 2018 to February 2019 incubation period. ............ 28
Table 2. Two-sample t-test for comparing the pH, electrical conductivity (EC), total dissolved
solids (TDS) and salinity for the mixed media without (A) and with (B) T. viride during
December 2018 to February 2019 incubation period. .................................................................... 35
Table 3. Nonlinear regression models on electric conductivity (EC), salinity, total dissolved
solids (TDS) and pH of inoculated without (A) or with (B) T. viride at different vermicast-
sawdust ratio during December 2018 to February 2019 incubation period. .................................. 37
Table 4.Repeated measures analysis for total dissolved solids, electrical conductivity, salinity and
pH using unstructured Covariance Structure during December 2018 to February 2019 incubation
period. ............................................................................................................................................. 38
Table 5. Least-squares mean of electric conductivity for T. viride main effect during December
2018 to February 2019 incubation period. ..................................................................................... 40
Table 6. The selected mineral nutrient content in vermicast-sawdust mixed media without (A)
and with (B) adding Trichoderma during December 2018 to February 2019 incubation period. .. 42
Table S1.Least squares mean of total dissolved solids for Time*Trichoderma viride*Treatment
interaction. ...................................................................................................................................... 53
Table S2. Least squares mean of electrical conductivity for Time*Treatment interaction. ........... 61
Table S3. Least squares mean of salinity for Time*Trichoderma viride interaction. .................... 65
Table S4. Least squares mean of salinity for Time*Treatment interaction. .................................. 67
Table S5. Least squares mean of salinity for Trichoderma viride*Treatment interaction. ............ 71
Table S6. Least squares mean of pH for Time*Trichoderma viride*Treatment interaction. ........ 72
Chapter 4
Table 1. Pearson's Correlation coefficients for microbial populations and the minerals that were
found to be significant in different quadrants of the RDA plot. .................................................... 95
Table 2. One-way ANOVA showed microbial groups and nutrient mineralization segregated in
quadrant 4 of PCA biplot. .............................................................................................................. 97

vii
Table 3. Active microbial community composition in each incubated mixed growing media. ... 105
Table S1. Phospholipid fatty acids biomarkers used to characterize the active microbial
community structure. .................................................................................................................... 116
Table S2. The parameters used for Q-Exactive mass spectrometer. ............................................ 119
Table S3. A t-test for each microbial group in Group A and B. .................................................. 120
Table S4. The changes of aluminum, boron, copper, iron, manganese, and zinc contents as time
going by among 10 sample treatments. ........................................................................................ 121
Chapter 5
Table 1A. Nutrients contents of the separate substrates and mixed media. ................................. 130
Table 1B. Nutrients contents of the separate substrates and mixed media. ................................. 132
Table 2. Nitrogen, electric conductivity, nitrate-N and chloride content in the mixed media. .... 132
Table 3. Phospholipid fatty acids biomarkers used to characterize the active microbial community
structure. ....................................................................................................................................... 134
Table 4. Effects of different mixed media on growth components of three different species of
microgreen plants. ........................................................................................................................ 138
Table 5. Mean Fm, Fv, Fo and ACI of kale, Swiss chard and pak choi plants as affected by
combined medium treatment and plant species. ........................................................................... 139
Table 6. Mean Fv/Fm and Fv/Fo of plants on vermicast-sawdust mixed medium treatments. ... 140
Table 7. Pearson's Correlation coefficients for plant growth components, microbial populations
and mineral nutrients that was found significant in quadrants 1 of the PCA biplot. ................... 143

viii
LIST OF FIGURES Chapter 3
Figure 1. Changes in electric conductivity, salinity, total dissolved solids, and pH of different
combinations of vermicast-sawdust media (group A) during December 2018 to February 2019
incubation period. ........................................................................................................................... 32
Figure 2. Changes in electric conductivity, salinity, total dissolved solids and pH for different
combinations of vermicast-Trichoderma-sawdust media (group B) during December 2018 to
February 2019 incubation period. .................................................................................................. 33
Figure 3. Model for nutrient-release pattern for mixed growing media. (A) is the model applied to
the electric conductivity, salinity, total dissolved solids and pH of all the treatments; and (B) is
the model used for the pH of the sawdust alone. ........................................................................... 36
Figure 4. Percentage changes in total nitrogen, conductivity, zinc and Nitrate-N in different
proportions of vermicast-sawdust mixed media with or without T. viride during December 2018
to February 2019 incubation period. .............................................................................................. 43
Figure 5. Changes in calcium (Ca), potassium (K), magnesium (Mg) and phosphorous (P) in
different proportions of vermicast-sawdust mixed media with or without T. viride during
December 2018 to February 2019 incubation period. .................................................................. 44
Figure 6. Changes of sodium (Na), sulphate (SO42-), manganese (Mn), and chloride (Cl-) in
different proportions of vermicast-sawdust mixed media with or without T. viride during
December 2018 to February 2019 incubation period. .................................................................. 45
Figure 7. Changes in aluminum (Al), boron (B), copper (Cu) and iron (Fe) contents in different
proportions of vermicast-sawdust mixed media with or without addition of T. viride during
December 2018 to February 2019 incubation period. .................................................................. 46
Figure 8 (A–D). Redundancy analysis (RDA) of the nutrient-release pattern and mineralization of
the vermicast-Trichoderma-sawdust mixed media during December 2018 to February 2019
incubation period, 0 day (A), 30 days (B), 60 days (C), and 90 days (D). . .................................. 48
Chapter 4
Figure 1. A pie chart showed average levels of six main microbial groups (G+, G-, G+G-, fungi,
protozoa and eukaryotes) in vermicast-sawdust mixed media without (A) and with (B) adding
Trichoderma during December 2018 to February 2019 incubation period. ................................... 90
Figure 2. (A–D). The relationship between the active soil microbial community (PLFA), nutrient
mineralization, and media amendments during December 2018 to February 2019 incubation
period.. ............................................................................................................................................ 93

ix
Figure 3. (A–E). Variation in Biomarkers used to assess microniche or physiological status of the
vermicast-Trichoderma-sawdust mixed media during December 2018 to February 2019
incubation period. ......................................................................................................................... 102
Chapter 5
Figure 1. A biplot showing the relationship between active microbial composition and mineral
nutrients of the mixed growing media. ......................................................................................... 141
Chapter 6
Figure 1. Interactions between plants, microbiota, and growing media. ..................................... 141

x
ABSTRACT
Nowadays, organic amendment has been used to address soil fertility problems and improve crop
production. Vermicast-sawdust mixed plant growing media are low-cost and rich in beneficial
microbes and essential nutrients but not extensively studied. The present study focused on
confirming the best of vermicast-Trichoderma-sawdust combination. The mixed proportion of the
vermicast-sawdust comprised (1) 80% vermicast+20% sawdust; (2) 60% vermicast+40% sawdust;
(3) 40% vermicast+60% sawdust; (4) 20% vermicast+80% sawdust; and (5) sawdust alone (control)
added without or with 10^5 spores/g Trichoderma viride. The nutrient-release pattern and
mineralization analysis suggested that more vermicast leads to more nutrient-release pattern speed
and minerals, and T. viride in the growing media did not show a positive effect. Active microbial
community structure showed the mixed media with the 40% vermicast-60% sawdust or the 60%
vermicast-40% sawdust gave the highest diversity of active microbial community composition and
the highest overall mineral nutrients content compared to the other media. The40% vermicast+60%
sawdust mix media was the best combination media on the growth and development of three
different microgreen plant species, kale (Brassica oleraceae var. sabellica L.), Swiss chard (Beta
vulgaris Subspecies Maritima), and pak choy (Brassica rapa ssp. Chinensis).
Keywords: microgreens, nutrient release, vermicast, organic amendment, PLFA

xi
LIST OF ABBREVIATIONS AND SYMBOLS USED
BAME Bacterial Acid Methyl Ester
CL cardiolipin
FA fatty acid
FAME Fatty Acid Methyl Ester
FID flame ionization detector
GC gas chromatography
LC liquid chromatography
MS mass spectrometry
MTBE methyl tert-butyl ether
PC phosphatidylcholine
PE phosphatidylethanolamine
PG phosphatidylglycerol
PI phosphatidylinositol
PLFA phospholipids fatty acids
PS phosphatidylserine
RDA redundancy analysis
TMSH trimethyl sulfonium hydroxide

xii
Chemical Compounds and Ions
-NH2 amino
% percentage(s)
°C degree Celsius
N Nitrogen
P Phosphorus
K Potassium
Ca Calcium
Mg Magnesium
S Sulphur
Fe Iron
Zn Zinc
Mn Manganese
B Boron
𝐾+ Potassium
𝑁𝑂3− Nitrite-N
𝑁𝐻4+ Ammonium

xiii
Measurements
S second
Min minute
Hr hour
D day
Cm centimetres
G grams
Μl microliter
Ml milliliters
M meters
Mm millimetres
Ppm parts per million

xiv
ACKNOWLEDGEMENTS
I would like to express my sincere appreciation and gratitude to my supervisory committee
members, Drs. Lord Abbey, Thomas Raymond, and Samuel Asiedu for their unwavering support,
patience, mentorship and encouragement throughout this academic journey. This work would not
have been possible without the financial support of my father and the funding from Modgarden
Tinyfarm and Natural Sciences and Engineering Research Council (NSERC).
I am particularly thankful to Dr. Thu Huong Pham for you support in all phases of my PLFA
research. To my colleagues and academic associates, I say a big thank you, particularly, Mohan
Zhou, Yuhan He, Dengge Qin, and Jinsheng Cai. To Dr. Lokanadha Gunupuru, thank you for your
guidance and assistance in conducting various experiments. You all contributed tremendously to
this success.
I wish to also extend my gratitude to families and friends who supported and encouraged me
throughout the course of the programme. I appreciate the contributions of Cultiv8 gave me a
creative idea in my academic journey. You all gave me the strength to carry on.
To my family members, Wenxin Lin, Daochai Lin, and Jinmei Lin, thank you for your prayers,
love and guidance that keep me going. Thank you for always being there.
To all who made a positive impact, not mentioned in this piece, you are highly appreciated.

1
CHAPTER 1 INTRODUCTION
In this chapter, we will provide a brief synopsis of the project through the thesis overview,
objectives, and thesis outline, as well as thesis organization.
1.0 THESIS OVERVIEW
Traditionally, organic amendments (also known as organic fertilizers) have been used as sources
of plant nutrients and soil conditioners. Recent advancement in agricultural science have helped in
the understanding of the roles of organic amendments on soil bio-physicochemical improvement
and plant growth and harvest quality (Scotti et al., 2015; Abbey et al., 2018). The different soil
organic amendments materials can be grouped essentially in five categories: animal manure,
municipal biosolids, green manure and cover crops, waste from manufacturing processes, and
compost (Goss et al., 2013).Using organic amendments instead of synthetic chemical fertilizers
and pesticides reduce environmental pollution, production cost to farmers as well as restore or
reclaim degraded soils (Diacono & Montemurro, 2011; Quilty & Cattle, 2011).
It is acknowledged that vermicast is one of the most promising organic amendments in agriculture.
Vermicast is a stabile and fine peat-like material derived by earthworms from organic matter.
Vermicast contains reduced levels of contaminants and a higher saturation of nutrients than the
product of vermicompost (Ndegwa et al., 2000). Vermicast has a higher porosity and good water-
holding capacity and thus, makes nutrients and water more readily available to plants (Weber et al.,
2007). Vermicast is used as a growing medium amendment to improve soil physical properties
characterized by low bulk density and enhancement of soil particle aggregation to improve soil
structure. It is also relatively high in organic matter, macro- and micro-nutrients with a low C:N
ratio (Sanchez et al., 2016; Sriakilam et al., 2016; Lv et al., 2018). Vermicast contains enzymes

2
such as amylase, lipase, cellulase and chitinase that break down the organic matter in the soil to
release essential plant nutrients and make it more available for plant uptake and utilization (Chaoui,
2003).
Many different growing medium substrates such as peat moss, coir, rock wool and sawdust are
used in the horticultural crop production industry. Sawdust, a waste product of the timber and wood
industries, is widely used as a growing medium substrate for greenhouse plants (Cheng, 1987).
Sawdust is an appropriate growing medium substrate in the Atlantic Maritimes of Canada because
of its characteristic low cost, local availability, and good water-holding capacity. Since plant roots
and soil microbes often compete for N, one way to at least temporarily reduce N availability to
plants is to add a carbon source that increases microbial growth and N uptake (Schimel et al., 1989;
Marrs, 1993). Sawdust contains a high amount of carbon (C) that has more negative effects on the
non-natives than on the native’s shrubs (Lupinus arboreus Sims) in a community (Alpert & Maron,
2000). Moreover, the levels of the microbial load reduced as the increase of quantity of sawdust
(Mensah et al., 2013). The C/N ratio is related to the behaviour of saprophytic microorganisms in
soil. The microbes consume organic matter requiring organic C and N in a relatively fixed
stoichiometric ratio. Therefore, sawdust can help to reach the C:N ratio to microbe consumption
(Scotti et al., 2015).
Trichoderma as fungi presents in rhizosphere, which joining in plant debris decomposition in the
soil (Topolovec-Pintaric et al., 2013). Some Trichoderma strains can inhabit the rhizosphere,
control plant growth, and protect plants from pathogens (Shoresh et al., 2010). Many research
papers mentioned about the positive influence of T. harzianum and T. viride on lettuce, cucumbers
and bell peppers growth (Bal and Altinatas, 2006; Bal and Altinatas, 2008; Poldmaat al., 2000;
Yedidia at al., 2001). Indigenous T. viride have the antagonistic ability to is isolate against some

3
of important plant pathogenic fungi like Fusarium oxysporum, Sclerotinia sclerotiorum,
Rhizoctonia solani, and Botrytis cinereal (Topolovec-Pintaric et al., 2013).
Past studies have shown that vermicast, as an organic amendment, can enhance plant nutrient
acquisition and tissue nutrient density. However, no published literature has mentioned a
combination of vermicast-Trichoderma-sawdust as amendments for kale (Brassica oleracea var.
sabellica). Therefore, it is necessary to investigate properties exhibited by vermicast-Trichoderma-
sawdust mixed medium and the impact on plant growth, development and harvest yield and quality.
1.1 THESIS OBJECTIVES
The long-term objectives are to develop a highly efficacious soilless medium comprising compost,
sawdust and Trichoderma to grow nutrient-rich and healthy organic vegetables and to understand
nutrient-release patterns and active microbial community structure dynamics in the formulated
media.
The short-term objectives are to:
1) investigate nutrient mineralization dynamics, nutrient release patterns, and active microbial
community structure in different proportions of vermicast-Trichoderma-sawdust mixed media.
2) evaluate the morpho-physiological response of plants to different proportions of vermicast-
sawdust mixed media.
1.2 OUTLINE OF THESIS AND ORGANIZATION
The thesis is divided into six chapters, including the present chapter. Chapter 2 provides a review
of the relevant works in the literature done in the field of my study. It discusses the importance and

4
vermicast and sawdust as soilless growing medium components, different effects of vermicast and
sawdust on plants the functions of Trichoderma on plants and microbial community structure and
importance in growing medium quality. Chapter 3 examines the nutrient-release pattern and
mineralization of vermicast-Trichoderma-sawdust mixed media. Chapter 4 examines the active
microbial composition of vermicast-Trichoderma-sawdust mixed media. Chapter 5 examines the
effect of vermicast-sawdust mixed media on kale (Brassica oleraceae var. sabellica L.), Swiss
chard (Beta vulgaris Subspecies Maritima), and pak choy (Brassica rapa ssp. Chinensis) growth.
Finally, Chapter 6 summarizes the study and offers insights for future research.
1.3 REFENRENCES
Alpert, P., & Maron, J. L. (2000). Carbon addition as a countermeasure against biological invasion
by plants. Biological Invasions, 2(1), 33-40.
Bal, U., & Altintas, S. (2006). Application of the antagonistic fungus Trichoderma harzianum
(TrichoFlow WP™) to root zone increases yield of bell peppers grown in soil. Biological
agriculture & horticulture, 24(2), 149-163.
Bal, U., & Altintas, S. (2008). Effects of Trichoderma harzianum on lettuce in protected
cultivation. Journal of Central European Agriculture, 9(1), 63-70.
Chaoui, H. I., Zibilske, L. M., & Ohno, T. (2003). Effects of earthworm casts and compost on soil
microbial activity and plant nutrient availability. Soil Biology and Biochemistry, 35(2), 295-
302.
Cheng, B. T. (1987). Systems: Sawdust as a greenhouse growing medium. Journal of Plant
Nutrition, 10(9-16), 1437-1446.
Diacono, M., & Montemurro, F. (2011). Long-term effects of organic amendments on soil fertility.
Sustainable agriculture volume 2 (pp. 761-786) Springer.
Lv, B., Zhang, D., Cui, Y., & Yin, F. (2018). Effects of C/N ratio and earthworms on greenhouse
gas emissions during vermicomposting of sewage sludge. Bioresource Technology, 268, 408-
414.

5
Marrs, R. H. (1993). Soil fertility and nature conservation in europe: Theoretical considerations
and practical management solutions. Advances in ecological research (pp. 241-300) Elsevier.
Mensah, P. Y., Kuffour, R. A., Baidoo, P. K., & Awuah, E. (2013). The effect of different
percentages of bulking agent (sawdust) on microbial quality of faecal sludge. Water science
and technology, 67(8), 1728-1733.
Ndegwa, P. M., Thompson, S. A., & Das, K. C. (2000). Effects of stocking density and feeding
rate on vermicomposting of biosolids. Bioresource technology, 71(1), 5-12.
Poldma, P., Jaakson, K., Merivee, A., & Albrecht, A. (2000). Trichoderma viride promotes growth
of cucumber plants. Transactions of the Estonian Agricultural University, Agronomy, (209),
162-164.
Quilty, J. R., & Cattle, S. R. (2011). Use and understanding of organic amendments in australian
agriculture: A review. Soil Research, 49(1), 1-26.
Sanchez, D. F., Pastor, A., Rossing, W., Kropff, M. J., & Lantinga, E. A. (2016). Decomposition,
N contribution and soil organic matter balances of crop residues and vermicompost in maize-
based cropping systems in southwest mexico. Journal of Soil Science and Plant Nutrition,
16(3), 801-817.
Schimel, J. P., Jackson, L. E., & Firestone, M. K. (1989). Spatial and temporal effects on plant-
microbial competition for inorganic nitrogen in a california annual grassland. Soil Biology and
Biochemistry, 21(8), 1059-1066.
Sriakilam, C., Saseetharan, M. K., & Jeyapriya, S. P. (2016). Studies on aerobic compost from the
solid waste generated in coimbatore city, tamilnadu, india. Nature Environment and Pollution
Technology, 15(2), 393.
Topolovec-Pintaric, S., ka Zutic, I., & Dermic, E. (2013). Enhanced growth of cabbage and red
beet by Trichoderma viride\Pospesena rast zelja in rdece pese z dodatkom glive Trichoderma
viride. Acta Agriculturae Slovenica, 101(1), 87.
Weber, J., Karczewska, A., Drozd, J., Licznar, M., Licznar, S., Jamroz, E., & Kocowicz, A. (2007).
Agricultural and ecological aspects of a sandy soil as affected by the application of municipal
solid waste composts. Soil Biology and Biochemistry, 39(6), 1294-1302.
Yedidia, I., Srivastva, A. K., Kapulnik, Y., & Chet, I. (2001). Effect of Trichoderma harzianum on
microelement concentrations and increased growth of cucumber plants. Plant and soil, 235(2),
235-242.

6
CHAPTER 2 LITERATURE REVIEW
In this chapter, we will discuss the effects of vermicast, sawdust, and Trichoderma on plants,
separately, through pass literature papers.
2.1 EFFECTS OF VERMICAST ON PLANTS
2.1.0 Nature of Natural Amendments
The organic amendments application is reliable and useful to improve growing media chemical
and biological fertility of soils, as well as to suppress soilborne pathogens (Ros et al., 2003; Scotti
et al., 2013; Zaccardelli et al., 2013). The most common soil organic amendments are compost,
animal manure, peat moss, wood chips, straw, sewage sludge, sawdust (Goss et al., 2013; Scotti et
al., 2015). Microorganisms, organic matter, mineral nutrients, humic substances, and
macromolecules play essential roles that are enriched in natural amendments where they play
essential roles in its functionality upon application. For example, the partial replacement of
synthetic chemical fertilizers with organic amendments had a significant impact on soil microbial
community, and increased phosphorus (P) uptake and yield of sweet corn (Zea mays L.) (Lazcano
et al., 2013). The use of organic amendments also increased microbial activity in soils by 20% as
compared to synthetic chemical fertilizers (Dinesh et al., 2010; Gonzalez et al., 2010). Nonetheless,
the optimization of the use of organic amendments is vital for sustainable agriculture by improving
natural soil fertility and minimizing any harmful environmental effects such as reducing nitrogen
(N) losses to the environment (Masunga et al., 2016).

7
2.1.1.1 Microorganisms
Microorganisms are a crucial part of biogeochemical cycles on the earth and represent the largest
genetic reservoir with the longest evolutionary history. Microorganisms regularly live as
communities running essential functions of an ecosystem, such as primary production and
remineralization of biomass (Friedrich, 2011). Soil microorganisms contain bacteria,
actinomycetes, fungi, algae and protozoa. Each of them has its functions in the soil. For example,
the first ancient bacteria and microorganisms could fix nitrogen, in time multiplied, and as a result,
released oxygen into the atmosphere (Farquhar et al., 2000; Canfield, 2014). More advanced
microorganisms can affect soil structure and fertility.
The application of effective microorganism significantly enhanced shoot and root biomass in
Trifolium alexanrinum L. crop residues (TCR)-amended soil. Soil amendment and plant growth
stage make the effective microorganism application different on nutrient uptake. Generally,
effective microorganism application can enhance plant nitrogen (N), phosphorus (P), and
potassium (K) nutrition in organic amendments (Javaid & Bajwa,2011).
Microbes must reproduce and respond to a unique set of environmental constraints to sustain life.
The environmental constraints of microbes range from strict aerobic to anaerobic, from high water
requirements to low water requirements, and from autotroph to heterotroph lifestyles, consume
from simple inorganic to complex organic substrates (Paul, 2014). This has an impact on the
surrounding environment and is later discussed as a crucial component of soil (Paul, 2014).
Microbial processes are vital for plant nutrient supply from organic matter decomposition and
nutrient dynamics (Paul, 2007). An organic amendment, such as vermicast, typically increases soil
microbial biomass by supplying C-rich organic compounds. This is important because many

8
microbial communities within the cultivated soil are C-limited (Knapp et al., 2010). Additionally,
specific microbial groups, which feed primarily on organic compounds, need additional C to
change the microbial community compositions (Hu et al., 2011). A better understanding of the
microbial processes that take place in soil under the organic amendment could help identify the
main drivers determining nutrient bioavailability and plant nutrient bio-accessibility (Lazcano et
al., 2013).
2.1.1.2 Organic matter
Organic matter is the accumulation of organic residues, which have undergone biological decay
(decomposition) (Paul, 2014). The organic matters such as proteins, nucleic acids, fats,
carbohydrates are converted into stable vermicast during the vermicomposting (Bhat et al., 2018).
This stabilization process provides vermicast with high exchangeable cations, humic substances,
and other organic matter contents (Fernández-Bayo et al. 2008). Humus is the final state of
decomposition of organic matter. It is composed of very stable lignin (about 30%), complex sugars
(30%), proteins (30%), and fats that are resistant to breakdown by microbes (Henkel, 2015). The
chemical components are C (about 60%), N (5%), some oxygen and various amounts of hydrogen,
sulphur (S), and P (Henkel, 2015).
2.1.1.3 Mineral nutrients
Generally, the contents of total N, available P, organic matter, and exchangeable Calcium (Ca) in
the soil are higher with vermicompost application than with farmyard manure on Celery (Apium
graveolens L. var. dulce Mill), particularly in the second growing season when weather conditions
are more favourable (Ilker et al., 2016). Vermicompost has a higher potential to reproduce

9
microorganisms involved in C and P cycles, which may also be evidence for their cumulative effect
on soil microorganisms (Ilker et al., 2016). N mineralization is a critical biological process for plant
growth and development. The amount of N released to plants depends on the chemical composition
of organic matter and the physical, chemical, and biological properties of microbes in the soil
(Mohanty et al., 2011). There have been some studies on the dynamics of N mineralization from
organic amendments in Agri-ecosystems. Nevertheless, there are no reported studies on the
vermicast-Trichoderma-sawdust mixed medium effect on nutrient mineralization dynamics and
microbial community.
2.1.2 Relationships Between Organic Amendments and Microbial Communities
Organic amendments maintain organic matter and sustain soil fertility for agricultural production,
particularly in the long-term, by slowly releasing nutrients for plant use (Mohanty et al., 2011).
Enzyme activities engaged in the breakdown of organic amendments help to release nutrients for
the plants (Dinesh et al., 2010). Soil microbial biomass and their activities increased rapidly after
the application of organic amendments, but there were no significant changes in the soil microbial
community structure in the short term (Dinesh et al., 2010; Diacono & Montemurro, 2011). Thus,
organic amendments, like vermicast, can stimulate soil microbial processes and increase crop
yields. It also suggested that changes in the microbial community structure do not always change
the function of the microbial community or the availability of plant nutrients and the productivity
of plants (Franco-Otero et al., 2012). According to Lazcano et al. (2013), the relationship between
soil microbial community structure and function is not clear because of the complexity of soil
systems and the existence of several microbial groups. Furthermore, agricultural management
practices mainly impact soil and crop health and productivity through changes in the composition

10
and function of soil microbial communities (Chaparro et al., 2012; Franco-Otero et al., 2012).
2.1.3 Earthworms and Their Functions
Vermicast, the pure product of vermicomposting, involves the non-thermal decomposition of
organic waste through the interaction between organic waste, earthworms, and microorganisms
(Márquez-Quiroz et al., 2014). The activities of earthworms, such as is red wigglers (Eisenia fetida),
including their excreta (vermicasts) could benefit the environment and Agri-ecology. Earthworms
during their feeding and digestion processes convert biodegradable materials and organic wastes
into nutrient-rich vermicast. These have many benefits, including soil development and
maintenance of bio-physicochemical properties such as higher nutritional value, water holding
capacity, and acts as excellent soil ameliorating media (Singh et al., 2016).
2.1.4 Nutritional Quality and Functional Property
Sudies on nutritional quality and functional property of foods are important for commercialization
and to convince consumers for their acceptability (Kolsi et. al., 2017). The nutritional quality of
plant food can be measured by their contents of chlorophylls, carotenoids, essential mineral
elements and fatty acids. This project mainly investigated the quality of growing media, and plant
health and nutritional quality (i.e. anthocyanin content and chlorophyll fluorescence indices) as
influenced by the mixed growing media. On the other hand, functional properties can be measured
through hydration properties (such as water holding capacity), total phenolics, flavonoids and
condensed tannins, antioxidant and enzyme activities (Kolsi et. al., 2017). The continuation of
experinments to assess the nutritional and functional indices of target crops grown in selected

11
vermicast-sawdust mixed media will be done in Dr. Abbey lab in next two years. Plants will be
grown to collect more data about nutritional and functional indices by measusing essential nutrients
and vitamins (vitamins A, C, D, E, and K), carbohydrates, underivatized mono and disaccharides,
total protein and amino acids, antioxidants, hydrophilic, lipophilic and total antioxidant activities,
intact lipid analysis as well as fatty acid methyl esters analysis.
2.1.5 Vermicast as A Suitable Nutrient Source for Crops
The most used soil amendment is the compost, decomposition of organic wastes, which represents
a waste recycling management (Pérez-Piqueres et al., 2006). One of the promising composts is
vermicast. Vermicasts are treated as a miracle plant growth enhancer (Guerrero, 2010). Many
agricultural problems could be avoided by vermicast application, such as soil structural degradation,
erosion, nutrient loss, nutrient toxicity and salinity attributable to its physicochemical nature,
microbial richness and properties.
Generally, Sphagnum peat moss was used as a soilless potting substrate in horticulture due to its
desirable physical characteristics and high nutrient exchange capacity (Raviv et al., 1986).
However, a recent rise in environmental and ecological concerns about harvesting and destruction
of endangered wetland ecosystems worldwide, many people are now looking for an alternative
substrate to replace peat (Buckland, 1993; Robertson, 1993). Similarly, vermicast leachates or
vermicast water-extracts showed to be effective amendments or foliar sprays by promoting the
growth of sorghum (Sorghum bicolor (L.) Moench), strawberry (Fragaria× ananassa Duch.), and
tomato (Lycopersicum esculentum cv. Momotaro) (Gutiérrez-Miceli et al., 2008; Singh et al., 2010;
Tejada et al., 2008). The effectiveness of using vermicast is higher than only using synthetic
chemical fertilizer in the field (Mahmud et al., 2018). Compared to regular supplementation with
chemical fertilizer, the vermicompost application had significantly (p<0.05) increased the soil pH

12
and was able to retain the soil nutrients content.
Regarding the direct effects on plant growth, vermicast is rich with plant macronutrients and
micronutrients. Even though some nutrients are released in inorganic forms that are readily
available to plants, most are released slowly through mineralization of the organic matter. As a
slow-release fertilizer, it supplies the plant with a continuous and constant source of nutrients
(Chaoui et al., 2003). Vermicasts can also increase the macromolecules (proteins, carbohydrates,
and lipids) content in plants. Due to its characteristic as a slow-release fertilizer, it does not require
frequent incorporation into the soil (Mahmud et al., 2018). The irrigation and pest control cost in
vermicast-treated areas is estimated to be significantly lower because of the excellent water-holding
capacity of the vermicast and its pest-repelling benefits (Adhikary, 2012). Vermicast enhances the
‘biological resistance’ in plants and protects them against pests and diseases either by repelling or
by suppressing them (Sinha, 2009).
Vermicast stimulates the growth and development of a wide range of plant species such as pepper
(Capsicum annum L. var. California), strawberry, sweet corn, and tomato (Arancon, 2004; Zaller,
2007; Singh et al., 2010; Lazcano et al., 2011; Lazcano et al., 2013). Vermicast is also suitable for
some aromatic and medicinal plants such as forage sorghum and rice-straw, fruit such as banana
and papaya, and ornamentals such as geranium, marigolds, petunia, chrysanthemum and poinsettia
(Arancon et al., 2008). Vermicast positively impacts vegetative growth, stimulates shoot and root
development, and alters seedling morphology by increasing leaf area and root branching (Edwards
et al., 2004; Kumar et al., 2018). It also stimulates plant flowering, increases the number and
biomass of flowers produced as well as increases fruit yield (Singh et al., 2016). Vermicast can
also increase the nutritional quality of some vegetables such as lettuce, spinach, and Chinese
cabbage (Abbey et al., 2018; Vidal et al., 2018; Wang et al., 2010). Vermicast also positively effects

13
forestry species, such as acacia, eucalyptus, and pine tree (Lazcano et al., 2010a; 2010b). Therefore,
vermicast helps to increase crop productivity, quality and phytochemicals that can benefit human
health.
When vermicast is applied to fruits, studies have shown that they have a higher fat content (23.86%)
and protein content (19.86%) when compared with those grown with synthetic chemical fertilizers
(Ansari & Ismail, 2010).
2.2 EFFECTS OF SAWDUST ON PLANTS
Sawdust is commonly used as growing media for the germination and seedling production of the
greenhouse industry due to its high moisture retention, low cost, and ready availability (Sawan &
Eissa, 1995). For example, oak tree (Quercus) sawdust is a potential substitute for peat moss as a
container substrate for seedlings production of Chinese cabbage (Brassica campestris L.), because
its total carbohydrate content of lignocellulosic substrates (above 30.3 g/100 g) is higher than that
of peat moss (about 23.9 g/100 g) (Jung et al., 2015).In the paper of Dzurenda et al. (2010), they
concluded that dry-thermally-modified oak sawdust is finer than unmodified oak sawdust.
Therefore, in this project, the thermally treated sawdust was selected.
2.2.1 Effect of Non-treated Sawdust on Plant Growth
Sawdust is a suitable growing medium substrate when incorporated with suitable amounts of clay,
ammonium nitrate (NH4NO3) and organic amendments (Cheng, 1987). A mixture of sawdust at
30% of soil volume with NPK (nitrogen, phosphorus, and potassium) fertilizers added to soil

14
produced the highest yield on tomato (Solanum Lycopersicum) compared to sawdust alone. In
another study, biochar obtained through fast pyrolysis of pine sawdust under laboratory
experiments improved the quality of soil and enhanced plant growth in Kubuqi Desert, China.
(Laghari et al., 2016). Untreated sawdust, coconut fibre, bark, and perlite are widely used in North
America (Vano et al., 2011). Some mill residues, such as sawdust and bark, are the cheapest source
of biomass and have been widely used in commercial plant production in Canada for decades
(Bradley & Solutions, 2007; Sawan and Eissa, 1995). Despite high saturated hydraulic
conductivities and good air contents, these wood industry by-products have low water retention
capacities. Limitations to plant growth and fruit production with sawdust are attributed to low water
availability or inappropriate particle-size distribution, and nutrient immobilization as well as
adverse effects due to salt and toxic compound accumulations (Vano et al., 2011). Even when
mixed with peat, sawdust can still have some negative impacts on fruit production compared to
peat and peat-bark substrates (Jarosz & Konopińska, 2010). For example, compared to plants that
grew in peat or peat mixed with pine bark (1:1), plants grown in peat mixed with sawdust (1:1) had
significantly smaller fruit unit weight (10.7 g).
Additionally, sawdust can reduce the use of NH4NO3 fertilizer in food production. For instance,
using 25% sawdust containing urea-formaldehyde to grow sweet corn showed similar results when
compared the control that consisted of preplant NH4NO3 fertilizer only (Brass et al., 2004).
However, replacing NH4NO3 fertilizer with 100% sawdust resulted in decreased growth and yields.
Therefore, using around 25% -30% sawdust may have better plant growth than 100% sawdust.

15
2.2.2 Effect of Thermally Treated Sawdust on Plant Growth
Usually, thermally treated sawdust has higher glucose content than non-treated sawdust. For
example, the content of hemicellulosic sugar (arabinose, xylose, mannose and galactose) in oak
sawdust was higher than that in steamed oak sawdust while the highest glucose content was
observed in steam-exposed oak sawdust (Jung et al., 2015). The presence of high levels of
micronutrients (K, Ca, Mg and P) or low levels of toxic elements such as Zn and Fe in steam-
exposed oak sawdust would be beneficial to horticultural media preparation (Jung et al., 2015).
Regarding physical properties, steamed oak sawdust (84.9% water holding capacity) and steam-
exposed oak sawdust (92 %) had significantly higher total porosity than non-thermally treatment
oak sawdust (82.5%) (Jung et al., 2015). Moreover, through thermal treatment, the porosity can be
significantly increased by the removal of lignin and hemicellulose and the reduction of cellulose
crystallinity (Kumar et al., 2005). Steam-exposed oak sawdust can be used effectively in the
horticultural medium by affecting seed germination, stem length, and leaf area (Jung et al., 2015).
The 90% steam exposed oak sawdust+10% perlite in the media positively affected seed
germination (87%), stem length (3.0 cm), and leaf area (2.2 cm2), which works like peat moss (Jung
et al., 2015).
2.3 TRICHODERMA
Free-living fungi of the genus Trichoderma are ubiquitous in different soils and root ecosystems.
Some Trichoderma strains inhabit the rhizosphere and control plant growth. T. virens can directly
modulate plant growth by releasing of indole-3-acetic acid (IAA) and be related to indole
compounds with auxin activity, which promotes root hair and lateral root development, increasing

16
the total absorptive capacity of the root system (Contreras-Cornejo et al., 2009). Trichoderma can
protect plants from pathogens by activating immunity mediated through the canonical defence
signals jasmonic acid and salicylic acid (Shoresh et al., 2010). For example, the pool of volatile
organic compounds produced by T. viride promoted plant growth, increased lateral root formation,
plant height and flowering in Arabidopsis (Hung et al., 2013). Particularly, 4-phosphopantetheinyl
transferase1 from T. virens plays an essential role in antibiosis, induction of salicylic acid, and
camalexin-dependent plant defence responses (Velázquez-Robledo et al., 2011). In this project,
Trichoderma will be used as the pathogen controller for the combination of vermicast-
Trichoderma-sawdust.
2.4 MIXTURE OF VERMICAST-TRICHODERMA-SAWDUST
Vermicast produced from fermented pig manure with sawdust was reported to significantly
increase the bulk density, particle density, pH, electrolytic conductivity, ash, total N, cation
exchange capacity, available phosphorous and exchangeable cations compared to the use of only
peat moss on the growth of leaf beet, young radish, spinach, and lettuce. There is also no literature
on the effect of combining vermicast-Trichoderma-sawdust. Therefore, it is hypothesized that the
combination of vermicast and sawdust may lead to increased growth of plants enhance plant
nutrients uptake and reduce production cost.
2.5 REFERENCES
Abbey, L., Pham, T. H., Annan, N., Leke-Aladekoba, A., & Thomas, R. H. (2018). Chemical
composition of kale as influenced by dry vermicast, potassium humate and volcanic minerals.
Food Research International, 107, 726-737.

17
Adhikary, S. (2012). Vermicompost, the story of organic gold: A review. Agricultural Sciences,
3(7), 905.
Ansari, A. A., & Sukhraj, K. (2010). Effect of vermiwash and vermicompost on soil parameters
and productivity of okra (Abelmoschus esculentus) in guyana. African Journal of Agricultural
Research, 5(14), 1794-1798.
Arancon, N. Q., Edwards, C. A., Atiyeh, R., & Metzger, J. D. (2004). Effects of vermicomposts
produced from food waste on the growth and yields of greenhouse peppers. Bioresource
Technology, 93(2), 139-144.
Arancon, N. Q., Edwards, C. A., Babenko, A., Cannon, J., Galvis, P., & Metzger, J. D. (2008).
Influences of vermicomposts, produced by earthworms and microorganisms from cattle
manure, food waste and paper waste, on the germination, growth and flowering of petunias in
the greenhouse. Applied Soil Ecology, 39(1), 91-99.
Bhat, S. A., Singh, S., Singh, J., Kumar, S., & Vig, A. P. (2018). Bioremediation and detoxification
of industrial wastes by earthworms: Vermicompost as powerful crop nutrient in sustainable
agriculture. Bioresource Technology, 252, 172-179.
Bradley, D. (2007). Canada–sustainable forest biomass supply chains. climate change solutions.
For International Energy Agency Bioenergy Task, 40
Brass, T. J., Foshee III, W. G., & Sibley, J. L. (2004). Use of fresh sawdust as a nitrogen source in
sweet corn production. Journal of Vegetable Crop Production, 10(2), 89-98.
Buckland, P. C. (1993). Peatland archaeology: A conservation resource on the edge of extinction.
Biodiversity & Conservation, 2(5), 513-527.
Canfield, D. E. (2005). The early history of atmospheric oxygen: Homage to robert M. garrels.
Annu.Rev.Earth Planet.Sci., 33, 1-36.
Chaoui, H. I., Zibilske, L. M., & Ohno, T. (2003). Effects of earthworm casts and compost on soil
microbial activity and plant nutrient availability. Soil Biology and Biochemistry, 35(2), 295-
302.
Chaparro, J. M., Sheflin, A. M., Manter, D. K., & Vivanco, J. M. (2012). Manipulating the soil
microbiome to increase soil health and plant fertility. Biology and Fertility of Soils, 48(5),
489-499.
Cheng, B. T. (1987). Systems: Sawdust as a greenhouse growing medium. Journal of Plant
Nutrition, 10(9-16), 1437-1446.
Contreras-Cornejo, H. A., Macias-Rodriguez, L., Cortes-Penagos, C., & Lopez-Bucio, J. (2009).
Trichoderma virens, a plant beneficial fungus, enhances biomass production and promotes

18
lateral root growth through an auxin-dependent mechanism in arabidopsis. Plant Physiology,
149(3), 1579-1592. doi:10.1104/pp.108.130369 [doi]
Diacono, M., & Montemurro, F. (2011). Long-term effects of organic amendments on soil fertility.
Sustainable agriculture volume 2 (pp. 761-786) Springer.
Dinesh, R., Srinivasan, V., Hamza, S., & Manjusha, A. (2010). Short-term incorporation of organic
manures and biofertilizers influences biochemical and microbial characteristics of soils under
an annual crop [turmeric (curcuma longa L.)]. Bioresource Technology, 101(12), 4697-4702.
Dzurenda, L., Orlowski, K., & Grzeskiewicz, M. (2010). Effect of thermal modification of oak
wood on sawdust granularity. Drvna industrija, 61(2), 89-94.
Edwards, C. A., Dominguez, J., & Arancon, N. Q. (2004). 18. the influence of vermicompost on
plant growth and pest incidence. Soil Zoology for Sustainable Development in the 21st
Century.Cairo, 397-420.
Farquhar, J., Bao, H., & Thiemens, M. (2000). Atmospheric influence of earth's earliest sulfur cycle.
Science, 289(5480), 756-758.
Fernández-Bayo, J. D., Romero, E., Schnitzler, F., & Burauel, P. (2008). Assessment of pesticide
availability in soil fractions after the incorporation of winery-distillery vermicomposts.
Environmental Pollution, 154(2), 330-337.
Franco-Otero, V. G., Soler-Rovira, P., Hernández, D., López-de-Sá, E. G., & Plaza, C. (2012).
Short-term effects of organic municipal wastes on wheat yield, microbial biomass, microbial
activity, and chemical properties of soil. Biology and Fertility of Soils, 48(2), 205-216.
Friedrich, M. W. (2011). Microbial communities, structure, and function. Encyclopedia of
geobiology (pp. 592-595) Springer.
Gonzalez, N., De Bodt, S., Sulpice, R., Jikumaru, Y., Chae, E., Dhondt, S., . . . Inze, D. (2010).
Increased leaf size: Different means to an end. Plant Physiology, 153(3), 1261-1279.
doi:10.1104/pp.110.156018 [doi]
Goss, M. J., Tubeileh, A., & Goorahoo, D. (2013). A review of the use of organic amendments and
the risk to human health. In Advances in agronomy (Vol. 120, pp. 275-379). Academic Press.
Guerrero III, R. D. (2010). Vermicompost production and its use for crop production in the
philippines. International Journal of Global Environmental Issues, 10(3-4), 378-383.
Gutiérrez-Miceli, F. A., García-Gómez, R. C., Rosales, R. R., Abud-Archila, M., Angela, O. L. M.,
Cruz, M. J. G., & Dendooven, L. (2008). Formulation of a liquid fertilizer for sorghum
(sorghum bicolor (L.) moench) using vermicompost leachate. Bioresource Technology, 99(14),
6174-6180.

19
Henkel, M. (2015). 21st century homestead: Sustainable agriculture I Lulu. com.
Hu, J., Lin, X., Wang, J., Dai, J., Chen, R., Zhang, J., & Wong, M. H. (2011). Microbial functional
diversity, metabolic quotient, and invertase activity of a sandy loam soil as affected by long-
term application of organic amendment and mineral fertilizer. Journal of Soils and Sediments,
11(2), 271-280.
Hung, R., Lee, S., & Bennett, J. W. (2013). Arabidopsis thaliana as a model system for testing the
effect of trichoderma volatile organic compounds. Fungal Ecology, 6(1), 19-26.
Ilker, U. Z., Sonmez, S., Tavali, I. E., Citak, S., Uras, D. S., & Citak, S. (2016). Effect of
vermicompost on chemical and biological properties of an alkaline soil with high lime content
during celery (apium graveolens L. var. dulce mill.) production. Notulae Botanicae Horti
Agrobotanici Cluj-Napoca, 44(1), 280-290.
Jarosz, Z., & Konopińska, J. (2010). Effect of substrate type and nitrogen fertilization upon yielding
and chemical composition of" elsanta" strawberry cultivar grown in unheated foil tunnel. Acta
Scientiarum Polonorum-Hortorum Cultus, 9(1), 87-96.
Javaid, A., & Bajwa, R. (2011). Effect of effective microorganism application on crop growth,
yield, and nutrition in Vigna radiata (L.) Wilczek in different soil amendment
systems. Communications in soil science and plant analysis, 42(17), 2112-2121.
Jung, J. Y., Kim, J. S., Ha, S. Y., Choi, J. H., & Yang, J. (2015). Suitability of thermal treated
sawdust as replacements for peat moss in horticultural media.농업생명과학연구, 49(4), 105-
115.
Knapp, B. A., Ros, M., & Insam, H. (2010). Do composts affect the soil microbial community?
Microbes at work (pp. 271-291) Springer.
Kolsi, R. B. A., Salah, H. B., Saidi, S. A., Allouche, N., Belghith, H., & Belghith, K. (2017).
Evaluation of nutritional value, characteristics, functional properties of Cymodocea nodosa
and its benefits on health diseases. Lipids in Health and Disease, 16(1), 1-13.
Kumar, A., Prakash, C. H., Brar, N. S., & Kumar, B. (2018). Potential of vermicompost for
sustainable crop production and soil health improvement in different cropping
systems.International Journal of Current Microbiology and Applied Sciences, 7(10), 1042-
1055.
Kumar, S., Rawat, C. R., Dhar, S., & Raina, S. K. (2005). Dry-matter accumulation, nutrient uptake
and changes in soil-fertility status as influenced by different organic and inorganic sources of
nutrients to forage sorghum (sorghum bicolor). The Indian Journal of Agricultural Sciences,
75(6), 340-342.

20
Laghari, M., Hu, Z., Mirjat, M. S., Xiao, B., Tagar, A. A., & Hu, M. (2016). Fast pyrolysis biochar
from sawdust improves the quality of desert soils and enhances plant growth. Journal of the
Science of Food and Agriculture, 96(1), 199-206.
Lazcano, C., Gómez-Brandón, M., Revilla, P., & Domínguez, J. (2013). Short-term effects of
organic and inorganic fertilizers on soil microbial community structure and function. Biology
and Fertility of Soils, 49(6), 723-733.
Lazcano, C., Sampedro, L., Zas, R., & Domínguez, J. (2010a). Assessment of plant growth
promotion by vermicompost in different progenies of maritime pine (pinus pinaster ait.).
Compost Science & Utilization, 18(2), 111-118.
Lazcano, C., Sampedro, L., Zas, R., & Domínguez, J. (2010b). Vermicompost enhances
germination of the maritime pine (pinus pinaster ait.). New Forests, 39(3), 387-400.
Mahmud, M., Abdullah, R., & Yaacob, J. (2018). Effect of vermicompost amendment on
nutritional status of sandy loam soil, growth performance, and yield of pineapple (ananas
comosus var. MD2) under field conditions. Agronomy, 8(9), 183.
Márquez-Quiroz, C., López-Espinosa, S. T., Sánchez-Chávez, E., García-Bañuelos, M. L., la Cruz-
Lázaro, D., & Reyes-Carrillo, J. L. (2014). Effect of vermicompost tea on yield and nitrate
reductase enzyme activity in saladette tomato. Journal of Soil Science and Plant Nutrition,
14(1), 223-231.
Masunga, R. H., Uzokwe, V. N., Mlay, P. D., Odeh, I., Singh, A., Buchan, D., & De Neve, S.
(2016). Nitrogen mineralization dynamics of different valuable organic amendments
commonly used in agriculture. Applied Soil Ecology, 101, 185-193.
Mohanty, M., Reddy, K. S., Probert, M. E., Dalal, R. C., Rao, A. S., & Menzies, N. W. (2011).
Modelling N mineralization from green manure and farmyard manure from a laboratory
incubation study. Ecological Modelling, 222(3), 719-726.
Paul, E. A. (2007). Soil microbiology, ecology, and biochemistry in perspective. Soil microbiology,
ecology and biochemistry (third edition) (pp. 3-24) Elsevier.
Paul, E. A. (2014). Soil microbiology, ecology and biochemistry Academic press.
Pérez-Piqueres, A., Edel-Hermann, V., Alabouvette, C., & Steinberg, C. (2006). Response of soil
microbial communities to compost amendments. Soil Biology and Biochemistry, 38(3), 460-
470.
Raviv, M., Chen, Y., & Inbar, Y. (1986). Peat and peat substitutes as growth media for container-
grown plants. The role of organic matter in modern agriculture (pp. 257-287) Springer.

21
Robertson, R. A., Buckland, P. C., Lindsay, R. A., Barber, K. E., Wohlsein, P., Trautwein, G., . . .
Zimmermann, F. K. (1993). 2687501. peat, horticulture and environment. Biodiversity and
Conservation, 2(5), 541-547.
Ros, M., Hernandez, M. T., & Garcı́a, C. (2003). Soil microbial activity after restoration of a
semiarid soil by organic amendments. Soil Biology and Biochemistry, 35(3), 463-469.
Sawan, O. M., & Eissa, A. M. (1995). Sawdust as an alternative to peat moss media for cucumber
seedlings production in greenhouses. Strategies for Market Oriented Greenhouse Production
434, 127-138.
Scotti, R., Bonanomi, G., Scelza, R., Zoina, A., & Rao, M. A. (2015). Organic amendments as
sustainable tool to recovery fertility in intensive agricultural systems. Journal of soil science
and plant nutrition, 15(2), 333-352.
Scotti, R., Conte, P., Berns, A. E., Alonzo, G., & Rao, M. A. (2013). Effect of organic amendments
on the evolution of soil organic matter in soils stressed by intensive agricultural
practices. Current Organic Chemistry, 17(24), 2998-3005.
Shoresh, M., Harman, G. E., & Mastouri, F. (2010). Induced systemic resistance and plant
responses to fungal biocontrol agents. Annual Review of Phytopathology, 48, 21-43.
Singh, R., Gupta, R. K., Patil, R. T., Sharma, R. R., Asrey, R., Kumar, A., & Jangra, K. K. (2010).
Sequential foliar application of vermicompost leachates improves marketable fruit yield and
quality of strawberry (fragaria× ananassa duch.). Scientia Horticulturae, 124(1), 34-39.
Singh, S., Singh, J., & Vig, A. P. (2016). Earthworm as ecological engineers to change the physico-
chemical properties of soil: Soil vs vermicast. Ecological Engineering, 90, 1-5.
Sinha, R. K. (2009). No title. Earthworms: The Miracle of Nature (Charles Darwin’s ‘unheralded
Soldiers of Mankind & Farmer’s Friends’).
Sloan, A. E. (2002). The top 10 functional food trends: the next generation. Food technology
(Chicago), 56(4), 32-57.
Tejada, M., Gonzalez, J. L., Hernandez, M. T., & Garcia, C. (2008). Agricultural use of leachates
obtained from two different vermicomposting processes. Bioresource Technology, 99(14),
6228-6232.
Vano, I., Matsushima, M., Tang, C., & Inubushi, K. (2011). Effects of peat moss and sawdust
compost applications on N2O emission and N leaching in blueberry cultivating soils. Soil
Science and Plant Nutrition, 57(2), 348-360.
Velázquez-Robledo, R., Contreras-Cornejo, H. A., Macías-Rodríguez, L., Hernández-Morales, A.,
Aguirre, J., Casas-Flores, S., . . . Herrera-Estrella, A. (2011). Role of the 4-

22
phosphopantetheinyl transferase of trichoderma virens in secondary metabolism and induction
of plant defense responses. Molecular Plant-Microbe Interactions, 24(12), 1459-1471.
Vidal, N. P., Pham, H. T., Manful, C., Pumphrey, R., Nadeem, M., Cheema, M., . . . Thomas, R.
(2018). The use of natural media amendments to produce kale enhanced with functional lipids
in controlled environment production system. Scientific Reports, 8(1), 14771.
Wang, D., Shi, Q., Wang, X., Wei, M., Hu, J., Liu, J., & Yang, F. (2010). Influence of cow manure
vermicompost on the growth, metabolite contents, and antioxidant activities of chinese
cabbage (brassica campestris ssp. chinensis). Biology and Fertility of Soils, 46(7), 689-696.
Zaccardelli, M., De Nicola, F., Villecco, D., & Scotti, R. (2013). The development and suppressive
activity of soil microbial communities under compost amendment. Journal of soil science and
plant nutrition, 13(3), 730-742.
Zaller, J. G. (2007). Vermicompost as a substitute for peat in potting media: Effects on germination,
biomass allocation, yields and fruit quality of three tomato varieties. Scientia Horticulturae,
112(2), 191-199.

23
CHAPTER 3 NUTRIENTS MINERALIZATION AND NUTRIENT-
RELEASE PATTERNS OF VERMICAST-TRICHODERMA-SAWDUST
MEDIA
3.0 ABSTRACT
Vermicast-Trichoderma-sawdust application has multiple benefits for soil quality and plant
productivity improvement. Moreover, vermicast can act as a source of nutrients and sawdust can
act as sequester carbon in the soil. Herein we sought to determine nutrients mineralization and
nutrient-release patterns of varied proportions of vermicast-sawdust growing media. The
treatments consisted of (1) 80% vermicast+20% sawdust; (2) 60% vermicast+40% sawdust; (3) 40%
vermicast+60% sawdust; (4) 20% vermicast+80% sawdust; and (5) sawdust alone (control) saw
dust without or with 10^5 spores/g Trichoderma viride. Total dissolved solids, electrical
conductivity and salinity following submergence of the mixed growing medium treatments in
deionized water gradually increased to a peak before reaching a stable phase. Nutrients released
from all the treatments without T. viride were significantly higher (p<0.0001) than the
corresponding treatments with T. viride. The lower the proportion of vermicast, the lower the
nutrient released from the medium. Thus, the mineral nutrient contents of the media followed the
trend: 80%> 60% > 40% > 20% > 0% of added vermicast. The nutrient-release pattern was
represented by a nonlinear regression equation using the Michaelis-Menton model as nutrient-
release = θ1 * Time / (θ2 + Time). A repeated measures analysis showed that Time*T.
viride*Treatment for total dissolved solids was significantly different (p=0.0102). Nitrate contents
of all the media treatments were reduced with increased incubation time. In conclusion, are duction
in vermicast content of the mixed media significantly reduced mineral nutrients and other chemical

24
indices, while incubation for four weeks seemed adequate for nutrient mineralization. Further
investigation is in progress to assess growing media microbial dynamics and plants growth
performance.
3.1 INTRODUCTION
Almost all plant growth and developmental processes can be associated with growing medium
properties. Important growing medium processes that impact plants include organic matter
decomposition, ammonification, nitrification, denitrification, nitrogen (N) fixation, phosphate (P)
mineralization and sulphur (S) transformations (Paul, 2014). These growing medium processes
affect nutrients availability for plant uptake and utilization. Typically, nutrients mineralization
efficiency is increased when the concentration of a specific element exceeds the needs of the
microbial decomposer for biosynthesis or storage. For example, the mineralization of N depends
on the carbon:nitrogen (C:N) ratio of the decomposing organic matter. Mineral Nis immobilized
once the ratio exceeds 30:1 (McLaren & Cameron, 1996). As a result, the decomposing microbes
may absorb N in mineral form (i.e. ammonium or nitrates) leading to reductions in inorganic N in
the growing medium (Beare et al., 1994; White, 2013; Paul, 2014).
It is universally acknowledged that natural substances such as compost and vermicast improve
growing medium quality and increase plant growth and productivity. Some studies indicated that
under controlled environmental production conditions, the performance of these natural
amendments is better than synthetic chemical fertilizers (Lazcano & Domínguez, 2011). In this
study, we focused on nutrient-release pattern and mineralization ofsoilless mixed media
comprising different proportions of vermicast and sawdust with or without the addition of

25
Trichoderma viride. Vermicomposting using worms is a low-cost, clean and sustainable
technology. The worm castings termed as vermicast is popularly used as growing medium
amendment because of its richness in beneficial microorganisms, nutrients, humic and non-humic
substances with desirable physical properties (Lazcano & Domínguez, 2011; Pathma & Sakthivel,
2012; Bellitürk, 2017; Sinha, 2019; El-Goud &Amal 2020).Furthermore, it was confirmed that
vermicast contains growth-promoting hormones (Nagavallemma et al., 2004) and various nutrients
except for zinc and iron (Abbey et al., 2018) required by plants. Application of vermicast alone
(100%) or 75% vermicast + 25% soilless peat moss with added Mycorrhizal fungi were found to
be toxic to plants due to the high chemical concentration compared to the addition of 25% or 50%
vermicast (Abbey & Appah, 2016). It was also reported that the large surface area of vermicast
granules provides more microsites for microbial activity and nutrients retention (Shi-wei &Fu-zhen,
1991) associated with the vermicast richness in nutrients and beneficial microbes. Nutrients
released from organic amendments including vermicast may be relatively slow, but not much
literature information exist on nutrient-release and nutrient mineralization patterns of vermicast-
based growing media.
Sawdust is a forest by-product with high carbon contentand expectations for the improvement of
growing medium physical properties.It was reported that sawdust increases growing medium
porosity and water retention and can be an option or supplement for traditional soilless growing
medium substrates (Agboola, et al., 2018; Palaniappan et al., 2018).Previous studies showed that
the application of sawdust-vermicompost extract (1:10 v/v; 1000 mg/L) to the foliage of Syngonium
plants increased mineral nutrients uptake, particularly N (Khomami et al., 2019). Therefore, an
appropriate proportion of vermicast and sawdust mixed medium is expected to have a profound
and positive impact on the growing medium biological, physical and chemical properties for the

26
enhancement of plant nutrients uptake and productivity. Recent development showed increased use
of natural additives such as specific microbes, to enhance the functional properties of growing
medium amendments. One such microbe is Trichoderma spp.
Trichoderma spp. is a free-living fungus, found to have beneficial association with organic and
inorganic substances such as humic acids, protein hydrolysates, seaweed extracts and silicon
(Fiorentino et al., 2018). Trichoderma are ubiquitous in different soils and root ecosystems. They
have been reported to protect plants from pathogens by activating immunity mediated genes
through the canonical defence signals i.e. jasmonic acid and salicylic acid pathways (Shoresh et al.,
2010). Therefore, we postulate that vermicast-Trichoderma-sawdust mixed medium can be a
holistic approach to provide the essential plant nutrients and increase plant resilience. However,
there is limited literature information on vermicast-Trichoderma-sawdust mixed medium, and their
proportion has not been reported. Based on the available literature information, we hypothesized
that 60% vermicast + 40% sawdust with the addition of Trichoderma will have the best effect on
nutrients mineralization and nutrients release for plant use. Therefore, the objective of the present
study was to investigate nutrient mineralization and nutrient-release patterns in different
proportions of vermicast-Trichoderma-sawdust mixed media.
3.2 MATERIALS AND METHODS
The study was carried out at the Compost and Biostimulant Laboratory and the research greenhouse
located in the Department of Plant, Food, and Environmental Sciences, Faculty of Agriculture,
Dalhousie University from March 2018 to September 2019. Vermicast i.e. earthworm castings
excreted by Red wiggler worms (Eisenia fetida) was obtained from Pagonis Live Bait, ON, Canada;

27
and heat-treated maple tree sawdust was obtained from Thermal Wood Canada, NB, Canada for
the experiments. Promix-BX (Premier Horticulture Inc., Quakertown, USA), a general-purpose
peat-based substrate consisted of 75%-85% sphagnum peat moss, horticultural-grade perlite and
vermiculite, chemical fertilizer, dolomitic and calcitic limestone, a wetting agent, and mycorrhizal
fungus (Glomus intraradices) was purchased from Halifax Seed Inc., Halifax, NS, Canada.
3.2.1 Media Preparation
The two treatments were five levels of vermicast-sawdust mixed media (weight by weight)as
follows: (1) 80% vermicast+20% sawdust, (2) 60% vermicast+40% sawdust, (3) 40%
vermicast+60% sawdust, (4) 20% vermicast+80% sawdust, and (5) sawdust alone (control); and
two levels of Trichoderma viride treatments as follows: without (A) or with 10^5 spores/g of T.
viride (B). The microbial treatment was prepared by adding 5 ml of cultured T. viride to 400 ml of
sterilized distilled water to get 10^5 spores/g by Fisher brand Finnpipette II
(https://www.pipette.com/21377822-Fisherbrand-Finnpipette-II-200-1000-uL). The treatment
combinations were coded as A1-A5 and B1-B5 (e.g., A1 represented 80% vermicast+20% sawdust
without adding T. viride; B1 represented 80% vermicast+20% sawdust with added T. viride; Table
1).

28
Table 1. Combined growing media treatments and codes for the mineralization and nutrient-release
pattern experiments during December 2018 to February 2019 incubation period.
Code Vermicast (%) Sawdust (%) T. viride
A1 80 20 Absent
A2 60 40 Absent
A3 40 60 Absent
A4 20 80 Absent
A5 0 100 Absent
B1 80 20 Present
B2 60 40 Present
B3 40 60 Present
B4 20 80 Present
B5 0 100 Present
A, no added T. viride; B, added T. viride.
Distilled water (2.5 l) was added to every 1-kg sawdust-vermicast mixed medium and stirred for 1
min to increase the moisture content to approximately 40%, and to sustain microbial activity during
incubation. This was necessary because the heat-treated sawdust was dry.
3.2.2 Growing Media Incubation
The individual mixed medium was incubated in the dark at room temperature (approximately, 22oC)
for 90 days. Samples were taken at (1) 0 (just before incubation), (2) 30, (3) 60 and (4) 90 days
after incubation. The samples were coded A1-1 to A5-4 and B1-1 to B5-4. For example: A1-1
represented treatment A1just before incubation; and B1-4represented treatment B1 at the fourth

29
sampling time or day 90.100-g samples of each media treatment were kept in a plastic bag and
stored in a 20℃freezer (Whirlpool, Mississauga, ON, CA) until ready for analysis. Thus, a total of
160 mixed media samples were collected every 30 days during the incubation period.
3.2.3 Incubation and Nutrients Mineralization
Samples (100 g) collected from the individually incubated growing medium was kept in plastic bag
and stored at -20oC. Samples were taken from the freezer and thawed at room temperature for 24
hr before sending them to the Nova Scotia Department of Agriculture Laboratory Services, Truro,
NS, Canada for nutrients analyses. These samples were treated as greenhouse soil paste according
to standard laboratory protocol (AOAC, 2003). They were tested for nitrate-N, total nitrogen (N),
phosphorus (P), potassium (K), calcium (Ca), magnesium (Mg), boron (B), iron (Fe), manganese
(Mn), copper (Cu), zinc (Zn), sodium (Na), chloride (Cl-), sulphate (SO42-) and aluminum (Al).
They were determined using the AOAC-968.08 inductively coupled plasma (ICP) spectrometer
method (AOAC, 2003).
3.2.4 Nutrient-release
Briefly, 20-g samples of each mixed medium was tied in a rosin press nylon bag (i.e. dimension
2.5x10.16 cm and mesh-size 160 µm)and submerged into 500 ml deionized water contained in a
glass column measuring 35-cm height and10-cm inner diameter. The bags were weighed down
with washed pebbles as described by Abbey et al. (2013) with slight modification. The test solution
was placed in a sample cup (a minimum of 2.5cm in dept is required). The chemical indicesi.e.
total dissolved solids (TDS), electrical conductivity (EC), salinity and pH were used to determine

30
nutrients released into solution using an ExStik ® EC500 instrument (Extech Instruments
Corporation, NH, USA). These chemical indices were recorded every 15 min up to 30 min;
followed by every 30 min up to 1.5 hr; every 1 hr up to 3 hr; 3 hr; 5.5 hr; 9 hr; 12 hr; and then
every 24 hr for 7 days after submergence.
3.2.5 Statistical Analysis
The experiment was arranged in a5×2 factorial design with three replications. Analysis of variance
(ANOVA) was performed with Minitab 18.3statistical software (Minitab Inc., PA, USA) to
determine the significance of the treatments. Treatment means were compared using Fisher's least
significant difference (LSD) test at α = 0.05 when the ANOVA model statistics indicated
differences between treatments.
Additionally, a nonlinear regression model was used to explain the pattern of nutrient release.
Nonlinear regression model is a powerful tool in the mechanical analysis of a system and is
represented by 𝑦𝑖 = 𝑓(𝑥𝑖 , 𝜃) + 𝜀𝑖; where θ represents a parameter vector that has more than one
value (θ1, θ2, θ3 … , θ𝑘); yi is each response i.e. i = 1, …;and n and xi represents the independent
variables. In this experiment, we used the Michaelis-Menton and asymptotic models to explain the
nutrient-release patterns. The repeated measures analysis refers to several measurements made on
the same experimental unit over different time or spatial points. The primary objectives for repeated
measures data analysis are to examine simple factor effects (main effects) and the interaction
effects between them, and it also reduces variability among subjects. In this experiment, we
selected unstructured (UN) covariance structures in the mixed model.

31
3.4 RESULTS AND DISCUSSION
The trend for total dissolved solids (TDS), electric conductivity (EC) and salinity following
submergence of the growing media treatments in deionized water showed an initial steep rise before
gradual and continuous increase and reaching a stable phase (Figure 1). The EC, salinity and TDS
increased slowly after 24 hr. The pH of the media that had no T. viride (i.e. group A) remained
unchanged over time and were within the range of 6.48 and 7.59. There was close similarity in the
pH curves of treatments A2 and A3 after 24 hr that were below the curve for treatment A1. The pH
of A4 was close but slightly (<0.2) below the pH value of A2 and A3. Similar observations of pH
were made for the EC, salinity and TDS. For the treatment that had sawdust alone (A5), the pH
was the lowest compared to the other treatments. The pH of A5 reached a peak (around 7.4)
between 48 – 72 hr (Figure 1) after which it drastically declined to constant level of 6.8. These
variations can be ascribed to low H+ ion concentration and exchanges for the sawdust alone
treatment.

32
Figure 1. Changes in electric conductivity, salinity, total dissolved solids, and pH of different
combinations of vermicast-sawdust media (group A) during December 2018 to February 2019
incubation period. A1, 80% vermicast+20% sawdust; A2, 60% vermicast+40% sawdust; A3, 40%
vermicast+60% sawdust; A4, 20% vermicast+80% sawdust; A5, sawdust alone (control).
The pH trend for all the growing media that were added with T. viride (i.e. group B) was like that
of the group A treatments, except A5. The pH of A5 was reduced and remained constant after 96
hr. There was an increase in the pH of the other treatments but dipped at 36-hr before rising again
(Figure 2). Overall, the changes in water quality indices for group B were slower but gradual
compared to group A. This can be attributed to the presence of T. viride in group B media.
Treatment B5 had a lower pH than the other treatments. The pH of B5did not reach a peak but
reduced within the first 72 hr and remained constant at an approximate pH of 6.4. The pH of B5
was lower than A5, which can be attributed to the presence of T. viride. For most crops, the
optimum pH is between 6.0 and 7.8 (Deina, 2019). Usually, 65% of the applied nutrients are
available for plants at pH levels below 5.9, while 35% may be available below a pH of 5.5. Thus,
except A5 and B5, all the other mixed media treatments were suitable for plant growth.

33
Figure 2. Changes in electric conductivity, salinity, total dissolved solids and pH for different
combinations of vermicast-Trichoderma-sawdust media (group B) during December 2018 to
February 2019 incubation period. B1, 80% vermicast+Trichoderma+20% sawdust; B2, 60%
vermicast+Trichoderma+40% sawdust; B3, 40% vermicast+Trichoderma+60% sawdust; B4, 20%
vermicast+Trichoderma+80% sawdust; B5, Trichoderma+100% sawdust.
Consistently, pH did not vary amongst the treatments whether T. viride was added or not, except
for A5 was higher than B5.
The water quality indices exhibited small continuous fluctuations in the first 5 hr for both group A
and group B treatments (Figures1 & 2). The EC, salinity and TDS of all the treatments increased
slowly. The curves for A1 and B1 treatments were consistently the highest. These results suggested
that the values for the nutrient-release indices were higher for group A treatments compared to
those for group B treatments. Therefore, it can be said that the addition of T. viride had slight
influence on media, but it did not have significant effect on the different media in terms of EC,

34
salinity, TDS and pH. A t-test showed that the pH for group A treatments were significantly
(p<0.05) higher than the pH for group B (Table 2). Apart from the EC values for treatments A4
and A5 that were significantly (p<0.05) higher than the EC values for treatments B4 and B5, all
the other group A treatments had higher EC values than their corresponding group B treatments.
However, TDS and salinity values for A1 were slightly lower but not significant than those for B1;
while values for A2, A3, A4 and A5 were respectively higher than values for B2, B3, B4 and B5.
Therefore, the mixed media without T. viride was found to be likely more efficacious than those
media added with T. viride.

35
Table 2. Two-sample t-test for comparing the pH, electrical conductivity (EC), total dissolved
solids (TDS) and salinity for the mixed media without (A) and with (B) T. viride during December
2018 to February 2019 incubation period.
pH EC TDS Salinity
A1 7.41±0.16 122.4±43.9 84.6±31.5 57.2±20.8
B1 7.21±0.23 125.4±56.7 88.6±39.8 59.4±26.9
p-value 0.003 ns ns ns
A2 7.37±0.13 101.8±38.0 71.0±26.2 47.5±17.7
B2 7.18±0.23 88.3±41.1 61.9±28.7 41.3±19.5
p-value 0.002 ns ns ns
A3 7.35±0.12 88.7±43.2 62.0±30.2 41.6±20.2
B3 7.16±0.21 73.0±33.2 51.4±23.2 34.7±16.1
p-value 0.002 ns ns ns
A4 7.30±0.10 67.4±25.4 47.0±17.9 31.4±12.1
B4 7.09±0.19 49.5±21.9 34.6±15.3 23.0±10.2
p-value <0.001 0.026 0.028 0.027
A5 7.00±0.20 44.07±9.37 30.99±6.80 20.46±4.48
B5 6.72±0.16 30.30±10.50 21.00±7.22 13.91±4.93
p-value <0.001 <0.001 <0.001 <0.001
Values are means ± standard errors; ns, nonsignificant at P>0.05; A1, 80% vermicast+20% sawdust; A2, 60%
vermicast+40% sawdust; A3, 40% vermicast+60% sawdust; A4, 20% vermicast+80% sawdust; and A5, sawdust alone
(control). The corresponding treatments B1-B5 contained T. viride.

36
The nonlinear regression model developed for the nutrient-release pattern using Michaelis-Menton
model was nutrient-release = [θ 1 * Time / (θ 2 + Time)] (Figure 3A).The pH model for A5 and
B5 was the asymptotic model [θ1 - θ2 * exp (- θ3 * Time)] (Figure 3B). Table 3 shows all the
parameters used in the nonlinear regression model. We can use the regression model to predict the
trend of nutrient-release pattern and extrapolate it to outside the observed range.
(A) (B)
Figure 3. Model for nutrient-release pattern for mixed growing media. (A) is the model applied to
the electric conductivity, salinity, total dissolved solids and pH of all the treatments; and (B) is the
model used for the pH of the sawdust alone.

37
Table 3. Nonlinear regression models on electric conductivity (EC), salinity, total dissolved solids
(TDS) and pH of inoculated without (A) or with (B) T. viride at different vermicast-sawdust ratio
during December 2018 to February 2019 incubation period.
Media EC Salinity TDS pH
θ1 θ2 θ1 θ2 θ1 θ2 θ1 θ2 θ3
A1 159.08 1.04 74.58 1.06 111.42 1.16 7.47 0.01
A2 134.54 1.22 62.76 1.21 93.37 1.18 7.42 0.01
A3 138.07 3.63 64.65 3.63 96.51 3.64 7.39 0.01
A4 91.46 1.62 42.93 1.67 64.13 1.64 7.33 0.01
A5 51.00 0.43 23.79 0.45 36.12 0.47 6.86 -0.34 0.14
B1 178.43 1.89 83.82 1.77 124.96 1.76 7.30 0.02
B2 127.82 2.18 60.10 2.24 89.63 2.18 7.27 0.02
B3 105.03 2.11 50.64 2.26 73.44 2.00 7.24 0.02
B4 71.08 2.21 33.20 2.27 49.83 2.23 7.16 0.01
B5 37.21 0.73 17.12 0.74 25.71 0.70 6.52 -0.35 0.03
A1, 80% vermicast+20% sawdust; A2, 60% vermicast+40% sawdust; A3, 40% vermicast+60% sawdust; A4, 20%
vermicast+80% sawdust; A5, sawdust alone (control). The corresponding treatments B1-B5 contained T. viride.
It was found that unstructured (UN) covariance was appropriate for TDS, EC, salinity and pH.
Consequently, all the TDS, EC, salinity and pH values were used in the UN covariance structure.
The multiple means comparison was done once the repeated measures analysis (RMA) (Proc

38
MIXED) showed a significant difference (p<0.05) (Table 4).The RMA results showed that the
interaction effect Time*Trichoderma*Treatment of total dissolved solids was significantly
different (p=0.0102) (Table 4) and therefore, the rest of the 2-way interactions and main effects
were ignored. The MMC comparison result found the 34.5 hr, with T. viride, A1 and B1
combination had the highest TDS least-squares mean of 10.18. The lowest TDS least-squares mean
was at 0.5 hr, with T. viride, A5 and B5 of 3.35 (Table S1).
Table 4.Repeated measures analysis for total dissolved solids, electrical conductivity, salinity and
pH using unstructured Covariance Structure during December 2018 to February 2019 incubation
period.
RMA outcome Num DF Den DF F-Value P-value
Total dissolved solids
Time 12 390 361.46 <0.0001
T. viride 1 390 150.27 <0.0001
Time*T. viride 12 390 3.57 <0.0001
Treatment 4 390 414.98 <0.0001
Time*Treatment 48 390 13.94 <0.0001
T. viride*Treatment 4 390 8.48 <0.0001
Time*T. viride*Treatment 48 390 1.59 0.0102
Electrical conductivity
Time 12 390 228.08 <0.0001

39
T. viride 1 390 75.97 <0.0001
Time*T. viride 12 390 1.57 0.0978
Treatment 4 390 279.63 <0.0001
Time*Treatment 48 390 16.26 <0.0001
T. viride*Treatment 4 390 2.23 0.0655
Time*T. viride*Treatment 48 390 1.25 0.1345
Salinity
Time 12 390 231.42 <0.0001
T. viride 1 390 70.31 <0.0001
Time*T. viride 12 390 2.01 0.0225
Treatment 4 390 303.74 <0.0001
Time*Treatment 48 390 16.76 <0.0001
T. viride*Treatment 4 390 3.56 0.0073
Time*T. viride*Treatment 48 390 1.25 0.1325
pH
Time 12 390 70.08 <0.0001
T. viride 1 390 3052.65 <0.0001

40
Time*T. viride 12 390 17.46 <0.0001
Treatment 4 390 434.12 <0.0001
Time*Treatment 48 390 27.18 <0.0001
T. viride*Treatment 4 390 0.61 0.6530
Time*T. viride*Treatment 48 390 3.83 <0.0001
DF, degrees of freedom; numerator df = k–1; denominator df = N–k.
The RMA for EC showed a significant (p<0.0001)2-way interaction i.e. Time *Treatment, and a
significant (p<0.0001) main effect of T. viride (Table 4). For T. viride main effect on EC, it was
confirmed that the media treatments without T. viride (i.e. group A) had better performance than
when the T. viride was added (Table 5). It was found that 34.5 hr, A1 and B1 combination had the
highest EC least-squares mean (141.14). The least EC least-squares mean was at 0.25 hr, A5 and
B5 (22.67) (Table S2).
Table 5. Least-squares mean of electric conductivity for T. viride main effect during December
2018 to February 2019 incubation period.
Effect Estimate P-value
Without T. viride 68.4188 <0.0001
With T. viride 56.4762 <0.0001

41
For salinity, all the 2-way effects were significant i.e. Time*T. viride (p=0.0225), Time*Treatment
(p<0.0001) and T. viride*Treatment (p=0.0073) (Table 4). For Time*T. viride interaction on
salinity, it was found that 34.5 hr, with T. viride combination had the highest salinity least squares
mean (43.40). The least salinity least-squares mean was at 0 hr, with T. viride (22.67) (Table S3).
For Time*Treatment interaction on salinity, it was found that 34.5 hr, A1 and B1 combination had
the highest salinity least squares mean (66.51). The lowest salinity least-squares mean was at 0.25
hr, A5 and B5 (10.41) (Table S4). For T. viride*Treatment interaction on salinity, it was found that
media without T. viride, A1 and B1 combinations had the highest salinity least squares means
(47.31). The lowest salinity least-squares mean was T. viride,A5 and B5 (12.11) (Table S5).The 3-
way effect of pH i.e. Time*T. viride*Treatment interaction was significant (<0.0001) (Table 4).For
Time*T. viride*Treatment interaction effect on pH, it was found that 22.5 hrs, without T. viride,A1
and B1 combinations had the highest pH least squares mean (7.51). The lowest pH least-squares
mean (6.62) was the A5 and B5 released for 34.5 hrs and A2 and B2released for 2 hrs (Table S6).
Particularly, EC was found to be the best estimator for N compounds and K. In this experiment,
treatments with lower EC were always accompanied by lower N and K contents (Table 6).
Martínez-Suller et al. (2008) reported that there was a high positive correlation between EC and
nutrient concentration. As such, EC was used to estimate mineral nutrients content of the media.

42
Table 6. The selected mineral nutrient content in vermicast-sawdust mixed media without (A) and
with (B) adding Trichoderma during December 2018 to February 2019 incubation period.
Treatment
N
(%)
EC
(mmhos)
Ca
(mg/L)
K
(mg/L)
Mg
(mg/L)
P
(mg/L)
Na
(mg/L)
SO42-
(mg/L)
Cl-
(mg/L)
B
(mg/L)
A1 0.9a 3.4a 136.4a 353.6a 97.8a 22.4a 234.3a 303.7a 405.5a ND
A2 0.8b 2.4b 84.7b 274.9b 57.5b 18.9a 156.8b 184.3b 310.0b ND
A3 0.5c 1.6bc 52.3bc 215.3bc 34.1bc 14.4b 97.6c 132.7bc 286.0b 0.10b
A4 0.4d 1.1cd 42.3bc 199.4c 23.8bc 12.0b 61.8d 107.1cd 150.3c 0.13b
A5 0.2e 0.6d 14.4c 166.9c 4.3c 6.7c 12.1e 38.6d 24.0d 0.23a
B1 1.0a 3.5a 128.2a 356.3a 90.5a 20.0a 223.1a 273.1a 453.3a ND
B2 0.8b 2.5b 93.7ab 306.0b 61.4ab 18.9ab 171.9b 193.1b 405.5a 0.10c
B3 0.6c 1.6c 65.7b 237.2c 42.0bc 16.2bc 115.2c 156.7bc 286.0b 0.11bc
B4 0.4d 1.1cd 50.3bc 213.9c 27.9cd 12.7c 69.1d 116.5c 107.2c 0.12b
B5 0.2e 0.5d 15.5c 166.3d 4.6d 6.6d 11.8e 34.4d 19.0d 0.25a
Means that do not share the same letter are significantly different at P<0.05; ND: data were not detected; A1, 80%
vermicast+20% sawdust; A2, 60% vermicast+40% sawdust; A3, 40% vermicast+60% sawdust; A4, 20% vermicast+80%
sawdust; A5, sawdust alone (control).The corresponding treatments B1-B4 contained T. viride; N, nitrogen; EC,
electric conductivity; Ca, calcium; K, potassium; Mg, magnesium; P, phosphorus; Na, sodium; SO42-, sulphate; Cl-,
chloride; B, boron.
The differences in nutrients contents between the growing medium with T. viride (group B) and
those without T. viride (group A) were not significant (P>0.05). In the present study, we found that
A2 had the highest Nin the initial sampled media compared to A1 and B1, but the initial observation
was reversed after the third sampling at 60 days with the B1 treatment having the highest N (Figure
4). The EC of A1 and B1 slowly decreased from 0 to 60 days and remained around 3 mmhos. The

43
EC of treatments A1-A4 and B1-B4 declined faster than those of A5 and B5. The EC values of
declined in A1 by 42.4%, A2 by 41.2% and B1 by 50.4% compared to a reduced proportion of
decline by 37.8% in A3, 23.2% inA4, 33.4% in B2, 28.6% in B3 and 35.7% in B4. The EC of A5
and B5 fluctuated between 0.5 and 0.65 mmhos. As vermicast was reduced in the medium and
sawdust was increased, the EC values reduced as incubation time progresses (Figures 4). The
nitrate (NO3-) contents of all the treatment samples were reduced to near zero after 60 days of
incubation, irrespective of the media treatments (Figure 4). The Zn content of most of the medium
treatments declined in the first 30 days and then increased again to the level observed at the first
sampling.
Figure 4. Percentage changes in total nitrogen, conductivity, zinc and Nitrate-N in different
proportions of vermicast-sawdust mixed media with or without T. viride during December 2018 to
February 2019 incubation period. A1, 80% vermicast+20% sawdust; A2, 60% vermicast+40%
sawdust; A3, 40% vermicast+60% sawdust; A4, 20% vermicast+80% sawdust; A5, sawdust alone
(control). The corresponding treatments B1-B5 contained T. viride.
The P contents of A5 and B5 were lower compared to the other treatments (Figure 5). The contents

44
of Ca, P, Mg and S were similar among the different treatments from the third sampling i.e. 60
days after incubation (Figures 5 & 6). However, the nutrients contents of A1 and B1 were reduced
within the initial 60 days and remained the same afterwards.
Figure 5. Changes in calcium (Ca), potassium (K), magnesium (Mg) and phosphorous (P) in
different proportions of vermicast-sawdust mixed media with or without T. viride during December
2018 to February 2019 incubation period. A1, 80% vermicast+20% sawdust; A2, 60%
vermicast+40% sawdust; A3, 40% vermicast+60% sawdust; A4, 20% vermicast+80% sawdust; A5,
sawdust alone (control). The corresponding treatments B1-B5 contained T. viride.
The N, Ca, K, Mg, Na, S, and B contents of A1 and B1 were higher than the rest of the treatments
(Figures 6 - 9). A similar finding was reported by Jadhav et al. (1997) who showed an increase in
the uptake of N, P, K, and Mg by field-grown rice (Oryza sativa) when fertilizer was combined
with vermicompost. Treatments A1 and B1 were higher in Na content than the other treatments
(Figure 6). The Cl-content of A2 and B2 increased as time progressed, but it did decline in the

45
other media treatments, which might be caused by microbial activities in the various media (Figure
6).
Figure 6. Changes of sodium (Na), sulphate (SO42-), manganese (Mn), and chloride (Cl-) in
different proportions of vermicast-sawdust mixed media with or without T. viride during December
2018 to February 2019 incubation period. A1, 80% vermicast+20% sawdust; A2, 60%
vermicast+40% sawdust; A3, 40% vermicast+60% sawdust; A4, 20% vermicast+80% sawdust; A5,
sawdust alone (control). The corresponding treatments B1-B5 contained T. viride.
The contents of Al, B, Cu, Fe, Mg and Zn were all less than 0.5 mg/L (Figures 7& 8). An increase
in growth medium Ca2+, Mg2+ and K+ beyond certain concentration can inhibit root growth and
water and nutrients uptake (Matúš, 2007). From Figure 7, the content of Cu in all the growing
media increased as incubation time increased. Therefore, the more the vermicast and less
incubation time the better the nutrient status of the growing medium and the more mineral nutrients
available for plant use.

46
Figure 7. Changes in aluminum (Al), boron (B), copper (Cu) and iron (Fe) contents in different
proportions of vermicast-sawdust mixed media with or without addition of T. viride during
December 2018 to February 2019 incubation period. A1, 80% vermicast+20% sawdust; A2, 60%
vermicast+40% sawdust; A3, 40% vermicast+60% sawdust; A4, 20% vermicast+80% sawdust; A5,
sawdust alone (control). The corresponding treatments B1-B5 contained T. viride.

47

48
Figure 8 (A–D). Redundancy analysis (RDA) of the nutrient-release pattern and mineralization of
the vermicast-Trichoderma-sawdust mixed media during December 2018 to February 2019
incubation period, 0 day (A), 30 days (B), 60 days (C), and 90 days (D). EC, electrical conductivity;
TDS, total dissolved solids; A1, 80% vermicast+20% sawdust; A2, 60% vermicast+40% sawdust;
A3, 40% vermicast+60% sawdust; A4, 20% vermicast+80% sawdust; and A5, sawdust alone
(control). The corresponding treatments B1-B5 contained T. viride.

49
The Figure 8 compared each mineralization sampling time on the electrical conductivity, total
dissolved solids, salinity, and pH of sample released in water at 178.5 hrs. In 0 day incubation, A1,
B1, A2, B2, and A3 had positive relationship with salinity, TDS, and EC. These five treatments
also had positive relationship with most of minerals, except Zn and B had positive relationship with
the rest treatments (Figure 8A). After 30 days incubation, the Mn and Cu changed and had opposite
relationship with A1, A2, A3, and B2 (Figure 8B). The minerals distribution in 60 days was closed
to the 0 day incubation, only Zn and B were had high correlation with B3, A4, B4, A5, and B5
(Figure 8A&C). Compared Figure 8D with Figure 8B&C, the distribution of minerals did not
change too much. Overall, the A2, A3, B2, B3, A4, and B4 were closed to the central, which means
the nutrient pattern of these treatments were mainly influenced by the minerals. Even from Figure
4-7, we concluded A1 and B1 had higher minerals than other treatments, Figure 8 showed the
nutrient-release pattern of A2-A4 and B2-B4 were affected by minerals.
3.5 CONCLUSION
Total dissolved solids, electrical conductivity, and salinity in the solution of all the mixed growing
medium treatments were progressively increased before reaching stable concentrations. Nutrient
released fromA1 and B1 were the highest while A5 and B5 had the least and the others (i.e. A2,
A3, A4, B2, B3 and B4) were intermediate. The interaction of Time *Treatment (p<0.0001) and
the main effect of T. viride was significant (p<0.0001). Nutrients mineralization and availability
were higher in the media treatments without T. viride (i.e. group A) compared to media with added
T. viride. The highest EC combination was 34.5 hr with A1 and B1 and the least was 0.25 hr withA5
and B5). Moreover, the mixed media without T. viride had positively and significant effect on total

50
dissolved solids, electrical conductivity, and salinity. The N, Ca, K, Mg, Na, S and B contents of
A1 and B1 were higher than the rest of the treatments. The RDA analysis showed the A5 and B5
had least relationship with nutrient-release pattern and mineralization in this experiment. A
reduction in vermicast content of a mixed media leads to a significant reduction in mineral nutrients.
This study did not report on microbial relationship with the different growing medium treatments.
However, further studies are in progress to assess the growing media microbial dynamics and plants
growth performance.
3.6 REFERENCES
Abbey, L., & Appah, P. (2016). Pot-grown swiss chard and kale responses to variable rate of
manure compost in mycorrhizal fungi inoculated medium. Paper presented at the III
International Symposium on Organic Greenhouse Horticulture 1164, 241-248.
Abbey, L., Pham, T. H., Annan, N., Leke-Aladekoba, A., & Thomas, R. H. (2018). Chemical
composition of kale as influenced by dry vermicast, potassium humate and volcanic minerals.
Food Research International, 107, 726-737.
Abbey, L., Rao, S. A., Hodgins, L. N., & Briet, F. (2013). Drying and rehydration of vermicasts
do not affect nutrient bioavailability and seedling growth. American Journal of Plant
Nutrition and Fertilization Technology, 3(1), 12-21.
Agboola, O. O., Oseni, O. M., Adewale, O. M., & Shonubi, O. (2018). effect of the use of sawdust
as a growth medium on the growth and yield of tomato. Annales of West University of
Timisoara. Series of Biology, 21(1), 67-74.
AOAC, 2003. Metals and other elements in plants and pet foods, inductively coupled plasma
spectroscopic method, AOAC official method 968.08. Official methods of analysis. 17th ed.
Association of Official Analytical Chemists.
Beare, M. H., Hendrix, P. F., Cabrera, M. L., & Coleman, D. C. (1994). Aggregate-protected and
unprotected organic matter pools in conventional-and no-tillage soils. Soil Science Society of
America Journal, 58(3), 787-795.
Bellitürk, K., Adiloğlu, S., Solmaz, Y., Zahmacıoğlu, A., & Adiloğlu, A. (2017). Effects of
Increasing Doses of Vermicompost Applications on P and K Contents of Pepper (Capsicum
annuum L.) and Eggplant (Solanum melongena L.). Journal of Advanced Agricultural
Technologies, 4(4).

51
El-Goud, A., & Amal, K. (2020). Efficiency Response of Vermicompost and Vermitea Levels on
Growth and Yield of Eggplant (Solanum melongena, L.). Alexandria Science Exchange
Journal, 41(JANUARY-MARCH), 69-75.
Fiorentino, N., Ventorino, V., Woo, S. L., Pepe, O., De Rosa, A., Gioia, L., . . . Colla, G. (2018).
Trichoderma-based biostimulants modulate rhizosphere microbial populations and improve N
uptake efficiency, yield, and nutritional quality of leafy vegetables. Frontiers in Plant Science,
9, 743.
Gandhi, M. (1997). Composting of household wastes with and without earthworms. Environment
and Ecology, 15, 432-434.
Jadhav, A. D., Talashilkar, S. C., & Powar, A. G. (1997). Influence of the conjunctive use of FYM,
vermicompost and urea on growth and nutrient uptake in rice. Journal of Maharashtra
Agricultural Universities, 22(2), 249-250.
Khomami, M. A., Padasht, M. N., Ajili Lahiji, A., & Shirinfekr, A. (2019). The effect of sawdust
vermicompost extract on syngonium podophyllum growth and nutrition. Journal of Plant
Nutrition, 42(4), 410-416. doi,10.1080/01904167.2018.1554071
Lazcano, C., & Domínguez, J. (2011). The use of vermicompost in sustainable agriculture, Impact
on plant growth and soil fertility. Soil Nutrients, 10, 1-23.
Maboko, M. M., & Du Plooy, C. P. (2013). High-density planting of tomato cultivar's with early
decapitation of growing point increased yield in a closed hydroponic system. Acta
Agriculturae Scandinavica, Section B-Soil & Plant Science, 63(8), 676-682.
Martinez-Suller, L., Azzellino, A., & Provolo, G. (2008). Analysis of livestock slurries from farms
across Northern Italy: Relationship between indicators and nutrient content. Biosystems
engineering, 99(4), 540-552.
Matúš, P. (2007). Evaluation of separation and determination of phytoavailable and phytotoxic
aluminium species fractions in soil, sediment and water samples by five different
methods. Journal of inorganic biochemistry, 101(9), 1214-1223.
McLaren, R. G., & Cameron, K. C. (1996). Soil sciencesustainable production and environmental
protection
Nagavallemma, K. P., Wani, S. P., Lacroix, S., Padmaja, V. V., Vineela, C., Rao, M. B., &
Sahrawat, K. L. (2004). Vermicomposting, Recycling wastes into valuable organic fertilizer.
global theme on agroecosystems report no. 8.
Nova Scotia Department of Agriculture. (2010). Understanding a Compost Test Report. Retrieved
from https,//novascotia.ca/agri/documents/lab-services/analytical-lab-manure-compost-
report.pdf

52
NRCS, U. (1998). Soil quality information sheet, soil quality indicators, PH.Retrieved from
https,//web.extension.illinois.edu/soil/sq_info/ph.pdf
Palaniappan, S., Alagappan, M., & Rayar, S. (2018). Influence of substrate particle size on
vermicomposting of pre-processed vegetable waste. Nature Environment & Pollution
Technology, 17(1)
Pathma, J., & Sakthivel, N. (2012). Microbial diversity of vermicompost bacteria that exhibit useful
agricultural traits and waste management potential. SpringerPlus, 1(1), 26.
Paul, E. A. (2014). Soil microbiology, ecology and biochemistry Academic press.
Sawan, O. M., & Eissa, A. M. (1995). Sawdust as an alternative to peat moss media for cucumber
seedlings production in greenhouses. Strategies for Market Oriented Greenhouse Production
434, 127-138.
Shi-Wei, Z., & Fu-Zhen, H. (1991). The nitrogen uptake efficiency from 15N labeled chemical
fertilizer in the presence of earthworm manure (cast). Advances in management and
conservation of soil fauna, 539-542.
Shoresh, M., Harman, G. E., & Mastouri, F. (2010). Induced systemic resistance and plant
responses to fungal biocontrol agents. Annual Review of Phytopathology, 48, 21-43.
Sinha, P. B. (2019). Innovative Waste Management Technologies for Sustainable Development.
Tzortzakis, N. G., & Economakis, C. D. (2008). Impacts of the substrate medium on tomato yield
and fruit quality in soilless cultivation. Horticultural Science, 35(2), 83-89.
USDA PLANTS Database. (2017). "PLANTS Database Advanced Search using minimum and
maximum pH". plants.usda.gov. USDA NCRS. Retrieved from
https,//plants.usda.gov/adv_search.html
White, R. E. (2013). Principles and practice of soil science, The soil as a natural resource John
Wiley & Sons.

53
3.7 SUPPLEMENTARY
Table S1. Least squares mean of total dissolved solids for Time*Trichoderma viride*Treatment
interaction.
Effect Time T. viride Treatment Estimate Estimate
Time*T. viride*Treatment 0 0 A1&B1 5.44 <.0001
Time*T. viride*Treatment 0 0 A2&B2 5.03 <.0001
Time*T. viride*Treatment 0 0 A3&B3 4.56 <.0001
Time*T. viride*Treatment 0 0 A4&B4 4.51 <.0001
Time*T. viride*Treatment 0 0 A5&B5 4.50 <.0001
Time*T. viride*Treatment 0 1 A1&B1 4.19 <.0001
Time*T. viride*Treatment 0 1 A2&B2 4.00 <.0001
Time*T. viride*Treatment 0 1 A3&B3 3.89 <.0001
Time*T. viride*Treatment 0 1 A4&B4 3.64 <.0001
Time*T. viride*Treatment 0 1 A5&B5 3.36 <.0001
Time*T. viride*Treatment 0.25 0 A1&B1 5.64 <.0001
Time*T. viride*Treatment 0.25 0 A2&B2 5.22 <.0001
Time*T. viride*Treatment 0.25 0 A3&B3 4.68 <.0001
Time*T. viride*Treatment 0.25 0 A4&B4 4.60 <.0001

54
Time*T. viride*Treatment 0.25 0 A5&B5 4.49 <.0001
Time*T. viride*Treatment 0.25 1 A1&B1 4.23 <.0001
Time*T. viride*Treatment 0.25 1 A2&B2 4.08 <.0001
Time*T. viride*Treatment 0.25 1 A3&B3 3.85 <.0001
Time*T. viride*Treatment 0.25 1 A4&B4 3.55 <.0001
Time*T. viride*Treatment 0.25 1 A5&B5 3.36 <.0001
Time*T. viride*Treatment 0.5 0 A1&B1 5.90 <.0001
Time*T. viride*Treatment 0.5 0 A2&B2 6.08 <.0001
Time*T. viride*Treatment 0.5 0 A3&B3 5.23 <.0001
Time*T. viride*Treatment 0.5 0 A4&B4 4.86 <.0001
Time*T. viride*Treatment 0.5 0 A5&B5 4.62 <.0001
Time*T. viride*Treatment 0.5 1 A1&B1 5.61 <.0001
Time*T. viride*Treatment 0.5 1 A2&B2 4.57 <.0001
Time*T. viride*Treatment 0.5 1 A3&B3 4.18 <.0001
Time*T. viride*Treatment 0.5 1 A4&B4 3.54 <.0001
Time*T. viride*Treatment 0.5 1 A5&B5 3.35 <.0001
Time*T. viride*Treatment 1 0 A1&B1 6.95 <.0001
Time*T. viride*Treatment 1 0 A2&B2 6.23 <.0001

55
Time*T. viride*Treatment 1 0 A3&B3 5.32 <.0001
Time*T. viride*Treatment 1 0 A4&B4 5.02 <.0001
Time*T. viride*Treatment 1 0 A5&B5 4.72 <.0001
Time*T. viride*Treatment 1 1 A1&B1 7.89 <.0001
Time*T. viride*Treatment 1 1 A2&B2 5.72 <.0001
Time*T. viride*Treatment 1 1 A3&B3 4.71 <.0001
Time*T. viride*Treatment 1 1 A4&B4 3.98 <.0001
Time*T. viride*Treatment 1 1 A5&B5 3.36 <.0001
Time*T. viride*Treatment 1.5 0 A1&B1 6.69 <.0001
Time*T. viride*Treatment 1.5 0 A2&B2 6.65 <.0001
Time*T. viride*Treatment 1.5 0 A3&B3 5.89 <.0001
Time*T. viride*Treatment 1.5 0 A4&B4 5.52 <.0001
Time*T. viride*Treatment 1.5 0 A5&B5 4.89 <.0001
Time*T. viride*Treatment 1.5 1 A1&B1 7.07 <.0001
Time*T. viride*Treatment 1.5 1 A2&B2 6.08 <.0001
Time*T. viride*Treatment 1.5 1 A3&B3 5.80 <.0001
Time*T. viride*Treatment 1.5 1 A4&B4 4.93 <.0001
Time*T. viride*Treatment 1.5 1 A5&B5 3.78 <.0001

56
Time*T. viride*Treatment 2 0 A1&B1 9.23 <.0001
Time*T. viride*Treatment 2 0 A2&B2 8.02 <.0001
Time*T. viride*Treatment 2 0 A3&B3 6.07 <.0001
Time*T. viride*Treatment 2 0 A4&B4 5.96 <.0001
Time*T. viride*Treatment 2 0 A5&B5 4.91 <.0001
Time*T. viride*Treatment 2 1 A1&B1 7.73 <.0001
Time*T. viride*Treatment 2 1 A2&B2 6.62 <.0001
Time*T. viride*Treatment 2 1 A3&B3 6.15 <.0001
Time*T. viride*Treatment 2 1 A4&B4 5.35 <.0001
Time*T. viride*Treatment 2 1 A5&B5 3.84 <.0001
Time*T. viride*Treatment 3 0 A1&B1 9.15 <.0001
Time*T. viride*Treatment 3 0 A2&B2 8.50 <.0001
Time*T. viride*Treatment 3 0 A3&B3 6.68 <.0001
Time*T. viride*Treatment 3 0 A4&B4 6.39 <.0001
Time*T. viride*Treatment 3 0 A5&B5 5.39 <.0001
Time*T. viride*Treatment 3 1 A1&B1 9.53 <.0001
Time*T. viride*Treatment 3 1 A2&B2 8.04 <.0001
Time*T. viride*Treatment 3 1 A3&B3 7.53 <.0001

57
Time*T. viride*Treatment 3 1 A4&B4 4.09 <.0001
Time*T. viride*Treatment 3 1 A5&B5 6.09 <.0001
Time*T. viride*Treatment 4 0 A1&B1 9.10 <.0001
Time*T. viride*Treatment 4 0 A2&B2 8.32 <.0001
Time*T. viride*Treatment 4 0 A3&B3 6.98 <.0001
Time*T. viride*Treatment 4 0 A4&B4 6.54 <.0001
Time*T. viride*Treatment 4 0 A5&B5 5.53 <.0001
Time*T. viride*Treatment 4 1 A1&B1 9.90 <.0001
Time*T. viride*Treatment 4 1 A2&B2 8.10 <.0001
Time*T. viride*Treatment 4 1 A3&B3 7.22 <.0001
Time*T. viride*Treatment 4 1 A4&B4 6.25 <.0001
Time*T. viride*Treatment 4 1 A5&B5 4.34 <.0001
Time*T. viride*Treatment 5 0 A1&B1 9.49 <.0001
Time*T. viride*Treatment 5 0 A2&B2 8.57 <.0001
Time*T. viride*Treatment 5 0 A3&B3 7.38 <.0001
Time*T. viride*Treatment 5 0 A4&B4 6.78 <.0001
Time*T. viride*Treatment 5 0 A5&B5 5.66 <.0001
Time*T. viride*Treatment 5 1 A1&B1 8.91 <.0001

58
Time*T. viride*Treatment 5 1 A2&B2 7.37 <.0001
Time*T. viride*Treatment 5 1 A3&B3 6.98 <.0001
Time*T. viride*Treatment 5 1 A4&B4 5.90 <.0001
Time*T. viride*Treatment 5 1 A5&B5 4.44 <.0001
Time*T. viride*Treatment 8 0 A1&B1 9.71 <.0001
Time*T. viride*Treatment 8 0 A2&B2 8.73 <.0001
Time*T. viride*Treatment 8 0 A3&B3 7.90 <.0001
Time*T. viride*Treatment 8 0 A4&B4 7.00 <.0001
Time*T. viride*Treatment 8 0 A5&B5 5.79 <.0001
Time*T. viride*Treatment 8 1 A1&B1 9.07 <.0001
Time*T. viride*Treatment 8 1 A2&B2 7.41 <.0001
Time*T. viride*Treatment 8 1 A3&B3 6.88 <.0001
Time*T. viride*Treatment 8 1 A4&B4 5.85 <.0001
Time*T. viride*Treatment 8 1 A5&B5 4.52 <.0001
Time*T. viride*Treatment 13.5 0 A1&B1 9.48 <.0001
Time*T. viride*Treatment 13.5 0 A2&B2 8.60 <.0001
Time*T. viride*Treatment 13.5 0 A3&B3 7.92 <.0001
Time*T. viride*Treatment 13.5 0 A4&B4 6.89 <.0001

59
Time*T. viride*Treatment 13.5 0 A5&B5 5.97 <.0001
Time*T. viride*Treatment 13.5 1 A1&B1 9.37 <.0001
Time*T. viride*Treatment 13.5 1 A2&B2 7.71 <.0001
Time*T. viride*Treatment 13.5 1 A3&B3 7.13 <.0001
Time*T. viride*Treatment 13.5 1 A4&B4 6.00 <.0001
Time*T. viride*Treatment 13.5 1 A5&B5 4.62 <.0001
Time*T. viride*Treatment 22.5 0 A1&B1 9.39 <.0001
Time*T. viride*Treatment 22.5 0 A2&B2 8.40 <.0001
Time*T. viride*Treatment 22.5 0 A3&B3 8.18 <.0001
Time*T. viride*Treatment 22.5 0 A4&B4 7.09 <.0001
Time*T. viride*Treatment 22.5 0 A5&B5 5.90 <.0001
Time*T. viride*Treatment 22.5 1 A1&B1 9.78 <.0001
Time*T. viride*Treatment 22.5 1 A2&B2 8.12 <.0001
Time*T. viride*Treatment 22.5 1 A3&B3 7.40 <.0001
Time*T. viride*Treatment 22.5 1 A4&B4 6.16 <.0001
Time*T. viride*Treatment 22.5 1 A5&B5 4.92 <.0001
Time*T. viride*Treatment 34.5 0 A1&B1 9.57 <.0001
Time*T. viride*Treatment 34.5 0 A2&B2 8.68 <.0001

60
Time*T. viride*Treatment 34.5 0 A3&B3 8.40 <.0001
Time*T. viride*Treatment 34.5 0 A4&B4 7.18 <.0001
Time*T. viride*Treatment 34.5 0 A5&B5 5.83 <.0001
Time*T. viride*Treatment 34.5 1 A1&B1 10.18 <.0001
Time*T. viride*Treatment 34.5 1 A2&B2 8.42 <.0001
Time*T. viride*Treatment 34.5 1 A3&B3 7.65 <.0001
Time*T. viride*Treatment 34.5 1 A4&B4 6.33 <.0001
Time*T. viride*Treatment 34.5 1 A5&B5 4.88 <.0001
T. viride levels, 0 means without it; 1 means with it. A1, 80% vermicast+20% sawdust; A2, 60% vermicast+40%
sawdust; A3, 40% vermicast+60% sawdust; A4, 20% vermicast+80% sawdust; A5, sawdust alone (control). The
corresponding treatments B1-B5 contained T. viride.

61
Table S2. Least squares mean of electrical conductivity for Time*Treatment interaction.
Effect Time Treatment Estimate Estimate
Time*Treatment 0 A1&B1 34.73 <.0001
Time*Treatment 0 A2&B2 29.61 <.0001
Time*Treatment 0 A3&B3 25.79 <.0001
Time*Treatment 0 A4&B4 25.48 <.0001
Time*Treatment 0 A5&B5 22.91 <.0001
Time*Treatment 0.25 A1&B1 35.69 <.0001
Time*Treatment 0.25 A2&B2 31.83 <.0001
Time*Treatment 0.25 A3&B3 26.54 <.0001
Time*Treatment 0.25 A4&B4 23.95 <.0001
Time*Treatment 0.25 A5&B5 22.67 <.0001
Time*Treatment 0.5 A1&B1 48.33 <.0001
Time*Treatment 0.5 A2&B2 41.85 <.0001
Time*Treatment 0.5 A3&B3 32.44 <.0001
Time*Treatment 0.5 A4&B4 26.05 <.0001
Time*Treatment 0.5 A5&B5 23.31 <.0001
Time*Treatment 1 A1&B1 80.58 <.0001

62
Time*Treatment 1 A2&B2 51.90 <.0001
Time*Treatment 1 A3&B3 36.55 <.0001
Time*Treatment 1 A4&B4 29.61 <.0001
Time*Treatment 1 A5&B5 24.31 <.0001
Time*Treatment 1.5 A1&B1 83.24 <.0001
Time*Treatment 1.5 A2&B2 56.49 <.0001
Time*Treatment 1.5 A3&B3 48.76 <.0001
Time*Treatment 1.5 A4&B4 39.23 <.0001
Time*Treatment 1.5 A5&B5 27.53 <.0001
Time*Treatment 2 A1&B1 104.35 <.0001
Time*Treatment 2 A2&B2 78.18 <.0001
Time*Treatment 2 A3&B3 53.74 <.0001
Time*Treatment 2 A4&B4 45.96 <.0001
Time*Treatment 2 A5&B5 27.91 <.0001
Time*Treatment 3 A1&B1 127.95 <.0001
Time*Treatment 3 A2&B2 98.86 <.0001
Time*Treatment 3 A3&B3 69.29 <.0001
Time*Treatment 3 A4&B4 41.51 <.0001

63
Time*Treatment 3 A5&B5 47.21 <.0001
Time*Treatment 4 A1&B1 121.70 <.0001
Time*Treatment 4 A2&B2 96.81 <.0001
Time*Treatment 4 A3&B3 72.36 <.0001
Time*Treatment 4 A4&B4 59.24 <.0001
Time*Treatment 4 A5&B5 35.66 <.0001
Time*Treatment 5 A1&B1 122.18 <.0001
Time*Treatment 5 A2&B2 91.99 <.0001
Time*Treatment 5 A3&B3 74.25 <.0001
Time*Treatment 5 A4&B4 58.25 <.0001
Time*Treatment 5 A5&B5 37.19 <.0001
Time*Treatment 8 A1&B1 126.89 <.0001
Time*Treatment 8 A2&B2 94.09 <.0001
Time*Treatment 8 A3&B3 78.75 <.0001
Time*Treatment 8 A4&B4 59.70 <.0001
Time*Treatment 8 A5&B5 38.48 <.0001
Time*Treatment 13.5 A1&B1 124.15 <.0001
Time*Treatment 13.5 A2&B2 92.43 <.0001

64
Time*Treatment 13.5 A3&B3 79.50 <.0001
Time*Treatment 13.5 A4&B4 58.46 <.0001
Time*Treatment 13.5 A5&B5 40.46 <.0001
Time*Treatment 22.5 A1&B1 136.31 <.0001
Time*Treatment 22.5 A2&B2 98.30 <.0001
Time*Treatment 22.5 A3&B3 87.83 <.0001
Time*Treatment 22.5 A4&B4 61.88 <.0001
Time*Treatment 22.5 A5&B5 41.26 <.0001
Time*Treatment 34.5 A1&B1 141.14 <.0001
Time*Treatment 34.5 A2&B2 104.72 <.0001
Time*Treatment 34.5 A3&B3 93.60 <.0001
Time*Treatment 34.5 A4&B4 65.74 <.0001
Time*Treatment 34.5 A5&B5 41.46 <.0001
T. viride levels, 0 means without it; 1 means with it. A1, 80% vermicast+20% sawdust; A2, 60% vermicast+40%
sawdust; A3, 40% vermicast+60% sawdust; A4, 20% vermicast+80% sawdust; A5, sawdust alone (control). The
corresponding treatments B1-B5 contained T. viride.

65
Table S3. Least squares mean of salinity for Time*Trichoderma viride interaction.
Effect Time T. viride Estimate Estimate
Time*T. viride 0 0 15.46 <.0001
Time*T. viride 0 1 9.63 <.0001
Time*T. viride 0.25 0 16.33 <.0001
Time*T. viride 0.25 1 9.71 <.0001
Time*T. viride 0.5 0 19.38 <.0001
Time*T. viride 0.5 1 12.39 <.0001
Time*T. viride 1 0 21.98 <.0001
Time*T. viride 1 1 19.51 <.0001
Time*T. viride 1.5 0 26.18 <.0001
Time*T. viride 1.5 1 21.29 <.0001
Time*T. viride 2 0 33.12 <.0001
Time*T. viride 2 1 24.72 <.0001
Time*T. viride 3 0 36.45 <.0001
Time*T. viride 3 1 35.54 <.0001
Time*T. viride 4 0 36.76 <.0001
Time*T. viride 4 1 37.22 <.0001

66
Time*T. viride 5 0 39.73 <.0001
Time*T. viride 5 1 31.87 <.0001
Time*T. viride 8 0 42.35 <.0001
Time*T. viride 8 1 32.17 <.0001
Time*T. viride 13.5 0 41.51 <.0001
Time*T. viride 13.5 1 32.17 <.0001
Time*T. viride 22.5 0 41.22 <.0001
Time*T. viride 22.5 1 39.55 <.0001
Time*T. viride 34.5 0 43.40 <.0001
Time*T. viride 34.5 1 40.04 <.0001
T. viride levels, 0 means without it; 1 means with it.

67
Table S4. Least squares mean of salinity for Time*Treatment interaction.
Effect Time Treatment Estimate Estimate
Time*Treatment 0 A1&B1 15.65 <.0001
Time*Treatment 0 A2&B2 13.61 <.0001
Time*Treatment 0 A3&B3 11.90 <.0001
Time*Treatment 0 A4&B4 11.03 <.0001
Time*Treatment 0 A5&B5 10.53 <.0001
Time*Treatment 0.25 A1&B1 16.60 <.0001
Time*Treatment 0.25 A2&B2 14.49 <.0001
Time*Treatment 0.25 A3&B3 12.21 <.0001
Time*Treatment 0.25 A4&B4 11.38 <.0001
Time*Treatment 0.25 A5&B5 10.41 <.0001
Time*Treatment 0.5 A1&B1 22.36 <.0001
Time*Treatment 0.5 A2&B2 19.41 <.0001
Time*Treatment 0.5 A3&B3 14.99 <.0001
Time*Treatment 0.5 A4&B4 11.93 <.0001
Time*Treatment 0.5 A5&B5 10.73 <.0001
Time*Treatment 1 A1&B1 37.69 <.0001

68
Time*Treatment 1 A2&B2 24.25 <.0001
Time*Treatment 1 A3&B3 16.90 <.0001
Time*Treatment 1 A4&B4 13.71 <.0001
Time*Treatment 1 A5&B5 11.18 <.0001
Time*Treatment 1.5 A1&B1 38.15 <.0001
Time*Treatment 1.5 A2&B2 26.91 <.0001
Time*Treatment 1.5 A3&B3 22.94 <.0001
Time*Treatment 1.5 A4&B4 18.14 <.0001
Time*Treatment 1.5 A5&B5 12.53 <.0001
Time*Treatment 2 A1&B1 49.23 <.0001
Time*Treatment 2 A2&B2 35.95 <.0001
Time*Treatment 2 A3&B3 25.35 <.0001
Time*Treatment 2 A4&B4 21.28 <.0001
Time*Treatment 2 A5&B5 12.79 <.0001
Time*Treatment 3 A1&B1 60.03 <.0001
Time*Treatment 3 A2&B2 46.21 <.0001
Time*Treatment 3 A3&B3 32.35 <.0001
Time*Treatment 3 A4&B4 19.31 <.0001

69
Time*Treatment 3 A5&B5 22.05 <.0001
Time*Treatment 4 A1&B1 61.95 <.0001
Time*Treatment 4 A2&B2 45.23 <.0001
Time*Treatment 4 A3&B3 33.94 <.0001
Time*Treatment 4 A4&B4 27.34 <.0001
Time*Treatment 4 A5&B5 16.50 <.0001
Time*Treatment 5 A1&B1 57.45 <.0001
Time*Treatment 5 A2&B2 42.83 <.0001
Time*Treatment 5 A3&B3 34.45 <.0001
Time*Treatment 5 A4&B4 27.05 <.0001
Time*Treatment 5 A5&B5 17.21 <.0001
Time*Treatment 8 A1&B1 59.55 <.0001
Time*Treatment 8 A2&B2 44.11 <.0001
Time*Treatment 8 A3&B3 36.89 <.0001
Time*Treatment 8 A4&B4 27.83 <.0001
Time*Treatment 8 A5&B5 17.91 <.0001
Time*Treatment 13.5 A1&B1 58.16 <.0001
Time*Treatment 13.5 A2&B2 43.29 <.0001

70
Time*Treatment 13.5 A3&B3 37.08 <.0001
Time*Treatment 13.5 A4&B4 27.10 <.0001
Time*Treatment 13.5 A5&B5 18.58 <.0001
Time*Treatment 22.5 A1&B1 62.28 <.0001
Time*Treatment 22.5 A2&B2 45.90 <.0001
Time*Treatment 22.5 A3&B3 45.94 <.0001
Time*Treatment 22.5 A4&B4 28.86 <.0001
Time*Treatment 22.5 A5&B5 18.94 <.0001
Time*Treatment 34.5 A1&B1 66.51 <.0001
Time*Treatment 34.5 A2&B2 48.94 <.0001
Time*Treatment 34.5 A3&B3 43.55 <.0001
Time*Treatment 34.5 A4&B4 30.78 <.0001
Time*Treatment 34.5 A5&B5 18.81 <.0001
A1, 80% vermicast+20% sawdust; A2, 60% vermicast+40% sawdust; A3, 40% vermicast+60% sawdust; A4, 20%
vermicast+80% sawdust; A5, sawdust alone (control). The corresponding treatments B1-B5 contained T. viride.

71
Table S57. Least squares mean of salinity for Trichoderma viride*Treatment interaction.
Effect T. viride Treatment Estimate Estimate
T. viride*Treatment 0 A1&B1 47.31 <.0001
T. viride*Treatment 0 A2&B2 38.55 <.0001
T. viride*Treatment 0 A3&B3 30.15 <.0001
T. viride*Treatment 0 A4&B4 24.79 <.0001
T. viride*Treatment 0 A5&B5 18.37 <.0001
T. viride*Treatment 1 A1&B1 45.86 <.0001
T. viride*Treatment 1 A2&B2 30.85 <.0001
T. viride*Treatment 1 A3&B3 26.54 <.0001
T. viride*Treatment 1 A4&B4 17.63 <.0001
T. viride*Treatment 1 A5&B5 12.11 <.0001
T. viride levels, 0 means without it; 1 means with it. A1, 80% vermicast+20% sawdust; A2, 60% vermicast+40%
sawdust; A3, 40% vermicast+60% sawdust; A4, 20% vermicast+80% sawdust; A5, sawdust alone (control). The
corresponding treatments B1-B5 contained T. viride.

72
Table S6. Least squares mean of pH for Time*Trichoderma viride*Treatment interaction.
Effect Time T. viride Treatment Estimate Estimate
Time*T. viride*Treatment 0 0 A1&B1 7.25 <.0001
Time*T. viride*Treatment 0 0 A2&B2 7.21 <.0001
Time*T. viride*Treatment 0 0 A3&B3 7.26 <.0001
Time*T. viride*Treatment 0 0 A4&B4 7.21 <.0001
Time*T. viride*Treatment 0 0 A5&B5 7.20 <.0001
Time*T. viride*Treatment 0 1 A1&B1 6.81 <.0001
Time*T. viride*Treatment 0 1 A2&B2 6.82 <.0001
Time*T. viride*Treatment 0 1 A3&B3 6.79 <.0001
Time*T. viride*Treatment 0 1 A4&B4 6.77 <.0001
Time*T. viride*Treatment 0 1 A5&B5 6.74 <.0001
Time*T. viride*Treatment 0.25 0 A1&B1 7.19 <.0001
Time*T. viride*Treatment 0.25 0 A2&B2 7.21 <.0001
Time*T. viride*Treatment 0.25 0 A3&B3 7.17 <.0001
Time*T. viride*Treatment 0.25 0 A4&B4 7.26 <.0001
Time*T. viride*Treatment 0.25 0 A5&B5 7.19 <.0001
Time*T. viride*Treatment 0.25 1 A1&B1 6.92 <.0001
Time*T. viride*Treatment 0.25 1 A2&B2 6.88 <.0001
Time*T. viride*Treatment 0.25 1 A3&B3 6.91 <.0001
Time*T. viride*Treatment 0.25 1 A4&B4 6.90 <.0001
Time*T. viride*Treatment 0.25 1 A5&B5 6.85 <.0001

73
Time*T. viride*Treatment 0.5 0 A1&B1 7.26 <.0001
Time*T. viride*Treatment 0.5 0 A2&B2 7.23 <.0001
Time*T. viride*Treatment 0.5 0 A3&B3 7.20 <.0001
Time*T. viride*Treatment 0.5 0 A4&B4 7.19 <.0001
Time*T. viride*Treatment 0.5 0 A5&B5 7.19 <.0001
Time*T. viride*Treatment 0.5 1 A1&B1 7.00 <.0001
Time*T. viride*Treatment 0.5 1 A2&B2 6.98 <.0001
Time*T. viride*Treatment 0.5 1 A3&B3 7.00 <.0001
Time*T. viride*Treatment 0.5 1 A4&B4 6.95 <.0001
Time*T. viride*Treatment 0.5 1 A5&B5 6.94 <.0001
Time*T. viride*Treatment 1 0 A1&B1 7.24 <.0001
Time*T. viride*Treatment 1 0 A2&B2 7.23 <.0001
Time*T. viride*Treatment 1 0 A3&B3 7.24 <.0001
Time*T. viride*Treatment 1 0 A4&B4 7.17 <.0001
Time*T. viride*Treatment 1 0 A5&B5 7.20 <.0001
Time*T. viride*Treatment 1 1 A1&B1 7.06 <.0001
Time*T. viride*Treatment 1 1 A2&B2 7.02 <.0001
Time*T. viride*Treatment 1 1 A3&B3 6.98 <.0001
Time*T. viride*Treatment 1 1 A4&B4 7.00 <.0001
Time*T. viride*Treatment 1 1 A5&B5 6.90 <.0001
Time*T. viride*Treatment 1.5 0 A1&B1 7.20 <.0001
Time*T. viride*Treatment 1.5 0 A2&B2 7.22 <.0001

74
Time*T. viride*Treatment 1.5 0 A3&B3 7.26 <.0001
Time*T. viride*Treatment 1.5 0 A4&B4 7.20 <.0001
Time*T. viride*Treatment 1.5 0 A5&B5 7.19 <.0001
Time*T. viride*Treatment 1.5 1 A1&B1 7.01 <.0001
Time*T. viride*Treatment 1.5 1 A2&B2 6.95 <.0001
Time*T. viride*Treatment 1.5 1 A3&B3 6.97 <.0001
Time*T. viride*Treatment 1.5 1 A4&B4 6.96 <.0001
Time*T. viride*Treatment 1.5 1 A5&B5 6.83 <.0001
Time*T. viride*Treatment 2 0 A1&B1 7.23 <.0001
Time*T. viride*Treatment 2 0 A2&B2 7.27 <.0001
Time*T. viride*Treatment 2 0 A3&B3 7.20 <.0001
Time*T. viride*Treatment 2 0 A4&B4 7.16 <.0001
Time*T. viride*Treatment 2 0 A5&B5 7.01 <.0001
Time*T. viride*Treatment 2 1 A1&B1 7.02 <.0001
Time*T. viride*Treatment 2 1 A2&B2 6.98 <.0001
Time*T. viride*Treatment 2 1 A3&B3 6.98 <.0001
Time*T. viride*Treatment 2 1 A4&B4 6.90 <.0001
Time*T. viride*Treatment 2 1 A5&B5 6.80 <.0001
Time*T. viride*Treatment 3 0 A1&B1 7.34 <.0001
Time*T. viride*Treatment 3 0 A2&B2 7.32 <.0001
Time*T. viride*Treatment 3 0 A3&B3 7.30 <.0001
Time*T. viride*Treatment 3 0 A4&B4 7.28 <.0001

75
Time*T. viride*Treatment 3 0 A5&B5 7.04 <.0001
Time*T. viride*Treatment 3 1 A1&B1 7.07 <.0001
Time*T. viride*Treatment 3 1 A2&B2 7.08 <.0001
Time*T. viride*Treatment 3 1 A3&B3 7.05 <.0001
Time*T. viride*Treatment 3 1 A4&B4 6.82 <.0001
Time*T. viride*Treatment 3 1 A5&B5 7.00 <.0001
Time*T. viride*Treatment 4 0 A1&B1 7.38 <.0001
Time*T. viride*Treatment 4 0 A2&B2 7.39 <.0001
Time*T. viride*Treatment 4 0 A3&B3 7.36 <.0001
Time*T. viride*Treatment 4 0 A4&B4 7.29 <.0001
Time*T. viride*Treatment 4 0 A5&B5 7.07 <.0001
Time*T. viride*Treatment 4 1 A1&B1 7.15 <.0001
Time*T. viride*Treatment 4 1 A2&B2 7.12 <.0001
Time*T. viride*Treatment 4 1 A3&B3 7.05 <.0001
Time*T. viride*Treatment 4 1 A4&B4 7.02 <.0001
Time*T. viride*Treatment 4 1 A5&B5 6.78 <.0001
Time*T. viride*Treatment 5 0 A1&B1 7.34 <.0001
Time*T. viride*Treatment 5 0 A2&B2 7.29 <.0001
Time*T. viride*Treatment 5 0 A3&B3 7.31 <.0001
Time*T. viride*Treatment 5 0 A4&B4 7.28 <.0001
Time*T. viride*Treatment 5 0 A5&B5 7.16 <.0001
Time*T. viride*Treatment 5 1 A1&B1 7.16 <.0001

76
Time*T. viride*Treatment 5 1 A2&B2 7.14 <.0001
Time*T. viride*Treatment 5 1 A3&B3 7.10 <.0001
Time*T. viride*Treatment 5 1 A4&B4 7.02 <.0001
Time*T. viride*Treatment 5 1 A5&B5 6.82 <.0001
Time*T. viride*Treatment 8 0 A1&B1 7.38 <.0001
Time*T. viride*Treatment 8 0 A2&B2 7.37 <.0001
Time*T. viride*Treatment 8 0 A3&B3 7.33 <.0001
Time*T. viride*Treatment 8 0 A4&B4 7.26 <.0001
Time*T. viride*Treatment 8 0 A5&B5 6.94 <.0001
Time*T. viride*Treatment 8 1 A1&B1 7.24 <.0001
Time*T. viride*Treatment 8 1 A2&B2 7.20 <.0001
Time*T. viride*Treatment 8 1 A3&B3 7.15 <.0001
Time*T. viride*Treatment 8 1 A4&B4 7.09 <.0001
Time*T. viride*Treatment 8 1 A5&B5 6.79 <.0001
Time*T. viride*Treatment 13.5 0 A1&B1 7.44 <.0001
Time*T. viride*Treatment 13.5 0 A2&B2 7.43 <.0001
Time*T. viride*Treatment 13.5 0 A3&B3 7.33 <.0001
Time*T. viride*Treatment 13.5 0 A4&B4 7.25 <.0001
Time*T. viride*Treatment 13.5 0 A5&B5 6.88 <.0001
Time*T. viride*Treatment 13.5 1 A1&B1 7.24 <.0001
Time*T. viride*Treatment 13.5 1 A2&B2 7.20 <.0001
Time*T. viride*Treatment 13.5 1 A3&B3 7.15 <.0001

77
Time*T. viride*Treatment 13.5 1 A4&B4 7.09 <.0001
Time*T. viride*Treatment 13.5 1 A5&B5 6.79 <.0001
Time*T. viride*Treatment 22.5 0 A1&B1 7.51 <.0001
Time*T. viride*Treatment 22.5 0 A2&B2 7.46 <.0001
Time*T. viride*Treatment 22.5 0 A3&B3 7.42 <.0001
Time*T. viride*Treatment 22.5 0 A4&B4 7.34 <.0001
Time*T. viride*Treatment 22.5 0 A5&B5 6.94 <.0001
Time*T. viride*Treatment 22.5 1 A1&B1 7.25 <.0001
Time*T. viride*Treatment 22.5 1 A2&B2 7.31 <.0001
Time*T. viride*Treatment 22.5 1 A3&B3 7.30 <.0001
Time*T. viride*Treatment 22.5 1 A4&B4 7.21 <.0001
Time*T. viride*Treatment 22.5 1 A5&B5 6.72 <.0001
Time*T. viride*Treatment 34.5 0 A1&B1 7.43 <.0001
Time*T. viride*Treatment 34.5 0 A2&B2 7.38 <.0001
Time*T. viride*Treatment 34.5 0 A3&B3 7.35 <.0001
Time*T. viride*Treatment 34.5 0 A4&B4 7.32 <.0001
Time*T. viride*Treatment 34.5 0 A5&B5 6.90 <.0001
Time*T. viride*Treatment 34.5 1 A1&B1 7.10 <.0001
Time*T. viride*Treatment 34.5 1 A2&B2 7.02 <.0001
Time*T. viride*Treatment 34.5 1 A3&B3 7.16 <.0001
Time*T. viride*Treatment 34.5 1 A4&B4 7.14 <.0001
Time*T. viride*Treatment 34.5 1 A5&B5 6.62 <.0001
T. viride levels, 0 means without it; 1 means with it. A1, 80% vermicast+20% sawdust; A2, 60% vermicast+40%

78
sawdust; A3, 40% vermicast+60% sawdust; A4, 20% vermicast+80% sawdust; A5, sawdust alone (control). The
corresponding treatments B1-B5 contained T. viride.

79
CHAPTER 4 MICROBIAL ACTIVITIES OF VERMICAST-
TRICHODERMA-SAWDUST MIXED MEDIA
4.0 ABSTRACT
Vermicast-sawdust plant growing media are low-cost, rich in beneficial microbes and essential
nutrients. However, very little is known concerning how sawdust-vermicast media combinations
modulate the active microbial community, and nutrient mineralization. As such this study was
conducted to determine whether vermicast-Trichoderma-sawdust mixed media favorably
influences nutrient mineralization and the active microbial composition in vermicast-sawdust
based mixed media. The mixed proportion of the vermicast-sawdust comprised of no Trichoderma
(A), Trichoderma (B) containing 10^5 spores/g T. viride; and five levels of mixed media
treatments (weight by weight) were delineated as: (A1) 80% vermicast+20% sawdust; (A2) 60%
vermicast+40% sawdust; (A3) 40% vermicast+60% sawdust; (A4) 20% vermicast+80% sawdust;
and (A5) sawdust (control). We observed that the addition of T. viride did not significantly (p>0.05)
changed the active microbial community composition in any of the mixed media. We found six
main microbial groups in the media following analysis of the microbial membrane phospholipid
fatty acids (PLFA). These include: G+, G-, fungi, protozoa, eukaryotes and Archea. Treatments
A2 and B2 showed higher pH values and amounts of Protozoa, F/B ratio and Fe. On the other hand,
treatments B1 and B3 contained higher amounts of Na and PG. A moderate positive correlation
(0.3<r<0.7) was observed between microbial groups and mineral nutrients in the mixed media. The
results of phospholipid fatty acid (PLFA) determination showed that the mixed media with A2, A3,
B2 and B3 had the most diverse active microbial community composition and the highest overall
mineral nutrients content compared to the other media. Temporal reductions in microbial

80
community composition were observed in the incubated mixed growing media. After 30 days’
incubation was significantly higher than the others for the sum of bacteria and fungi. For the sum
of bacteria, samples within 30 days’ incubation were higher. Thus, the vermicast-sawdust ratio of
40:60 and 60:40 (w/w) without incubation can potentially improve plant growth and productivity.
Further study on DNA of the mixed media is in progress to assess the specific microbial population
and their functionality on plant growth. Sequence-based approaches (i.e., DNA analysis) to study
microbiomes in vermicast-sawdust based media can expose the associations between microbial
taxa and a myriad of factors to improve crop production.
4.1 INTRODUCTION
Natural growing medium amendments such as compost and vermicast are universally
acknowledged to improve growing medium quality and increase plant productivity. Vermicasts
provide plants with numerous growth factors, including nutrients, amino acids. humins, fulvic or
humic acids (Iheshiulo et al., 2017; Lazcano & Domínguez, 2011). Some studies indicated that
under controlled environmental production systems, the performance of these natural growing
media amendments is better than synthetic chemical fertilizers (Lazcano & Domínguez, 2011).
Generally, the production of vermicast requires simple technology, is low cost, easily available,
and is environmentally sustainable. Furthermore, vermicast increase growing medium quality by
enhancing beneficial microbial activities or composition, as well as reducing risk of environmental
pollution (Duong et al., 2012). Vermicast alone can be toxic to plants due to the concentration of
mineral nutrients and other compounds (Abbey and Appah, 2017). However, vermicast mixed with
other substrates, such as peat moss or coconut fiber was found to be efficacious and had positive

81
impact on plants performance. Sawdust, a waste product of the timber and wood processing
industry is another option that can be used as a growing medium substrate for greenhouse plants
(Sawan & Eissa, 1995), but not widely researched although it is low cost and more importantly,
locally available, as well as have good water-holding capacity. Previous studies showed that
application of sawdust-vermicompost extract (1:10, v/v; 1000 ppm) to the foliage of Syngonium
plants increased mineral nutrients uptake, particularly N (Khomami et al., 2019).
Free-living fungi such as Trichoderma viride are also recognized to confer beneficial association
with organic and inorganic natural substances (i.e., humic acids, protein hydrolysates, seaweed
extracts, and silicon) (Fiorentino et al., 2018). T. viride are ubiquitous in different soils and root
ecosystems. They have been reported to protect plants from pathogens by activating immunity
mediated genes through the canonical defence signals jasmonic acid and salicylic acid pathways
(Shoresh et al., 2010). Furthermore, soil microbes can form important associations or relationships
with natural medium amendments including vermicast from which they can derive their nutrients
for metabolism. Typically, these microbes mineralize or help to recycle nutrients during their
metabolic activities in the growing media. This metabolic action can improve the media quality
and nutrients availability for plant uptake, growth and productivity (Lichtfouse, 2010; He et al.,
2013). Intact membranes of microbes contain phospholipids, which are characterized by acyl
chains or fatty acids that can be associated to specific microbial taxa (Gómez-Brandón and
Domínguez, 2010). Phospholipids are sufficiently complex to provide biomarkers for viable
microbial biomass, community composition, nutritional and physiological status. A combination
of molecular and biochemical screening can be used to determine active microbial community
structure (Ying et al., 2013). Phospholipids fatty acids (PLFAs) are rapidly synthesized during
microbial growth and are quickly degraded upon microbial death. They represent a ‘fingerprint’ of

82
the viable or active microbial community and do not function as storage compounds (Yao et al.,
2000; Evershed et al., 2006; Gómez-brandón & Domínguez, 2010). Therefore, microbial PLFA
provides qualitative and quantitative information about the structure of the microbial community,
and it also indicates the presence and abundance of the main groups of microorganisms. PLFA
reflect the current living community because those phospholipids are found in all living cell
membranes, but not in storage molecules (Hirsch et al., 2010). Typically, PLFA can be used as
biomarkers to assess the active microbial community composition such as gram-positive (G+) and
gram-negative (G-) bacteria, actinomycetes, Archaea, fungi and protozoa living in the root
rhizosphere (He et al., 2009; He et al., 2007; White et al., 1996). Hence, PLFA profiling is an
efficient way to evaluate the active microbial community in the mixed media samples and can be
used to represent and compare the biological components of growing media. Taking these into
consideration, we hypothesized that vermicast-Trichoderma-sawdust (i.e. 40% sawdust + 60%
vermicast formulation) mixed media used under controlled environmental conditions could
enhance the growing media performance by improving the active microbial community
composition and mineral nutrients content. Therefore, the object of the present study was to
determine nutrient mineralization and active microbial composition and their relationship in
incubated vermicast-Trichoderma-sawdust mixed media.
4.2 MATERIALS AND METHODS
4.2.1 Study Site and Sampling
A 3-month laboratory experiment on nutrient mineralization in incubated sawdust-vermicast mixed
media was conducted in the Compost and Bio-stimulant Laboratory, Department of Plant, Food

83
and Environmental Science, Faculty of Agriculture, Dalhousie University, Canada. Samples of the
incubated media were analyzed for active microbial composition at the Boreal Ecosystem and
Agricultural Research Facility, Department of Environmental Science, Grenfell Campus,
Memorial University of Newfoundland and Labrador, Canada.
Vermicast produced by earthworm castings excreted by Red wiggler worms (Eisenia fetida) was
obtained from Pagonis Live Bait, ON, Canada; and heat-treated maple tree sawdust was obtained
from Thermal Wood Canada, NB, Canada and used for the experiments. This experiment was
arranged in a 2×5 factorial with four replications. The two factors were two levels of Trichoderma
viride as follows: without (A) or with (B) 10^5 spores/g T. viride; and five levels of mixed media
treatments (weight by weight) were delineated as: (A1) 80% vermicast + 20% sawdust; (A2) 60%
vermicast + 40% sawdust; (A3) 40% vermicast + 60% sawdust; (A4) 20% vermicast + 80%
sawdust; and (A5) sawdust alone (control). The corresponding mixed media treatments with added
T. viride were labelled B1 – B5. Each treatment was mixed with 5 ml T. viride and 400 ml deionized
water to make 10^5 spores/g by Fisherbrand Finnpipette II (https://www.pipette.com/21377822-
Fisherbrand-Finnpipette-II-200-1000-uL). Every 1 kg sawdust-vermicast mixed media was
partially decomposed by sufficiently mixed with tap water to improve its physicochemical
properties before adding 2.5 L of distilled water. The individual mixed media were then incubated
at room temperature for 90 days. A total of 160 mixed media samples were collected at the
beginning followed by every 30 days during the incubation period. Thus, sampling was done at
four different times. Therefore, the mixed media were coded as A1-1 to A5-4 and B1-1 to B5-4,
where for example, A1-1 means 80% vermicast + 20% sawdust at the first sampling time. Each
100-g medium treatment sample were kept in a plastic bag and stored in a -20 ℃ freezer (Whirlpool,
Mississauga, ON, CA) until analyzed.

84
4.2.2 Nutrient Mineralization
The media samples were sent to Nova Scotia Department of Agriculture Laboratory Services, Truro,
Canada (http://www.gov.ns.ca/agri/qe/labserv/) for analyses of nitrate-N, nitrogen (N), phosphorus
(P), potassium (K), calcium (Ca), magnesium (Mg), boron (B), iron (Fe), manganese (Mn), copper
(Cu), zinc (Zn), sodium (Na), chloride (Cl), sulphate (SO4) and aluminum (Al) using the AOAC-
968.08 inductively coupled plasma (ICP) mass spectrometer method (AOAC, 2003).
4.2.3 Lipid Extraction
The method of Zaeem et al. (2019) with slight modification was adopted for the extraction of
PLFAs from the media samples. The total soil microbial fatty acids were extracted from 4-g ground
mixed medium samples with 10 mL of 2:1 chloroform:methanol (v/v). The sample mixture was
sonicated (Q700 Sonicator, Fisherbrand™ UK.) for 5 min at 50 amplitude followed by 5 sec of
pulse on time, and then 10 sec of pulse off time. During sonication, the samples were kept in an ice
bath to cool. After 24 hr incubation at room temperature, the supernatant was filtered with
Whatman 42 filter paper (Sigma Aldrich, ON. Canada). The filtered samples were dried under a
gentle stream of N in a pre-weighed sample vial. Extracted total lipids were resuspended in 2 ml
chloroform followed by fractionation using a Visiprep™ SPE Vacuum Manifold and Discovery®
DSC-Si SPE columns (50 μm, 70 Å, 100 mg/1 mL) (Sigma-Aldrich, Wilmington, DE, USA).
Aliquots of 2.0 mL chloroform and 1.0 mL acetone were used to remove unwanted, undesired
materials from the columns. Then 1.5 mL samples were added to the column followed by 2.0 mL
chloroform, 2.0 mL acetone, and then 2.0 mL methanol were used to fractionate lipids into neutral

85
lipids, glycolipids, and phospholipids, respectively. The solution was slowly passed into the
extraction tube under vacuum (approximately, 30 kPa). The phospholipid fractions were dried
under a gentle stream of nitrogen and then resuspending in 500 µL of methyl tert-butyl ether
(MTBE). 100 µL of solvent was used for GC-MS analysis, and the rest 400 µL of solvent was
saved for later LC-MS analysis. The 100 µL of MTBE was derivatized using 50 µL trimethyl
sulfonium hydroxide (TMSH) (Batista et al., 2001). The mixture in the vial was vortexed and
incubated for 30 min at room temperature. After incubation, 50 µL samples were mixed with 10
µL of the internal standard methyl nonadecanoate (C18:0 Alkane/MTBE @ 1600 µg/mL) GC vials
and the samples analyzed via GC-FID and GC-MS (Batista et al., 2001).
4.2.4 GC-FID/MS Analysis of Microbial PLFAs
Gas chromatography with flame ionization detection (GC-FID) or mass spectrometry (GC-MS)
analysis method was adapted from Gómez-Brandón (2010) and Zaeem et al (2019). The methylated
PLFAs were identified through retention times comparison and mass spectra obtained from
commercial standards (i.e. Supelco 37 Component FAME Mix and Bacterial Acid Methyl Ester
(BAME) CP mix) obtained from Sigma-Aldrich, Bellefonte, PA, USA) (Lazcano et al., 2013).
BAME mix was prepared at five different concentrations (0.2, 0.4, 0.6, 0.8, and 1.0 mg/mL) diluted
with n-hexane to obtain a standard curve. The standard curve was used to quantify individual
PLFAs. A total of 25 BAME were identified (Table 2), which was used as biomarkers to assess the
different active microbial groups living in the media (active microbial community composition) at
the time of sampling. The PLFAs (Table S1) were used as biomarkers to determine the presence
and abundance of specific microbial groups (Zelles, 1999, Zaeem et al 2019). The PLFAs
considered to be predominantly of bacterial origin were further classified as G+ bacterial PLFAs

86
and G- bacterial PLFAs (Lazcano et al., 2013).
GC-FID was used for quantification while GC-MS was used for PLFA identification. GC-MS
analysis was conducted on a Thermo Scientific Trace-1300 GC coupled to a Thermo Scientific
TSQ 8000 Triple Quadrupole mass spectrometer (MS). GC-FID analysis was conducted on a
Thermo Scientific Trace-1300 gas chromatography coupled to a flame ionization detector.
Methylated fatty acids were separated with a BPX 70 high-resolution column (10 m × 0.1 mm ×
0.2 μm; Life Science, Peterborough, Ontario, Canada) using helium (He) as the carrier gas at a
flow rate of 15 mL/min. One (1 μL) of each sample was injected 1:15 in split mode using a Tri-
plus autosampler. The oven temperature was programmed as follows: the initial oven temperature
of 50°C was held for 0.75 min; then programmed to increase at 40°C min-1 to 175°C; increased at
6°C min-1 to 210°C; increased at 15°C min-1 to 250°C where it was held for 2 min. Total analysis
time was 13.8 mins.
4.2.5 LC-MS Analysis of Intact Microbial Lipids
The intact microbial lipidome was also used to assist in evaluating the active microbial community
composition in the media. A modified Bligh and Dyer (1959) method was used to extract total
lipids from each sample. The samples extracted for GC-MS analysis was partitioned and 300 uL
saved for LC-MS analysis (See extraction above). Prior to LC-MS analysis, the lipid extracts were
re-filtered by WhatmanTM Mini-UniPrep G2 Hand Compressor and syringeless disposable filter
vials (GE Healthcare Biosciences, Pittsburgh, PA, USA).

87
4.2.5.1 Analysis of the intact lipids using C30 reverse-phase liquid chromatography coupled to
high-resolution accurate mass tandem mass spectrometry (C30-RPLC-HRAM-MS/MS)
An Accucore C30 column (150×2 mm I.D., particle size: 2.6 µm, pore diameter: 150 Å) obtained
from ThermoFisher Scientific (ON, Canada) was used to separate the intact lipids according to our
previously published method (Pham et al., 2019). Briefly, reconstituted lipids (10 μL) were injected
onto the column using the following mobile phase system: solvent A (acetonitrile:water, 60:40, v/v)
containing 10 mM ammonium formate and 0.1% formic acid; and solvent B
(isopropanol:acetonitrile:water, 90:10:1, v/v/v) containing 10 mM ammonium formate and 0.1%
formic acid. A C30-RPLC separation was carried out with a flow rate of 0.150 mL/min at 30°C
column oven temperature, and 10 µL of the lipid extract suspended in chloroform: methanol (1:1
v/v) was injected onto the column. The following system gradient was used for separating the lipid
classes and molecular species: 30% solvent B for 3 min; then solvent B increased to 43% over 5
min, then to 50% B in 2 min, then to 90% B over 5 min, then to 99% B over 17 min and finally
kept at 30% B for 8 min. The column was re-equilibrated to starting conditions (70% solvent A)
for 10min prior to each new injection.
4.2.5.2 High-resolution accurate mass tandem mass spectrometry analysis
A Q-Exactive Orbitrap mass spectrometer was used to analyze the intact microbial lipids, and X-
Calibur software 4.0 (TermoScientifc, MO, USA) was used to operate the instrument. The Q-
Exactive mass spectrometer was controlled under the following parameters: sheath gas, 40;
auxiliary gas, 2; ion spray voltage, 3.2 kV; capillary temperature, 300°C; S-lens RF, and 30V
(Supplementary Table S2). The instrument was externally calibrated to 1 ppm using both positive
and negative electrospray ionization mass spectrometry (ESI/MS) tune solutions (ThermoScientifc,

88
MO, USA). Moreover, tune parameters were optimized in both negative- and positive-ion modes
using a mixture of lipid standards (Avanti Polar Lipids, Alabama, USA). Precise lipid identification
was accessed from LipidSearch 4.1.9 software (Thermo Fisher Scientific, 2016; Taguchi &
Ishikawa, 2010; Pham et al., 2019) with manual confirmation using Xcalibur 4.0.
4.2.6 Data Processing and Statistical Analysis
Chromatographic peaks were integrated using Xcalibur Quan Browser in order to construct
calibration curves. Redundancy analysis (RDA) was done to determine the association between the
growing media nutrient and microbial community composition. Pearson correlation coefficient was
performed to assess the strength of the relationship. Analysis of variance (ANOVA) was done to
determine whether treatments had any significant effects on microbial community composition and
mineral nutrient content. Where treatment effects were significant, the means were separated using
Fisher’s least significant difference (LSD) test at α=0.05. A total of 40 samples were analyzed per
experimental replicate. Statistical analysis was conducted using XLSTATS premium version
(Addinsoft Inc, Paris, France). The comparison of treatments with and without T. viride was
performed using group comparison analysis at α=0.05.
4.3 RESULTS AND DISCUSSION
A total of 26 PLFAs were identified and used as biomarkers to assess the presence of different
active microbial groups in the media [A1-A5 and B1-B5] (Supplementary Table S1). The PLFA
were used to diagnose the presence of the different groups of microbes and their rate of change in
the media habitat as explained by Zelles (1999). The diversity of the active microbial community

89
is an important indicator of growing media quality and health status (Kong et al., 2011). A
combination of PLFA markers previously reported in the literature was used to explain changes in
the microbial community composition or structure in response to variations in the growing media
composition. According to standard community structure method mentioned by Hedrick et al.
(2005), we found six main microbial groups present as follows in the media: G+, G-, G+G-, fungi,
protozoa and eukaryotes (Figure 1). Archea was also found in LC-MS analysis (Figure 3). All the
treatments were combined into a single group to have an overview of the diversity in microbial
population. Bacterial groups identified as G+, G- and G+G- were significant, and consistently
higher in all the media treatments during the incubation time compared to fungi, eukaryotes and
protozoan populations. G+ and G- contributed 18.98% and 35.53%, respectively, to the overall
total microbial population observed on vermicast-sawdust media (Figure 1A). Compared to
without adding Trichoderma, adding Trichoderma had lower ratio of fungi, protozoa, and
eukaryote (Figure 1B). The most abundant microbes in the soil are bacteria (Reid, G. & Wong, P.,
2005). In this project, the total of G+ and G- bacteria (sum of G+, G-, and G+G-) of vermicast-
sawdust mixed media without (93.82%) and with (94.97%) adding Trichoderma made up the most
of part of total microbial community (Figure 1).Forests and woodlot samples were observed to
have higher relative abundance of G- bacteria in addition to monounsaturated fatty acids (Zelles,
1999; Bossio et al., 2005). Conversely, agricultural soil samples were reported to be indicative of
higher levels of G+ bacteria in association with branched fatty acids (Haack et al., 1994). Therefore,
the proportion of G+ bacteria (18.9%) relative to the overall observed total microbial population
suggested that the content of both monounsaturated fatty acids and branched fatty acids might not
be very high. According to Mathew et al. (2012), soil organic carbon positively correlates with
PLFA biomarkers (r=0.98). A lower proportion of G+ bacterial population compared to G‒

90
suggested a sufficiency of organic carbon in the media (Herman et al., 2012; Mathew et al., 2012;
Pham et al., 2019). Consequently, our results indicated that the G+ bacterial population was higher
than the G- bacterial population in the growing media irrespective of sawdust composition (Figure
1). The addition off sawdust to the growing media provided an excellent source of organic carbon
to the media.
Figure 1. A pie chart showing average levels of six main microbial groups (G+, G-, G+G-, fungi,
protozoa and eukaryotes) in percentage of vermicast-sawdust mixed media without (A) and with
(B) adding Trichoderma during December 2018 to February 2019 incubation period. G+, gram-
positive; G-, gram-negative; G+G-, microbes that cannot tell belonging to G+ or G-; G+G-F,
microbes that cannot tell belonging to G+, G-, or F.
4.3.1 Comparison of Media Active Microbial Composition Following the Addition
of Trichoderma
The media without T. viride (A) and with T. viride (B) were considered as two different treatment
groups. A 2-sample t-test showed that eukaryotes, fungi and the ratio of fungi to bacteria differ
significantly between the treatments A and B (Supplementary Table S3). T. viride showed little but

91
non-significant inhibitions (limitations) on the abundance of bacteria in the media. These results
are in contrast with the results obtained by Leelavathi et al. (2014). In their work, the concentration
of the bacterial species Staphylococcus aureus (G+), Escherichia coli (G-), and Klebsiella (G-) was
reduced significantly by T. viride extract in a mixed medium comprising 0.2 g MgSO4 (7H2O), 0.9
g K2HPO4, 0.15 g KCl, 1.0 g NH4NO3, 3.0 g D+ glucose anhydrous, 0.15 g rose Bengal and 20g
agar. The difference in the results can be ascribed to the differences in growing media composition,
which suggested that Trichoderma's effect on bacterial composition is dependent on media
components and the Trichoderma species (Leelavathi et al., 2014). In Leelavathi’s studies, the
strain of Trichoderma showed various degrees of inhibition of various plant pathogens. In our study,
the G+ was slightly inhibited by the addition of Trichoderma (Supplementary Table S3) although
it was not significant. Many findings also suggested that the development and biochemistry of
plants were strongly affected by Trichoderma strains (Mach et al., 1993). Another confounding
factor in our study was that we evaluated the effects of T. viride. on the bacterial classes or groups,
while Leelavathi’s studies did their evaluation at the species level. This could be the reason for the
no statistically significant effect of the added T. viride.

92

93
Figure 2. (A–D). The relationship between the active soil microbial community (PLFA), nutrient
mineralization, and media amendments during December 2018 to February 2019 incubation period.
A principal component analysis (PCA) biplot (A) showing the groupings of the nutrients, and
treatments with active microbial composition. One-way ANOVA shows microbial groups and
nutrient mineralization following principal component analysis of components segregated in (B)
quadrants 1 (Q1), (C) Q2, and (D) Q3. Means in the same row accompanied by different
superscripts are significantly different at LSD α = 0.05, n = 4 per experimental replicate. A1, 80%
vermicast+20% sawdust; A2, 60% vermicast+40% sawdust; A3, 40% vermicast+60% sawdust; A4,
20% vermicast+80% sawdust; and A5, sawdust alone (control). The corresponding treatments B1-
B5 contained T. viride.

94
4.3.2 Relationship Between Mineral Nutrients and Active Microbial Community
The microbial composition of the growing media is known to mineralize organic matter and other
sources of plant nutrients in the media, so it is important to confirm their availability for plant
growth and development (He et al., 2013). The PLFA are effective taxonomic markers because
different groups of microorganisms synthesize a variety of PLFA through various biochemical
pathways (David et al., 1998). In this section, the relationship between available mineral nutrients
and active microbial community composition in the growing media during the incubation period
was assessed through principal component analysis (PCA) and redundancy analysis (RDA). PCA
was used to assess the relationships between the active microbial community composition and the
mineral nutrients in the different media combinations (Figure 2a). The exact content of mineralized
nutrients in all the media treatments (A1-A5 and B1-B5) are shown in the Supplementary Table
S4. Output from the PCA analysis indicated that the growing media amendments were segregated
into distinct quadrants of the biplot based on the composition of the microbial groups and the
mineral nutrients. This segregation accounted for 88.4% of the total variability observed in the data.
Aluminum (Al) content was significantly higher (p<0.05) in treatments A2, A3, A4, B2 and B5
than the other treatments (Figure 2a & b). Treatments A2, A3, A4, B2 and B4 had a significantly
higher content of iron (Fe) compared to the other treatments (Figure 2a & b). Overall, treatments
A2 and B2 showed higher pH, protozoa, F/B ratio, and Fe. Moreover, protozoa had a moderate
linear relationship with Al and pH (Figure 2a & b).
Correlations between the various nutrients and microbial groups were assessed to confirm their
relationships. Copper (Cu) was significantly higher (p<0.0001) in the treatments A4 and B4 (Table
1). Copper and zinc (Zn) did not show a strong correlation with fungi and G- bacteria (Figure 2c).
Total bacterial (G+&G-), as well as the total bacterial and fungi (G+&G-&F), Boron (B),

95
Manganese (Mn), and total microbial mass were located in Quadrant 3 (Figure 2a). The dataset
also showed that treatments A5 and B5 had higher B and Mn contents (Figure 2d). A moderate but
significant correlation was observed between total microbial mass and B (r=0.586, p<0.0001),
between G+G- and B (r=0.394; p=0.012), as well as G+&G-&F and B (r=0.526, p<0.05) (Table 1).
Similarly, Mn was moderately correlated with total microbial mass (r=0.636, p<0.0001) but
slightly with G+G- (r=0.350, p=0.027), and G+&G-&F (r=0.367, p=0.020).
Table 1. Pearson's Correlation coefficients for microbial populations and the minerals that were
found to be significant in different quadrants of the RDA plot.
Quadrant Variables Aluminum pH Variables Iron
1 Protozoa 0.35 (0.028) 0.50 (0.001) F/B ratio 0.17 (0.029)
Copper
2 G- 0.309 (0.052)
Boron Manganese
3 G+&G- 0.39 (0.012) 0.35 (0.027)
G+&G-&F 0.53 (< 0.05) 0.37 (0.020)
Total microbial mass 0.59 (< 0.0001) 0.64 (< 0.0001)
Eukaryotes G+/G- G+
4 Phosphorus 0.79 (< 0.0001) 0.87 (< 0.0001)
Chloride 0.45 (0.004) 0.91 (< 0.0001) 0.91 (< 0.0001)
Sodium 0.39 (0.013) 0.87 (< 0.0001) 0.93 (< 0.0001)
Nitrogen 0.40 (0.011) 0.89 (< 0.0001) 0.90 (< 0.0001)
Potassium 0.40 (0.011) 0.76 (< 0.0001) 0.89 (< 0.0001)
Conductivity 0.44 (0.004) 0.84 (< 0.0001) 0.91 (< 0.0001)

96
Sulphate 0.55 (< 0.05) 0.88 (< 0.0001) 0.88 (< 0.0001)
Nitrate-N 0.66 (< 0.0001) 0.72 (< 0.0001)
Magnesium 0.44 (0.005) 0.89 (< 0.0001) 0.90 (< 0.0001)
Calcium 0.41 (0.008) 0.86 (< 0.0001) 0.87 (< 0.0001)
Value are correlation values (p-value), with a significance level alpha=0.05. The other components were not shown if
they were not significantly correlated.
High correlation of nitrogen content with G+ (r=0.90) and G+/G- (r=0.89) (Table 1), which might
be due to N fixers in the media. Same, we found the high correlation of SO42- and G+ (r=0.88) and
G+/G- (r=0.88). From Reid and Wong fact sheet (2005), Thiobacillus bacteria can covert sulfides
into sulfates. These bacteria exist in the media might lead the high correlation between sulphate
and bacteria. G+ had high correlation with P, Cl, Na, K, NO3-, Mg, and Ca, those nutrients are
essential for later plant growth. G+ had bad been proved that it could increase more than other
taxonomic microbial groups on plant growth because of its greater ability on root exudates utilizing
(Li et al., 2007). Even F/B ratio had significantly (p=0.027) weak correlation with Fe, F/B ratio
was closed to A2, B2, A3, and B3 treatments on the biplot (Figure 2A). In Li et al. (2017)
experiment, they found the plant growth significantly shifted the F/B ratio.
Treatments A1 and B1 were in quadrant 4 and had higher contents of minerals among the group
(Table 2). All quadrant 4 minerals had significantly (p<0.001) stronger linear relationship with G+
bacteria and G+/G- ratio. However, the eukaryotes had a moderate correlation with chlorine (Cl-),
sodium (Na), nitrogen (N), potassium (K), conductivity, sulphur (S), magnesium (Mg) and calcium
(Ca).The significantly (p<0.0001) high P correlation with G+ and G+/G- in the mixed medium was
found in Table 1.
The highest electric conductivity was observed in treatments A1, B1, A2 and B2 (Table 2), and
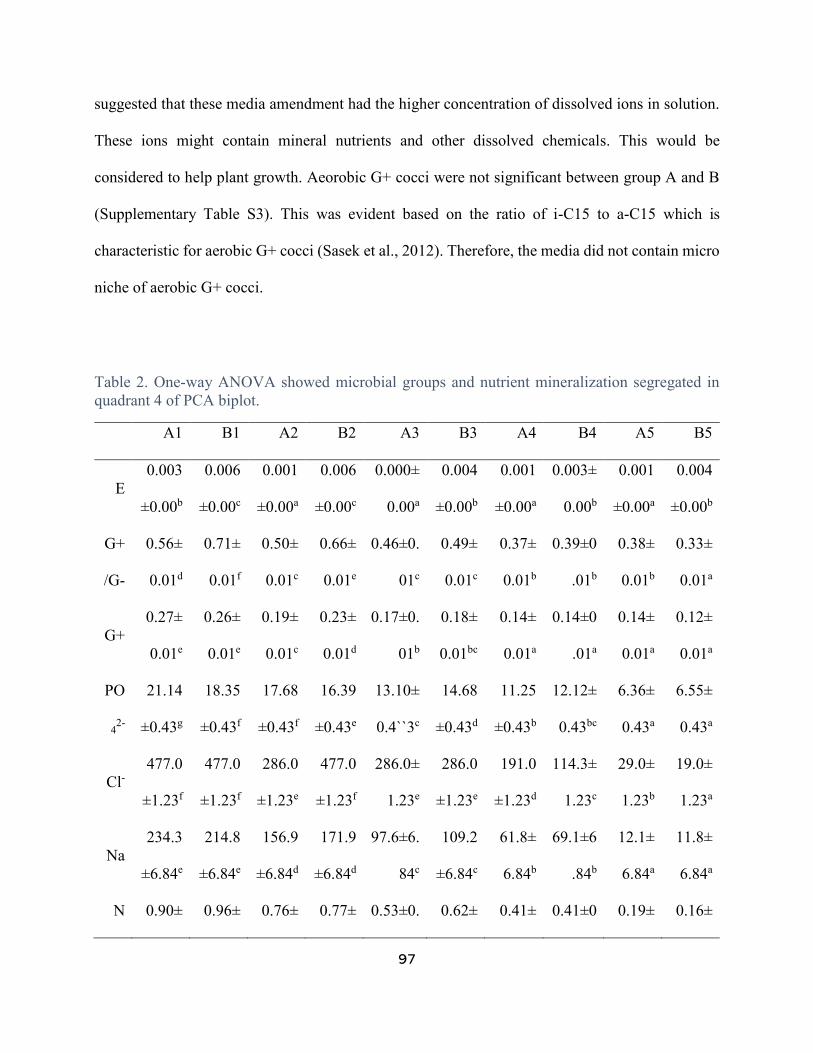
97
suggested that these media amendment had the higher concentration of dissolved ions in solution.
These ions might contain mineral nutrients and other dissolved chemicals. This would be
considered to help plant growth. Aeorobic G+ cocci were not significant between group A and B
(Supplementary Table S3). This was evident based on the ratio of i-C15 to a-C15 which is
characteristic for aerobic G+ cocci (Sasek et al., 2012). Therefore, the media did not contain micro
niche of aerobic G+ cocci.
Table 2. One-way ANOVA showed microbial groups and nutrient mineralization segregated in
quadrant 4 of PCA biplot.
A1 B1 A2 B2 A3 B3 A4 B4 A5 B5
E
0.003
±0.00b
0.006
±0.00c
0.001
±0.00a
0.006
±0.00c
0.000±
0.00a
0.004
±0.00b
0.001
±0.00a
0.003±
0.00b
0.001
±0.00a
0.004
±0.00b
G+
/G-
0.56±
0.01d
0.71±
0.01f
0.50±
0.01c
0.66±
0.01e
0.46±0.
01c
0.49±
0.01c
0.37±
0.01b
0.39±0
.01b
0.38±
0.01b
0.33±
0.01a
G+
0.27±
0.01e
0.26±
0.01e
0.19±
0.01c
0.23±
0.01d
0.17±0.
01b
0.18±
0.01bc
0.14±
0.01a
0.14±0
.01a
0.14±
0.01a
0.12±
0.01a
PO
42-
21.14
±0.43g
18.35
±0.43f
17.68
±0.43f
16.39
±0.43e
13.10±
0.4``3c
14.68
±0.43d
11.25
±0.43b
12.12±
0.43bc
6.36±
0.43a
6.55±
0.43a
Cl- 477.0
±1.23f
477.0
±1.23f
286.0
±1.23e
477.0
±1.23f
286.0±
1.23e
286.0
±1.23e
191.0
±1.23d
114.3±
1.23c
29.0±
1.23b
19.0±
1.23a
Na
234.3
±6.84e
214.8
±6.84e
156.9
±6.84d
171.9
±6.84d
97.6±6.
84c
109.2
±6.84c
61.8±
6.84b
69.1±6
.84b
12.1±
6.84a
11.8±
6.84a
N 0.90± 0.96± 0.76± 0.77± 0.53±0. 0.62± 0.41± 0.41±0 0.19± 0.16±

98
0.01f 0.01g 0.01e 0.01e 01c 0.01d 0.01b .01b 0.01a 0.01a
K
407.0
±4.38g
322.7
±4.38f
244.1
±4.38d
291.7
±4.38e
198.0±
4.38b
216.9
±4.38c
216.8
±4.38c
213.7±
4.38c
154.9
±4.38a
153.5
±4.38a
EC
3.37±
0.21e
3.46±
0.21e
2.08±
0.2cd
2.46±
0.2d
1.43±0.
2b
1.62±
0.21bc
1.12±
0.21ab
1.06±0
.21ab
0.58±
0.21a
0.54±
0.2a
SO
42-
231.0
±4.13e
326.8
±4.13f
137.2
±4.13c
190.0
±4.13d
119.0±
4.13b
140.2
±4.13c
122.5
±4.13b
119.0±
4.13b
30.4±
4.13a
39.8±
4.13a
NO
32-
2.60±
0.15fg
2.23±
0.15f
2.88±
0.15g
1.57±
0.15e
1.12±0.
15cd
1.25±
0.15de
0.77±
0.15abc
0.86±0
.15bcd
0.36±
0.15a
0.48±
0.15ab
Mg
55.74
±0.35g
57.30
±0.35h
41.77
±0.35e
52.03
±0.35f
30.42±
0.35c
34.70
±0.35d
25.13
±0.35b
25.71±
0.35b
3.46±
0.35a
4.22±
0.35a
Ca
82.08
±0.25i
92.35
±0.25j
67.89
±0.25
g
70.73
±0.25h
49.62±
0.25d
59.10
±0.25f
47.57
±0.25c
50.76±
0.25e
16.18
±0.25b
15.28
±0.25
a
Values are means ± standard errors. Mean values in each column followed by the same letter are not significantly
different at (at LSD α = 0.05, n = 4 per experimental replicate). G+, gram-positive; G-, gram-negative; EC, electronic
conductivity; A1, 80% vermicast+20% sawdust; A2, 60% vermicast+40% sawdust; A3, 40% vermicast+60% sawdust;
A4, 20% vermicast+80% sawdust; and A5, sawdust alone (control). The corresponding treatments B1-B5 contained T.
viride. The unit of microbial groups is ratio to total microbial mass, and the unit of total microbial mass is μg/mL.
Units of all minerals were ppm, except N was %, and electronic conductivity was nmol.
In the present study, the lipids were extracted by LC-MS (David et al., 1998, Pham et al 2019).
Plasmalogens were found in phosphatidylcholine (PC) or phosphatidylethanolamine (PE),
indicating the presence of archaea in the media. (Supplementary Table S1). Figure 3a showed the
segregation of the media inoculated with Trichoderma based on RDA analysis. This segregation

99
accounted for approximately 73.8% of the total variability presented in the data due to the
treatments. All treatments with and without Trichoderma were separated into two parts.

100

101

102
Figure 3. (A–E). Variation in Biomarkers used to assess microniche or physiological status of the
vermicast-Trichoderma-sawdust mixed media during December 2018 to February 2019 incubation
period. The observed lipids and media amendments were done under control environmental (lab)
conditions. (A) Redundancy analysis (RDA) biplot showing relationships between observed lipid
biomarkers and media amendments. One-way ANOVA showing lipids segregated in different
quadrants (Q) of the biplot following redundancy analysis as followed: (B) quadrants 1 (Q1), (C)
Q2, (D) Q3, and (E) Q4. Means in the same row accompanied by different superscripts are
significantly different at LSD α = 0.05, n = 4 per experimental replicate. CL, cardiolipin; Cer,
Ceramide; DG, diglyceride; Hex1Cer, monohexosylceramide; PE(e), plasmanyl
phosphatidylethanolamine; PE(p), plasmalogen phosphatidylethanolamine; PG,
phosphatidylglycerol; SPH, sphinganine; SM, sphingomyelin; SiE, phytosterol; StE, beta
sitosterols; ZyE, zymosterols; A1, 80% vermicast+20% sawdust; A2, 60% vermicast+40%
sawdust; A3, 40% vermicast+60% sawdust; A4, 20% vermicast+80% sawdust; and A5, sawdust
alone (control). The corresponding treatments B1-B5 contained T. viride.
We observed that zymosterols (ZyE) and beta sitosterols (StE) decreased with an increase in the
proportion of sawdust (Figure 3c). Overall, Group B showed higher ZyE and StE than Group A.
These sterols are used to detect yeasts, protozoans, fungi and microalgae in the media (Monreal &
Schnitzer, 2013; Volkman, 2003). Sphinganine (SPH) was also observed to be higher in Group B
than in Group A. This means that Group B based media had higher redox potential (Figure 3a).
Ether lipids as represented by plasmalogen phosphatidylethanolamine [PE (p)] and plasmanyl
phosphatidylethanolamine [PE (e)] indicating the presence of archaea in the mix media (Sasek et
al., 2012). Both PE (p)/PLFA and PE (e)/PLFA had a higher ratio in Group B, which means Group
B contained more Clostridia and methanogenic Archae than Group A (Figure 3c). Furthermore,
microbial membrane phospholipids can be used to demonstrate the physiological or nutritional
status of the media or soil (Green & Scow, 2000; Nickels et al., 1979). For example, the ratio of
cardiolipin (CL) to phosphatidylglycerol (PG) is suggestive of microniche with suboptimal growth
conditions in the media (Sasek et al., 2012; Guckert et al., 1986). As such, the high (greater than 1)
CL to PG ratio observed in A4, A5 and B5 indicate these media mixes appears to have elevated
microniches with suboptimal growth conditions (Figure 3b). Group B had higher amount of
sphingolipids and PG than Group A (Figure 3d). Highuptake of growing medium Na in roots can

103
be a source of endogenous Na that forms adduct with PG (Johanson & Cheeseman, 1983). In this
study, we found that treatments B1 and B3 contained higher amounts of Na and PG compared to
all other treatments (Figures 1a and 2a). Lipids can be used as indicators of microniche or
physiological status of the soil and can enhance the quality of the media leading to enhancement
or reduction of the ability to promote crop growth. Therefore, in this section, we concluded that
microbes appear in growing media can influence the nutrient status, especial majority content is
G+, which had high correlation with necessary nutrients for plants, such as P, Cl, Na, K, NO3-, Mg,
and Ca.
4.3.3 Temporal Changes in Microbial Community Composition
All the 10 treatments (A1-A5 and B1-B5) were sampled every 30 days to evaluate the incubation
effect on media active microbial compositions as presented in Table 3. For the 80% vermicast-20%
sawdust (A1) treatment, one-way ANOVA test suggested that after 30 days G+ (p=0.004), as well
as the sum of G+, G-, and fungi (p=0.042) were significantly higher than those media sampled
before 30 days. The bacterial content of A1 to A4, B2 and B5 increased after 30 days incubation
(Table 3). In Lanza et al. (2016) study, the incubation of different media, soil, pyrolysis char, and
hydrothermal carbonisation char, generated an increased in the abundance of all microbial taxa. In
contrast, the content of A5, B1, B3 and B4 decreased after 30 days incubation consistent with the
findings reported by Chen et al. (2016). Furthermore, we observed the content of the bacterial
group was significantly (p=0.009) higher in the growing media incubated for less than 30 days.
Overall, we found that the third sampling was significantly higher than the others for the sum of
bacteria and fungi. For the sum of bacteria, the first two samplings were higher. However, for the

104
same combination of treatments with T. viride, none of the microbial groups showed any difference.
For the A2 and A3 treatments, four samples had significant differences on G+ (p=0.002) G+&G-
(p=0.01), G- (p=0.005), G+&G-&F (p=0.014). So, the treatments A2 and A3 were similar to each
other in terms of microbial groups. The fourth sampling was significantly higher than the other
sampling times for the G+ group. After 60 days’ incubation, the amount of all the bacteria groups
was lower than before. The total bacteria and fungi percentages were higher in the first sampling
time than the fourth sampling time.

105
Table 3. Active microbial community composition in each incubated mixed growing media.
Mean (%)
Treatment G+ E G+G- G+, G-, F G- F P
A1-1 19±0.9 0.4±0.06 42±0.8 2±0.3 35±0.6 1±0.2 0.7±0.05
A1-2 18±1.1 0.3±0.15 44±1.3 1±0.2 36±0.3 1±0.2 0.4±0.13
A1-3 24±2.2 1.2±0.86 33±4.0 5±1.5 34±1.5 2±1.3 1.0±0.24
A1-4 29±2.6 0.3±0.02 30±3.3 4±0.7 35±0.4 1±0.2 0.7±0.09
A2-1 24±3.4 0.2±0.19 34±4.3 4±0.9 34±0.8 3±0.7 1.3±0.22
A2-2 18±1.4 0.0±0.00 40±3.1 2±0.4 38±0.4 2±0.3 1.1±0.78
A2-3 20±1.9 0.3±0.12 39±2.4 3±0.6 36±0.4 1±0.3 0.9±0.16
A2-4 33±1.6 0.6±0.20 24±1.6 5±0.2 34±0.6 2±0.3 1.5±0.02
A3-1 19±0.9 0.0±0.00 39±1.1 3±0.2 34±0.5 4±0.3 0.7±0.25
A3-2 15±0.9 0.2±0.17 45±1.1 1±0.2 38±0.4 1±0.2 0.3±0.18
A3-3 16±0.5 0.2±0.13 45±0.6 1±0.2 36±0.2 1±0.1 1.0±0.19
A3-4 26±2.8 0.0±0.00 29±4.4 4±0.9 36±0.4 3±0.9 1.4±0.22
A4-1 13±0.5 0.5±0.05 48±0.6 0±0.1 37±0.2 1±0.2 0.5±0.07
A4-2 13±0.5 0.3±0.04 48±0.7 1±0.2 37±0.1 0±0.2 0.5±0.07
A4-3 17±1.9 0.1±0.09 42±2.4 2±0.4 37±0.5 2±0.2 1.2±0.43

106
A4-4 15±0.4 0.1±0.08 45±0.6 1±0.1 37±0.1 1±0.1 0.7±0.09
A5-1 14±1.0 0.1±0.05 47±1.0 1±0.2 36±0.5 2±0.3 0.5±0.11
A5-2 18±3.1 1.4±1.30 39±6.5 4±2.5 35±2.4 3±2.0 0.4±0.14
A5-3 14±0.5 0.2±0.08 46±1.2 1±0.3 37±0.4 2±0.6 0.8±0.14
A5-4 13±0.3 0.1±0.08 48±0.4 1±0.1 37±0.1 1±0.2 0.7±0.06
B1-1 21±2.5 0.0±0.00 37±2.7 3±0.6 36±0.9 2±0.3 1.5±0.29
B1-2 30±3.5 6.7±5.58 27±2.8 4±1.6 28±4.2 3±0.9 0.6±0.32
B1-3 24±2.0 0.6±0.08 34±2.6 4±0.6 35±0.5 1±0.3 1.1±0.11
B1-4 25±0.7 0.7±0.04 33±0.6 4±0.2 35±0.4 1±0.1 1.2±0.11
B2-1 29±2.1 0.3±0.29 25±0.9 6±0.3 33±1.9 5±0.3 2.2±0.42
B2-2 23±5.2 0.8±0.46 35±6.5 3±0.9 35±1.3 2±0.6 1.6±0.74
B2-3 21±1.7 0.2±0.15 38±1.9 3±0.5 36±0.5 1±0.2 1.2±0.18
B2-4 24±1.0 0.5±0.16 32±1.3 4±0.3 36±0.4 2±0.4 1.2±0.19
B3-1 12±0.5 0.0±0.00 49±0.7 1±0.1 37±0.2 1±0.2 0.5±0.17
B3-2 16±1.7 0.2±0.12 41±3.9 2±0.7 37±0.6 2±0.5 1.3±0.66
B3-3 18±2.1 0.4±0.12 41±3.1 2±0.8 36±0.4 1±0.3 1.0±0.09
B3-4 19±1.0 0.4±0.17 39±1.6 3±0.4 36±0.4 2±0.3 1.1±0.26
B4-1 14±2.8 0.0±0.00 44±3.3 1±0.4 37±0.4 2±1.0 0.5±0.23

107
B4-2 14±0.6 0.7±0.41 43±2.0 4±1.6 35±1.4 3±1.1 0.6±0.06
B4-3 14±0.8 0.4±0.13 44±1.3 2±0.4 37±0.6 2±0.4 0.7±0.08
B4-4 16±1.1 0.2±0.10 42±2.4 2±0.5 37±0.4 2±0.5 1.2±0.46
B5-1 22±2.6 0.4±0.04 42±2.0 1±0.5 33±1.1 1±0.1 0.6±0.05
B5-2 12±0.5 0.5±0.12 47±1.3 2±0.6 36±0.4 2±0.4 0.5±0.09
B5-3 12±0.3 0.2±0.08 48±0.5 1±0.2 37±0.2 1±0.2 0.5±0.03
B5-4 13±0.6 0.1±0.06 47±1.1 1±0.3 37±0.4 2±0.4 0.6±0.16
Values are means ± standard errors. G+, gram-positive bacteria; G-, gram-negative bacteria; F, fungi; P, protozoa; E,
Eukaryotes. A1, 80% vermicast+20% sawdust; A2, 60% vermicast+40% sawdust; A3, 40% vermicast+60% sawdust;
A4, 20% vermicast+80% sawdust; and A5, sawdust alone (control). The corresponding treatments B1-B5 contained T.
viride. Treatment-1, first time sampling of treatment; Treatment-2, second time sampling of treatment; Treatment-3,
third time sampling of treatment; Treatment-4, forth time sampling of treatment. Units are ug/mL.
For the B2 treatment, the first sampling media had a significantly higher content of fungi (p<0.001)
and the sum of bacteria and fungi (p=0.006). For the B3 treatment, only the G+ group was
significantly lower at the first sampling (p=0.025). In the 20% vermicast+80% sawdust (A4)
treatment, the sum of bacteria and fungi was higher after 60 days (Table 3). There was a significant
(p<0.05) increase in the inoculated bacterial count (G+G-) in the mixed media after incubation and
reached its maximum level between 45 and 60 days consistent with previous reports in the literature
(Kaushik et al., 2008). Moreover, for the sawdust alone treatment (A5), none of the microbial
groups varied throughout the incubation period. For the B5 treatment, even the first sample media
had significantly higher amounts of G+ and eukaryotes, and the media sampled at the three
subsequent times had more G- and sum of bacteria (G+G-). For the fourth sampling time, the

108
mineral nutrients were significantly different for Al (p<0.001), Fe (p<0.001), Mn (p=0.012), and
Zn (p<0.001) across all treatments. Between 60 and 90 days after incubation, there was a decline
in the bacterial count (G+G-). This is consistent with the work of Kaushik et al. (2008), who
reported that aged vermicompost decreased the active microbial population between 60- and 70-
days incubation. The decreased microbial activity in the aged vermicast perhaps occur due to
diminution in the available carbon in the media substrate, lower microbial population, and nutrient
status (Tiwari et al., 1993; Parle, 1963). We found N had high correlation with G+G- bacteria, so
the reduction in total bacteria population appears to be associated with the decreased N content
(Table 1). With the passage of time, the growing media composition changes and the substrate
becomes less suitable for micro-organism as an energy substrate thus decreasing the activity of
nitrogen fixing bacteria (Kaushik et al., 2008). We noted that previous reports in the literature
suggest that 45–60 days incubation at 28 ℃ is appropriate to induce beneficial physical and
chemical properties of vermicompost (Alikhani et al., 2017), which differed from our findings.
Temporal changes in microbial community composition in the vermicast-sawdust mixed media
suggested that incubation for 0-30 days gives higher microbial community composition, which
means no incubation for these media combination showed superior microbial compositions and
community structure.
Sequence-based approaches to study microbiomes, such as V6-V8 16S rRNA gene (16S), V4 18S
rRNA gene (18S), fungal ITS2 region (ITS) sequencing and metagenomics, are uncovering
associations between microbial taxa and a myriad of factors (Comeau et al., 2017). The PLFA data
confirmed the presence of active microbial populations in the mixed media, but the exact species
were not determined. Therefore, further study on DNA tests of the mixed media is in progress to
assess the specific microbial populations and their functionality on plant growth.

109
4.4 CONCLUSIONS
The results obtained from the present study demonstrate that the addition of Trichoderma was not
significantly beneficial in enhancing the microbial activities compared to growing media without
Trichoderma viride. The mineral nutrients released in the mixed media had a high correlation
(r>0.7) with the active microbial groups present. We found six main microbial groups present in
the sawdust-vermicast based media as follows: G+, G-, G+G-, fungi, protozoa, archaea and
eukaryotes. G+, G- as well as the total of G+ and G- bacteria contributed 18.9%, 35.7% and 39.8%,
respectively, to the overall total microbial population observed in the media. Treatments A2 and
B2 (60% vermicast-40% sawdust, without and with T. viride) showed higher pH, Protozoa, F/B
ratio, and Fe. We found that treatments B1 and B3 (80% vermicast-20% sawdust and 40%
vermicast-60%sawdust, both with T. viride) contained higher amounts of Na and PG than the other
treatments. The mineralized nutrients (e.g. chloride, sodium, nitrogen, potassium, sulphate,
magnesium, and calcium) in the mixed growing media is associated with increased active microbial
community composition (eukaryotes, G+, and the ratio of G+/G-). Additionally, the vermicast-
sawdust in the ratio of 40:60 and 60:40 had superior effects on the microbial composition under
the conditions of the present study. After 30 days (i.e. sampling times 3 and 4), the sum of bacteria
and fungi (p=0.042) were significantly higher than those media sampled before 30 days (i.e.
sampling times 1 and 2). On the contrary, the content of the bacterial group was significantly
(p=0.009) higher in the growing media incubated for less than 30 days. For the sum of bacteria, the
first two samplings time were higher. The decreased microbial activity in the aged mixed media
appears to be related to diminution in the available carbon in the substrate and lower microbial
population and nutrient status. Overall, no incubation of the sawdust vermicast based media
appears to be more beneficial in supporting a superior active microbial composition. For this

110
project, the ratio of 40:60 and 60:40 vermicast-sawdust without incubation would be suggested as
superior in terms of improved active microbial composition, health status and nutrient
mineralization for plant growth.
4.5 REFERENCES
Abbey, L., & Appah, P. (2016). Pot-grown Swiss chard and kale responses to variable rate of
manure compost in mycorrhizal fungi inoculated medium. In III International Symposium on
Organic Greenhouse Horticulture 1164 (pp. 241-248).
Alenius, H., Pakarinen, J., Saris, O., Andersson, M. A., Leino, M., Sirola, K., . . . Wolff, H. (2009).
Contrasting immunological effects of two disparate dusts–preliminary observations.
International Archives of Allergy and Immunology, 149(1), 81-90.
Amir, S., Merlina, G., Pinelli, E., Winterton, P., Revel, J., & Hafidi, M. (2008). Microbial
community dynamics during composting of sewage sludge and straw studied through
phospholipid and neutral lipid analysis. Journal of Hazardous Materials, 159(2-3), 593-601.
AOAC. (2003). Metals and other elements in plants and pet foods: inductively coupled plasma
spectroscopic method, AOAC official method 968.08. Official methods of analysis. 17th ed.
Association of Official Analytical Chemists.
Batista, A., Vetter, W., & Luckas, B. (2001). Use of focused open vessel microwave-assisted
extraction as prelude for the determination of the fatty acid profile of fish–a comparison with
results obtained after liquid-liquid extraction according to bligh and dyer. European Food
Research and Technology, 212(3), 377-384.
Bligh, E. G., & Dyer, W. J. (1959). A rapid method of total lipid extraction and purification.
Canadian Journal of Biochemistry and Physiology, 37(8), 911-917.
Bossio, D. A., Girvan, M. S., Verchot, L., Bullimore, J., Borelli, T., Albrecht, A., Scow, K. M.,
Ball, A. S., Pretty, J. N., Osborn, A. M. (2005). Soil microbial community response to land
use change in an agricultural landscape of western kenya. Microbial Ecology, 49(1), 50-62.
Brockett, B. F., Prescott, C. E., & Grayston, S. J. (2012). Soil moisture is the major factor
influencing microbial community structure and enzyme activities across seven biogeoclimatic
zones in western Canada. Soil Biology and Biochemistry, 44(1), 9-20.
Caron, J., Morel, P., Rivière, L., & Guillemain, G. (2010). Identifying appropriate methodology to
diagnose aeration limitations with large peat and bark particles in growing media. Canadian
Journal of Soil Science, 90(3), 481-494.

111
Cavigelli, M. A., Robertson, G. P., & Klug, M. J. (1995). Fatty acid methyl ester (FAME) profiles
as measures of soil microbial community structure. The significance and regulation of soil
biodiversity, 99-113.
Chen, L., Luo, Y., Xu, J., Yu, Z., Zhang, K., & Brookes, P. C. (2016). Assessment of bacterial
communities and predictive functional profiling in soils subjected to short-term fumigation-
incubation. Microbial ecology, 72(1), 240-251.
Comeau, A. M., Douglas, G. M., & Langille, M. G. (2017). Microbiome helper: a custom and
streamlined workflow for microbiome research. MSystems, 2(1).
Duong, T. T., Penfold, C., & Marschner, P. (2012). Amending soils of different texture with six
compost types: Impact on soil nutrient availability, plant growth and nutrient uptake. Plant
and Soil, 354(1-2), 197-209.
Fiorentino, N., Ventorino, V., Woo, S. L., Pepe, O., De Rosa, A., Gioia, L., . . . Colla, G. (2018).
Trichoderma-based biostimulants modulate rhizosphere microbial populations and improve N
uptake efficiency, yield, and nutritional quality of leafy vegetables. Frontiers in Plant Science,
9, 743.
Gao, X., Zhang, Q., Meng, D., Isaac, G., Zhao, R., Fillmore, T. L., . . . Hu, Z. (2012). A reversed-
phase capillary ultra-performance liquid chromatography–mass spectrometry (UPLC-MS)
method for comprehensive top-down/bottom-up lipid profiling. Analytical and Bioanalytical
Chemistry, 402(9), 2923-2933.
Gharaibeh, A. A., & Voorhees, K. J. (1996). Characterization of lipid fatty acids in whole-cell
microorganisms using in situ supercritical fluid derivatization/extraction and gas
chromatography/mass spectrometry. Analytical Chemistry, 68(17), 2805-2810.
Gómez-Brandón, M. L. M., & Domínguez, J. (2010). Tracking down microbial communities via
fatty acids analysis: Analytical strategy for solid organic samples. Current Research,
Technology and Education Topics in Applied Microbiology and Microbial Biotechnology, 2,
1502-1508.
Green, C. T., & Scow, K. M. (2000). Analysis of phospholipid fatty acids (PLFA) to characterize
microbial communities in aquifers. Hydrogeology Journal, 8(1), 126-141.
Haack, S. K., Garchow, H., Odelson, D. A., Forney, L. J., & Klug, M. J. (1994). Accuracy,
reproducibility, and interpretation of fatty acid methyl ester profiles of model bacterial
communities. Applied and Environmental Microbiology, 60(7), 2483-2493.
He, Y., Ding, N., Shi, J., Wu, M., Liao, H., & Xu, J. (2013). Profiling of microbial PLFAs:
Implications for interspecific interactions due to intercropping which increase phosphorus
uptake in phosphorus limited acidic soils. Soil Biology and Biochemistry, 57, 625-634.

112
He, Y., Xu, J., Wang, H., & Wu, Y. (2007). Generalized models for prediction of
pentachlorophenol dissipation dynamics in soils. Environmental pollution, 147(2), 343-349.
He, Y., Xu, J., Lv, X., Ma, Z., Wu, J., & Shi, J. (2009). Does the depletion of pentachlorophenol
in root–soil interface follow a simple linear dependence on the distance to root surfaces? Soil
Biology and Biochemistry, 41(9), 1807-1813.
Hedrick, D. B., Peacock, A., & White, D. C. (2005). Interpretation of fatty acid profiles of soil
microorganisms. In Monitoring and Assessing Soil Bioremediation (pp. 251-259). Springer,
Berlin, Heidelberg.
Herman, D. J., Firestone, M. K., Nuccio, E., & Hodge, A. (2012). Interactions between an
arbuscular mycorrhizal fungus and a soil microbial community mediating litter decomposition.
FEMS Microbiology Ecology, 80(1), 236-247.
Hirsch, P. R., Mauchline, T. H., & Clark, I. M. (2010). Culture-independent molecular techniques
for soil microbial ecology. Soil Biology and Biochemistry, 42(6), 878-887.
Huygens, D., Schouppe, J., Roobroeck, D., Alvarez, M., Balocchi, O., Valenzuela, E., ... & Boeckx,
P. (2011). Drying–rewetting effects on N cycling in grassland soils of varying microbial
community composition and management intensity in south central Chile. Applied Soil
Ecology, 48(3), 270-279.
Iheshiulo, E. M., Abbey, L., & Asiedu, S. K. (2017). Response of kale to single-dose application
of k humate, dry vermicasts, and volcanic minerals. International Journal of Vegetable
Science, 23(2), 135-144.
Joergensen, R. G., & Potthoff, M. (2005). Microbial reaction in activity, biomass, and community
structure after long-term continuous mixing of a grassland soil. Soil Biology and
Biochemistry, 37(7), 1249-1258.
Johanson, J. G., & Cheeseman, J. M. (1983). Uptake and distribution of sodium and potassium by
corn seedlings: I. role of the mesocotyl inSodium exclusion'. Plant Physiology, 73(1), 153-
158.
Kaur, A., Chaudhary, A., Kaur, A., Choudhary, R., & Kaushik, R. (2005). Phospholipid fatty acid–
a bioindicator of environment monitoring and assessment in soil ecosystem. Current Science,
1103-1112.
Kaushik, P., Yadav, Y. K., Dilbaghi, N., & Garg, V. K. (2008). Enrichment of vermicomposts
prepared from cow dung spiked solid textile mill sludge using nitrogen fixing and phosphate
solubilizing bacteria. The Environmentalist, 28(3), 283-287.
Kong, A. Y., Scow, K. M., Córdova-Kreylos, A. L., Holmes, W. E., & Six, J. (2011). Microbial
community composition and carbon cycling within soil microenvironments of conventional,
low-input, and organic cropping systems. Soil Biology and Biochemistry, 43(1), 20-30.

113
Kujur, M., & Patel, A. K. (2014). PLFA Profiling of soil microbial community structure and
diversity in different dry tropical ecosystems of Jharkhand. Int. J. Curr. Microbiol. App.
Sci, 3(3), 556-575.
Lanza, G., Rebensburg, P., Kern, J., Lentzsch, P., & Wirth, S. (2016). Impact of chars and readily
available carbon on soil microbial respiration and microbial community composition in a
dynamic incubation experiment. Soil and Tillage Research, 164, 18-24.
Lasater, A. L., Carter, T., & Rice, C. (2017). Effects of drought conditions on microbial
communities in native rangelands.
Lazcano, C., & Domínguez, J. (2011). The use of vermicompost in sustainable agriculture: Impact
on plant growth and soil fertility. Soil Nutrients, 10(1-23), 187.
Leelavathi, M. S., Vani, L., & Reena, P. (2014). Antimicrobial activity of trichoderma harzianum
against bacteria and fungi. International Journal of Current Microbiology and Applied
Sciences, 3(1), 96-103.
Li, Z., Zhao, B., Hao, X., & Zhang, J. (2017). Effects of residue incorporation and plant growth on
soil labile organic carbon and microbial function and community composition under two soil
moisture levels. Environmental Science and Pollution Research, 24(23), 18849-18859.
Lichtfouse, E. (2010). Biodiversity, biofuels, agroforestry and conservation agriculture Springer
Science & Business Media.
Mach, R. L., Butterweck, A., Schindler, M., Messner, R., Herzog, P., & Kubicek, C. P. (1993).
Molecular regulation of formation of xylanase (XYN) I and II by trichoderma reesei.
Trichoderma Reesei Cellulases and Other Hydrolases: Enzyme Structures, Biochemistry,
Genetics and Applications.Foundation of Biotechnical and Industrial Fermentation Research,
Helsinki, Finland, 211-216.
Mahboub Khomami, A., Padasht, Ajili Lahiji, & Shirinfekr. (2019). The effect of sawdust
vermicompost extract on Syngonium podophyllum growth and nutrition. Journal of Plant
Nutrition, 42(4), 410-416.
Mathew, R. P., Feng, Y., Githinji, L., Ankumah, R., & Balkcom, K. S. (2012). Impact of no-tillage
and conventional tillage systems on soil microbial communities. Applied and Environmental
Soil Science.
Matuszewski, B. K., Constanzer, M. L., & Chavez-Eng, C. M. (2003). Strategies for the assessment
of matrix effect in quantitative bioanalytical methods based on HPLC− MS/MS. Analytical
Chemistry, 75(13), 3019-3030.
Monreal, C. M., & Schnitzer, M. (2013). The chemistry and biochemistry of organic components
in the soil solutions of wheat rhizospheres. Advances in agronomy, 121, 179-251.

114
Nickels, J. S., King, J. D., & White, D. C. (1979). Poly-β-hydroxybutyrate accumulation as a
measure of unbalanced growth of the estuarine detrital microbiota. Appl. Environ.
Microbiol., 37(3), 459-465.
Papatheodorou, E. M., Kordatos, H., Kouseras, T., Monokrousos, N., Menkissoglu-Spiroudi, U.,
Diamantopoulos, J., ... & Argyropoulou, M. D. (2012). Differential responses of structural and
functional aspects of soil microbes and nematodes to abiotic and biotic modifications of the
soil environment. Applied soil ecology, 61, 26-33.
Parle, J. N. (1963). A microbiological study of earthworm casts. Microbiology, 31(1), 13-22.
Paul, E. A. (2014). Soil microbiology, ecology and biochemistry Academic press.
Pham, T. H., Zaeem, M., Fillier, T. A., Nadeem, M., Vidal, N. P., Manful, C., Cheema, S., Cheema,
M., & Thomas, R. H. (2019). Targeting modified lipids during routine lipidomics analysis
using HILIC and C30 reverse phase liquid chromatography coupled to mass spectrometry.
Scientific Reports, 9(1), 5048.
Reid, G., & Wong, P. (2005). SOIL BACTERIA AND FUNGI — NEW SOUTH WALES. Retrieved
from http://www.soilquality.org.au/factsheets/soil-bacteria-and-fungi-nsw
Rojas-Downing, M. M., Nejadhashemi, A. P., Harrigan, T., & Woznicki, S. A. (2017). Climate
change and livestock: Impacts, adaptation, and mitigation. Climate Risk Management, 16, 145-
163.
Sasek, V., Glaser, J. A., & Baveye, P. (2012). The utilization of bioremediation to reduce soil
contamination: Problems and solutions. Springer Science & Business Media.
Sawan, O. M., & Eissa, A. M. (1995). Sawdust as an alternative to peat moss media for cucumber
seedlings production in greenhouses. Strategies for Market Oriented Greenhouse Production
434, 127-138.
Schindlbacher, A., Rodler, A., Kuffner, M., Kitzler, B., Sessitsch, A., & Zechmeister-Boltenstern,
S. (2011). Experimental warming effects on the microbial community of a temperate mountain
forest soil. Soil Biology and Biochemistry, 43(7), 1417-1425.
Sheng, M., Hamel, C., & Fernandez, M. R. (2012). Cropping practices modulate the impact of
glyphosate on arbuscular mycorrhizal fungi and rhizosphere bacteria in agroecosystems of the
semiarid prairie. Canadian Journal of Microbiology, 58(8), 990-1001.
Shoresh, M., Harman, G. E., & Mastouri, F. (2010). Induced systemic resistance and plant
responses to fungal biocontrol agents. Annual Review of Phytopathology, 48, 21-43.
Spring, S., Schulze, R., Overmann, J., & Schleifer, K. (2000). Identification and characterization
of ecologically significant prokaryotes in the sediment of freshwater lakes: Molecular and
cultivation studies. FEMS Microbiology Reviews, 24(5), 573-590.

115
Steger, K., Sjögren, Å M., Jarvis, Å, Jansson, J. K., & Sundh, I. (2007). Development of compost
maturity and actinobacteria populations during full‐scale composting of organic household
waste. Journal of Applied Microbiology, 103(2), 487-498.
Taguchi, R., & Ishikawa, M. (2010). Precise and global identification of phospholipid molecular
species by an orbitrap mass spectrometer and automated search engine lipid search. Journal
of Chromatography A, 1217(25), 4229-4239.
Tiwari, S. C., & Mishra, R. R. (1993). Fungal abundance and diversity in earthworm casts and in
uningested soil. Biology and Fertility of Soils, 16(2), 131-134.
Volkman, J. (2003). Sterols in microorganisms. Applied microbiology and Biotechnology, 60(5),
495-506.
Wang, X., Wang, X., Zhang, W., Shao, Y., Zou, X., Liu, T., ... & Fu, S. (2016). Invariant
community structure of soil bacteria in subtropical coniferous and broadleaved
forests. Scientific reports, 6(1), 1-11.
White, D. C., Flemming, C. A., Leung, K. T., & Macnaughton, S. J. (1998). In situ microbial
ecology for quantitative appraisal, monitoring, and risk assessment of pollution remediation
in soils, the subsurface, the rhizosphere and in biofilms. Journal of Microbiological Methods,
32(2), 93-105. doi:10.1016/S0167-7012(98)00017-7
White, D. C., Lytle, C., Peacock, A., Chang, Y. J., Almeida, J. S., Gan, Y.D., (n.d.). Rapid Lipid
Biomarker Analysis for Quantitative Assessment of Microbial Community Composition and
Activity [Presentation slides]. Retrieved from http://davidcwhite.org/ppt/Vandy01.ppt
White, D. C., Stair, J. O., & Ringelberg, D. B. (1996). Quantitative comparisons ofin situ microbial
biodiversity by signature biomarker analysis. Journal of Industrial Microbiology, 17(3-4),
185-196.
White, P. M., & Rice, C. W. (2009). Tillage effects on microbial and carbon dynamics during plant
residue decomposition. Soil Science Society of America Journal, 73(1), 138-145.
Wu, X., Wu, F., Zhou, X., Fu, X., Tao, Y., Xu, W., ... & Liu, S. (2016). Effects of intercropping
with potato onion on the growth of tomato and rhizosphere alkaline phosphatase genes
diversity. Frontiers in plant science, 7, 846.
Yao, H., He, Z. L., Wilson, M., & Campbell, C. D. (2000). Microbial biomass and community
structure in a sequence of soils with increasing fertility and changing land use. Microbial
Ecology, 40(3), 223-237.
Zaeem, M., Nadeem, M., Pham, T. H., Ashiq, W., Ali, W., Gilani, S. S. M., . . . Galagedara, L.
(2019). The potential of corn-soybean intercropping to improve the soil health status and
biomass production in cool climate boreal ecosystems. Scientific Reports, 9(1), 1-17.

116
Zelles, L. (1999). Fatty acid patterns of phospholipids and lipopolysaccharides in the
characterisation of microbial communities in soil: A review. Biology and Fertility of Soils,
29(2), 111-129.
Zhang, B., Zhao, R., Bi, B., & Han, F. (2017). Responses of soil microbial communities to robinia
pseudoacacia plantations of different ages in A loess area.
4.6 Supplementary Table S1. Phospholipid fatty acids biomarkers used to characterize the active microbial community
structure.
Shorthand
notation
Name Microbial
group
References
C11:0 Methyl undecanoate G+ (Alenius et al., 2009)
C12:0 Methyl dodecanoate E (Cavigelli et al., 1995; Zhang et
al., 2017)
C13:0 Methyl tridecanoate G+, G- (Amir et al., 2008; Alenius et
al., 2009)
(2-OH) C10:0 Methyl 2-hydroxydecanoate G- (Lasater et al., 2017)
C14:0 Methyl tetradenote G+ (Sheng et al., 2012)
i-C15:0 Methyl 13-mmethylteradenoate G+ (Wang et al., 2016; Zhang et al.,
2016)
a-C15:0 Methyl 12-methylteradenoate G+ (Wang et al., 2016; Zhang et al.,
2016)
C15:0 Methyl pentadecanoate G+ (Huygens et al., 2011;

117
Papatheodorou et al., 2012)
i-C16:0 Methyl 14-methyl
pentadecanoate
G+ (Wang et al., 2016; Zhang et al.,
2016)
(2-OH) C12:0 Methyl 2-hydroxydodecanoate G- (Lasater et al., 2017)
C16:0 Methyl Hexadecenoate G+, G- (Kujur and Patel, 2014; Wu et
al., 2015)
C16:1n7 Methyl cis-9-Hexadecenoate G+, G- (Brockett et al., 2012; Wang et
al., 2016)
C17:0;
C16:1n5
Methyl 15-
Methylhexadecanote;
Methyl 11(Z)-hexadecenoate
G+ (Wang et al., 2016; Zhang et al.,
2016)
C17:0 Methyl Heptadecanoate G+ (Huygens et al., 2011;
Papatheodorou et al., 2012)
(3-OH) C12:0 Methyl 3-hydroxydodecanoate G- (Spring et al., 2000; Kaur et al.,
2005)
∆17:0 Methyl cis-9.10-
Methylenehexadecanote
G- (Wang et al., 2016; Zhang et al.,
2016)
(2-OH) C14:0 Methyl 2-
Hydroxytetradecanoate
G- (White and Rice, 2009)

118
C18:0 Methyl Octadecanoate G+, G- (Brockett et al., 2012; Wu et al.,
2015)
C18:1n9 t Methyl octadecenoate(trans-9) G- (Moreno et al., 2017)
C18:1n9 c Methyl octadecenoate(cis-9) G+, G-, F (Brockett et al., 2012; Zhang et
al., 2016)
C18:2n6 Methyl octadecadienoate (all
cis-9,12)
F (Joergensen and Potthoff 2005;
eukaryote
White et al., 2009; Zhang et al.,
2016)
C19:0 Methyl nonadecanoate G+ (Gharaibeh and Voorhees,
1996)
(3-OH) C14:0 Methyl 3-
Hydroxytetradecanoate
G- (Papatheodorou et al., 2012)
∆C19:0 Methyl
methyleneoctadecanoate (all
cis-9,10)
G- (Wang et al., 2016)
C20:0 Methyl eicosenoate P (Schindlbacher et al., 2011)
(2-OH) C16:0 Methyl 2-
hydroxyhexadecanoate
G- (Sheng et al., 2012)
G+, gram-positive bacteria; G-, gram-negative bacteria; F, fungi; P, protozoa; E, Eukaryotes.

119
Table S2. The parameters used for Q-Exactive mass spectrometer.
General
Runtime 0-40 min
Polarity Positive/ Negative
Default charge 1
Full MS
Resolution 70,000
AGC target 1e5
Maximum IT 100 ms
Scan range 200 to 2000 m/z
dd-MS2/ dd-SIM
Resolution 35,000
AGC target 2e4
Maximum IT 100 ms
Loop count 20
Isolation window 1.0 m/z
(N)CE/ stepped nce 30, 35
dd Setting
Minimum AGC target 5.00e2

120
Table S3. A t-test for each microbial group in Group A and B.
Microbial Group A B P-Value
G+ 0.18±0.05 0.19±0.06 0.583
E 0.001±0.001 0.005±0.002 <0.001
G+G- 0.96±0.02 0.95±0.02 0.212
G- 0.36±0.01 0.36±0.01 0.754
G+, G-, F 0.99±0.004 0.99±0.006 0.094
F 0.01±0.006 0.02±0.005 0.012
P 0.01±0.004 0.01±0.003 0.713
G+/G- 0.45±0.08 0.52±0.15 0.120
F/B 0.01±0.004 0.02±0.005 <0.001
T 197.7±10 194.1±21 0.881
i /a C15 0.79±0.03 0.83±0.02 0.175
Unit is the ratio of each microbial group to total microbial population. G+, gram-positive bacteria; G-, gram-negative
bacteria; F, fungi; P, protozoa; E, Eukaryote; T, Total microbial mass; A, treatment without Trichoderma; B, treatment
with Trichoderma viride.

121
Table S4. The changes of aluminum, boron, copper, iron, manganese, and zinc contents as time
going by among 10 sample treatments.
Treatments Sampling
time points
Aluminum
(ppm)
Boron
(ppm)
Copper
(ppm)
Iron
(ppm)
Manganese
(ppm)
Zinc
(ppm)
A1 1 0.06 ND ND 0.06 0.17 0.03
2 0.1 ND ND 0.1 ND 0.03
3 0.18 ND ND 0.21 ND 0.05
4 0.3 ND ND 0.22 ND 0.05
A2 1 ND ND ND 0.05 0.29 0.03
2 0.1 ND ND 0.13 ND 0.04
3 0.23 ND 0.05 0.31 ND 0.06
4 0.28 ND 0.06 0.33 ND 0.07
A3 1 0.06 0.1 ND 0.07 0.24 0.03
2 0.1 ND ND 0.11 ND 0.03
3 0.26 ND ND 0.3 ND 0.07
4 0.22 ND 0.05 0.25 ND 0.06
A4 1 0.13 0.13 ND 0.12 0.16 0.05
2 0.15 0.11 ND 0.2 ND 0.04
3 0.23 0.13 0.08 0.38 ND 0.07
4 0.25 0.13 0.08 0.38 ND 0.07
A5 1 0.06 0.25 ND ND 0.2 0.07
2 0.06 0.22 ND ND 0.11 0.05
3 ND 0.23 0.05 0.06 0.12 0.06

122
4 0.06 0.23 0.06 0.06 0.14 0.07
B1 1 0.06 ND ND 0.06 0.21 0.03
2 0.1 ND ND 0.1 ND 0.04
3 0.15 ND ND 0.18 ND 0.05
4 0.14 ND ND 0.15 ND 0.05
B2 1 0.09 0.1 ND 0.09 0.3 0.04
2 0.1 ND ND 0.12 ND 0.05
3 0.27 ND 0.07 0.36 ND 0.07
4 0.21 ND 0.05 0.27 ND 0.06
B3 1 0.07 0.11 ND 0.06 0.28 0.04
2 0.1 ND ND 0.13 ND 0.04
3 0.21 ND 0.06 0.29 ND 0.05
4 0.2 ND 0.05 0.3 ND 0.05
B4 1 0.05 0.12 ND 0.08 0.16 0.03
2 0.19 0.12 0.06 0.28 ND 0.05
3 0.29 0.12 0.08 0.44 ND 0.06
4 0.27 0.13 0.09 0.42 ND 0.07
B5 1 ND 0.25 ND ND 0.21 0.05
2 ND 0.26 ND ND 0.15 0.05
3 ND 0.25 ND ND 0.14 0.05
4 ND 0.25 ND 0.06 0.15 0.06
ND, data was not detected; A1, 80% vermicast+20% sawdust; A2, 60% vermicast+40% sawdust; A3, 40%
vermicast+60% sawdust; A4, 20% vermicast+80% sawdust; and A5, sawdust alone (control). The corresponding
treatments B1-B5 contained T. viride.

123
CHAPTER 5 ACTIVE MICROBIAL COMPOSITION AND
MICROGREENS PLANT GROWTH RESPONSE TO VERMICAST-
SAWDUST MIXED MEDIA
5.0 ABSTRACT
Microgreens are tender young vegetables grown for their high nutritional values and functional
properties for human health benefit, but largely understudied. An experiment was performed to
compare the effects of two combinations of vermicast-sawdust mixed growing media (T1: 60%
vermicast+40% sawdust and T2: 40% vermicast+60% sawdust), and a control Promix-BX on
active microbial composition and the growth of three different microgreen plant species; namely,
kale (Brassica oleraceae var. sabellica), Swiss chard(Beta vulgaris subsp. Maritima), and Pak choi
(Brassica rapa subsp. chinensis). Comparatively total calcium, magnesium, sodium and sulphate
contents in T1 were higher than in T2 by 60%, 65%, 59% and 53% respectively. Similar
observations were made on total nitrogen (p<0.001), total potassium (p=0.004) and electric
conductivity (p=0.004). Overall, mineral nutrients content had significantly (p<0.05) highly
positive correlation (r<0.7) with active microbial composition in the mixed media. Combined data
for phospholipid fatty acids and mineral nutrients with plant growth showed that T1 significantly
(P<0.05) enhanced the physiological profile of kale, Swiss chard and Pak choi plants as compared
to T2 plants. Furthermore, T1 was confirmed to be better than T2 in a combined (treatments vs
plant species) plant growth indicators versus mineral nutrients and active microbial group analyses.
In conclusion, T1 mixed medium was the most efficacious for microgreen production.

124
5.1 INTRODUCTION
The global population is expected to increase by approximately 26% from 7.7 billion in mid-2019
to 9.7 billion by 2050 (UN DESA, 2019). The expected increase in global population will require
sustainable effort to meet food demand. However, food and nutrition security are faced with grave
challenges such as global climate change, increased soil degradation and pressure on farmlands.
To meet the ever-increasing global food demand, it is universally acknowledged that an important
area for investigation is growing media substrates and natural amendments. These investigations
can help improve and maintain soil quality, soil health and increase plant productivity per unit area.
Microgreens, frequently called vegetable confetti, are a novel class crops, defined as immature
greens harvested without roots from the tender seedlings of vegetables, herbs, grains, and wild
species (Xiao et al., 2012; Kyriacou et al., 2019). Some literature exhibited that microgreens
contain higher amounts of phytonutrients (ascorbic acid, b-carotene, a-tocopherol and
phylloquinone), vitamins, minerals (Ca, Mg, Fe, Mn, Zn, Se and Mo), and lower nitrate content
than their mature leaf counterparts (Xiao et al., 2012; Pinto et al., 2015; Kyriacou et al. 2016). The
test plants in this experiment were kale, Swiss chard, and Pak choi as they are widely grown for
microgreens and known to be rich in vitamins A, C, and K, essential lipids, carotenoids and mineral
nutrients (Di Noia, 2014; Pham et al., 2018).
Vermicast, compost and humates are not only used as organic amendments to growing media but
also, as supplements of synthetic chemical fertilizers. There are many advantages to these natural

125
amendments, which include low technology or cost input, enhanced beneficial microbial activities,
richness and diversity in nutrients and environmental friendliness (Duong et al., 2012; Abbey et al.,
2018). According to a report by Ramnarain et al. (2018), for pac choi (Brassica rapa var. chinensis)
growth, almost all soil quality parameters including mineral nutrients and soil structure were
increased following the application of vermicompost in a greenhouse. In a previous study, the
application of vermicast had a positive effect on the growth and yield of Swiss chard (Smith et al.,
2001). In a comparative controlled environment/soilless study, it was reported that plants treated
with dry vermicast recorded increased levels of plant tissue macro-and micro-nutrients more than
the potassium humate and the volcanic minerals amendments (Abbey et al., 2018). It was also
suggested that dry vermicast could be a potential target natural media amendment for the
biofortifying of kale plants. The amended media substrate for these studies was peat moss.
Farmers operating in controlled environment production systems usually use natural soilless
substrates. Such natural substrates are preferred because of their low cost, biodegradability and
overall good properties to support plant growth (Raviv et al., 2002; Caron et al., 2015). A typical
example is forestry and sawmill residue such as sawdust and bark which according to Bradley
(2007), are the most available source of biomass in Canada and many other countries. According
to Depardieu et al. (2016), sawdust-based growing medium can potentially be used as substitutes
to coconut fiber (coir) for soilless culture for strawberry production in Canada. However, despite
the good porosity and high saturated hydraulic conductivities, sawdust has low water retention
capacity (Depardieu et al., 2016). Additionally, sawdust may have negative effects on plant growth
due to salt and toxic compound accumulations, such as tannins, resins, and turpentine (Dorais et

126
al., 2006). There is also no specific research on the effects of sawdust as growing medium
substrates on plants grown and harvested as microgreens. the limited information on the proper
use of sawdust as growing medium substrates does not encourage its use for plant production in
the horticulture sector.
Based on previous literatures, we postulated that the addition of vermicast to heat-treated sawdust
can detoxify the sawdust, increase growing medium microbial activities and nutrition availability
and ultimately, and improve plant growth. A recent work by Lin et al. (unpublished) showed that
nutrients mineralization and active microbial composition were increased in growing media
comprising 40% vermicast+60% heat-treated sawdust or 60% vermicast+40% heat-treated sawdust.
Based on this recent study, we hypothesized that vermicast and heat-treated sawdust blend would
enhance active microbial activity and the growth and yield of kale, Swiss chard and pak choi
microgreens. Therefore, the objective of the present study was to compare the efficacy of two
different mixed proportions of vermicast-sawdust media to produce microgreens under greenhouse
conditions.
5.2 MATERIALS AND METHODS
A greenhouse experiment was carried out in the Department of Plant, Food and Environmental
Science, Faculty of Agriculture, Dalhousie University, Canada from October 2019 to February
2020.Vermicast (i.e. earthworm castings excreted by Red wiggler worms, Eisenia fetida) was
obtained from Pagonis Live Bait (ON, Canada); and thermally treated maple tree sawdust was

127
purchased from Thermal Wood Canada (NB, Canada). The seeds of Green Curled kalewere
purchased from Halifax Seeds (NS, Canada). Seeds of Pak choi and Swiss chard seeds were
purchased from West Coast Seeds (Ottawa, ON, Canada) for the study. The Promix-BX potting
medium with added Mycorrhizae fungi (Premier Horticulture Inc., PA, United States) was also
purchased from Halifax Seeds.
5.2.1 Growing Media Composition
The growing media treatments comprised of mixed proportions of vermicast and sawdust (w/w) as
follows 60% vermicast+40% sawdust (T1), 40% vermicast+60% sawdust (T2) and Promix-BX
alone (control); and three species of leafy vegetable plants as follows: kale, pak choi and Swiss
chard. The individual growing medium samples (200 g) were analyzed at 30-day intervals for
nitrate-N (NO3--N), phosphorus (P), potassium (K), calcium (Ca), magnesium (Mg), boron (B),
iron (Fe), manganese (Mn), copper (Cu), zinc (Zn), sodium (Na), chloride (Cl-), sulphate (SO42-),
aluminum (Al) and nitrogen (N). The samples were sent to Nova Scotia Department of Agriculture
Laboratory Services, Truro, NS, Canada for analyses using the AOAC-968.08 inductively coupled
plasma (ICP) spectrometer method (AOAC, 2003).The active microbial community composition
was also assessed at 30-day intervals using microbial phospholipid fatty acids (PLFA) according
to the modified method of Gómez-Brandón et al. (2010). Gas chromatography analyzed the fatty
acids as methyl esters with flame-ionization detection/ mass spectrometry (GC-FID/MS), and the
active microbial community structure in the individual media was determined by PLFA platform.
5.2.3 Raising and Transplanting of Seedlings
Seeds of kale, pak choi, and swiss chard were germinated in a 36 cell-tray containing Promix-BX,

128
with regular watering (every two-day). The trays were placed on a shelving with 120 V and 80
WLED lighting.28 days post germination, the seedlings were transplanted into 15.24 cm-diameter
plastic pots containing 1 kg of the individual mixed medium treatment. The heat-threated sawdust
was dry, so 1.5 L of distilled water was added to every 1-kg vermicast-sawdust mixed medium and
stirred with a wooden ladle. The pots were arranged on a galvanized-steel bench in the greenhouse.
Each growing medium treatment was made up of a total of 45 pots (i.e.3x3x5 factorial experiment;
3 plant species, 3 treatments, and5 replications per treatment). The potted plants were rearranged
randomly on the benches to offset any unpredictable environmental effects. Plant growing
temperatures in the greenhouse were set at 24°C and 16°C in the day and night, respectively. The
humidity was set at 75%. The supplementary lighting was supplied by high-pressure sodium lamps
(600 W HS2000) and NAH600.579 ballasts (P.L. Light Systems, ON, Canada).
5.2.4 Plant Growth Analysis
Plant height was measured from the tip of the leaf to the collar of the stem. Green leaf numbers
were counted at 35 days after transplanting (DAT). Stem diameter was measured at the middle
portion of the stem by Mastercraft digital calliper (Canadian Tire, NS, Canada). Leaf area was
measured using LI-3100 C leaf area meter (LI-COR Biosciences, NE, USA). The leaf fresh weights
were recorded at the final harvest using HR60 analytical balance (Data Weighing Systems, Inc.,
IL, USA). The leaves were dried at 65℃ for 48 hr using a mechanical convection oven (Cole-
Parmer Instrumental Co., Vernon Hills, IL). Leaf moisture (LM) content was estimated as:
𝐿𝑀 (%) = 100 × [𝑀𝑓 − 𝑀𝑑
𝑀𝑑]

129
Where Mf and Md are the fresh mass and the dry mass of the plant tissue, respectively.
5.2.5 Leaf Chlorophyll Indices
Leaf greenness as an estimator of leaf chlorophyll content was determined using a SPAD 502
Chlorophyll meter (Konica Minolta, Inc., IL, USA). Anthocyanin content index (ACI) of the leaves
was determined using Anthocyanin content meter (Opti-Sciences Inc., NH, USA). Chlorophyll
fluorescence indices are commonly usedto test plant photosynthesis efficiency and
ecophysiological performance, which was determined using a portable OS30p+ Chlorophyll
fluorometer (Opti-Sciences, Inc., NH, USA) before harvesting (Maxwell & Johnson, 2000). The
indices included maximum quantum efficiency of photosystem II photochemistry (𝐹𝑣/𝐹𝑚)
calculated as:
𝐹𝑣/𝐹𝑚 = (𝐹𝑚 − 𝐹0)/𝐹𝑚
𝐹𝑣/𝐹𝑂 = (𝐹𝑀 − 𝐹𝑂)/𝐹𝑂
Where 𝐹0 = 𝐹50μs , the fluorescence at 50 μs;𝐹𝑚 , maximal fluorescence intensity; Fv,variable
fluorescence indices.
5.2.6 Experimental Design and Statistical Analysis
The two factors were three levels of different growing media and three plant species, with 5
replications per treatment. Analyzed of variance (ANOVA) was performed using Minitab version
18.3 (Minitab Inc., PA, USA) to determine whether the treatments had any significant effects on
plant growth. Means were separated by Fisher’s least significant difference at α = 0.05when the

130
ANOVA indicated that significant differences exist between treatments at P≤0.05. Principal
component analysis was also performed to determine the association between the growing media
mineral nutrients and microbial community composition using the XLSTATS premium version
(Addinsoft Inc, PAR, France).
5.3 RESULTS AND DISCUSSION
In this part, we did the analysis of vermicast media as a standard to compare the mineral nutrients
in the three media we interested in. Physical factors of growing media and biological processes
either separately or in together can drive decomposition, although the innate characteristics (i.e.,
functional traits) of crop residues are important in controlling their decomposition rate in media
(Trinsoutrot et al., 2000, Jensen et al., 2005, Aulen et al., 2012). In the nutrient mineralization
experiment, the contents of Ca, Mg, P and Mn in the Promix-BX and the vermicast were higher
than T1 and T2 but the contents of K, Na in the T1 and T2 treatments were higher in the latter than
the former (Table 1A). The content of Ca and N were highest in the organic amendments (i.e.,
seafood waste compost, municipal solid waste compost, and vermicompost), while Mg and P were
the least. Comparatively, the vermicompost had the highest Ca content but the least P and K
contents (Abbey et al., 2018). Comparatively, Ca, K, Mg, P, Na, S, and Mn in T1 were higher than
in T2 by 60%, 24%, 65%, 23%, 59%, 53% and 21%, respectively.
Table 1A. Nutrients contents of the separate substrates and mixed media.
Treatment Ca K Mg P Na S Mn

131
(mg/l) (mg/l) (mg/l) (mg/l) (mg/l) (mg/l) (mg/l)
T1 137.99 330.19 99.34 22.49 177.78 266.02 0.29
T2 86.09 267.13 60.12 18.36 112.19 173.72 0.24
Promix-BX 1692.80 199.60 179.60 101.60 31.20 95.20 10.00
Vermicast 4718.40 83.60 485.60 37.60 28.80 182.00 12.00
T1, 60% vermicast + 40% sawdust; T2, 40% vermicast + 60% sawdust.
The contents of Al, B, Cu, Fe, and Zn in the Promix-BX and vermicast were higher than mixed
media treatments T1 and T2 (Table 1B). The pH of T1 and T2 were higher than the Promix-BX
and vermicast. The remaining mineral nutrients i.e. Al, B, Cu, Zn and Fe were higher in T2 than in
T1.
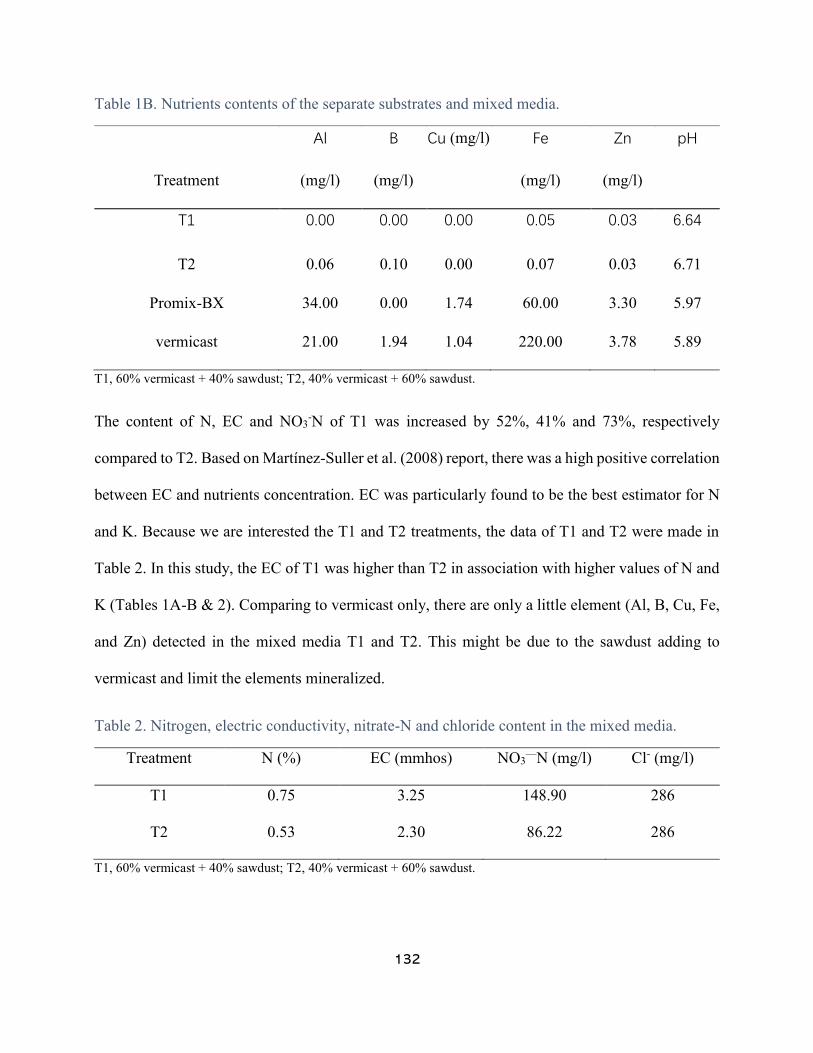
132
Table 1B. Nutrients contents of the separate substrates and mixed media.
Treatment
Al
(mg/l)
B
(mg/l)
Cu (mg/l) Fe
(mg/l)
Zn
(mg/l)
pH
T1 0.00 0.00 0.00 0.05 0.03 6.64
T2 0.06 0.10 0.00 0.07 0.03 6.71
Promix-BX 34.00 0.00 1.74 60.00 3.30 5.97
vermicast 21.00 1.94 1.04 220.00 3.78 5.89
T1, 60% vermicast + 40% sawdust; T2, 40% vermicast + 60% sawdust.
The content of N, EC and NO3-N of T1 was increased by 52%, 41% and 73%, respectively
compared to T2. Based on Martínez-Suller et al. (2008) report, there was a high positive correlation
between EC and nutrients concentration. EC was particularly found to be the best estimator for N
and K. Because we are interested the T1 and T2 treatments, the data of T1 and T2 were made in
Table 2. In this study, the EC of T1 was higher than T2 in association with higher values of N and
K (Tables 1A-B & 2). Comparing to vermicast only, there are only a little element (Al, B, Cu, Fe,
and Zn) detected in the mixed media T1 and T2. This might be due to the sawdust adding to
vermicast and limit the elements mineralized.
Table 2. Nitrogen, electric conductivity, nitrate-N and chloride content in the mixed media.
Treatment N (%) EC (mmhos) NO3—N (mg/l) Cl- (mg/l)
T1 0.75 3.25 148.90 286
T2 0.53 2.30 86.22 286
T1, 60% vermicast + 40% sawdust; T2, 40% vermicast + 60% sawdust.

133
The active microbial community diversity can be used as an important indicator of growing media
quality and health status (Kong et al., 2011). In this experiment, a total of 26 phospholipid fatty
acids (PLFAs) were detected and used as biomarkers to define the presence of active microbial
groups in the vermicast-sawdust mixed media i.e. T1 and T2 (Table 3).Six main microbial groups
in GC-FID analysis was confirmed as G+, G-, G+G-, fungi, protozoa, and eukaryotes(Table 3).
Total 37 PLFA’s were identified as depicted in Table 3, and they are used as biomarkers to assess
different active microbial groups in the growing media environment at the sampling time (Zaeem,
2018).

134
Table 3. Phospholipid fatty acids biomarkers used to characterize the active microbial community
structure.
Shorthand
notation
Name Microbial
group
References
C11:0 Methyl undecanoate G+ (Alenius et al., 2009)
C12:0 Methyl dodecanoate E (Cavigelli et al., 1995; Zhang et
al., 2017)
C13:0 Methyl tridecanoate G+, G- (Amir et al., 2008; Alenius et
al., 2009)
(2-OH) C10:0 Methyl 2-hydroxydecanoate G- (Lasater et al., 2017)
C14:0 Methyl tetradenote G+ (Sheng et al., 2012)
i-C15:0 Methyl 13-mmethylteradenoate G+ (Wang et al., 2016; Zhang et al.,
2016)
a-C15:0 Methyl 12-methylteradenoate G+ (Wang et al., 2016; Zhang et al.,
2016)
C15:0 Methyl pentadecanoate G+ (Huygens et al., 2011;
Papatheodorou et al., 2012)
i-C16:0 Methyl 14-methyl
pentadecanoate
G+ (Wang et al., 2016; Zhang et al.,
2016)
(2-OH) C12:0 Methyl 2-hydroxydodecanoate G- (Lasater et al., 2017)

135
C16:0 Methyl Hexadecenoate G+, G- (Kujur and Patel, 2014; Wu et
al., 2015)
C16:1n7 Methyl cis-9-Hexadecenoate G+, G- (Brockett et al., 2012; Wang et
al., 2016)
C17:0
C16:1n5
Methyl 15-
Methylhexadecanote;
Methyl 11(Z)-hexadecenoate
G+ (Wang et al., 2016; Zhang et al.,
2016)
C17:0 Methyl Heptadecanoate G+ (Huygens et al., 2011;
Papatheodorou et al., 2012)
(3-OH) C12:0 Methyl 3-hydroxydodecanoate G- (Spring et al., 2000; Kaur et al.,
2005)
∆17:0 Methyl cis-9.10-
Methylenehexadecanote
G- (Wang et al., 2016; Zhang et al.,
2016)
(2-OH) C14:0 Methyl 2-
Hydroxytetradecanoate
G- (White and Rice, 2009)
C18:0 Methyl Octadecanoate G+, G- (Brockett et al., 2012; Wu et al.,
2015)
C18:1n9 t Methyl octadecenoate(trans-9) G- (Moreno et al., 2017)
C18:1n9 c Methyl octadecenoate(cis-9) G+, G-, F (Brockett et al., 2012; Zhang et
al., 2016)

136
C18:2n6 Methyl octadecadienoate (all
cis-9,12)
F (Joergensen and Potthoff 2005;
White et al., 2009; Zhang et al.,
2016)
C19:0 Methyl nonadecanoate G+ (Gharaibeh and Voorhees,
1996)
(3-OH) C14:0 Methyl 3-
Hydroxytetradecanoate
G- (Papatheodorou et al., 2012)
∆C19:0 Methyl
methyleneoctadecanoate (all
cis-9,10)
G- (Wang et al., 2016)
C20:0 Methyl eicosenoate P (Schindlbacher et al., 2011)
(2-OH) C16:0 Methyl 2-
hydroxyhexadecanoate
G- (Sheng et al., 2012)
G+, gram-positive bacteria; G-, gram-negative bacteria; F, fungi; P, protozoa; E, Eukaryotes
Plant heights recorded for the three plant species i.e. kale, Swiss chard and pak choi were
significantly (P<0.05) higher in the T1 treatment than T2 (Table 4). The suitable multiple mean
comparison (MMC) method was used for those treatments, which showed significant effect (i.e.,
p-value is less than 0.05) for main effects and/or interaction effects. If the interaction effect was
significant, then 1) MMC would be done on the interactions, 2) The significance of lower-order
interactions would be ignored, and the main effects associated with the significant interaction effect

137
as well. In analysis, if there was a significant interaction, then the main effects would be ignored.
The interaction effect of mixed media treatments and plant species on plant height was highly
significant (p= 0.007). The height for plants grown in T1 might be due to the availability of
adequate amounts of essential plant nutrients and other growth factors when the vermicast content
of the medium was increased as compared to T2. The number of plant green leaves was higher for
plants grown in the Promix-BX alone (control) medium as compared to T1 and T2. The number of
leaves on T1 grown plants were more than five times higher than that for the T2 grown plants
(Table 4). These again can be attributed to the higher nutrients content and improved growing
medium properties following the application of higher amount of the vermicast.

138
Table 4. Effects of different mixed media on growth components of three different species of
microgreen plants.
Treatment*Crops Plant
height
Number of green
leaves
Fresh
weight
Dry
weight
Leaf area Stem
diameter
Control*pak choi 12.73b 7.2b 9.22b 1.19a 158.50a 6.43a
Control*Swiss chard 18.58a 11.4a 10.51a 0.92b 166.36a 5.90a
Control*kale 15.15b 8.2b 4.47c 0.80b 89.00b 4.04b
T1*kale 5.20c 4.2cd 0.54de 0.11c 13.12cde 1.84ef
T1*pak choi 3.65d 3.5de 0.71d 0.09c 15.13cd 2.49c
T1*Swiss chard 5.85c 4.9c 0.93d 0.09c 16.06c 2.39cd
T2*kale 2.33e 2.2f 0.07e 0.01c 1.58e 1.55f
T2*pak choi 2.06e 2.7ef 0.12e 0.02c 2.29e 2.01de
T2*Swiss chard 2.32e 1.75f 0.07e 0.01c 1.80de 1.45f
Means that do not share the same alphabetical letter in a column are significantly different.
Analysis of variance showed that the grown plants were non-significant (p=0.782) among mixed
media T1, T2 and the control (Promix-BX). Similarly, all the treatments did not have significant
(P>0.05) effect on leaf dry weight, but they were smaller than the control. However, Swiss chard

139
and pak choi leaf fresh weights, leaf area and stem diameter were significantly (P<0.05) increased
by T1 than T2 (Table 4). Pak choi and Swiss chard plant stem diameter were increased by T1 and
were significantly (p<0.05) higher than T2, and both T1 and T2 were lower than control.
The anthocyanin content index (ACI) of the Swiss chard plant leaves was higher than those of pak
choi and kale. The ACI of plants grown in the T1 medium was higher than their counterparts in the
T2 medium (Table 5). For the Fo value, only the Swiss chard showed that T1 was significantly
higher than T2 (Table 5). Conversely, Fm value of kale and Swiss chard plants was significantly
(P<0.05) different between T1 and T2.
Table 5. Mean Fm, Fv, Fo and ACI of kale, Swiss chard and pak choi plants as affected by
combined medium treatment and plant species.
Treatment*Crops FM Fv FO ACI
Control*pak choi 933.90a 768.50a 165.40ab 8.14a
Control*Swiss chard 888.71abc 705.00ab 183.71ab 4.63bc
Control*kale 944.90a 758.40a 186.50a 6.78a
T1*kale 862.11ab 686.40a 175.71ab 3.68c
T1*pak choi 861.66ab 690.41a 171.24ab 4.09bc
T1*Swiss chard 839.00abc 659.00ab 180.00a 4.45b
T2*kale 740.37c 584.53b 155.84b 1.82de

140
T2*pak choi 761.20bc 595.20b 166.00ab 2.32de
T2*Swiss chard 477.39d 354.23c 123.15c 2.81d
Means that do not share the same alphabetical letter in a column are significantly different.
Chlorophyll fluorescence activity was used to assess photosynthetic activities in the microgreen
plants (i.e. kale, pak choi and Swiss chard) grown in the different treatments. The ratio of Fv/Fo
stand for the structural alterations in chlorophyll fluorescence and indicated the electron donation
efficiency (Havaux & Lannoye, 1985).The Fv/Fm and Fv/Fo can be used to determine the
maximum quantum yield of chlorophyll fluorescence photochemistry and the potential
photosynthetic capacity, respectively (Abbey et al., 2018).We did not find the differences among
interaction effect on plant and treatments, the comparison was done among treatments. It was found
that the value of Fv, Fv/Fm and Fv/Fo of T1 was significantly higher than T2 on all the three plant
species (Table 6). Lower values of T2 of physiological indices revealed the reduce chloroplasts
photochemical activities and decreased photosynthesis (Garousi et al., 2015).
Table 6. Mean Fv/Fm and Fv/FO of plants (kale, pac chi, and Swiss chard) on vermicast-sawdust
mixed medium treatments.
Crops Fv/Fm Fv/Fo
Control 0.804a 4.177a
T1 0.791a 3.903a
T2 0.766b 3.408b
Means that do not share the same alphabetical letter in a column are significantly different.
The different combinations of media treatments were compared by principal component analysis

141
(PCA) segmentation on plant growth parameters and media biomarkers (Figure 1). Biplots in
Figure 1showedthe relationships between observed plant growth components, microbial groups,
nutrients mineralization and growing media treatments. The growing media amendments were
segregated into distinct quadrants of the biplot based on microbial group distributions and nutrient
mineralization. This segregation was based on PCA analysis, where 89.6% of the variations in the
dataset for plant growth components as affected by the media mineral nutrients and active microbial
compositions were explained (Figure 1).
Figure 1. A biplot showing the relationship between active microbial composition and mineral
nutrients of the mixed growing media. T1, 60% vermicast + 40% sawdust; T2, 40% vermicast +
60% sawdust. G+, gram-positive bacteria; G-, gram-negative bacteria; F, fungi; P, protozoa; E,
Eukaryotes. The right top is quadrant 1, and quadrants counted clockwise.
From quadrant 1 in Figure 1, the properties of T1 was majorly due to nutrients mineralization and
active microbial structure. Plant stem diameter, fresh weight, dry weight, leaf moisture content,

142
plant height, number of green leaf, and anthocyanin content had strong correlations(r>0.7) with G+
bacteria, eukaryotes, fungi, protozoa, G+/G-ratio, F/B ratio; and also N, electric conductivity, pH,
NO3--N, Ca, K, Mg, P, Na, SO4
2-, Cl-, Al, copper, Fe and Zn (Table 7). The optimum growth pH
of kale is around 5.5 to 6.5 (Lannotti, 2019). Bok choi requires a soil pH between 6.0 and 7.5
(Lannotti, 2019). The pH had a high correlation with plant growth parameters (Table 7).
The optimum pH for Swiss chard plant growth is between 6.0 and 6.4 although it can tolerate a
more neutral soil (Lannotti, 2018). This means the pH of the growing medium must be controlled
to meet plant requirement. If the pH level is below 6, the ground limestone could be added to
growing media; if the pH level is above 7.5, the sulfur could be a choice to adjust the amendment
pH.

143
Table 7. Pearson's Correlation coefficients for plant growth components, microbial populations and
mineral nutrients that was found significant in quadrants 1 of the PCA biplot.
Variables Stem
diameter
Fresh
weight
Dry
weight
Leaf
moisture
content
Plant
height
Green leaf
number
ACI
G+ 0.73 0.94 0.98 0.78 0.90 0.90 0.92
F 0.73 0.94 0.98 0.78 0.90 0.90 0.92
P 0.73 0.94 0.98 0.78 0.90 0.90 0.92
G+/G- -0.73 -0.94 -0.98 -0.78 -0.90 -0.90 -0.92
F/B ratio 0.73 0.94 0.98 0.78 0.90 0.90 0.92
N (%) 0.73 0.94 0.98 0.78 0.90 0.90 0.92
EC (µS/cm) 0.73 0.94 0.98 0.78 0.90 0.90 0.92
pH 0.73 0.94 0.98 0.78 0.90 0.90 0.92
NO3--N 0.73 0.94 0.98 0.78 0.90 0.90 0.92
Ca (mg/l) 0.73 0.94 0.98 0.78 0.90 0.90 0.92
K (mg/l) 0.73 0.94 0.98 0.78 0.90 0.90 0.92
Mg (mg/l) 0.73 0.94 0.98 0.78 0.90 0.90 0.92
P (mg/l) 0.73 0.94 0.98 0.78 0.90 0.90 0.92
Na (mg/l) 0.73 0.94 0.98 0.78 0.90 0.90 0.92
SO42- (mg/l) 0.73 0.94 0.98 0.78 0.90 0.90 0.92
Cu (mg/l) 0.73 0.94 0.98 0.78 0.90 0.90 0.92
Fe (mg/l) 0.73 0.94 0.98 0.78 0.90 0.90 0.92
Value are correlation values (p-value), with a significance level alpha=0.05. G+, gram-positive bacteria; G-, gram-
negative bacteria; F, fungi; P, protozoa; E, Eukaryotes;NO3---N; Ca, calcium; P, potassium, Mg, magnesium; P,
phosphorus; Na, sodium; SO42-, sulphate; Cl-, chloride; Al, aluminum; Cu, copper; Fe, iron; Zn, zinc. Protozoa, fungi
and G+ bacteria present its ratio to total microbial mass.

144
5.4 CONCLUSION
The total calcium, magnesium, sodium and sulphate contents in T1 (60% vermicast+40% sawdust)
were higher than in T2 (40% vermicast+60% sawdust) by 60%, 65%, 59% and 53% respectively.
Similarly, the total nitrogen (p<0.001), total potassium (p=0.004) and electric conductivity
(p=0.004) in T1 were significantly higher than in T2. The mineral nutrients content had
significantly (p<0.05) highly positive correlation (r<0.7) with active microbial composition in the
mixed media. Merged data for phospholipid fatty acids and mineral nutrients with plant growth
showed that T1 significantly (P<0.05) enhanced the plant morphological and physiological profile
of kale, Swiss chard and pak choi plants as compared to T2 plants. In addition, in a combined
(treatment X plant species) plant growth indicators versus mineral nutrients and active microbial
group analyses, T1 has been shown to be superior to T2.In summary, the T1 mixed medium was
the most effective combination for producing microgreens (kale, pac choi, and Swiss chard in this
experiment). Further research should investigate edible quality components of the microgreens
produced.
5.5 REFERENCES
Abbey, L., Annan, N., Asiedu, S. K., Esan, E. O., & Iheshiulo, E. M. A. (2018). Amino acids,
mineral nutrients, and efficacy of vermicompost and seafood and municipal solid wastes
composts. International journal of agronomy, 2018.
Abbey, L., Pham, T. H., Annan, N., Leke-Aladekoba, A., & Thomas, R. H. (2018). Chemical
composition of kale as influenced by dry vermicast, potassium humate and volcanic minerals.
Food Research International, 107, 726-737.
Alenius, H., Pakarinen, J., Saris, O., Andersson, M. A., Leino, M., Sirola, K., . . . Wolff, H. (2009).
Contrasting immunological effects of two disparate dusts–preliminary observations.
International Archives of Allergy and Immunology, 149(1), 81-90.
145
Allaire, S. E., Caron, J., Ménard, C., & Dorais, M. (2005). Potential replacements for rockwool as
growing substrate for greenhouse tomato. Canadian Journal of Soil Science, 85(1), 67-74.
Amir, S., Merlina, G., Pinelli, E., Winterton, P., Revel, J., & Hafidi, M. (2008). Microbial
community dynamics during composting of sewage sludge and straw studied through
phospholipid and neutral lipid analysis. Journal of Hazardous Materials, 159(2-3), 593-601.
Arancon, N. Q., Edwards, C. A., Bierman, P., Welch, C., & Metzger, J. D. (2004). Influences of
vermicomposts on field strawberries: 1. Effects on growth and yields. Bioresource
technology, 93(2), 145-153.
Aulen, M., Shipley, B., & Bradley, R. (2012). Prediction of in situ root decomposition rates in an
interspecific context from chemical and morphological traits. Annals of botany, 109(1), 287-
297.
Babani, F., & Lichtenthaler, H. K. (1996). Light-induced and Age-dependent Development
ofChloroplasts in Etiolated Barley Leaves as Visualized by Determination of Photosynthetic
Pigments, C02 Assimilation Rates and Different Kinds of Chlorophyll Fluorescence
Ratios. Journal of Plant Physiology, 148(5), 555-566.
Bradley, D. (2007). Canada–sustainable forest biomass supply chains. climate change solutions.
For International Energy Agency Bioenergy Task, 40
Brockett, B. F., Prescott, C. E., & Grayston, S. J. (2012). Soil moisture is the major factor
influencing microbial community structure and enzyme activities across seven biogeoclimatic
zones in western Canada. Soil Biology and Biochemistry, 44(1), 9-20.
Caron, J., Morel, P., Rivière, L., & Guillemain, G. (2010). Identifying appropriate methodology to
diagnose aeration limitations with large peat and bark particles in growing media. Canadian
Journal of Soil Science, 90(3), 481-494.
Caron, J., Price, J. S., & Rochefort, L. (2015). Physical properties of organic soil: Adapting mineral
soil concepts to horticultural growing media and histosol characterization. Vadose Zone
Journal, 14(6).
Cavigelli, M. A., Robertson, G. P., & Klug, M. J. (1995). Fatty acid methyl ester (FAME) profiles
as measures of soil microbial community structure. The significance and regulation of soil
biodiversity, 99-113.
Depardieu, C., Premont, V., Boily, C., & Caron, J. (2016). Sawdust and bark-based substrates for
soilless strawberry production: Irrigation and electrical conductivity management. PloS One,
11(4)
Di Noia, J. (2014). Peer reviewed: Defining powerhouse fruits and vegetables: A nutrient density
approach. Preventing Chronic Disease, 11

146
Dorais, M., Menard, C., & Begin, G. (2006). Risk of phytotoxicity of sawdust substrates for
greenhouse vegetables. Paper presented at the XXVII International Horticultural Congress-
IHC2006: International Symposium on Advances in Environmental Control, Automation 761,
589-595.
Duong, T. T., Penfold, C., & Marschner, P. (2012). Amending soils of different texture with six
compost types: ImPakt on soil nutrient availability, plant growth and nutrient uptake. Plant
and Soil, 354(1-2), 197-209.
Garousi, F., Kovács, B., & Veres, S. (2015). Investigation of photosynthesis status of sunflower
plants up taking different forms of selenium. Advances in Plants & Agriculture Research, 3(3).
Gharaibeh, A. A., & Voorhees, K. J. (1996). Characterization of lipid fatty acids in whole-cell
microorganisms using in situ supercritical fluid derivatization/extraction and gas
chromatography/mass spectrometry. Analytical Chemistry, 68(17), 2805-2810.
Gómez-Brandón, M., Lores, M., & Domínguez, J. (2010). A new combination of extraction and
derivatization methods that reduces the complexity and preparation time in determining
phospholipid fatty acids in solid environmental samples. Bioresource technology, 101(4),
1348-1354.
Havaux, M., & Lannoye, R. (1985). Drought resistance of hard wheat cultivars measured by a rapid
chlorophyll fluorescence test. The Journal of Agricultural Science, 104(3), 501-504.
Huygens, D., Schouppe, J., Roobroeck, D., Alvarez, M., Balocchi, O., Valenzuela, E., ... & Boeckx,
P. (2011). Drying–rewetting effects on N cycling in grassland soils of varying microbial
community composition and management intensity in south central Chile. Applied Soil
Ecology, 48(3), 270-279.
Jensen, L. S., Salo, T., Palmason, F., Breland, T. A., Henriksen, T. M., Stenberg, B., ... & Esala,
M. (2005). Influence of biochemical quality on C and N mineralisation from a broad variety
of plant materials in soil. Plant and Soil, 273(1-2), 307-326.
Joergensen, R. G., & Potthoff, M. (2005). Microbial reaction in activity, biomass, and community
structure after long-term continuous mixing of a grassland soil. Soil Biology and
Biochemistry, 37(7), 1249-1258.
Kaur, A., Chaudhary, A., Kaur, A., Choudhary, R., & Kaushik, R. (2005). Phospholipid fatty acid–
a bioindicator of environment monitoring and assessment in soil ecosystem. Current Science,
1103-1112.
Khan, T. H., Aman, F., Muhammad Noman Khan, D., Shah, S. Q., Said, B., & Irfan, I. (2019). 88.
Effect of vermicompost on growth, yield and quality of chilli (Capsicum annum L.) under the
agro climatic condition of Peshawar, Pakistan. Pure and Applied Biology (PAB), 8(1), 856-

147
865.
Kong, A. Y., Scow, K. M., Córdova-Kreylos, A. L., Holmes, W. E., & Six, J. (2011). Microbial
community composition and carbon cycling within soil microenvironments of conventional,
low-input, and organic cropping systems. Soil Biology and Biochemistry, 43(1), 20-30.
Kujur, M., & Patel, A. K. (2014). PLFA Profiling of soil microbial community structure and
diversity in different dry tropical ecosystems of Jharkhand. Int. J. Curr. Microbiol. App.
Sci, 3(3), 556-575.
Kyriacou, M. C., El-Nakhel, C., Graziani, G., Pannico, A., Soteriou, G. A., Giordano, M., . . .
Rouphael, Y. (2019). Functional quality in novel food sources: Genotypic variation in the
nutritive and phytochemical composition of thirteen microgreens species. Food Chemistry,
277, 107-118.
Kyriacou, M. C., Rouphael, Y., Di Gioia, F., Kyratzis, A., Serio, F., Renna, M., ... & Santamaria,
P. (2016). Micro-scale vegetable production and the rise of microgreens. Trends in Food
Science & Technology, 57, 103-115.
Lannotti, M. (2019, June 16). Kale Plant Profile. Retrieved from
https://www.thespruce.com/growing-Kale-1403516
Lannotti, M. (2018, November 25). Growing Swiss chard. Retrieved from
https://www.thespruce.com/growing-Swiss-chard-1403466
Lannotti, M. (2019, December 3). How to Grow Bok choi. Retrieved from
https://www.thespruce.com/how-to-grow-bok-choi-4125560
Lasater, A. L., Carter, T., & Rice, C. (2017). Effects of drought conditions on microbial
communities in native rangelands.
Lemay, I., Caron, J., Dorais, M., & Pepin, S. (2012). Defining irrigation set points based on
substrate properties for variable irrigation and constant matric potential devices in greenhouse
tomato. HortScience, 47(8), 1141-1152.
Maxwell, K., & Johnson, G. N. (2000). Chlorophyll fluorescence—a practical guide. Journal of
experimental botany, 51(345), 659-668.
Moreno, J. L., Ondoño, S., Torres, I., & Bastida, F. (2017). Compost, leonardite, and zeolite
impacts on soil microbial community under barley crops. Journal of soil science and plant
nutrition, 17(1), 214-230.
Naasz, R., Caron, J., Legault, J., & Pichette, A. (2009). Efficiency factors for bark substrates:
Biostability, aeration, or phytotoxicity. Soil Science Society of America Journal, 73(3), 780-
791.

148
Papatheodorou, E. M., Kordatos, H., Kouseras, T., Monokrousos, N., Menkissoglu-Spiroudi, U.,
Diamantopoulos, J., ... & Argyropoulou, M. D. (2012). Differential responses of structural and
functional aspects of soil microbes and nematodes to abiotic and biotic modifications of the
soil environment. Applied soil ecology, 61, 26-33.
Pham, T. H., Zaeem, M., Fillier, T. A., Nadeem, M., Vidal, N. P., Manful, C., Cheema, S., Cheema,
M., & Thomas, R. H. (2019). Targeting modified lipids during routine lipidomics analysis
using HILIC and C30 reverse phase liquid chromatography coupled to mass spectrometry.
Scientific Reports, 9(1), 5048.
Pinto, E., Almeida, A. A., Aguiar, A. A., & Ferreira, I. M. (2015). Comparison between the mineral
profile and nitrate content of microgreens and mature lettuces. Journal of Food Composition
and Analysis, 37, 38-43.
Ramnarain, Y. I., Ori, L., & Ansari, A. A. (2018). Effect of the use of vermicompost on the plant
growth parameters of Pak choi (Brassica rapa var. chinensis) and on the soil structure in
Suriname. Journal of Global Agriculture and Ecology, 8(1), 8-15.
Raviv, M., Wallach, R., Silber, A., & Bar-Tal, A. (2002). Substrates and their analysis. Hydroponic
Production of Vegetables and Ornamentals, 25-105.
Sawan, O. M., & Eissa, A. M. (1995). Sawdust as an alternative to peat moss media for cucumber
seedlings production in greenhouses. Strategies for Market Oriented Greenhouse Production
434, 127-138.
Schindlbacher, A., Rodler, A., Kuffner, M., Kitzler, B., Sessitsch, A., & Zechmeister-Boltenstern,
S. (2011). Experimental warming effects on the microbial community of a temperate mountain
forest soil. Soil Biology and Biochemistry, 43(7), 1417-1425.
Sheng, M., Hamel, C., & Fernandez, M. R. (2012). Cropping practices modulate the impact of
glyphosate on arbuscular mycorrhizal fungi and rhizosphere bacteria in agroecosystems of the
semiarid prairie. Canadian Journal of Microbiology, 58(8), 990-1001.
Smith, D. C., Beharee, V., & Hughes, J. C. (2001). The effects of composts produced by a simple
composting procedure on the yields of Swiss chard (beta vulgaris L. var. flavescens) and
common bean (phaseolus vulgaris L. var. nanus). Scientia Horticulturae, 91(3-4), 393-406.
Spring, S., Schulze, R., Overmann, J., & Schleifer, K. (2000). Identification and characterization
of ecologically significant prokaryotes in the sediment of freshwater lakes: Molecular and
cultivation studies. FEMS Microbiology Reviews, 24(5), 573-590.
Trinsoutrot, I., Recous, S., Bentz, B., Lineres, M., Cheneby, D., & Nicolardot, B. (2000).
Biochemical quality of crop residues and carbon and nitrogen mineralization kinetics under
nonlimiting nitrogen conditions.
United Nations, Department of Economic and Social Affairs, Population Division. (2019). World
population prospects 2019: Highlights.

149
USDA National Nutrient Database. (2018). Nutrition Facts and Analysis for chard per 100 grams
version SR-21. Retrieved from https://nutritiondata.self.com/facts/vegetables-and-vegetable-
products/2399/2
Vano, I., Matsushima, M., Tang, C., & Inubushi, K. (2011). Effects of peat moss and sawdust
compost applications on N2O emission and N leaching in blueberry cultivating soils. Soil
Science and Plant Nutrition, 57(2), 348-360.
Vidal, N. P., Pham, H. T., Manful, C., Pumphrey, R., Nadeem, M., Cheema, M., . . . Thomas, R.
(2018). The use of natural media amendments to produce kale enhanced with functional lipids
in controlled environment production system. Scientific Reports, 8(1), 14771.
Wang, X., Wang, X., Zhang, W., Shao, Y., Zou, X., Liu, T., ... & Fu, S. (2016). Invariant
community structure of soil bacteria in subtropical coniferous and broadleaved
forests. Scientific reports, 6(1), 1-11.
White, P. M., & Rice, C. W. (2009). Tillage effects on microbial and carbon dynamics during plant
residue decomposition. Soil Science Society of America Journal, 73(1), 138-145.
Wu, X., Wu, F., Zhou, X., Fu, X., Tao, Y., Xu, W., ... & Liu, S. (2016). Effects of intercropping
with potato onion on the growth of tomato and rhizosphere alkaline phosphatase genes
diversity. Frontiers in plant science, 7, 846.
Xiao, Z., Lester, G. E., Luo, Y., & Wang, Q. (2012). Assessment of vitamin and carotenoid
concentrations of emerging food products: edible microgreens. Journal of agricultural and
food chemistry, 60(31), 7644-7651.
Zaeem, M. (2018). Assessment of a novel soil nutrient imaging technique, forage productivity and
the soil health status of silage corn and forage soybean cultivated as mono or intercrop under
cool climatic conditions (Doctoral dissertation, Memorial University of Newfoundland).
Zelles, L. (1999). Fatty acid patterns of phospholipids and lipopolysaccharides in the
characterisation of microbial communities in soil: A review. Biology and Fertility of Soils,
29(2), 111-129.
Zhang, B., Zhao, R., Bi, B., & Han, F. (2017). Responses of soil microbial communities to robinia
pseudoacacia plantations of different ages in A loess area.
Zhang, Q., Wu, J., Yang, F., Lei, Y., Zhang, Q., & Cheng, X. (2016). Alterations in soil microbial
community composition and biomass following agricultural land use change. Scientific
reports, 6, 36587.

150
CHAPTER 6 CONCLUSION
Conventionally, organic amendments were used as the sources of plant nutrients. As the well
understanding of the roles of organic amendments on plant growth and soil fertility, farmers use
organic amendments instead of synthetic chemical fertilizers and pesticides to reduce
environmental pollution, production cost, as well as to restore or reclaim degraded soils. The
organic amendment used in this project was the mixed media, vermicast-sawdust. Many
agricultural problems could be avoided by vermicast application, such as soil structural degradation,
erosion, nutrient loss, nutrient toxicity and salinity attributable to its physicochemical nature,
microbial richness and properties. Due to these functions on plant growth, vermicast is treated as
one of the most promising organic amendments in agriculture and horticulture. Sawdust is widely
used as a growing medium substrate in greenhouse production because it is low cost and local
available technology, as well as its good water-holding capacity.
In this study, the total dissolved solids, electrical conductivity and salinity in the solution of all the
mixed growing medium treatments were progressively increased before reaching stable
concentrations. Nutrient released from A1 and B1 were the highest while A5 and B5 had the least
and the others (i.e. A2, A3, A4, B2, B3 and B4) were intermediate. The interaction of Time
*Treatment (p<0.0001) and the main effect of T. viride was significant (p<0.0001). Nutrients
mineralization and availability were higher in the media treatments without T. viride (i.e. group A)
compared to media with added T. viride. The highest EC combination was 34.5 hr with A1 and B1
and the least was 0.25 hr with A5 and B5). Moreover, the mixed media without T. viride had
positive and significant effect on total dissolved solids, electrical conductivity and salinity. The N,
Ca, K, Mg, Na, S and B contents of A1 and B1 were higher than the rest of the treatments. A

151
reduction in vermicast content of a mixed media leads to a significant reduction in mineral nutrients.
This study did not report on microbial relationship with the different growing medium treatments.
However, further studies are in progress to assess the growing media microbial dynamics and plants
growth performance.
The results obtained from the present study demonstrate that the addition of Trichoderma was not
significantly beneficial in enhancing the microbial activities compared to growing media without
Trichoderma viride. The mineral nutrients released in the mixed media had a high correlation
(r>0.7) with the active microbial groups present. We found six main microbial groups present in
the saw vermicast based media as follows: G+, G-, G+G-, fungi, protozoa, archaea and eukaryotes.
G+, G- as well as the total of G+ and G- bacteria contributed 18.9%, 35.7% and 39.8%, respectively,
to the overall total microbial population observed in the media. Treatments A2 and B2 (60%
vermicast-40% sawdust, without and with T. viride) showed higher pH, Protozoa, F/B ratio, and
Fe. We found that treatments B1 and B3 (80% vermicast-20% sawdust and 40% vermicast-
60%sawdust, both with T. viride) contained higher amounts of Na and PG than the other treatments.
The mineralized nutrients (eg chloride, sodium, nitrogen, potassium, sulphate, magnesium, and
calcium) in the mixed growing media is associated with increased active microbial community
composition (eukaryotes, G+, and the ratio of G+/G-). Additionally, the vermicast-sawdust in the
ratio of 40:60 and 60:40 had superior effects on the microbial composition under the conditions of
the present study. After 30 days (i.e. sampling times 3 and 4), the sum of bacteria and fungi
(p=0.042) were significantly higher than those media sampled before 30 days (i.e. sampling times
1 and 2). On the contrary, the content of the bacterial group was significantly (p=0.009) higher in
the growing media incubated for less than 30 days. For the sum of bacteria, the first two samplings
time were higher. The decreased microbial activity in the aged mixed media appears to be related

152
to diminution in the available carbon in the substrate and lower microbial population and nutrient
status. Overall, no incubation of the sawdust vermicast based media appears to be more beneficial
in supporting a superior active microbial composition. For this project, the ratio of 40:60 and 60:40
vermicast-sawdust without incubation would be suggested as superior in terms of improved active
microbial composition, health status and nutrient mineralization for plant growth.
The total calcium, magnesium, sodium and sulphate contents in T1 (60% vermicast+40% sawdust)
were higher than in T2 (40% vermicast+60% sawdust) by 60%, 65%, 59% and 53% respectively.
Similarly, the total nitrogen (p<0.001), total potassium (p=0.004) and electric conductivity
(p=0.004) in T1 were significantly higher than in T2. The mineral nutrients content had
significantly (p<0.05) highly positive correlation (r<0.7) with active microbial composition in the
mixed media. Merged data for phospholipid fatty acids and mineral nutrients with plant growth
showed that T1 significantly (P<0.05) enhanced the plant morphological and physiological profile
of kale, Swiss chard and pak choi plants as compared to T2 plants. In addition, in a combined
(treatment X plant species) plant growth indicators versus mineral nutrients and active microbial
group analyses, T1 has been shown to be superior to T2. In summary, the T1 mixed medium was
the most effective combination for producing microgreens. Further research should investigate
edible quality components of the microgreens produced.
Figure 1. Interactions between plants, microbiota, and growing media (Jacoby et al., 2017).

153
Organic input could be one of the alternative methods of sustaining plant nutrition to lower inputs
of mineral fertilizers and to supply plants with specific root-associated microbes (Jacoby et al.,
2017; Foley et al., 2011). From Figure 1, we found that the plants gained nutrients from the growing
media through activities of microorganisms that made the nutrients available. Microbes can
depolymerize and mineralize the organic-bound nutrients, which was made available to the plants.
Taken together; our results demonstrated that 60% vermicast+40% sawdust could be a new
growing media for kale, pac choi, and Swiss chard growth. The nutrient-release pattern experiment
proved that growing media without incubation had more nutrient released than 30 days’, 60 days’,
and 90 days’ incubation. The nutrient mineralization experiment showed that increased proportion
of vermicast increased mineral nutrients composition of the growing media. Adding extra
Trichoderma on mixed media did not showed significant (p<0.05) effect regarding to the results of
both nutrient-release pattern and nutrient mineralization experiments. The active microbial
composition experiment showed that 60% vermicast+40% sawdust, 40% vermicast+60% sawdust,
60% vermicast+Trichoderma+40% sawdust, 60% vermicast+ Trichoderma+40% sawdust had
higher connection with minerals. In addition, the data of plant growth showed that 60%
vermicast+40% sawdust had better plant performance than 40% vermicast+60% sawdust. These
studies have important value in the investigating new combination of growing media.

154
Reference
Foley, J. A., Ramankutty, N., Brauman, K. A., Cassidy, E. S., Gerber, J. S., Johnston, M., ... &
Balzer, C. (2011). Solutions for a cultivated planet. Nature, 478(7369), 337-342.
Jacoby, R., Peukert, M., Succurro, A., Koprivova, A., & Kopriva, S. (2017). The role of soil
microorganisms in plant mineral nutrition—current knowledge and future directions. Frontiers
in plant science, 8, 1617.

155
REFERENCES
Abbey, L., Annan, N., Asiedu, S. K., Esan, E. O., & Iheshiulo, E. M. A. (2018). Amino acids,
mineral nutrients, and efficacy of vermicompost and seafood and municipal solid wastes
composts. International journal of agronomy, 2018.
Abbey, L., & Appah, P. (2016). Pot-grown swiss chard and kale responses to variable rate of
manure compost in mycorrhizal fungi inoculated medium. Paper presented at the III
International Symposium on Organic Greenhouse Horticulture 1164, 241-248.
Abbey, L., Pham, T. H., Annan, N., Leke-Aladekoba, A., & Thomas, R. H. (2018). Chemical
composition of kale as influenced by dry vermicast, potassium humate and volcanic minerals.
Food Research International, 107, 726-737.
Abbey, L., Rao, S. A., Hodgins, L. N., & Briet, F. (2013). Drying and rehydration of vermicasts
do not affect nutrient bioavailability and seedling growth. American Journal of Plant
Nutrition and Fertilization Technology, 3(1), 12-21.
Adhikary, S. (2012). Vermicompost, the story of organic gold: A review. Agricultural Sciences,
3(7), 905.
Agboola, O. O., Oseni, O. M., Adewale, O. M., & Shonubi, O. (2018). effect of the use of sawdust
as a growth medium on the growth and yield of tomato. Annales of West University of
Timisoara. Series of Biology, 21(1), 67-74.
Alenius, H., Pakarinen, J., Saris, O., Andersson, M. A., Leino, M., Sirola, K., . . . Wolff, H. (2009).
Contrasting immunological effects of two disparate dusts–preliminary observations.
International Archives of Allergy and Immunology, 149(1), 81-90.
Allaire, S. E., Caron, J., Ménard, C., & Dorais, M. (2005). Potential replacements for rockwool as
growing substrate for greenhouse tomato. Canadian Journal of Soil Science, 85(1), 67-74.
Alpert, P., & Maron, J. L. (2000). Carbon addition as a countermeasure against biological invasion
by plants. Biological Invasions, 2(1), 33-40.
Amir, S., Merlina, G., Pinelli, E., Winterton, P., Revel, J., & Hafidi, M. (2008). Microbial
community dynamics during composting of sewage sludge and straw studied through
phospholipid and neutral lipid analysis. Journal of Hazardous Materials, 159(2-3), 593-601.
Ansari, A. A., & Sukhraj, K. (2010). Effect of vermiwash and vermicompost on soil parameters
and productivity of okra (Abelmoschus esculentus) in guyana. African Journal of Agricultural
Research, 5(14), 1794-1798.
AOAC.(2003). Metals and other elements in plants and pet foods, inductively coupled plasma
spectroscopic method, AOAC official method 968.08. Official methods of analysis. 17th ed.
Association of Official Analytical Chemists.

156
Arancon, N. Q., Edwards, C. A., Atiyeh, R., & Metzger, J. D. (2004). Effects of vermicomposts
produced from food waste on the growth and yields of greenhouse peppers. Bioresource
Technology, 93(2), 139-144.
Arancon, N. Q., Edwards, C. A., Babenko, A., Cannon, J., Galvis, P., & Metzger, J. D. (2008).
Influences of vermicomposts, produced by earthworms and microorganisms from cattle
manure, food waste and paper waste, on the germination, growth and flowering of petunias in
the greenhouse. Applied Soil Ecology, 39(1), 91-99.
Arancon, N. Q., Edwards, C. A., Bierman, P., Welch, C., & Metzger, J. D. (2004). Influences of
vermicomposts on field strawberries: 1. Effects on growth and yields. Bioresource
technology, 93(2), 145-153.
Aulen, M., Shipley, B., & Bradley, R. (2012). Prediction of in situ root decomposition rates in an
interspecific context from chemical and morphological traits. Annals of botany, 109(1), 287-
297.
Babani, F., & Lichtenthaler, H. K. (1996). Light-induced and Age-dependent Development
ofChloroplasts in Etiolated Barley Leaves as Visualized by Determination of Photosynthetic
Pigments, C02 Assimilation Rates and Different Kinds of Chlorophyll Fluorescence
Ratios. Journal of Plant Physiology, 148(5), 555-566.
Bal, U., & Altintas, S. (2006). Application of the antagonistic fungus Trichoderma harzianum
(TrichoFlow WP™) to root zone increases yield of bell peppers grown in soil. Biological
agriculture & horticulture, 24(2), 149-163.
Bal, U., & Altintas, S. (2008). Effects of Trichoderma harzianum on lettuce in protected
cultivation. Journal of Central European Agriculture, 9(1), 63-70.
Batista, A., Vetter, W., & Luckas, B. (2001). Use of focused open vessel microwave-assisted
extraction as prelude for the determination of the fatty acid profile of fish–a comparison with
results obtained after liquid-liquid extraction according to bligh and dyer. European Food
Research and Technology, 212(3), 377-384.
Beare, M. H., Hendrix, P. F., Cabrera, M. L., & Coleman, D. C. (1994). Aggregate-protected and
unprotected organic matter pools in conventional-and no-tillage soils. Soil Science Society of
America Journal, 58(3), 787-795.
Bellitürk, K., Adiloğlu, S., Solmaz, Y., Zahmacıoğlu, A., & Adiloğlu, A. (2017). Effects of
Increasing Doses of Vermicompost Applications on P and K Contents of Pepper (Capsicum
annuum L.) and Eggplant (Solanum melongena L.). Journal of Advanced Agricultural
Technologies, 4(4).
Bhat, S. A., Singh, S., Singh, J., Kumar, S., & Vig, A. P. (2018). Bioremediation and detoxification
of industrial wastes by earthworms: Vermicompost as powerful crop nutrient in sustainable
agriculture. Bioresource Technology, 252, 172-179.

157
Bligh, E. G., & Dyer, W. J. (1959). A rapid method of total lipid extraction and purification.
Canadian Journal of Biochemistry and Physiology, 37(8), 911-917.
Bossio, D. A., Girvan, M. S., Verchot, L., Bullimore, J., Borelli, T., Albrecht, A., Scow, K. M.,
Ball, A. S., Pretty, J. N., Osborn, A. M. (2005). Soil microbial community response to land
use change in an agricultural landscape of western kenya. Microbial Ecology, 49(1), 50-62.
Bradley, D. (2007). Canada–sustainable forest biomass supply chains. climate change solutions.
For International Energy Agency Bioenergy Task, 40
Brass, T. J., Foshee III, W. G., & Sibley, J. L. (2004). Use of fresh sawdust as a nitrogen source in
sweet corn production. Journal of Vegetable Crop Production, 10(2), 89-98.
Buckland, P. C. (1993). Peatland archaeology: A conservation resource on the edge of extinction.
Biodiversity & Conservation, 2(5), 513-527.
Brockett, B. F., Prescott, C. E., & Grayston, S. J. (2012). Soil moisture is the major factor
influencing microbial community structure and enzyme activities across seven biogeoclimatic
zones in western Canada. Soil Biology and Biochemistry, 44(1), 9-20.
Canfield, D. E. (2005). The early history of atmospheric oxygen: Homage to robert M. garrels.
Annual Review of Earth and Planetary Sciences, 33, 1-36.
Caron, J., Morel, P., Rivière, L., & Guillemain, G. (2010). Identifying appropriate methodology to
diagnose aeration limitations with large peat and bark particles in growing media. Canadian
Journal of Soil Science, 90(3), 481-494.
Caron, J., Price, J. S., & Rochefort, L. (2015). Physical properties of organic soil: Adapting mineral
soil concepts to horticultural growing media and histosol characterization. Vadose Zone
Journal, 14(6).
Cavigelli, M. A., Robertson, G. P., & Klug, M. J. (1995). Fatty acid methyl ester (FAME) profiles
as measures of soil microbial community structure. The significance and regulation of soil
biodiversity, 99-113.
Chaoui, H. I., Zibilske, L. M., & Ohno, T. (2003). Effects of earthworm casts and compost on soil
microbial activity and plant nutrient availability. Soil Biology and Biochemistry, 35(2), 295-
302.
Chaparro, J. M., Sheflin, A. M., Manter, D. K., & Vivanco, J. M. (2012). Manipulating the soil
microbiome to increase soil health and plant fertility. Biology and Fertility of Soils, 48(5),
489-499.
Chen, L., Luo, Y., Xu, J., Yu, Z., Zhang, K., & Brookes, P. C. (2016). Assessment of bacterial
communities and predictive functional profiling in soils subjected to short-term fumigation-
incubation. Microbial ecology, 72(1), 240-251.

158
Cheng, B. T. (1987). Systems: Sawdust as a greenhouse growing medium. Journal of Plant
Nutrition, 10(9-16), 1437-1446.
Comeau, A. M., Douglas, G. M., & Langille, M. G. (2017). Microbiome helper: a custom and
streamlined workflow for microbiome research. MSystems, 2(1).
Contreras-Cornejo, H. A., Macias-Rodriguez, L., Cortes-Penagos, C., & Lopez-Bucio, J. (2009).
Trichoderma virens, a plant beneficial fungus, enhances biomass production and promotes
lateral root growth through an auxin-dependent mechanism in arabidopsis. Plant Physiology,
149(3), 1579-1592. doi:10.1104/pp.108.130369 [doi]
Depardieu, C., Premont, V., Boily, C., & Caron, J. (2016). Sawdust and bark-based substrates for
soilless strawberry production: Irrigation and electrical conductivity management. PloS One,
11(4)
Diacono, M., & Montemurro, F. (2011). Long-term effects of organic amendments on soil fertility.
Sustainable agriculture volume 2 (pp. 761-786) Springer.
Dinesh, R., Srinivasan, V., Hamza, S., & Manjusha, A. (2010). Short-term incorporation of organic
manures and biofertilizers influences biochemical and microbial characteristics of soils under
an annual crop [turmeric (curcuma longa L.)]. Bioresource Technology, 101(12), 4697-4702.
Di Noia, J. (2014). Peer reviewed: Defining powerhouse fruits and vegetables: A nutrient density
approach. Preventing Chronic Disease, 11
Dorais, M., Menard, C., & Begin, G. (2006). Risk of phytotoxicity of sawdust substrates for
greenhouse vegetables. Paper presented at the XXVII International Horticultural Congress-
IHC2006: International Symposium on Advances in Environmental Control, Automation 761,
589-595.
Duong, T. T., Penfold, C., & Marschner, P. (2012). Amending soils of different texture with six
compost types: Impact on soil nutrient availability, plant growth and nutrient uptake. Plant
and Soil, 354(1-2), 197-209.
Dzurenda, L., Orlowski, K., & Grzeskiewicz, M. (2010). Effect of thermal modification of oak
wood on sawdust granularity. Drvna industrija, 61(2), 89-94.
Edwards, C. A., Dominguez, J., & Arancon, N. Q. (2004). 18. the influence of vermicompost on
plant growth and pest incidence. Soil Zoology for Sustainable Development in the 21st
Century.Cairo, 397-420.
El-Goud, A., & Amal, K. (2020). Efficiency Response of Vermicompost and Vermitea Levels on
Growth and Yield of Eggplant (Solanum melongena, L.). Alexandria Science Exchange
Journal, 41(JANUARY-MARCH), 69-75.

159
Farquhar, J., Bao, H., & Thiemens, M. (2000). Atmospheric influence of earth's earliest sulfur cycle.
Science, 289(5480), 756-758.
Fernández-Bayo, J. D., Romero, E., Schnitzler, F., & Burauel, P. (2008). Assessment of pesticide
availability in soil fractions after the incorporation of winery-distillery vermicomposts.
Environmental Pollution, 154(2), 330-337.
Fiorentino, N., Ventorino, V., Woo, S. L., Pepe, O., De Rosa, A., Gioia, L., . . . Colla, G. (2018).
Trichoderma-based biostimulants modulate rhizosphere microbial populations and improve N
uptake efficiency, yield, and nutritional quality of leafy vegetables. Frontiers in Plant Science,
9, 743.
Foley, J. A., Ramankutty, N., Brauman, K. A., Cassidy, E. S., Gerber, J. S., Johnston, M., ... &
Balzer, C. (2011). Solutions for a cultivated planet. Nature, 478(7369), 337-342.
Franco-Otero, V. G., Soler-Rovira, P., Hernández, D., López-de-Sá, E. G., & Plaza, C. (2012).
Short-term effects of organic municipal wastes on wheat yield, microbial biomass, microbial
activity, and chemical properties of soil. Biology and Fertility of Soils, 48(2), 205-216.
Friedrich, M. W. (2011). Microbial communities, structure, and function. Encyclopedia of
geobiology (pp. 592-595) Springer.
Gandhi, M. (1997). Composting of household wastes with and without earthworms. Environment
and Ecology, 15, 432-434.
Gao, X., Zhang, Q., Meng, D., Isaac, G., Zhao, R., Fillmore, T. L., . . . Hu, Z. (2012). A reversed-
phase capillary ultra-performance liquid chromatography–mass spectrometry (UPLC-MS)
method for comprehensive top-down/bottom-up lipid profiling. Analytical and Bioanalytical
Chemistry, 402(9), 2923-2933.
Garousi, F., Kovács, B., & Veres, S. (2015). Investigation of photosynthesis status of sunflower
plants up taking different forms of selenium. Advances in Plants & Agriculture Research, 3(3).
Gharaibeh, A. A., & Voorhees, K. J. (1996). Characterization of lipid fatty acids in whole-cell
microorganisms using in situ supercritical fluid derivatization/extraction and gas
chromatography/mass spectrometry. Analytical Chemistry, 68(17), 2805-2810.
Gómez-Brandón, M. L. M., & Domínguez, J. (2010). Tracking down microbial communities via
fatty acids analysis: Analytical strategy for solid organic samples. Current Research,
Technology and Education Topics in Applied Microbiology and Microbial Biotechnology, 2,
1502-1508.
Gonzalez, N., De Bodt, S., Sulpice, R., Jikumaru, Y., Chae, E., Dhondt, S., . . . Inze, D. (2010).
Increased leaf size: Different means to an end. Plant Physiology, 153(3), 1261-1279.
doi:10.1104/pp.110.156018 [doi]

160
Goss, M. J., Tubeileh, A., & Goorahoo, D. (2013). A review of the use of organic amendments and
the risk to human health. In Advances in agronomy (Vol. 120, pp. 275-379). Academic Press.
Green, C. T., & Scow, K. M. (2000). Analysis of phospholipid fatty acids (PLFA) to characterize
microbial communities in aquifers. Hydrogeology Journal, 8(1), 126-141.
Guerrero III, R. D. (2010). Vermicompost production and its use for crop production in the
philippines. International Journal of Global Environmental Issues, 10(3-4), 378-383.
Gutiérrez-Miceli, F. A., García-Gómez, R. C., Rosales, R. R., Abud-Archila, M., Angela, O. L. M.,
Cruz, M. J. G., & Dendooven, L. (2008). Formulation of a liquid fertilizer for sorghum
(sorghum bicolor (L.) moench) using vermicompost leachate. Bioresource Technology, 99(14),
6174-6180.
Haack, S. K., Garchow, H., Odelson, D. A., Forney, L. J., & Klug, M. J. (1994). Accuracy,
reproducibility, and interpretation of fatty acid methyl ester profiles of model bacterial
communities. Applied and Environmental Microbiology, 60(7), 2483-2493.
Havaux, M., & Lannoye, R. (1985). Drought resistance of hard wheat cultivars measured by a rapid
chlorophyll fluorescence test. The Journal of Agricultural Science, 104(3), 501-504.
He, Y., Ding, N., Shi, J., Wu, M., Liao, H., & Xu, J. (2013). Profiling of microbial PLFAs:
Implications for interspecific interactions due to intercropping which increase phosphorus
uptake in phosphorus limited acidic soils. Soil Biology and Biochemistry, 57, 625-634.
He, Y., Xu, J., Wang, H., & Wu, Y. (2007). Generalized models for prediction of
pentachlorophenol dissipation dynamics in soils. Environmental pollution, 147(2), 343-349.
He, Y., Xu, J., Lv, X., Ma, Z., Wu, J., & Shi, J. (2009). Does the depletion of pentachlorophenol
in root–soil interface follow a simple linear dependence on the distance to root surfaces? Soil
Biology and Biochemistry, 41(9), 1807-1813.
Hedrick, D. B., Peacock, A., & White, D. C. (2005). Interpretation of fatty acid profiles of soil
microorganisms. In Monitoring and Assessing Soil Bioremediation (pp. 251-259). Springer,
Berlin, Heidelberg.
Henkel, M. (2015). 21st century homestead: Sustainable agriculture I Lulu. com.
Herman, D. J., Firestone, M. K., Nuccio, E., & Hodge, A. (2012). Interactions between an
arbuscular mycorrhizal fungus and a soil microbial community mediating litter decomposition.
FEMS Microbiology Ecology, 80(1), 236-247.
Hirsch, P. R., Mauchline, T. H., & Clark, I. M. (2010). Culture-independent molecular techniques
for soil microbial ecology. Soil Biology and Biochemistry, 42(6), 878-887.

161
Hu, J., Lin, X., Wang, J., Dai, J., Chen, R., Zhang, J., & Wong, M. H. (2011). Microbial functional
diversity, metabolic quotient, and invertase activity of a sandy loam soil as affected by long-
term application of organic amendment and mineral fertilizer. Journal of Soils and Sediments,
11(2), 271-280.
Hung, R., Lee, S., & Bennett, J. W. (2013). Arabidopsis thaliana as a model system for testing the
effect of trichoderma volatile organic compounds. Fungal Ecology, 6(1), 19-26.
Huygens, D., Schouppe, J., Roobroeck, D., Alvarez, M., Balocchi, O., Valenzuela, E., ... & Boeckx,
P. (2011). Drying–rewetting effects on N cycling in grassland soils of varying microbial
community composition and management intensity in south central Chile. Applied Soil
Ecology, 48(3), 270-279.
Iheshiulo, E. M., Abbey, L., & Asiedu, S. K. (2017). Response of kale to single-dose application
of k humate, dry vermicasts, and volcanic minerals. International Journal of Vegetable
Science, 23(2), 135-144.
Ilker, U. Z., Sonmez, S., Tavali, I. E., Citak, S., Uras, D. S., & Citak, S. (2016). Effect of
vermicompost on chemical and biological properties of an alkaline soil with high lime content
during celery (apium graveolens L. var. dulce mill.) production. Notulae Botanicae Horti
Agrobotanici Cluj-Napoca, 44(1), 280-290.
Jacoby, R., Peukert, M., Succurro, A., Koprivova, A., & Kopriva, S. (2017). The role of soil
microorganisms in plant mineral nutrition—current knowledge and future
directions. Frontiers in plant science, 8, 1617.
Jadhav, A. D., Talashilkar, S. C., & Powar, A. G. (1997). Influence of the conjunctive use of FYM,
vermicompost and urea on growth and nutrient uptake in rice. Journal of Maharashtra
Agricultural Universities, 22(2), 249-250.
Jarosz, Z., & Konopińska, J. (2010). Effect of substrate type and nitrogen fertilization upon yielding
and chemical composition of" elsanta" strawberry cultivar grown in unheated foil tunnel. Acta
Scientiarum Polonorum-Hortorum Cultus, 9(1), 87-96.
Javaid, A., & Bajwa, R. (2011). Effect of effective microorganism application on crop growth,
yield, and nutrition in Vigna radiata (L.) Wilczek in different soil amendment
systems. Communications in soil science and plant analysis, 42(17), 2112-2121.
Jensen, L. S., Salo, T., Palmason, F., Breland, T. A., Henriksen, T. M., Stenberg, B., ... & Esala,
M. (2005). Influence of biochemical quality on C and N mineralisation from a broad variety
of plant materials in soil. Plant and Soil, 273(1-2), 307-326.
Joergensen, R. G., & Potthoff, M. (2005). Microbial reaction in activity, biomass, and community
structure after long-term continuous mixing of a grassland soil. Soil Biology and
Biochemistry, 37(7), 1249-1258.

162
Johanson, J. G., & Cheeseman, J. M. (1983). Uptake and distribution of sodium and potassium by
corn seedlings: I. role of the mesocotyl inSodium exclusion'. Plant Physiology, 73(1), 153-
158.
Jung, J. Y., Kim, J. S., Ha, S. Y., Choi, J. H., & Yang, J. (2015). Suitability of thermal treated
sawdust as replacements for peat moss in horticultural media.농업생명과학연구, 49(4), 105-
115.
Kaur, A., Chaudhary, A., Kaur, A., Choudhary, R., & Kaushik, R. (2005). Phospholipid fatty acid–
a bioindicator of environment monitoring and assessment in soil ecosystem. Current Science,
1103-1112.
Kaushik, P., Yadav, Y. K., Dilbaghi, N., & Garg, V. K. (2008). Enrichment of vermicomposts
prepared from cow dung spiked solid textile mill sludge using nitrogen fixing and phosphate
solubilizing bacteria. The Environmentalist, 28(3), 283-287.
Khan, T. H., Aman, F., Muhammad Noman Khan, D., Shah, S. Q., Said, B., & Irfan, I. (2019). 88.
Effect of vermicompost on growth, yield and quality of chilli (Capsicum annum L.) under the
agro climatic condition of Peshawar, Pakistan. Pure and Applied Biology (PAB), 8(1), 856-
865.
Khomami, M. A., Padasht, M. N., Ajili Lahiji, A., & Shirinfekr, A. (2019). The effect of sawdust
vermicompost extract on syngonium podophyllum growth and nutrition. Journal of Plant
Nutrition, 42(4), 410-416. doi,10.1080/01904167.2018.1554071
Knapp, B. A., Ros, M., & Insam, H. (2010). Do composts affect the soil microbial community?
Microbes at work (pp. 271-291) Springer.
Kong, A. Y., Scow, K. M., Córdova-Kreylos, A. L., Holmes, W. E., & Six, J. (2011). Microbial
community composition and carbon cycling within soil microenvironments of conventional,
low-input, and organic cropping systems. Soil Biology and Biochemistry, 43(1), 20-30.
Kujur, M., & Patel, A. K. (2014). PLFA Profiling of soil microbial community structure and
diversity in different dry tropical ecosystems of Jharkhand. Int. J. Curr. Microbiol. App.
Sci, 3(3), 556-575.
Kumar, A., Prakash, C. H., Brar, N. S., & Kumar, B. (2018). Potential of vermicompost for
sustainable crop production and soil health improvement in different cropping systems.
International Journal of Current Microbiology and Applied Sciences, 7(10), 1042-1055.
Kumar, S., Rawat, C. R., Dhar, S., & Raina, S. K. (2005). Dry-matter accumulation, nutrient uptake
and changes in soil-fertility status as influenced by different organic and inorganic sources of
nutrients to forage sorghum (sorghum bicolor). The Indian Journal of Agricultural Sciences,
75(6), 340-342.

163
Kyriacou, M. C., El-Nakhel, C., Graziani, G., Pannico, A., Soteriou, G. A., Giordano, M., . . .
Rouphael, Y. (2019). Functional quality in novel food sources: Genotypic variation in the
nutritive and phytochemical composition of thirteen microgreens species. Food Chemistry,
277, 107-118.
Kyriacou, M. C., Rouphael, Y., Di Gioia, F., Kyratzis, A., Serio, F., Renna, M., ... & Santamaria,
P. (2016). Micro-scale vegetable production and the rise of microgreens. Trends in Food
Science & Technology, 57, 103-115.
Laghari, M., Hu, Z., Mirjat, M. S., Xiao, B., Tagar, A. A., & Hu, M. (2016). Fast pyrolysis biochar
from sawdust improves the quality of desert soils and enhances plant growth. Journal of the
Science of Food and Agriculture, 96(1), 199-206.
Lannotti, M. (2019, June 16). Kale Plant Profile. Retrieved from
https://www.thespruce.com/growing-Kale-1403516
Lannotti, M. (2018, November 25). Growing Swiss chard. Retrieved from
https://www.thespruce.com/growing-Swiss-chard-1403466
Lannotti, M. (2019, December 3). How to Grow Bok choi. Retrieved from
https://www.thespruce.com/how-to-grow-bok-choi-4125560
Lanza, G., Rebensburg, P., Kern, J., Lentzsch, P., & Wirth, S. (2016). Impact of chars and readily
available carbon on soil microbial respiration and microbial community composition in a
dynamic incubation experiment. Soil and Tillage Research, 164, 18-24.
Lasater, A. L., Carter, T., & Rice, C. (2017). Effects of drought conditions on microbial
communities in native rangelands.
Lazcano, C., & Domínguez, J. (2011). The use of vermicompost in sustainable agriculture, Impact
on plant growth and soil fertility. Soil Nutrients, 10, 1-23.
Lazcano, C., Gómez-Brandón, M., Revilla, P., & Domínguez, J. (2013). Short-term effects of
organic and inorganic fertilizers on soil microbial community structure and function. Biology
and Fertility of Soils, 49(6), 723-733.
Lazcano, C., Sampedro, L., Zas, R., & Domínguez, J. (2010a). Assessment of plant growth
promotion by vermicompost in different progenies of maritime pine (pinus pinaster ait.).
Compost Science & Utilization, 18(2), 111-118.
Lazcano, C., Sampedro, L., Zas, R., & Domínguez, J. (2010b). Vermicompost enhances
germination of the maritime pine (pinus pinaster ait.). New Forests, 39(3), 387-400.
Leelavathi, M. S., Vani, L., & Reena, P. (2014). Antimicrobial activity of trichoderma harzianum
against bacteria and fungi. International Journal of Current Microbiology and Applied
Sciences, 3(1), 96-103.

164
Lemay, I., Caron, J., Dorais, M., & Pepin, S. (2012). Defining irrigation set points based on
substrate properties for variable irrigation and constant matric potential devices in greenhouse
tomato. HortScience, 47(8), 1141-1152.
Li, Z., Zhao, B., Hao, X., & Zhang, J. (2017). Effects of residue incorporation and plant growth on
soil labile organic carbon and microbial function and community composition under two soil
moisture levels. Environmental Science and Pollution Research, 24(23), 18849-18859.
Lichtfouse, E. (2010). Biodiversity, biofuels, agroforestry and conservation agriculture Springer
Science & Business Media.
Lv, B., Zhang, D., Cui, Y., & Yin, F. (2018). Effects of C/N ratio and earthworms on greenhouse
gas emissions during vermicomposting of sewage sludge. Bioresource Technology, 268, 408-
414.
Maboko, M. M., & Du Plooy, C. P. (2013). High-density planting of tomato cultivar's with early
decapitation of growing point increased yield in a closed hydroponic system. Acta
Agriculturae Scandinavica, Section B-Soil & Plant Science, 63(8), 676-682.
Mach, R. L., Butterweck, A., Schindler, M., Messner, R., Herzog, P., & Kubicek, C. P. (1993).
Molecular regulation of formation of xylanase (XYN) I and II by trichoderma reesei.
Trichoderma Reesei Cellulases and Other Hydrolases: Enzyme Structures, Biochemistry,
Genetics and Applications.Foundation of Biotechnical and Industrial Fermentation Research,
Helsinki, Finland, 211-216.
Mahboub Khomami, A., Padasht, Ajili Lahiji, & Shirinfekr. (2019). The effect of sawdust
vermicompost extract on Syngonium podophyllum growth and nutrition. Journal of Plant
Nutrition, 42(4), 410-416.
Mahmud, M., Abdullah, R., & Yaacob, J. (2018). Effect of vermicompost amendment on
nutritional status of sandy loam soil, growth performance, and yield of pineapple (ananas
comosus var. MD2) under field conditions. Agronomy, 8(9), 183.
Márquez-Quiroz, C., López-Espinosa, S. T., Sánchez-Chávez, E., García-Bañuelos, M. L., la Cruz-
Lázaro, D., & Reyes-Carrillo, J. L. (2014). Effect of vermicompost tea on yield and nitrate
reductase enzyme activity in saladette tomato. Journal of Soil Science and Plant Nutrition,
14(1), 223-231.
Marrs, R. H. (1993). Soil fertility and nature conservation in europe: Theoretical considerations
and practical management solutions. Advances in ecological research (pp. 241-300) Elsevier.
Márquez-Quiroz, C., López-Espinosa, S. T., Sánchez-Chávez, E., García-Bañuelos, M. L., la Cruz-
Lázaro, D., & Reyes-Carrillo, J. L. (2014). Effect of vermicompost tea on yield and nitrate
reductase enzyme activity in saladette tomato. Journal of Soil Science and Plant Nutrition,
14(1), 223-231.

165
Masunga, R. H., Uzokwe, V. N., Mlay, P. D., Odeh, I., Singh, A., Buchan, D., & De Neve, S.
(2016). Nitrogen mineralization dynamics of different valuable organic amendments
commonly used in agriculture. Applied Soil Ecology, 101, 185-193.
Martinez-Suller, L., Azzellino, A., & Provolo, G. (2008). Analysis of livestock slurries from farms
across Northern Italy: Relationship between indicators and nutrient content. Biosystems
engineering, 99(4), 540-552.
Mathew, R. P., Feng, Y., Githinji, L., Ankumah, R., & Balkcom, K. S. (2012). Impact of no-tillage
and conventional tillage systems on soil microbial communities. Applied and Environmental
Soil Science.
Matúš, P. (2007). Evaluation of separation and determination of phytoavailable and phytotoxic
aluminium species fractions in soil, sediment and water samples by five different
methods. Journal of inorganic biochemistry, 101(9), 1214-1223.
Matuszewski, B. K., Constanzer, M. L., & Chavez-Eng, C. M. (2003). Strategies for the assessment
of matrix effect in quantitative bioanalytical methods based on HPLC− MS/MS. Analytical
Chemistry, 75(13), 3019-3030.
Maxwell, K., & Johnson, G. N. (2000). Chlorophyll fluorescence—a practical guide. Journal of
experimental botany, 51(345), 659-668.
McLaren, R. G., & Cameron, K. C. (1996). Soil sciencesustainable production and environmental
protection
Mensah, P. Y., Kuffour, R. A., Baidoo, P. K., & Awuah, E. (2013). The effect of different
percentages of bulking agent (sawdust) on microbial quality of faecal sludge. Water science
and technology, 67(8), 1728-1733.
Mohanty, M., Reddy, K. S., Probert, M. E., Dalal, R. C., Rao, A. S., & Menzies, N. W. (2011).
Modelling N mineralization from green manure and farmyard manure from a laboratory
incubation study. Ecological Modelling, 222(3), 719-726.
Monreal, C. M., & Schnitzer, M. (2013). The chemistry and biochemistry of organic components
in the soil solutions of wheat rhizospheres. Advances in agronomy, 121, 179-251.
Moreno, J. L., Ondoño, S., Torres, I., & Bastida, F. (2017). Compost, leonardite, and zeolite
impacts on soil microbial community under barley crops. Journal of soil science and plant
nutrition, 17(1), 214-230.
Naasz, R., Caron, J., Legault, J., & Pichette, A. (2009). Efficiency factors for bark substrates:
Biostability, aeration, or phytotoxicity. Soil Science Society of America Journal, 73(3), 780-
791.
Nagavallemma, K. P., Wani, S. P., Lacroix, S., Padmaja, V. V., Vineela, C., Rao, M. B., &

166
Sahrawat, K. L. (2004). Vermicomposting, Recycling wastes into valuable organic fertilizer.
global theme on agroecosystems report no. 8.
Ndegwa, P. M., Thompson, S. A., & Das, K. C. (2000). Effects of stocking density and feeding
rate on vermicomposting of biosolids. Bioresource technology, 71(1), 5-12.
Nickels, J. S., King, J. D., & White, D. C. (1979). Poly-β-hydroxybutyrate accumulation as a
measure of unbalanced growth of the estuarine detrital microbiota. Appl. Environ.
Microbiol., 37(3), 459-465.
Nova Scotia Department of Agriculture. (2010). Understanding a Compost Test Report. Retrieved
from https,//novascotia.ca/agri/documents/lab-services/analytical-lab-manure-compost-
report.pdf
NRCS, U. (1998). Soil quality information sheet, soil quality indicators, PH.Retrieved from
https,//web.extension.illinois.edu/soil/sq_info/ph.pdf
Palaniappan, S., Alagappan, M., & Rayar, S. (2018). Influence of substrate particle size on
vermicomposting of pre-processed vegetable waste. Nature Environment & Pollution
Technology, 17(1)
Papatheodorou, E. M., Kordatos, H., Kouseras, T., Monokrousos, N., Menkissoglu-Spiroudi, U.,
Diamantopoulos, J., ... & Argyropoulou, M. D. (2012). Differential responses of structural and
functional aspects of soil microbes and nematodes to abiotic and biotic modifications of the
soil environment. Applied soil ecology, 61, 26-33.
Parle, J. N. (1963). A microbiological study of earthworm casts. Microbiology, 31(1), 13-22.
Pathma, J., & Sakthivel, N. (2012). Microbial diversity of vermicompost bacteria that exhibit useful
agricultural traits and waste management potential. SpringerPlus, 1(1), 26.
Paul, E. A. (2007). Soil microbiology, ecology, and biochemistry in perspective. Soil microbiology,
ecology and biochemistry (third edition) (pp. 3-24) Elsevier.
Paul, E. A. (2014). Soil microbiology, ecology and biochemistry Academic press.
Pérez-Piqueres, A., Edel-Hermann, V., Alabouvette, C., & Steinberg, C. (2006). Response of soil
microbial communities to compost amendments. Soil Biology and Biochemistry, 38(3), 460-
470.
Pham, T. H., Zaeem, M., Fillier, T. A., Nadeem, M., Vidal, N. P., Manful, C., Cheema, S., Cheema,
M., & Thomas, R. H. (2019). Targeting modified lipids during routine lipidomics analysis
using HILIC and C30 reverse phase liquid chromatography coupled to mass spectrometry.
Scientific Reports, 9(1), 5048.

167
Pinto, E., Almeida, A. A., Aguiar, A. A., & Ferreira, I. M. (2015). Comparison between the mineral
profile and nitrate content of microgreens and mature lettuces. Journal of Food Composition
and Analysis, 37, 38-43.
Poldma, P., Jaakson, K., Merivee, A., & Albrecht, A. (2000). Trichoderma viride promotes growth
of cucumber plants. Transactions of the Estonian Agricultural University, Agronomy, (209),
162-164.
Quilty, J. R., & Cattle, S. R. (2011). Use and understanding of organic amendments in australian
agriculture: A review. Soil Research, 49(1), 1-26.
Ramnarain, Y. I., Ori, L., & Ansari, A. A. (2018). Effect of the use of vermicompost on the plant
growth parameters of Pak choi (Brassica rapa var. chinensis) and on the soil structure in
Suriname. Journal of Global Agriculture and Ecology, 8(1), 8-15.
Raviv, M., Chen, Y., & Inbar, Y. (1986). Peat and peat substitutes as growth media for container-
grown plants. The role of organic matter in modern agriculture (pp. 257-287) Springer.
Reid, G., & Wong, P. (2005). SOIL BACTERIA AND FUNGI — NEW SOUTH WALES. Retrieved
from http://www.soilquality.org.au/factsheets/soil-bacteria-and-fungi-nswRobertson, R. A.,
Buckland, P. C., Lindsay, R. A., Barber, K. E., Wohlsein, P., Trautwein, G., . . . Zimmermann,
F. K. (1993). 2687501. peat, horticulture and environment. Biodiversity and Conservation,
2(5), 541-547.
Rojas-Downing, M. M., Nejadhashemi, A. P., Harrigan, T., & Woznicki, S. A. (2017). Climate
change and livestock: Impacts, adaptation, and mitigation. Climate Risk Management, 16, 145-
163.
Ros, M., Hernandez, M. T., & Garcı́a, C. (2003). Soil microbial activity after restoration of a
semiarid soil by organic amendments. Soil Biology and Biochemistry, 35(3), 463-469.
Sanchez, D. F., Pastor, A., Rossing, W., Kropff, M. J., & Lantinga, E. A. (2016). Decomposition,
N contribution and soil organic matter balances of crop residues and vermicompost in maize-
based cropping systems in southwest mexico. Journal of Soil Science and Plant Nutrition,
16(3), 801-817.
Sasek, V., Glaser, J. A., & Baveye, P. (2012). The utilization of bioremediation to reduce soil
contamination: Problems and solutions. Springer Science & Business Media.
Sawan, O. M., & Eissa, A. M. (1995). Sawdust as an alternative to peat moss media for cucumber
seedlings production in greenhouses. Strategies for Market Oriented Greenhouse Production
434, 127-138.
Schimel, J. P., Jackson, L. E., & Firestone, M. K. (1989). Spatial and temporal effects on plant-
microbial competition for inorganic nitrogen in a california annual grassland. Soil Biology and
Biochemistry, 21(8), 1059-1066.

168
Schindlbacher, A., Rodler, A., Kuffner, M., Kitzler, B., Sessitsch, A., & Zechmeister-Boltenstern,
S. (2011). Experimental warming effects on the microbial community of a temperate mountain
forest soil. Soil Biology and Biochemistry, 43(7), 1417-1425.
Scotti, R., Bonanomi, G., Scelza, R., Zoina, A., & Rao, M. A. (2015). Organic amendments as
sustainable tool to recovery fertility in intensive agricultural systems. Journal of soil science
and plant nutrition, 15(2), 333-352.
Scotti, R., Conte, P., Berns, A. E., Alonzo, G., & Rao, M. A. (2013). Effect of organic amendments
on the evolution of soil organic matter in soils stressed by intensive agricultural
practices. Current Organic Chemistry, 17(24), 2998-3005.
Sheng, M., Hamel, C., & Fernandez, M. R. (2012). Cropping practices modulate the impact of
glyphosate on arbuscular mycorrhizal fungi and rhizosphere bacteria in agroecosystems of the
semiarid prairie. Canadian Journal of Microbiology, 58(8), 990-1001.
Shi-Wei, Z., & Fu-Zhen, H. (1991). The nitrogen uptake efficiency from 15N labeled chemical
fertilizer in the presence of earthworm manure (cast). Advances in management and
conservation of soil fauna, 539-542.
Shoresh, M., Harman, G. E., & Mastouri, F. (2010). Induced systemic resistance and plant
responses to fungal biocontrol agents. Annual Review of Phytopathology, 48, 21-43.
Sinha, P. B. (2019). Innovative Waste Management Technologies for Sustainable Development.
Singh, R., Gupta, R. K., Patil, R. T., Sharma, R. R., Asrey, R., Kumar, A., & Jangra, K. K. (2010).
Sequential foliar application of vermicompost leachates improves marketable fruit yield and
quality of strawberry (fragaria× ananassa duch.). Scientia Horticulturae, 124(1), 34-39.
Singh, S., Singh, J., & Vig, A. P. (2016). Earthworm as ecological engineers to change the physico-
chemical properties of soil: Soil vs vermicast. Ecological Engineering, 90, 1-5.
Sinha, R. K. (2009). No title. Earthworms: The Miracle of Nature (Charles Darwin’s ‘unheralded
Soldiers of Mankind & Farmer’s Friends’),Sriakilam, C., Saseetharan, M. K., & Jeyapriya, S.
P. (2016). Studies on aerobic compost from the solid waste generated in coimbatore city,
tamilnadu, india. Nature Environment and Pollution Technology, 15(2), 393.
Smith, D. C., Beharee, V., & Hughes, J. C. (2001). The effects of composts produced by a simple
composting procedure on the yields of Swiss chard (beta vulgaris L. var. flavescens) and
common bean (phaseolus vulgaris L. var. nanus). Scientia Horticulturae, 91(3-4), 393-406.
Spring, S., Schulze, R., Overmann, J., & Schleifer, K. (2000). Identification and characterization
of ecologically significant prokaryotes in the sediment of freshwater lakes: Molecular and
cultivation studies. FEMS Microbiology Reviews, 24(5), 573-590.
Steger, K., Sjögren, Å M., Jarvis, Å, Jansson, J. K., & Sundh, I. (2007). Development of compost

169
maturity and actinobacteria populations during full‐scale composting of organic household
waste. Journal of Applied Microbiology, 103(2), 487-498.
Taguchi, R., & Ishikawa, M. (2010). Precise and global identification of phospholipid molecular
species by an orbitrap mass spectrometer and automated search engine lipid search. Journal
of Chromatography A, 1217(25), 4229-4239.
Tejada, M., Gonzalez, J. L., Hernandez, M. T., & Garcia, C. (2008). Agricultural use of leachates
obtained from two different vermicomposting processes. Bioresource Technology, 99(14),
6228-6232.
Tiwari, S. C., & Mishra, R. R. (1993). Fungal abundance and diversity in earthworm casts and in
uningested soil. Biology and Fertility of Soils, 16(2), 131-134.
Topolovec-Pintaric, S., ka Zutic, I., & Dermic, E. (2013). Enhanced growth of cabbage and red
beet by Trichoderma viride\Pospesena rast zelja in rdece pese z dodatkom glive Trichoderma
viride. Acta Agriculturae Slovenica, 101(1), 87.
Trinsoutrot, I., Recous, S., Bentz, B., Lineres, M., Cheneby, D., & Nicolardot, B. (2000).
Biochemical quality of crop residues and carbon and nitrogen mineralization kinetics under
nonlimiting nitrogen conditions.
Tzortzakis, N. G., & Economakis, C. D. (2008). Impacts of the substrate medium on tomato yield
and fruit quality in soilless cultivation. Horticultural Science, 35(2), 83-89.
United Nations, Department of Economic and Social Affairs, Population Division. (2019). World
population prospects 2019: Highlights.
USDA PLANTS Database. (2017). "PLANTS Database Advanced Search using minimum and
maximum pH". plants.usda.gov. USDA NCRS. Retrieved from
https,//plants.usda.gov/adv_search.html
Vano, I., Matsushima, M., Tang, C., & Inubushi, K. (2011). Effects of peat moss and sawdust
compost applications on N2O emission and N leaching in blueberry cultivating soils. Soil
Science and Plant Nutrition, 57(2), 348-360.
Velázquez-Robledo, R., Contreras-Cornejo, H. A., Macías-Rodríguez, L., Hernández-Morales, A.,
Aguirre, J., Casas-Flores, S., . . . Herrera-Estrella, A. (2011). Role of the 4-
phosphopantetheinyl transferase of trichoderma virens in secondary metabolism and induction
of plant defense responses. Molecular Plant-Microbe Interactions, 24(12), 1459-1471.
Vidal, N. P., Pham, H. T., Manful, C., Pumphrey, R., Nadeem, M., Cheema, M., . . . Thomas, R.
(2018). The use of natural media amendments to produce kale enhanced with functional lipids
in controlled environment production system. Scientific Reports, 8(1), 14771.
Volkman, J. (2003). Sterols in microorganisms. Applied microbiology and Biotechnology, 60(5),

170
495-506.
Wang, D., Shi, Q., Wang, X., Wei, M., Hu, J., Liu, J., & Yang, F. (2010). Influence of cow manure
vermicompost on the growth, metabolite contents, and antioxidant activities of chinese
cabbage (brassica campestris ssp. chinensis). Biology and Fertility of Soils, 46(7), 689-696.
Wang, X., Wang, X., Zhang, W., Shao, Y., Zou, X., Liu, T., ... & Fu, S. (2016). Invariant
community structure of soil bacteria in subtropical coniferous and broadleaved
forests. Scientific reports, 6(1), 1-11.
Weber, J., Karczewska, A., Drozd, J., Licznar, M., Licznar, S., Jamroz, E., & Kocowicz, A. (2007).
Agricultural and ecological aspects of a sandy soil as affected by the application of municipal
solid waste composts. Soil Biology and Biochemistry, 39(6), 1294-1302.
White, D. C., Flemming, C. A., Leung, K. T., & Macnaughton, S. J. (1998). In situ microbial
ecology for quantitative appraisal, monitoring, and risk assessment of pollution remediation
in soils, the subsurface, the rhizosphere and in biofilms. Journal of Microbiological Methods,
32(2), 93-105. doi:10.1016/S0167-7012(98)00017-7
White, D. C., Lytle, C., Peacock, A., Chang, Y. J., Almeida, J. S., Gan, Y.D., (n.d.). Rapid Lipid
Biomarker Analysis for Quantitative Assessment of Microbial Community Composition and
Activity [Presentation slides]. Retrieved from http://davidcwhite.org/ppt/Vandy01.ppt
White, D. C., Stair, J. O., & Ringelberg, D. B. (1996). Quantitative comparisons ofin situ microbial
biodiversity by signature biomarker analysis. Journal of Industrial Microbiology, 17(3-4),
185-196.
White, P. M., & Rice, C. W. (2009). Tillage effects on microbial and carbon dynamics during plant
residue decomposition. Soil Science Society of America Journal, 73(1), 138-145.
White, R. E. (2013). Principles and practice of soil science, The soil as a natural resource John
Wiley & Sons.
Wu, X., Wu, F., Zhou, X., Fu, X., Tao, Y., Xu, W., ... & Liu, S. (2016). Effects of intercropping
with potato onion on the growth of tomato and rhizosphere alkaline phosphatase genes
diversity. Frontiers in plant science, 7, 846.
Xiao, Z., Lester, G. E., Luo, Y., & Wang, Q. (2012). Assessment of vitamin and carotenoid
concentrations of emerging food products: edible microgreens. Journal of agricultural and
food chemistry, 60(31), 7644-7651.
Yao, H., He, Z. L., Wilson, M., & Campbell, C. D. (2000). Microbial biomass and community
structure in a sequence of soils with increasing fertility and changing land use. Microbial
Ecology, 40(3), 223-237.

171
Yedidia, I., Srivastva, A. K., Kapulnik, Y., & Chet, I. (2001). Effect of Trichoderma harzianum on
microelement concentrations and increased growth of cucumber plants. Plant and soil, 235(2),
235-242.
Zaccardelli, M., De Nicola, F., Villecco, D., & Scotti, R. (2013). The development and suppressive
activity of soil microbial communities under compost amendment. Journal of soil science and
plant nutrition, 13(3), 730-742.
Zaeem, M., Nadeem, M., Pham, T. H., Ashiq, W., Ali, W., Gilani, S. S. M., . . . Galagedara, L.
(2019). The potential of corn-soybean intercropping to improve the soil health status and
biomass production in cool climate boreal ecosystems. Scientific Reports, 9(1), 1-17.
Zaller, J. G. (2007). Vermicompost as a substitute for peat in potting media: Effects on germination,
biomass allocation, yields and fruit quality of three tomato varieties. Scientia Horticulturae,
112(2), 191-199.
Zelles, L. (1999). Fatty acid patterns of phospholipids and lipopolysaccharides in the
characterisation of microbial communities in soil: A review. Biology and Fertility of Soils,
29(2), 111-129.
Zhang, B., Zhao, R., Bi, B., & Han, F. (2017). Responses of soil microbial communities to robinia
pseudoacacia plantations of different ages in A loess area.
Zhang, Q., Wu, J., Yang, F., Lei, Y., Zhang, Q., & Cheng, X. (2016). Alterations in soil microbial
community composition and biomass following agricultural land use change. Scientific
reports, 6, 36587.
Copyright © 2022 FDOKUMEN