What explains vast differences in jumping power within a ...
Upload
independentCategory
view
2download
0
EFFECTS OF STRENGTH AND POWER TRAINING ON
NEUROMUSCULAR ADAPTATIONS AND JUMPING
MOVEMENT PATTERN AND PERFORMANCE
LEONARDO LAMAS,1 CARLOS UGRINOWITSCH,1 ANDRE RODACKI,2 GLEBER PEREIRA,3
EUGENIA C.T. MATTOS,4 ANDRE F. KOHN,4 AND VALMOR TRICOLI1
1Department of Sport, School of Physical Education and Sport, University of Sao Paulo, Sao Paulo, Brazil; 2Department ofPhysical Education, Federal University of Parana, Parana, Brazil; 3Department of Biological and Health Science, PositivoUniversity, Parana, Brazil; and 4Biomedical Engineering Laboratory, University of Sao Paulo, Sao Paulo, Brazil
ABSTRACT
Lamas, L, Ugrinowitsch, C, Rodacki, A, Pereira, G, Mattos, ECT,
Kohn, AF, and Tricoli, V. Effects of strength and power training
on neuromuscular adaptations and jumping movement pattern
and performance. J Strength Cond Res 26(12): 3335–3344,
2012—This study aimed at comparing the effects of strength
and power training (ST and PT) regimens on neuromuscular
adaptations and changes on vertical jump performance,
kinetics, and kinematics parameters. Forty physically active
men (178.2 6 7.0 cm; 75.1 6 8.6 kg; 23.6 6 3.5 years) with at
least 2 years of ST experience were assigned to an ST (n = 14),
a PT (n = 14), or a control group (C; n = 12). The training
programs were performed during 8 weeks, 3 times per week.
Dynamic and isometric maximum strength, cross-sectional area,
and muscle activation were assessed before and after the
experimental period. Squat jump (SJ) and countermovement
jump (CMJ) performance, kinetics, and kinematics parameters
were also assessed. Dynamic maximum strength increased
similarly (p , 0.05) for the ST (22.8%) and PT (16.6%) groups.
The maximum voluntary isometric contraction increased for the
ST and PT groups (p , 0.05) in the posttraining assessments.
There was a main time effect for muscle fiber cross-sectional
area (p , 0.05), but there were no changes in muscle
activation. The SJ height increased, after ST and PT, because
of a faster concentric phase and a higher rate of force
development (p , 0.05). The CMJ height increased only after
PT (p , 0.05), but there were no significant changes in its
kinetics and kinematics parameters. In conclusion, neuromus-
cular adaptations were similar between the training groups. The
PT seemed more effective than the ST in increasing jumping
performance, but neither the ST nor the PT was able to affect
the SJ and the CMJ movement pattern (e.g., timing and
sequencing of joint extension initiation).
KEY WORDS jump performance, muscle biopsy, rate of force
development, squat exercise, electromyography
INTRODUCTION
Identifying the appropriate training load to improvemuscle strength and power is critical for many sports.Generally, it has been suggested that exercisesperformed with high load and low movement velocity
are recommended for maximum strength improvement (i.e.,strength training [ST]), whereas low load and high movementvelocity exercises are prescribed for power productionaugmentation (i.e., power training [PT]) (17).
A few authors have questioned such recommendationsbecause of equivocal results regarding performance incre-ments after short-term ST and PT protocols (10,22). Forinstance, there is evidence of similar strength gains whencomparing STand PTeffects (13,22). Moreover, some studieshave described increases in the rate of force development(RFD) (1) (RFD ¼ DF�Dt21) and improvements in jumpingheight (18,30) after both training regimens. Most impor-tantly, these changes in performance were obtained havingdifferences in total work performed between the ST and PTregimens. However, to the best of our knowledge, no studyhas attempted to elucidate the mechanisms behind perfor-mance enhancement.
Previous work supports the concept of greater muscle fiberhypertrophy and motor unit activation after ST than PTregimens (1,9,18). On the other hand, decreased motor unitactivation threshold and increased initial firing rate of theactive motor units have been demonstrated after PT (11).Thus, it is feasible that the similar performance improve-ments reported by others may have been achieved throughdistinct neuromuscular adaptations. Furthermore, a corollaryhypothesis is that these distinct adaptations may producedifferent adjustments in kinematic and kinetic parameters
Address correspondence to Leonardo Lamas, [email protected].
26(12)/3335–3344
Journal of Strength and Conditioning Research� 2012 National Strength and Conditioning Association
VOLUME 26 | NUMBER 12 | DECEMBER 2012 | 3335
Copyright © National Strength and Conditioning Association Unauthorized reproduction of this article is prohibited.

that would change the movement pattern of a specific skill,such as the vertical jump.
Bobbert and Van Soest (7) described the effects ofenhancing the muscle force production capacity in thevertical jump, in a simulation study. These authors suggestedthat increasing the muscle force production capacity requiresadjustments in the activation pattern of the lower limbmuscles to maximize jumping height. When the neural driveto the muscles was not adjusted, jumping height decreased(7). On the other hand, Rodacki et al. (27) changed theapproach and tested if decreasing the muscle output capacity(i.e., fatigue) would affect the jumping movement pattern, ina human model. These authors concluded that even thoughthere was a drop in jumping height and muscle forceproduction capacity, the movement pattern of the skill wasvery consistent stereotyped (27). Thus, it is not clear ifchanging the muscle force production capacity would affectthe jumping movement pattern, in human training models.
Taking together it is conceivable to hypothesize that (a) STand PT may increase muscle force production capacitysimilarly; (b) there should be similar increments in jumpingheight when comparing these training regimens; and (c) STand PT regimen–induced adaptations would not affect thejumping movement pattern.
Therefore, this study aimed at comparing the effects of STand PT regimens on muscle force production capacity,neuromuscular adaptations, vertical jump height, and possiblechanges in jumping movement pattern.
METHODS
Experimental Approach to the Problem
The subjects were divided into an STgroup, a PT group, anda control group (C). Then, muscle force production capacity,neuromuscular adaptations, jumping height, and jumpingmovement pattern were compared pretraining and posttrain-ing period, to test the effects of STand PTregimens. Dynamicmuscle force production capacity was assessed in the squat 1repetition maximum (1RM) test. Moreover, a maximumvoluntary isometric contraction (MVIC) was assessed in
a horizontal leg press test, in which every attempt was madeto develop force as quickly as possible. Electromyographicsignals were recorded from the vastus lateralis (VL) and vastusmedialis (VM) muscles during the MVIC test. Muscle biopsieswere obtained from the VL to assess muscle fiber type andcross-sectional area. Jumping performance was measured inboth the squat jump (SJ) and in the countermovement jump(CMJ). Jumping movement pattern was evaluated throughthe following kinematic and kinetic parameters: eccentricphase duration and center of mass displacement (CMJ), andconcentric phase duration and center of mass displacement(SJ and CMJ); angular displacements and velocities of theankle, knee, and hip joints during the eccentric (CMJ) andconcentric (SJ and CMJ) phases, the temporal sequence of theankle, knee, and hip joints angular displacement initiation (i.e.,joint activation sequence), in both the SJ and CMJ, and the netjoint moments during the eccentric (CMJ) and concentric(SJ and CMJ) phases. Electrical activity of the VL and VMmuscles was also assessed in the eccentric (CMJ) andconcentric (SJ and CMJ) phases of the vertical jump.
Subjects
Forty physically active men from the local communityvolunteered to participate in the study. They had at least 2years of ST experience, and they were all involved inrecreational sports 4 d�wk21. Training and testing sessionswere always performed in the morning, 2 hours after the lastmeal and at a temperature between 22 and 24� C. None of thesubjects was using nutritional supplements or steroids.Initially, the subjects were classified into quartiles accordingto their relative strength (squat 1 RM body mass 21), and thenindividuals from each quartile were randomly assigned to thefollowing experimental groups: STgroup (n = 14, 178.7 6 4.3cm, 75.2 6 7.3 kg, and 22.5 6 3.8 years); PT group (n = 14,177.0 6 5.9 cm, 76.0 6 8.9 kg, and 24.2 6 4.1 years), and Cgroup (n = 12, 178.9 6 11.0 cm, 74.1 6 9.6 kg, and 24.1 6 2.7years). Before participating in the study, the subjects wereinformed of the potential risks and benefits and providedwritten informed consent to participate in accordance with
Figure 1. Time line of the study design. The control test (i.e., squat exercise 1 repetition maximum [1RM] test) at the end of the third and sixth weeks wasperformed to adjust power training (PT) training intensities. The posttest was performed 48–72 hours after training end. The control group did not participate ofthe 8 weeks of training either the control tests.
3336 Journal of Strength and Conditioning Researchthe TM
Effects of Strength and Power Training on Jumping Performance
Copyright © National Strength and Conditioning Association Unauthorized reproduction of this article is prohibited.

the policies and procedures of the institution’s ResearchEthics Committee for use of human subjects in research.
Procedures
In the familiarization and pretest period (week 1), thefollowing variables were assessed: (a) CMJ and SJ: jumpingheight, kinematic and kinetic parameters, MVIC, maximumRFD, and electromyography (EMG) activity on Monday; (b)squat exercise 1RM on Tuesday; and (c) biopsy of the VLmuscle on Thursday. At the end of weeks 3 and 6, squatexercise 1RM was reassessed to adjust the training load of thePT group. Posttraining assessments were performed in theweek after training termination (i.e., week 10). The biopsy ofthe VL muscle was performed on Wednesday. Figure 1provides a schematic representation of the study design.
Squat Exercise One Repetition Maximum
To determine the maximal dynamic strength (1RM test) inthe squat exercise, the subjects performed 2 familiarizationsessions to get acquainted with the specific experimentalprocedures. The 1RM squat test was performed accordingto standard procedures described elsewhere (8). In short,
the subjects ran for 5 minutes on a treadmill (MovementTechnology, Brudden, Sao Paulo, Brazil) at 9 km�h21,followed by 5 minutes of lower limb light stretchingexercises. Then, they performed 2 squat warm-up sets. Inthe first one, the subjects performed 5 repetitions with50% of the estimated 1RM and in the second set performed3 repetitions with 70% of the estimated 1RM, with a 3-minute resting interval between them. Three minutes afterwarm-up, the subjects were requested to execute up to5 trials to obtain the squat exercise 1RM load (e.g.,maximum weight that could be lifted once with a propertechnique). A 3-minute interval was granted betweenattempts (8).
Maximal Voluntary Isometric Contraction
Maximal voluntary isometric contraction was assessed usinga custommade horizontal leg press device fixed on the walland a load cell attached between the device and the wall(Figure 2). The subjects laid down with their feet resting onthe wall. The hip and knee joints were positioned at angles of100 and 95�, respectively. Movement restricting pads wereadjusted at the shoulders to allow applying isometric forceto the wall at the preset joint angles. Velcro straps were fixedat the subjects’ waistline and at the shank to avoidunnecessary movements and changes in body position.
The subjects were instructed to perform 5 attempts exertingmaximum force as rapidly as possible and to sustain the effortfor 3 seconds. Visual feedback of the force-time curves wasprovided to the subjects after each trial. The EMG activity wasrecorded during the MVIC test using the same setup describedbefore. The trial with the highest MVIC was used for furtheranalysis. The RFD (= DF�Dt 21) was determined from theforce initiation instant (greater than the mean resting valueplus 2SDs of the mean resting value) up to 100 milliseconds.
Muscle Biopsy
Unilateral muscle samples were taken from the midportion ofthe VL of the subjects’ right leg using the percutaneous biopsytechnique (6) with suction. Thereafter, muscle tissue wasoriented in tragacanth gum, immediately frozen in isopen-tane cooled to the temperature of liquid nitrogen and then
stored at 280� C. The firstmuscle biopsy occurred 48hours after the pretest andapproximately 4 days beforethe start of the training period.The posttest biopsy was takenthrough an incision adjacent tothe pretest site 48–72 hoursafter the last training session.
Muscle Fiber Area
Pretraining and posttrainingtransverse sections were as-sayed simultaneously for mAT-Pase activity. Muscle section
Figure 2. Custommade horizontal leg press device for the maximumvoluntary isometric contraction (MVIC) test.
TABLE 1. Training protocols for the strength training group.
Week Monday Wednesday Friday
1 4 3 10 4 3 10 4 3 102 2 3 10; 3 3 8 3 3 8; 2 3 6 2 3 10; 3 3 83 3 3 8; 3 3 6 3 3 8; 3 3 6 3 3 8; 3 3 64 2 3 10; 2 3 8; 2 3 6 2 3 10; 2 3 8; 2 3 6 2 3 10; 2 3 8; 2 3 65 1 3 8; 3 3 6; 3 3 4 3 3 6; 4 3 4 4 3 6; 3 3 46 4 3 6; 4 3 4 4 3 6; 4 3 4 4 3 6; 4 3 47 3 3 6; 3 3 4 3 3 6; 3 3 4 3 3 6; 3 3 48 2 3 6; 2 3 4 2 3 6; 2 3 4 2 3 6; 2 3 4
VOLUME 26 | NUMBER 12 | DECEMBER 2012 | 3337
Journal of Strength and Conditioning Researchthe TM
| www.nsca.com
Copyright © National Strength and Conditioning Association Unauthorized reproduction of this article is prohibited.

images with different mATPase preparations were capturedon computer with imaging software (Image PRO Plus, MediaCybernetics�, USA). Six fiber types (I, Ic, IIc, IIa, IIax, and IIx)were distinguished (9). As types Ic, IIc, and IIab frequencieswere very small, we decided to group the muscle fibers forstatistical purposes, as follows: type I (I and Ic), type IIa (IIc,IIa, and ½ IIab), and type IIx (IIx and ½ IIab). Muscle fibertype (I, IIa, IIx) cross-sectional area was determined usingcomputerized planimetry (Image PRO Plus, Media Cyber-netics). Averages of 171.78 6 72.21 and 162.42 6 62.78 fiberswere measured per participant in the pretests and posttests,respectively.
Squat and Countermovement Jumps Tests
Before the jump tests, the subjects performed a general warm-up, which consisted of 5 minutes of lower limb light stretchingexercises and 5 submaximal SJ and CMJ attempts. Thereafter,they performed 5 maximal SJ and 5 maximal CMJ on theforce platform. In the SJ, a static position with a 90� knee
flexion angle was held for 2 seconds before jumping initiation.The SJ trials were excluded if any preparatory movementcould be observed in the vertical ground reaction force signal.In the CMJ, the subjects were instructed to performa downward movement followed by a forceful extension ofthe lower limb joints (i.e., ankle, knee, and hip). The amplitudeof the countermovement was self-selected to elude interfer-ences in the jumping movement pattern. The hands werekept on the waist during both jumping tests. Rest intervalbetween jumps was of 30 seconds, whereas a 3-minute restwas allowed between techniques. The SJ and CMJ wereperformed in a counterbalanced order between subjects toavoid order effects.
Jumping Movement Pattern
Video, EMG, and force plate data were temporally alignedusing a custommade Visual Basic program. Then, bodyweight was determined taking the average value of the verticalground reaction force data over 500 data collection points,while subjects were standing quietly on the force platform(32). The SD of the body weight signal was also calculatedover this interval. The average and SD of the baseline verticalground reaction force was determined taking 200 datacollection points during the flight time, for both jumps.
The beginning of the SJ movement was considered as theinstant in which the vertical ground reaction force increased.5SDs of the subjects’ body weight. The take-off wasdetermined as the instant that subjects’ body weight returnedto the baseline values plus 5SDs (31). During the CMJ,movement duration was analyzed in the negative-eccentricphase (NEG) and positive-concentric phase (POS). Theinitiation of negative phase was defined as the instant inwhich the vertical force dropped below 5SDs of the subjects’average body weight. The end of the negative phase (i.e.,beginning of the positive phase) was defined as the instant inwhich the net impulse of the unweighting phase was equal tothe net impulse over body weight (26). The end of the
TABLE 2. Training protocols for power training group.*
Week Monday Wednesday Friday
1 4 3 8 (30%) 4 3 8 (30%) 4 3 8 (30%)2 3 3 8 (30%); 2 3 8 (40%) 3 3 8 (40%); 2 3 6 (50%) 3 3 8 (30%); 2 3 8 (40%)3 3 3 8 (40%); 3 3 6 (50%) 3 3 8 (40%); 3 3 6 (50%) 3 3 8 (40%); 3 3 6 (50%)4 2 3 8 (30%); 2 3 8 (40%);
2 3 6 (50%)2 3 8 (30%); 2 3 8 (40%);
2 3 6 (50%)2 3 8(30%); 2 3 8 (40%);
2 3 6(50%)5 2 3 8 (30%); 3 3 8 (40%);
2 3 6 (50%)3 3 8 (40%); 4 3 6 (60%) 3 3 8 (30%); 2 3 6 (50%);
2 3 6 (60%)6 4 3 8 (30%); 4 3 6 (60%) 4 3 8 (40%); 4 3 6 (50%) 4 3 8 (30%); 4 3 6 (60%)7 3 3 8 (40%); 3 3 6 (60%) 2 3 8 (40%); 4 3 6 (60%) 2 3 8 (40%); 4 3 6 (60%)8 2 3 8 (40%); 2 3 6 (50%) 2 3 8 (40%); 2 3 6 (50%) 2 3 8 (40%); 2 3 6 (50%)
*Percentage within parentheses indicates the training load (% 1 repetition maximum).
Figure 3. Mean (6SD) squat exercise maximum strength (1 repetitionmaximum [1RM]) for the strength training (ST), power training (PT), andcontrol (C) groups at pretest and posttest. a) p , 0.001 posttest greaterthan the pretest; b) p , 0.05 greater than the C group at the posttest.
3338 Journal of Strength and Conditioning Researchthe TM
Effects of Strength and Power Training on Jumping Performance
Copyright © National Strength and Conditioning Association Unauthorized reproduction of this article is prohibited.

positive phase (i.e., take-off instant) was determined usingsimilar procedures applied to SJ. The concentric impulse wascalculated by integrating the net vertical component of theground reaction force over time, during the positive phase ofthe SJ and CMJ. Vertical jumping height was calculatedthrough the impulse-momentum theorem, described else-where (20). The RFD during the SJ was determined fromthe movement initiation to peak force. The RFD during theCMJ was calculated from the minimum force during theunweighting phase up to peak force (31).
The vertical and horizontal ground reaction forces weretime aligned with kinematics video data to calculate netmoments at the ankle, knee, and hip joints. Extensor momentswere considered positive for all the joints. The moment ofinertia of each segment was estimated by Drillis and Contini’sequations (34). If the movement of a proximal segmentpreceded the movement of its distal counterpart (i.e.,a proximal-to-distal order), the time difference, betweenthe IEX, would be negative. The ankle, knee, and hip jointangles and velocities at take-off instant were also deter-mined. The linear envelope of the EMG signal from the VLand VM muscles obtained during the CON phase of both SJand CMJ was normalized by the values obtained in theisometric leg press.
Training Protocols
Both training groups performed an 8-week protocol with 3training sessions per week, always on Mondays, Wednesdays,and Fridays. The ST group trained with intensities between10RM and 4RM, whereas the PT group trained withintensities between 30 and 60% of 1RM. The ST grouptrained using the RM approach because individuals usuallyhave a high variability in the maximum number of repetitionsthat they can perform with the same relative intensity (e.g.,80% of the 1RM). On the other hand, a percentage of the1RM was used to prescribe the training loads for the PTgroupfor 2 main reasons: (a) most of the research on PT prescribestraining loads from 30 to 60% of the 1RM for a specificexercise (15,33), and (b) in regular PT protocols, the subjectsdo not train to failure; thus, the load for a specific number ofrepetitions cannot be determined. Both groups wereinstructed to perform each repetition of the squat exerciseas fast as possible. Nonetheless, it was expected a decrease inmovement velocity at higher percentages of the exercise1RM load, as described elsewhere (16). Training intensitiesprogressed through the 8-week period following a periodizedmodel. Tables 1 and 2 display the training protocols for theST and PT groups, respectively.
Even though the ST group trained based on repetitions,squat exercise was assessed every 2 weeks (i.e., control tests)for all the subjects with the purpose of adjusting the loads ofthe PT group, if necessary.
Instrumentation
Electromyography Signal Recording. Electromyographic signalswere collected using Ag/AgCl circular electrode pairs (MEB
TA
BL
E3
.M
ean
(6S
D)
MV
ICan
dR
FD
for
ST
,P
T,
and
Cg
roup
sat
pre
test
and
po
stte
stin
the
iso
met
richo
rizo
ntal
leg
pre
sste
st.*
ST
(n=
14
)P
T(n
=1
4)
C(n
=1
2)
Pre
Po
stP
reP
ost
Pre
Po
st
RF
D(N�s
21)
1,1
20
.80
(64
39
.46
)1
,12
4.7
8(6
39
6.1
3)
1,1
58
.86
(63
28
.49
)1
,34
0.3
7(6
27
6.0
4)
1,2
67
.61
(63
75
.09
)7
16
.46
(64
47
.78
)M
VIC
(N)
2,2
40
.52
(64
48
.76
)2
,65
1.8
2†
(67
00
.22
)2
,24
9.8
6(6
42
7.9
5)
2,6
74
.80
†(6
50
7.6
8)
2,3
59
.72
(63
75
.11
)2
,32
3.3
5(6
54
3.0
9)
*MV
IC=
max
imal
volu
ntar
yis
om
etric
cont
ract
ion;
RF
D=
rate
of
forc
ed
evel
op
men
t;S
T=
stre
ngth
trai
ning
;P
T=
po
wer
trai
ning
;C
=co
ntro
l.†p
,0
.05
sig
nific
antly
diff
eren
tfr
om
pre
test
.
VOLUME 26 | NUMBER 12 | DECEMBER 2012 | 3339
Journal of Strength and Conditioning Researchthe TM
| www.nsca.com
Copyright © National Strength and Conditioning Association Unauthorized reproduction of this article is prohibited.

4200, Nihon-Kohde, Foothill Ranch, CA, USA), with aninterelectrode distance of 2 cm. Recording electrodes wereattached to the belly of the VL and of the VM muscles (26).Electrodes were aligned to the expected muscle fiberorientation. A ground electrode was positioned at the medialshaft of the tibia. Before electrode placement, the skin wasshaved and then abraded and cleaned with an isopropylalcohol pad to reduce impedance ,5 kV. Electrodeplacement was marked in the skin with permanent ink to
guarantee reliable placementbetween measurement sessions.The EMG signals were col-lected at 4,800 Hz, differentiallyamplified with a gain of 1,000and a bandwidth of 20–500 Hzat 3 dB. The EMG amplifiershad an input noise ,1 mV rootmean square and an effectivecommon rejection mode of85 dB. The EMG signal wasrectified, filtered with a fourth-order Butterworth digital filterat 6 Hz, and integrated.
Force Plate Recording. Forceplate was calibrated witha known weight in a daily basis.Voltage readings were trans-
formed to force units in the custommade software usingthe calibration matrix of the force platform (modelOR6-7-1000, AMTIO, Watertown, MA, USA) provided bythe manufacturer. Vertical and horizontal ground reactionforces and center of pressure position (x and y coordinates)were recorded at a sampling frequency of 4,800 Hz andfiltered with a low pass Butterworth filter set at 200 Hz.
Video Recording. Reflexive markers were attached to theright side of the body at the following sites: (a) fifth meta-tarsus, (b) lateral malleolus, (c) knee joint cleft between thefemur and tibia lateral epicondyle, (d) greater trochanter,and (e) fifth cervical vertebra. These markers were used todefine 4 segments: feet (a–b), shank (b–c), thigh (c–d), andhead-arms-trunk (d–e). A video camera (PVBGS 250,Panasonic, Manaus, Brazil) was placed perpendicularly tothe Sagittal plane. Video data were collected at a samplingfrequency of 60 Hz (d–e) (4,5). Body markers weredigitized using commercially available software (APAS,Ariel Dynamics, San Diego, CA, USA) to obtain 2-di-mensional (vertical and horizontal) coordinates.
Data Synchronization and Recording. A manual trigger wasused to synchronize EMG, force plate, and video data. TheEMG and force plate data were digitally recorded througha 12-bit A/D converter (DataWave, DataWave Technologies,Loveland, CO, USA), while video data were recorded inminidigital magnetic videotapes and transferred into a PC. Toperform the analysis using inverse dynamics video, EMG andforce plate data were temporally aligned. Thus, EMG andforce plate data were resampled at the video frequency.
Statistical Analyses
All dependent variables presented normal distribution(Kolmogorov-Smirnov test). A 1-sample t-test was used tocompare training total volume (repetition 3 set 3 kg) andtraining intensities between groups. To compare the training
Figure 4. Mean (6SD) type I, type IIa, and type IIx muscle fiber cross-sectional area (CSA) for the strength training(ST), power training (PT), and control (C) groups at pretest and posttest. *p , 0.0001 main time effect, posttestgreater than the pretest.
Figure 5. Mean (6SD) squat jump (SJ) and countermovement jump(CMJ) height pretraining and posttraining for the strength training (ST),power training (PT), and control (C) groups. a) p , 0.001 posttest greaterthan the pretest, b) p , 0.05 greater than the C group at the posttest, C)p , 0.05 posttest greater than pretest.
3340 Journal of Strength and Conditioning Researchthe TM
Effects of Strength and Power Training on Jumping Performance
Copyright © National Strength and Conditioning Association Unauthorized reproduction of this article is prohibited.

intensities, the weekly average PT intensity was used asreference value. A Bonferroni adjustment (p = 0.006) wasused to avoid type I error. To perform the analysis of thetraining effects on the dependent variables, mixed modelshaving group (ST, PT, and C) and time (pretest and posttest)as fixed factors and subjects as random factors was used. Inthe case of significant F-values, Tukey’s adjustment was usedfor multicomparison purposes. Significance level was set atp # 0.05. The results are reported as mean 6SD.
RESULTS
Training Loads
The STgroup had significantly higher training total volume andintensity than the PTgroup throughout the experimental period(p , 0.0001). The total volume of STand PTvaried, respectively,from 10,292 6 923 to 8,751 6 817 kg and 4,229 6 376 to 6,1626 518 kg. The intensity of ST and PT varied, respectively, fromand 58.9 6 5.4% to 91 6 4.7% 1RM and 30–60% 1RM.
Maximum Strength
The squat 1RM load (kilograms) increased similarly (22.8and 16.6%, respectively) from pretraining to posttraining
(p , 0.001) for the STand PTgroups (Figure 3). As the traininggroups also performed 1RM control tests at the end ofthe second and fifth training weeks (pretest, second week, fifthweek, and posttest), an additional analysis was performed totest if the changes in the 1RM load for both groups followedthe same pattern. There were no differences in the rate ofincrement in the squat 1RM load (kilograms) through the fourtesting instants: pretest to second week, 6.3 and 4.6%; secondweek to fifth week, 13.4 and 11.2%; fifth week to posttest, 22.8and 16.6% (p . 0.05), for ST and PT, respectively (data notshown).
The MVIC increased for the STand PTgroups (p , 0.05) inthe posttraining assessments. However, the training proto-cols did not affect the RFD (Table 3). There were nosignificant changes in EMG activity during the MVIC test inthe VL and VM muscles for the ST (26.1 and 229.5%,respectively) and PT (221.2 and 222.7%, respectively)groups (p . 0.05) (data not shown).
Muscle Cross-Sectional Area
There was a main time effect for muscle fiber cross-sectionalarea after training for type I (p , 0.05), type IIa (p , 0.05), and
TABLE 4. Mean (6SD) of peak torque of ankle, knee and hip joints in the SJ for the ST, PT, and C groups at pretest andposttest.*†
Ankle Knee Hip
Pre Post Pre Post Pre Post
ST 1.25 (60.41) 1.26 (60.49) 2.66 (60.70) 3.05 (60.38) 3.23 (60.48) 3.62 (60.37)‡§PT 1.36 (60.49) 1.31 (6 0.41) 2.72 (60.38) 3.01 (60.53) 3.23 (60.22) 3.45 (60.24)C 1.74 (60.42) 1.36 (60.32) 2.79 (60.25) 2.91 (60.19) 3.15 (60.36) 2.91 (60.37)
*SJ = squat jump; ST = strength training; PT = power training; C = control.†Values are expressed in newtons per meter per kilogram.‡p , 0.01 related to its respective pretest.§p , 0.01 related to control at the same time.
TABLE 5. Mean (6SD) of peak torque of ankle, knee, and hip joints in the CMJ for the ST, PT, and C groups at pretest andposttest.*†
Ankle Knee Hip
Pre Post Pre Post Pre Post
ST 1.49 (60.70) 1.33 (60.55) 3.01 (60.88) 3.22 (60.42) 3.36 (60.76) 3.74 (60.38)PT 1.42 (60.45) 1.53 (60.55) 3.01 (60.39) 3.07 (60.44) 3.59 (60.39) 3.67 (60.34)C 1.62 (60.46) 1.59 (60.74) 3.06 (60.56) 3.09 (60.24) 3.66 (60.66) 3.56 (60.50)
*CMJ = countermovement jump; ST = strength training; PT = power training; C = control.†Values are expressed in newtons per meter per kilogram.
VOLUME 26 | NUMBER 12 | DECEMBER 2012 | 3341
Journal of Strength and Conditioning Researchthe TM
| www.nsca.com
Copyright © National Strength and Conditioning Association Unauthorized reproduction of this article is prohibited.
type IIx (p , 0.0001) fibers. Despite a nonsignificantinteraction effect, there was a trend toward greater musclefiber hypertrophy for the ST on each fiber type percentage-wise compared with the PT (ST: 15, 18, and 41%, and PT:25, 15, and 19%, to type I, IIa, and IIx, respectively) group(Figure 4).
Vertical Jump
No differences between groups were observed in the pretestfor the SJ and CMJ (p . 0.05). Both the ST and PT groupsincreased the SJ height after training (13 and 16%, respec-tively, p , 0.0001). The PTgroup increased CMJ height frompretest to posttest (8%, p , 0.05), whereas there were nochanges in the ST group (5%, p . 0.05) (Figure 5).
The SJ presented a main time effect for movement duration,indicating a faster extension of the lower limb joints (p ,
0.001). In the CMJ, differences in phase duration wereobserved neither in the concentric nor in the eccentric phase(p . 0.05). A higher RFD was also identified from pretest toposttest in the SJ (ST: ;41.5%; PT: ;24.3%; C: ;15.5%,main time effect: p , 0.05) but not in the CMJ. There wasa significant increase in hip peak extension torque for the STgroup in the SJ (p , 0.01) (Table 4). On the other hand, ankle,knee, and hip peak torque did not change after training in theCMJ (p . 0.05) (Table 5). The training protocols did notaffect the timing and sequencing of joint extension initiation(data not shown).
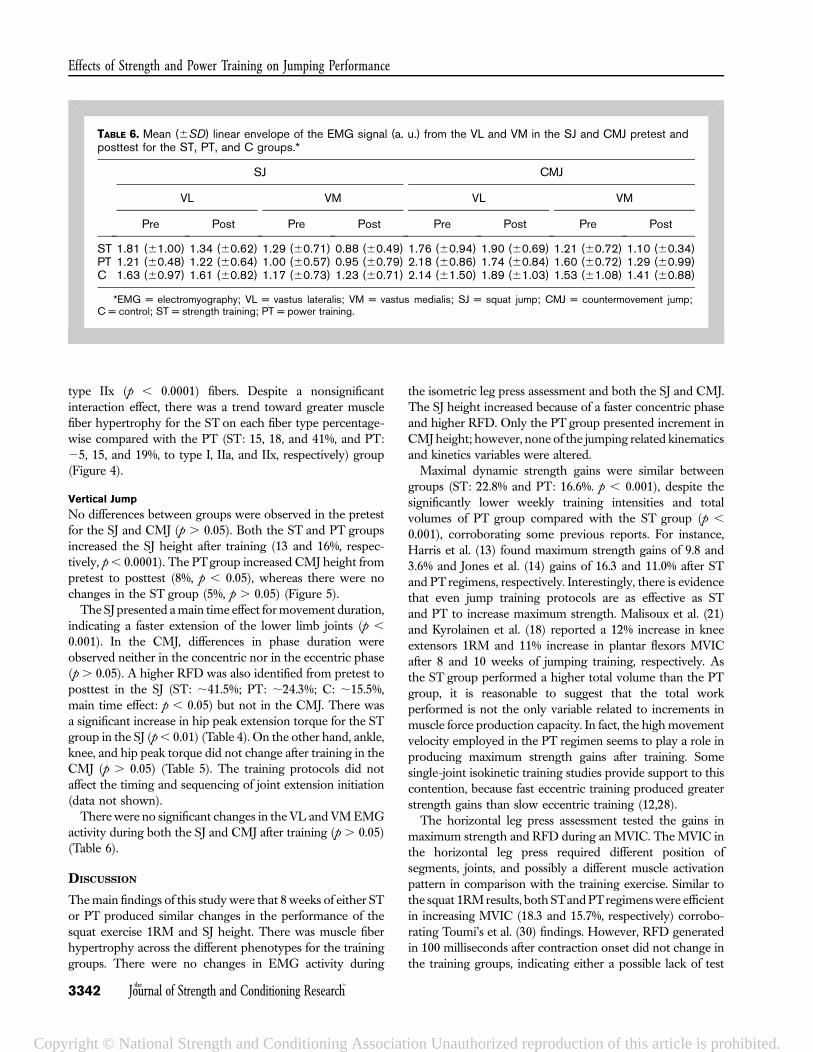
There were no significant changes in the VL and VM EMGactivity during both the SJ and CMJ after training (p . 0.05)(Table 6).
DISCUSSION
The main findings of this study were that 8 weeks of either STor PT produced similar changes in the performance of thesquat exercise 1RM and SJ height. There was muscle fiberhypertrophy across the different phenotypes for the traininggroups. There were no changes in EMG activity during
the isometric leg press assessment and both the SJ and CMJ.The SJ height increased because of a faster concentric phaseand higher RFD. Only the PT group presented increment inCMJ height; however, none of the jumping related kinematicsand kinetics variables were altered.
Maximal dynamic strength gains were similar betweengroups (ST: 22.8% and PT: 16.6%. p , 0.001), despite thesignificantly lower weekly training intensities and totalvolumes of PT group compared with the ST group (p ,
0.001), corroborating some previous reports. For instance,Harris et al. (13) found maximum strength gains of 9.8 and3.6% and Jones et al. (14) gains of 16.3 and 11.0% after STand PT regimens, respectively. Interestingly, there is evidencethat even jump training protocols are as effective as STand PT to increase maximum strength. Malisoux et al. (21)and Kyrolainen et al. (18) reported a 12% increase in kneeextensors 1RM and 11% increase in plantar flexors MVICafter 8 and 10 weeks of jumping training, respectively. Asthe ST group performed a higher total volume than the PTgroup, it is reasonable to suggest that the total workperformed is not the only variable related to increments inmuscle force production capacity. In fact, the high movementvelocity employed in the PT regimen seems to play a role inproducing maximum strength gains after training. Somesingle-joint isokinetic training studies provide support to thiscontention, because fast eccentric training produced greaterstrength gains than slow eccentric training (12,28).
The horizontal leg press assessment tested the gains inmaximum strength and RFD during an MVIC. The MVIC inthe horizontal leg press required different position ofsegments, joints, and possibly a different muscle activationpattern in comparison with the training exercise. Similar tothe squat 1RM results, both STand PTregimens were efficientin increasing MVIC (18.3 and 15.7%, respectively) corrobo-rating Toumi’s et al. (30) findings. However, RFD generatedin 100 milliseconds after contraction onset did not change inthe training groups, indicating either a possible lack of test
TABLE 6. Mean (6SD) linear envelope of the EMG signal (a. u.) from the VL and VM in the SJ and CMJ pretest andposttest for the ST, PT, and C groups.*
SJ CMJ
VL VM VL VM
Pre Post Pre Post Pre Post Pre Post
ST 1.81 (61.00) 1.34 (60.62) 1.29 (60.71) 0.88 (60.49) 1.76 (60.94) 1.90 (60.69) 1.21 (60.72) 1.10 (60.34)PT 1.21 (60.48) 1.22 (60.64) 1.00 (60.57) 0.95 (60.79) 2.18 (60.86) 1.74 (60.84) 1.60 (60.72) 1.29 (60.99)C 1.63 (60.97) 1.61 (60.82) 1.17 (60.73) 1.23 (60.71) 2.14 (61.50) 1.89 (61.03) 1.53 (61.08) 1.41 (60.88)
*EMG = electromyography; VL = vastus lateralis; VM = vastus medialis; SJ = squat jump; CMJ = countermovement jump;C = control; ST = strength training; PT = power training.
3342 Journal of Strength and Conditioning Researchthe TM
Effects of Strength and Power Training on Jumping Performance
Copyright © National Strength and Conditioning Association Unauthorized reproduction of this article is prohibited.
sensitivity or training effect. Because there were no changesin EMG activity of the VL and VM muscles, it may besuggested that the changes in MVIC were because ofmorphological adaptations and not to motor unit activation.The lack of change in motor unit activation may haveoccurred because the subjects of this study had at least 2years of ST experience. Moritani and de Vries (23) suggestedthat most of the changes in the neural drive should beproduced in the initial phase of the ST.
Even though there was no significant interaction effect formuscle fiber cross-sectional area across the fiber type spectrum,a more qualitative analysis helps to unravel the importance ofmuscle fiber hypertrophy to the gains in maximum strength.The cross-sectional area of type I, IIa, and IIx fibers increased by15, 18, and 41%, respectively, for the ST group, and by 15 and19% for type IIa and IIx fibers, respectively, for the PT group.Type I fibers decreased the cross sectional area by 5% after thePT, but this effect seems to be within the normal measurementvariation, taking into consideration the variability of our Cgroup data. There are numerous studies reporting muscle fiberhypertrophy after an ST protocol (9,19,29). Even though theevidence is scarce, there are reports of muscle fiberhypertrophy after PT regimens. For example, Malisoux et al.(21) reported an average of 25% hypertrophy across fiber typesusing an unloaded PT (i.e., plyometrics only). Moss et al. (24)also demonstrated that training at the maximum power loadproduced hypertrophy gains of 2.8% (p , 0.001). In addition,one has to consider that the changes in muscle forceproduction capacity is generated by the muscle fiberhypertrophy in the whole spectrum of muscle fiber typesinstead of in one specific fiber type (e.g., type I fibers). Takentogether, our data support that gains in maximum strengthwere produced by muscle fiber hypertrophy and not bychanges in the neural drive.
The changes in muscle force production capacity andmorphology may have had a positive effect in jumpingmechanics. The STand PT increased the jumping height in SJ,from pretest to posttest. Percentagewise both the ST andPT protocols produced small changes in peak extensiontorque around the knee (14.7 and 10.7%, respectively) and hip(12.1 and 6.8%, respectively) joints. These small increments inpeak knee and hip extension torques may have contributed tothe improvements in SJ performance for both groups. It isdifficult to compare our findings with others, because thereare no reports on this topic. Only PT was successful toincrease CMJ height, which is in agreement with severalevidences in the literature regarding the benefits of PT tovertical jump (3,13,18,30). However, in this study, the reasonsfor this improvement are not clear because the selectedperformance parameters (i.e., joint torques, peak power andpeak velocity) remained unaltered in the CMJ posttrainingassessment. Furthermore, despite the fact that only the PTgroup presented significant improvements in CMJ height,percentagewise the increments were comparable betweenthe PT and ST groups (8.3 and 5.0%, respectively).
Moreover, no changes in RFD were detected in the MVICtest. On the other hand, increments in the RFD during the SJ(ST ;41.5%; PT: ;24.3%) were clearly observed. The reasonfor these findings seems to be the mechanical similaritybetween the training exercise (i.e., squat) and the SJ. Murphyand Wilson (25) have described that training effects are betterassessed when the movement pattern of the test is similar tothe training exercise. During both the squat exercise and SJ,the subjects were in knee and hip flexion while leaning thetrunk forward. On the other hand, in the MVIC test, thesubjects were in knee and hip flexion, while maintainingthe trunk horizontally, which may have changed thecontribution of the hip joint to the resultant force production,when compared with the squat 1RM and SJ tests. Moreover,exercise applied in training protocols involved eccentricand concentric muscle actions. Abernethy and Jurimae (2)reported greater functional gains if the test used the samemuscle contraction regimen than the training protocol. Thus,it is possible that the MVIC test did not have enoughsensitivity to detect changes in the RFD.
In our results, muscle activation during the SJ and CMJ didnot change from pretest to posttest, suggesting a lack of changein the neural drive to the quadriceps muscles. A possibleexplanation for the lack of change in neural drive may havebeen the large variability of the EMG signals in both jumpingtests (SD for the VL and VM muscles of ;50 and 60% in the SJand CMJ, respectively). Other authors have reported nochanges in the EMG signal after ST and PT regimens (18);however, changes in EMG activity of the synergists may notbe ruled out (i.e., hip extensors and plantar flexors) becausethese muscles were not assessed in this study.
According to Bobbert and Van Soest (7), when changes inmuscle output occur, the neural control during the verticaljump has to be reorganized to maintain the movementpattern (i.e., relative timing, movement sequence and jointangles of flexion and extension) and maximize jump height.The absence of changes in neural activation could havea deleterious effect in the jumping movement pattern.However, some evidence indicates that relative timing andsequencing are hardly modified even under a fatiguedcondition (27) or after the increase in maximum strengthas verified in our results. Once more, these speculations mustbe interpreted with caution because only the VL and VMmuscles were monitored in this study.
In conclusion, the effects of PT and ST protocols onperformance and neuromuscular adaptations at differentlevels (i.e., jumping performance, strength gains, mechanicaloutput, muscle fiber hypertrophy, and neural output) wereidentified for the first time. Both the ST and PT protocolsincreased SJ performance similarly. However, only the PTprotocol increased CMJ performance. Neuromuscular adap-tations were also similar between the training groups. Finally,neither the ST nor the PT was able to affect the SJ and theCMJ movement pattern (e.g., timing and sequencing of jointextension initiation).
VOLUME 26 | NUMBER 12 | DECEMBER 2012 | 3343
Journal of Strength and Conditioning Researchthe TM
| www.nsca.com
Copyright © National Strength and Conditioning Association Unauthorized reproduction of this article is prohibited.
PRACTICAL APPLICATIONS
The findings of this study may have important practicalapplications as ST and PT seem to be equally effective inincreasing strength gains, neuromuscular adaptations,changes in jumping movement pattern and SJ performance.On the other hand, our results indicate that PT was moreefficient to improve the CMJ performance than ST. Thus,coaches may consider using ST regimens instead of heavyresistance training. It requires lower training volumes than STregimens, which may allow a faster training recovery betweensessions and possible decrease injury rates.
ACKNOWLEDGMENTS
L.L. was supported by FAPESP: 2008/10810-1, C.U. wassupported by CNPq: 303162/2008-2 and FAPESP:2006/00302-3.
REFERENCES
1. Aagaard, P, Simonsen, EB, Andersen, JL, Magnusson, P, andDyhre-Poulsen, P. Neural adaptation to resistance training: Changesin evoked V-wave and H-reflex responses. J Appl Physiol 92:2309–2318, 2002.
2. Abernethy, PJ and Jurimae, J. Cross-sectional and longitudinal usesof isoinertial, isometric, and isokinetic dynamometry. Med Sci SportsExerc 28: 1180–1187, 1996.
3. Arabatzi, F, Kellis, E, and Villareal, ES. Vertical jump biomechanicsafter plyometric, weight-lifting, and combined (weight lifting +plyometric) training. J Strength Cond Res 24: 2440–2448, 2010.
4. Aragon-Vargas, LF and Gross, MM. Kinesiological factors in verticaljump performance: Differences among individuals. J Appl Biomech13: 24–44, 1997.
5. Aragon-Vargas, LF and Melissa Gross, M. Kinesiological factors invertical jump performance: Differences within individuals. J ApplBiomech 13: 45–65, 1997.
6. Bergstrom, J. Muscle electrolytes in man. Scand J Clin Lab Invest 68,1962.
7. Bobbert, MF and Van Soest, AJ. Effects of muscle strengthening onvertical jump height: A simulation study. Med Sci Sports Exerc 26:1012–1020, 1994.
8. Brown, LE and Weir, JP. ASEP procedures recommendations I:Accurate assessment of muscular strength and power. J Exerc Physiol4: 1–21, 2001.
9. Campos, GE, Luecke, TJ, Wendeln, HK, Toma, K, Hagerman, FC,Murray, TF, Ragg, KE, Ratamess, NA, Kraemer, WJ, and Staron, RS.Muscular adaptations in response to three different resistance-training regimens: Specificity of repetition maximum training zones.Eur J Appl Physiol 88: 50–60, 2002.
10. Crewther, B, Cronin, J, and Keogh, J. Possible stimuli for strength andpower adaptation: Acute mechanical responses. Sports Med 35:967–989, 2005.
11. Cutsem, M, Duchateau, J, and Hainaut, K. Changes in single motorunit behaviour contribute to the increase in contraction speed afterdynamic training in humans. J Physiol 513: 295–305, 1998.
12. Farthing, J and Chilibeck, P. The effects of eccentric and concentrictraining at different velocities on muscle hypertrophy. Eur J ApplPhysiol 89: 578–586, 2003.
13. Harris, GR, Stone, MH, O’Bryant, HS, Proulx, CM, and Johnson, RL.Short-term performance effects of high power, high force, or combinedweight-training methods. J Strength Cond Res 14: 14–20, 2000.
14. Jones, K, Bishop, P, Hunter, GR, and Fleisig, G. The effects ofvarying resistance-training loads on intermediate and high-velocity-specific adaptations. J Strength Cond Res 15: 349–356, 2001.
15. Kawamori, N and Haff, G. The optimal training load for thedevelopment of muscular power. J Strength Cond Res 18: 675–684, 2004.
16. Kellis, E, Arambatzi, F, and Papadopoulos, C. Effects of load onground reaction force and lower limb kinematics during concentricsquats. J Sport Sci 23: 1045–1055, 2005.
17. Kraemer, WJ and Ratamess, NA. Fundamentals of resistance training:Progression and exercise prescription. Med Sci Sport Exerc 36:674–688, 2004.
18. Kyrolainen, H, Avela, J, McBride, JM, Koskinen, S, Andersen, JL,Sipila, S, Takala, TE, and Komi, PV. Effects of power training onmuscle structure and neuromuscular performance. Scand J Med SciSports 15: 58–64, 2005.
19. Lamas, L, Aoki, MS, Ugrinowitsch, C, Campos, GE, Regazzini, M,Moriscot, AS, and Tricoli, V. Expression of genes related to muscleplasticity after strength and power training regimens. Scand J Med SciSports 20: 216–225, 2010.
20. Linthorne, N. Analysis of standing vertical jumps using a forceplatform. Am J Physiol 69: 1198–1204, 2001.
21. Malisoux, L, Francaux, M, Nielens, H, and Theisen, D. Stretch-shortening cycle exercises: An effective training paradigm toenhance power output of human single muscle fibers. J Appl Physiol100: 771–779, 2006.
22. McBride, JM, Triplett-Mcbride, T, Davie, A, and Newton, R.The effect of heavy versus light-load jump squats on thedevelopment of strength, power and speed. J Strength Cond Res16: 75–82, 2002.
23. Moritani, T and deVries, HA. Neural factors versus hypertrophy inthe time course of muscle strength gain. Am J Physical Med 58:115–130, 1979.
24. Moss, BM, Refsnes, PE, Abildgaard, A, Nicolaysen, K, and Jensen, J.Effects of maximal effort strength training with different loads ondynamic strength, cross-sectional area, load-power and load-velocity relationships. Eur J Appl Physiol 75: 193–199, 1997.
25. Murphy, A and Wilson, G. A comparison of isoinertial and isokinetictests. J Sports Med Physical Fit 36: 169–177, 1996.
26. Pereira, G, de Freitas, PB, Rodacki, A, Ugrinowitsch, C, Fowler, N,and Kokubun, E. Evaluation of an innovative critical power model inintermittent vertical jump. Int J Sports Med 30: 802–807, 2009.
27. Rodacki, A, Fowler, N, and Bennett, S. Multi-segment coordination:Fatigue effects. Med Sci Sport Exerc 33: 1157–1167, 2001.
28. Shepstone, TN, Tang, JE, Dallaire, S, Schuenke, MD, Staron, RS, andPhillips, SM. Short-term high- vs. low-velocity isokinetic length-ening training results in greater hypertrophy of the elbow flexors inyoung men. J Appl Physiol 98: 1768–1776, 2005.
29. Staron, R, Malicky, E, Leonardi, M, Falkel, J, Hagerman, F, andDudley, G. Muscle hypertrophy and fast fiber type conversions inheavy resistance-trained women. Eur J Appl Physiol 60: 71–79, 1990.
30. Toumi, H, Best, TM, Martin, A, and Poumarat, G. Muscle plasticityafter weight and combined (weight + jump) training. Med Sci SportExerc 36: 1580–1588, 2004.
31. Ugrinowitsch, C, Tricoli, V, Rodacki, AL, Batista, M, and Ricard, MD.Influence of training background on jumping height. J Strength CondRes 21: 848–852, 2007.
32. Vanrenterghem, J, De Clercq, D, and Van Cleven, P. Necessaryprecautions in measuring correct vertical jumping height by meansof force plate measurements. Ergonomics 44: 814–818, 2001.
33. Wilson, GJ, Murphy, AJ, Newton, RU, and Humphries, BJ. Theoptimal training load for the development of dynamic athleticperformance. Med Sci Sport Exerc 25: 1279–1286, 1993.
34. Winter, D. Biomechanics and Motor Control of Human Movement. NewYork, NY: John Wiley & Sons, 1990.
3344 Journal of Strength and Conditioning Researchthe TM
Effects of Strength and Power Training on Jumping Performance
Copyright © National Strength and Conditioning Association Unauthorized reproduction of this article is prohibited.
Copyright © 2022 FDOKUMEN