Influence of Relative Roughness and Reynolds Number on the Roll-Waves Spatial Evolution
Upload
khangminh22Category
view
1download
0
Article
Effects of Reynolds Number on the EnergyConversion and Near-Wake Dynamics ofa High Solidity Vertical-Axis Cross-Flow Turbine
Peter Bachant and Martin Wosnik *
Center for Ocean Renewable Energy, University of New Hampshire, 24 Colovos Rd., Durham, NH 03824, USA;[email protected]* Correspondence: [email protected]; Tel.: +1-603-862-1891
Academic Editor: Sukanta BasuReceived: 1 November 2015; Accepted: 15 January 2016; Published: 26 January 2016
Abstract: Experiments were performed with a large laboratory-scale high solidity cross-flow turbineto investigate Reynolds number effects on performance and wake characteristics and to establishscale thresholds for physical and numerical modeling of individual devices and arrays. It wasdemonstrated that the performance of the cross-flow turbine becomes essentially Re-independentat a Reynolds number based on the rotor diameter ReD ≈ 106 or an approximate average Reynoldsnumber based on the blade chord length Rec ≈ 2× 10⁵. A simple model that calculates the peaktorque coefficient from static foil data and cross-flow turbine kinematics was shown to be a reasonablepredictor for Reynolds number dependence of an actual cross-flow turbine operating under dynamicconditions. Mean velocity and turbulence measurements in the near-wake showed subtle differencesover the range of Re investigated. However, when transport terms for the streamwise momentumand mean kinetic energy were calculated, a similar Re threshold was revealed. These results implythat physical model studies of cross-flow turbines should achieve ReD ∼ 106 to properly approximateboth the performance and wake dynamics of full-scale devices and arrays.
Keywords: Reynolds number; cross-flow turbine; turbine performance; marine hydrokinetic energy;wind energy; vertical-axis wind turbine (VAWT); scale model
1. Introduction
Scaled physical models are often used in science and engineering to approximate real-worldsystems. The principle of dynamic similarity allows for geometrically-scaled systems to be dynamicallyidentical if certain nondimensional physical parameters are matched. In the case of fluid systems, themost important nondimensional parameter is often the Reynolds number, Re, which quantifies theimportance of inertial forces over viscous forces on the flow physics [1]: Re = Ul/ν, where U and l arecharacteristic velocity and length scales, respectively, and ν is the fluid kinematic viscosity. The othercommon dynamical scale, for systems with a free surface, is the Froude number Fr = U/
√gl, where
g is the gravitational acceleration. Matching both the Froude and Reynolds number is not possiblefor a scaled model in a given fluid, which is illustrated by the relation Re = l3/2g1/2Fr/ν, since Rescales linearly with l, or the geometric scale. In general, the geometric scale of a physical model is notnecessarily the same as its dynamical scale. As such, hereafter, we will use the word “scale” to referto this dynamical scale or the Reynolds number and assume the Froude number is small enough tobe negligible.
With regards to wind and marine hydrokinetic (MHK) turbines, scaled physical models are usedto validate predictive numerical models, predict full-scale performance of individual turbines anddesign or investigate arrays of devices. Scaled models have the benefit of being significantly less
Energies 2016, 9, 73; doi:10.3390/en9020073 www.mdpi.com/journal/energies

Energies 2016, 9, 73 2 of 18
expensive; however, a key question is whether or not an acceptable scale mismatch exists. Similarly, itis questionable whether numerical models validated with physical model data obtained orders ofmagnitude away from prototype scale should be considered validated at all. An example of the errorsthat can result from the extrapolation of small-scale experiments can be found in [2].
The performance and wake characteristics of cross-flow (often vertical-axis) turbines (CFTs)depend on turbine solidity, blade profile (lift/drag, dynamic stall at reduced frequency of turbinerotation, symmetry, thickness, camber), blade pitch, number of blades, strut drag, operationalparameters, such as tip speed ratio, and on the Reynolds number [3]. Note that an average blade chordReynolds number, Rec,avg ≈ λU∞c/ν, can be expressed in terms of tip speed ratio λ = ωR/U∞, whereU∞ is the free stream velocity, c is the blade chord length, ν is the fluid kinematic viscosity, ω is therotor’s angular velocity, and R is the rotor radius. The value of λ at which a turbine reaches peakperformance in general decreases with turbine solidity Nc/(πD) [4], which allows for the use of asimpler Reynolds number based on turbine diameter ReD = U∞D/ν.
Solidity often directly correlates with the chord-to-radius ratio c/R. Rotors with c/R ≥ 0.1 areconsidered to have high solidity [5], for which so-called flow curvature or virtual camber effectsbecome significant [6]. These effects arise from the blade sections’ circular paths and can complicatethe comparison with the behavior of an airfoil in a linear flow.
Blackwell et al. [7] investigated the effects of Reynolds number on the performance of a 2 mdiameter Darrieus vertical-axis cross-flow wind turbine with NACA 0012 blades. By varying windtunnel speed, the turbine was made to operate at an approximately constant blade chord Reynoldsnumber Rec ranging from 1× 10⁵ to 3× 10⁵. In this regime, the turbine power coefficient CP wasshown to be sensitive to Rec, with sensitivity diminishing at the higher Reynolds numbers, especiallyfor turbines of lower solidity (Nc/R, where N is the number of blades and R is the turbine’s maximumradius). More recently, Polagye and Cavagnaro [8] observed significant Reynolds number sensitivityfor a high solidity helical cross-flow turbine, and Bravo et al. [9] observed the power coefficient ofa straight-bladed vertical-axis wind turbine (VAWT) to become Reynolds number independent atRec ≈ 4× 10⁵. Bachant and Wosnik [10] observed Reynolds number independence of the powercoefficient at the optimal tip speed ratio for a high solidity cross-flow turbine at ReD ≈ 106 orRec,avg ≈ 2× 10⁵.
The wake of a 2D cross-flow turbine in the dynamic stall regime has been studied via laserDoppler velocimetry by Brochier et al. [11] and in 3D with particle image velocimetry (PIV) byFujisawa and Shibuya [12]. However, both of these studies were performed at very low Reynoldsnumbers: ReD = 104 and 103, respectively. Tescione et al. [13] studied the wake of a vertical-axis windturbine at its optimal tip speed ratio in a wind tunnel using stereo PIV at an approximate blade chordReynolds number Rec = 1.7× 10⁵; very close to the Re-independence criteria reported in [10], thoughit was not confirmed if this was indeed a Re-independent state. The two lower Re experiments tendedto focus on the effects of dynamic stall, whereas the higher Re experiment mostly concerned the meanvelocity and tip vortex effects. Whereas the value of these studies was in elucidating the complex wakedynamics of cross-flow turbines, they also motivated the more systematic investigation of scale effectsundertaken here.
Scale effects on axial-flow or horizontal-axis wind turbines are better understood, andinvestigators have methods for compensating. Krogstad and Adaramola [14] observed Reynoldsnumber independence of the performance of a 0.9 m diameter axial-flow turbine rotor at ReD ≈ 5× 10⁵
in wind tunnel tests. Their turbine blades had an S826 profile along their entire span, a profile chosenfor its Re-independence. Walker et al. [15] similarly chose a NACA 63-618 foil for their axial-flowturbine tests in a towing tank, which were performed at a mid-span Reynolds number Rec = 4× 10⁵.McTavish et al. [16] showed how the near-wake expansion for an axial-flow rotor is increased at higherReynolds numbers, concluding that physical models should be designed with Re-independence inmind if they are to be run at low Re. It is uncertain, however, if these methods work equally well forcross-flow turbines.

Energies 2016, 9, 73 3 of 18
When designing or studying arrays, it is common to use very small (geometrically) scaleddevices [17,18]. It is therefore important to realize the limitations of evaluating both the poweroutput of turbines and the wake recovery when the Reynolds number is very far from full scale.Sometimes, the models used are not turbines, but wake-generating objects, e.g., porous disks, that aremeant to replicate the wakes of real turbines [19]. In this case, it is of interest to determine at whatReynolds number one might be able to realistically study wake flows in an array and also to evaluatethe effectiveness of a wake generator. In other words, a wake generator may do a fine job simulatinga scaled turbine, but how well can it simulate a full-scale device? Note that for a porous disk, theReynolds number of interest is based on diameter, since it is the scaling of the far-wake dynamicsthat matters.
Vertical-axis wind turbine array field experiments have revealed that improved wake recoveryallows for closer spacing when compared to conventional axial-flow propeller-type turbines [20,21].It was observed experimentally that a high solidity vertical-axis cross-flow turbine’s near-wakeproduces a unique vertical mean velocity field, generated by blade tip vortex shedding, the advectionby which is the largest contributor to streamwise momentum and energy transport or recovery [22].In this study, we seek to replicate those same momentum and energy balance considerations at multipleReynolds numbers, to examine the implications on how scaled, i.e., low Reynolds number experiments,may be used to study flows in turbine arrays.
Modes of Reynolds Number Dependence
It is of interest to examine how Reynolds number scaling affects both the blade loading, i.e.,turbine performance, and the near-wake. Typically, static airfoil data show that the static stall angleincreases with blade chord Reynolds number Rec [23]. A review of Reynolds number effects on airfoilbehavior is presented in [24]. In general, airfoil performance, often characterized by the profile’slift-to-drag ratio, is enhanced as the boundary layer on the foil transitions to turbulence closer to theleading edge, which enables it to advance further downstream against the adverse pressure gradienton the suction side, delaying separation to higher angles of attack. For smooth airfoils, this transitioncan cause a dramatic increase in foil performance at a blade chord Reynolds number on the order of105 [25]. Note that there is a distinct lack of highly reliable data for airfoils in this transitional regimeand below. An evaluation of the various databases relevant to cross-flow turbines is presented in [26].
Static foil performance does not tell the whole story for a cross-flow turbine. The azimuthal, andtherefore, temporal, variation of α in a cross-flow turbine implies dynamic loading, encounteringdynamic stall for tip speed ratios near and below those of maximum rotor torque [3]. Bousman [27]states that dynamic stall is relatively insensitive to Reynolds number for Re = 1.0× 10⁵ to 2.5× 10⁵,judging from measurements on a pitching VR-7 foil in a wind and water tunnel, since the loading isdominated by vortex shedding. However, Singleton and Yeager Jr. [28] state that the effect of Reynoldsnumber on dynamic stall remains an unsolved question.
Despite lower lift on the blades at lower Re, we expect stronger tip vortex shedding [29].As mentioned previously, the dynamic stall vortex shedding is not expected to be highly sensitiveto Reynolds number, though a larger separation bubble at lower Re may induce higher levels ofturbulence as shed vortices become unstable and break down.
Chamorro et al. [30] showed that turbulence statistics in an horizontal-axis or axial-flow windturbine wake became Re-independent at ReD ≈ 1 × 10⁵ and that mean velocity profiles becameRe-independent slightly earlier at ReD ≈ 5× 10⁴. Note that in this study, the tip chord Reynoldsnumber was not reported, but is estimated to be Rec ≈ 4× 10⁴ at ReD = 1× 10⁵. It is therefore ourobjective to observe similar scaling relationships for a cross-flow turbine near-wake.
2. Experimental Setup
Experiments were performed in a turbine test bed specifically designed for cross-flow turbines.The test bed was integrated as part of the University of New Hampshire (UNH) tow tank, which is a

Energies 2016, 9, 73 4 of 18
36 m-long facility with a 3.66 m-wide and 2.44 m-deep cross-section. The turbine model used in thisstudy was the UNH Reference Vertical Axis Turbine (RVAT), which was designed to be a generic casefor numerical model testing, similar to the Sandia National Labs/U.S. Department of Energy ReferenceModel 2 (RM2) River Turbine [31], but with a higher solidity or blade chord-to-radius ratio.
The UNH-RVAT turbine has three blades made from NACA 0020 profiles with a 0.14 m chord.The blades are mounted at mid-chord w.r.t. the turbine axis, and the turbine has a height (blade span)of 1 m and a diameter of 1 m; cf. Figure 1. The blockage ratio produced by the rotor’s frontal area is11%, which we decided not to correct for, as reliable methods are not yet agreed upon for CFTs [32].As such, blockage should be taken into account when using these data for model validation, i.e., theexperimental domain should be mimicked. The rotor has a relatively high solidity Nc/(πD) = 0.13and a large chord-to-radius ratio c/R = 0.28. A CAD model of the turbine is available from [33].
1 m
1 m
Figure 1. University of New Hampshire Reference Vertical Axis Turbine (UNH-RVAT) turbine model.Turbine blades and struts made from NACA 0020 profiles with 0.14 m chord. Note that the upper andlower mounting flanges have been excluded, as these were included in the tare drag measurements.
The turbine was mounted in a frame constructed from NACA 0020 sections, shown in Figure 2.The turbine shaft ran up through the water surface, coupled to a Kollmorgen AKM permanent magnetservo motor (Kollmorgen, Radford, VA, USA) with a 20:1 gearbox, providing precise control overshaft angular velocity. This servo was controlled by the tow tank’s main motion controller for highsynchronization with the carriage motion, thereby giving precise measurement and control of the tipspeed ratio. An Interface T8 200 Nm capacity rotary torque transducer (Interface, Scottsdale, AZ, USA)was installed inline between the servo and the turbine, and the servo was also mounted on a slewingring bearing, which allowed a redundant measurement of torque via an arm and load cell used tocounteract the turbine moment. The frame was mounted to the carriage via linear guides, such that thetotal streamwise drag force was transferred to a pair of Sentran ZB3 500 pound-force capacity S-beamload cells (Sentran, Santa Ana, CA, USA), providing the rotor drag measurements, after a separatelymeasured tare drag was subtracted in post-processing. Similarly, a tare torque was measured byrotating the turbine shaft in air. Turbine angular and tow carriage linear position were measuredusing quadrature encoder signals, with 105 counts-per-rev for the turbine and 10 µm resolution for thecarriage position. These signals, along with the torque and drag signals, were sampled at 2 kHz.
Wake velocity was measured using a Nortek Vectrino+ acoustic Doppler velocimeter (ADV)(Nortek AS, Rud, Norway), which has an approximately 6 mm diameter sampling volume andsampled at 200 Hz. The probe was mounted on an automated positioning system, also controlled by

Energies 2016, 9, 73 5 of 18
the tow tank’s main motion controller. The ADV and data acquisition systems’ sampling times weresynchronized by triggering the start of data acquisition via a pulse sent from the motion controller.Additional details of the turbine and experimental setup are described in [22].
(a)
3.66GmG
1.24GmG
2.44GmG
VectrinoGprobeTurbine
TorqueGtransducer
2XGloadGcells
ServoGmotor
HydrofoilGframe
GuyGwires
(b)
Figure 2. Experimental setup photo (a) and drawing (b): turbine test bed installed in the UNH tow tank.
2.1. Test Plan
Approximately 1500 tows were conducted for the study reported here; each tow was used fora single data point on either a performance curve or wake map. Each performance curve consistedof 31 tows, where during each tow, the mean turbine tip speed ratio was held constant, rangingfrom 0.1 to 3.1 in 0.1 increments. Full performance curve data were acquired for tow speeds from0.4 to 1.2 m/s in 0.2 m/s increments, for which the turbine diameter and approximate blade chordReynolds number are presented in Table 1. Performance was also measured for λ = 1.9 at tow speeds[0.3, 0.5, 0.7, 0.9, 1.1, 1.3] m/s for two tows each.
Each wake map was generated by positioning the ADV, which measured three components ofvelocity at a 200 Hz sampling frequency, at 270 different locations, varied in the cross-stream andvertical directions at one turbine diameter downstream (x/D = 1). These locations had vertical

Energies 2016, 9, 73 6 of 18
coordinates from the turbine centerline up to z/H = 0.625, ranging in the cross-stream directiony/R = ±3. These locations are shown in Figure 3.
Table 1. Turbine diameter and approximate blade chord Reynolds numbers for the tow speeds used inthe experiment.
Tow Speed (m/s) ReD Rec,ave (λ = 1.9)
0.3 0.3× 10⁶ 0.8× 10⁵
0.4 0.4× 10⁶ 1.1× 10⁵
0.5 0.5× 10⁶ 1.3× 10⁵
0.6 0.6× 10⁶ 1.6× 10⁵
0.7 0.7× 10⁶ 1.9× 10⁵
0.8 0.8× 10⁶ 2.1× 10⁵
0.9 0.9× 10⁶ 2.4× 10⁵
1.0 1.0× 10⁶ 2.7× 10⁵
1.1 1.1× 10⁶ 2.9× 10⁵
1.2 1.2× 10⁶ 3.2× 10⁵
1.3 1.3× 10⁶ 3.4× 10⁵
y
x
ω
U∞
y
z
0 0.13 0.25 0.38 0.50 0.63
0
0.0
50
0.1
00
0.1
50
0.2
00
0.2
50
0.3
00
0.3
50
0.4
00
0.4
50
0.5
00
0.5
50
0.6
00
0.6
50
0.7
00
0.7
50
0.8
00
0.9
00
1.0
00
1.1
25
1.2
50
1.3
75
1.5
00
WA
LL
-0.0
50
-0.1
00
-0.1
50
-0.2
00
-0.2
50
-0.3
00
-0.3
50
-0.4
00
-0.4
50
-0.5
00
-0.5
50
-0.6
00
-0.6
50
-0.7
00
-0.7
50
-0.8
00
-0.9
00
-1.0
00
-1.1
25
-1.2
50
-1.3
75
-1.5
00
WA
LL
Figure 3. Wake measurement coordinate system and locations. Dimensions are in meters.
2.2. Data Processing
From each set of tows, a standard time interval was set, which allowed the turbine performanceand wake to reach a quasi-periodic state. Each run was analyzed to compute statistics over this interval,truncating the end slightly to achieve an integer number of blade passages. Turbine shaft angularvelocity and tow carriage speed were calculated using a second order central differencing scheme onthe respective position measurements. Power and drag coefficients were calculated as instantaneousquantities using the carriage speed as the free stream velocity.
Wake velocity data were filtered for spurious “spikes” by removing data points 8 standarddeviations, or 0.9 m/s, from the mean. The experimental data and code for processing and visualizationare available from [34].

Energies 2016, 9, 73 7 of 18
2.3. Uncertainty Analysis
Uncertainty was considered from a combination of systematic and random errors. The randomerror was inferred from the sample standard deviation (on a per-revolution basis) and the systematicerror from the sensor calibrations or datasheets. Combining both sources of error, along with theirpropagation into quantities derived from multiple measurements, followed the procedures outlined inColeman and Steele [35], described below.
An expanded uncertainty interval with 95% confidence was computed for CP, CD, and meanwake velocities:
U95 = t95uc, (1)
where t95 is the value from the Student t-distribution for a 95% confidence interval and uc is thecombined standard uncertainty. Combined standard uncertainty for a given quantity X is calculated by:
u2X = s2
X̄ + b2X , (2)
where sX̄ is the sample standard deviation of the mean per turbine revolution, and bX is the systematicuncertainty, computed by:
b2X =
J
∑i=1
(∂X∂xi
)2b2
xi, (3)
where xi is a primitive quantity used to calculate X (e.g., T, ω, and U∞ for calculating CP), and bxi
is the primitive quantity’s systematic uncertainty, estimated as half the value listed on the sensormanufacturer’s documentation.
Selecting t95 requires an estimate for degrees of freedom νX, which was obtained using theWelch–Satterthwaite formula:
νX =
(s2
X + ∑Mk=1 b2
k
)2
s4X/νsX + ∑M
k=1 b4k /νbk
, (4)
where νsX is the number of degrees of freedom associated with sX and νbkis the number of degrees
of freedom associated with bk. νsX is assumed to be (N − 1), where N is the number of independentsamples (or turbine revolutions). νbk
was estimated as:
νbk=
12
(∆bkbk
)−2, (5)
where the quantity in parentheses is the relative uncertainty of bk, assumed to be 0.25.For the Reynolds number dependence of turbine performance, error bars are included on the
plots. Expanded uncertainty estimates for mean wake velocities (averaged over all runs) are listed inTable 2.
Table 2. Average expanded uncertainty estimates (with 95% confidence) for mean velocity measurementsat each tow speed.
U∞ (m/s) U (m/s) V (m/s) W (m/s)
0.4 1× 10⁻² 7× 10⁻³ 6× 10⁻³
0.6 1× 10⁻² 8× 10⁻³ 8× 10⁻³
0.8 2× 10⁻² 1× 10⁻² 1× 10⁻²
1.0 2× 10⁻² 1× 10⁻² 1× 10⁻²
1.2 2× 10⁻² 1× 10⁻² 1× 10⁻²

Energies 2016, 9, 73 8 of 18
3. Results and Discussion
3.1. Performance
Complete power and rotor drag (also known as thrust) coefficient curves for various Reynoldsnumbers are plotted in Figures 4 and 5, respectively. In general, maximum CP increases with Reynoldsnumber. The power coefficient curves also show a slight downward shift in the optimal tip speed ratio(peak performance) with increasing Reynolds number, from about λ ≈ 2.0 to 1.9. This is caused by thestall delay from a more turbulent boundary layer on the blade suction side. There is essentially nochange in the shape of the drag coefficient curves, merely a slight upward shift in CD with increasing Re.
0. 0 0. 5 1. 0 1. 5 2. 0 2. 5 3. 0 3. 5λ
0. 1
0. 0
0. 1
0. 2
0. 3
CP
ReD = 0. 4× 10⁶
ReD = 0. 6× 10⁶
ReD = 0. 8× 10⁶
ReD = 1. 0× 106
ReD = 1. 2× 10⁶
Figure 4. Mean power coefficient curves plotted for multiple Reynolds numbers.
0. 0 0. 5 1. 0 1. 5 2. 0 2. 5 3. 0 3. 5λ
0. 0
0. 2
0. 4
0. 6
0. 8
1. 0
1. 2
CD
ReD = 0. 4× 10⁶
ReD = 0. 6× 10⁶
ReD = 0. 8× 10⁶
ReD = 1. 0× 106
ReD = 1. 2× 10⁶
Figure 5. Mean rotor drag coefficient curves plotted for multiple Reynolds numbers.
Mean power and drag coefficients at λ = 1.9 are plotted versus the Reynolds number in Figure 6.Note that the large error bars for CP at low Re are dominated by systematic error estimates for thetorque transducer, since torque values are at the lower end of its measurement range. However, theuncertainty due to random error or repeatability remains relatively low. There is a drastic improvementin CP with increasing Reynolds number at the lower end of the Re range. The power coefficient then

Energies 2016, 9, 73 9 of 18
becomes essentially Re-independent at ReD = 0.8× 10⁶, which corresponds to an approximate averageblade chord Reynolds number Rec,ave = 2.1× 10⁵. This threshold is consistent with the behaviorof the blade boundary layer transitioning from laminar to turbulent, thereby promoting either thesuppression or reattachment of the laminar separation bubble [24].
0. 2 0. 4 0. 6 0. 8 1. 0 1. 2 1. 4ReD ×106
0. 14
0. 16
0. 18
0. 20
0. 22
0. 24
0. 26
0. 28
CP
×105
(a)
0. 2 0. 4 0. 6 0. 8 1. 0 1. 2 1. 4ReD ×106
0. 82
0. 84
0. 86
0. 88
0. 90
0. 92
0. 94
0. 96
CD
×105
0.5 1.1 1.6 2.1 2.7 3.2 3.7Rec, ave
0.5 1.1 1.6 2.1 2.7 3.2 3.7Rec, ave
(b)
Figure 6. UNH-RVAT measured mean power (a) and drag (b) coefficients at λ = 1.9 plotted versus theReynolds number. Error bars indicate expanded uncertainty estimates for 95% confidence, which forCP is dominated by systematic error estimates from the torque transducer operating at the lower endof its measurement range.
The behavior of the mean rotor drag coefficient CD is similar, though the changes are less dramatic.This is likely due to cross-flow turbine geometry, where increases in blade drag at lower Re somewhatoffset the reduction in lift, causing the total streamwise force to vary less than the rotor torque.The tendency for CD to continue increasing with Re may also include the effects of an increasingFroude number (from faster tow speeds), which increases free surface deformation and wave dragduring towing without increasing flow through the turbine.
Relation to Static Foil Characteristics
To help understand, and possibly predict, the Re-sensitivity on turbine performance, a seriesof static foil coefficient datasets were computed with the viscous panel method code XFOIL [36],a commonly-used tool for airfoil analysis, e.g., [15,37], implemented as part of the open sourceturbine design software QBlade [38]. Simulations were run for an angle of attack range of 0◦ to 40◦,in increments of 0.5◦. Solver parameters used were 100 panels, a fixed speed, zero Mach number,NCrit = 9 (default en transition criteria parameter for an average wind tunnel) and no forced boundarylayer transition. Characteristics were computed for the approximate average blade chord Reynoldsnumbers encountered in the tow tank experiments.
To investigate the effects of the blades’ “virtual camber” due to their circular path [6], the XFOILcalculations were performed for 20% thick foils with 0% (NACA 0020), 2% (NACA 2520), and 4%(NACA 4520) camber about their half-chord location. A 4% camber approximates the maximumdistance between the blade chord line and path for the UNH-RVAT, and the 2% camber takes intoaccount the reduction in virtual flow curvature from the non-curved inflow velocity by dividing bythe tip speed ratio λ = 1.9.
Results from the XFOIL calculations for the airfoil profiles are shown in Figure 7, where values ofthe maximum lift coefficient Clmax , minimum drag coefficient Cdmin , and maximum lift-to-drag ratioare normalized (to visualize relative differences in scaling between the foils) and plotted versus Rec.

Energies 2016, 9, 73 10 of 18
In general, larger camber is associated with decreased foil performance at lower Reynolds number.The data and processing code for these calculations is available from [39].
0. 5 1. 5 2. 5 3. 5Rec ×105
0. 880. 900. 920. 940. 960. 981. 001. 021. 04
Cl m
ax (n
orm
aliz
ed)
(a)
NACA 0020NACA 2520NACA 4520
0. 5 1. 5 2. 5 3. 5Rec ×105
0. 5
1. 0
1. 5
2. 0
2. 5
3. 0
Cd
min (n
orm
aliz
ed)
(b)
0. 5 1. 5 2. 5 3. 5Rec ×105
0. 2
0. 4
0. 6
0. 8
1. 0
1. 2
(Cl/Cd) m
ax (n
orm
aliz
ed)
(c)
Figure 7. Normalized maximum lift coefficient (a), drag coefficient (b), and lift-to-drag ratio (c)computed by XFOIL at various Rec for each profile.
In conjunction with the cross-flow turbine blade kinematics, the foil coefficients were used toapproximate turbine performance by calculating the peak torque coefficient on the upstream half ofthe blade path. The turbine torque coefficient CT can be related to the blade section chordwise forcecoefficient Cc by:
CT =Ccc2R|Urel|2
U2∞
, (6)
where the blade section chordwise force coefficient (for zero preset pitch) is given by:
Cc = Cl sin α− Cd cos α. (7)
The relative blade velocity Urel was calculated by vector addition of the free stream velocity andthe opposite of the blade tangential velocity. Note that this neglects any induction, i.e., slowing ofthe free stream by the turbine forces, which would be present in a momentum/streamtube model.Since the goal of this approach was not to predict absolute performance, but rather to gain insightinto relative changes with Re, this method was deemed acceptable, as it is extremely simple and fastto compute.
Values for the blade angle of attack, relative velocity, and torque coefficient are plotted in Figure 8for the upstream half of rotation of the turbine. The effects of static stall are clearly present in thetorque coefficient plot, and by the time the angle of attack has decreased below the static stall angle,the relative velocity is so low that there is not much contribution to the torque coefficient.
0 45 90 135 180Azimuthal angle (deg.)
05
101520253035
Angl
e of
atta
ck (d
eg.)
(a)
0 45 90 135 180Azimuthal angle (deg.)
0. 5
1. 0
1. 5
2. 0
2. 5
3. 0
|Ure
l|/U∞
(b)
0 45 90 135 180Azimuthal angle (deg.)
0. 050. 000. 050. 100. 150. 200. 250. 30
Torq
ue c
oeffi
cien
t
(c)
Figure 8. Geometric angle of attack (a), relative velocity (b), and torque coefficient (c) calculated with aNACA 0020 foil operating at λ = 1.9.

Energies 2016, 9, 73 11 of 18
Results for the normalized peak torque coefficient for each foil are plotted versus Rec in Figure 9.It is interesting that the convergence of CTmax with increasing Reynolds number is more dramatic thanany of the common foil performance characteristics plotted in Figure 7, meaning that the cross-flowturbine’s unique kinematics must be taken into account when attempting to predict the effect oftransitional Reynolds numbers on turbine performance.
From the peak torque coefficient metric plotted in Figure 9, the Reynolds number independenceis achieved at lower values and more dramatically. We see that the trend of the (non-cambered) NACA0020 curve matches almost perfectly up to Rec ≈ 2.1× 10⁵, but then continues to increase slowlyand linearly with Re. This is not matched by the experimental data, which at higher Re looks morelike the cambered foil results. Though this method does not provide absolute predictions of turbineperformance, it predicts the transitional Reynolds number regime for cross-flow turbine performanceusing only 2D static airfoil characteristics, i.e., the Reynolds number scaling of the peak CT computedthis way behaves much like that of the measured turbine performance.
0. 5 1. 0 1. 5 2. 0 2. 5 3. 0 3. 5Rec ×105
0. 3
0. 4
0. 5
0. 6
0. 7
0. 8
0. 9
1. 0
1. 1
CT
max
(nor
mal
ized
)
NACA 0020NACA 2520NACA 4520UNH-RVAT exp.
Figure 9. Reynolds number dependence of the normalized peak torque coefficient calculated fromstatic foil coefficients and blade kinematics, compared to experimental data from a cross-flow turbine.Note that the experimental data represents the mean torque coefficient, not the maximum.
3.2. Wake Characteristics
The near-wake of this turbine at x/D = 1, λ = 1.9, along with momentum and kinetic energybalances at a ReD = 1.0× 10⁶ were discussed in [22]. Similar data were taken for the experimenthere, and the results for the mean velocity field and turbulence kinetic energy calculated from wakemaps of 270 individual measurements (tows) are shown in Figures 10 and 11, respectively, lookingupstream towards the turbine. With respect to the mean velocity field, we see asymmetry and a meanvortex structure created by blade tip vortex shedding. The effects of the tip vortices are also seen in theturbulence kinetic energy measurements, along with turbulence generated by the blades undergoingdynamic stall on the −y side of the turbine.
These same wake maps were measured for ReD = 0.4× 10⁶, 0.6× 10⁶, 0.8× 10⁶, and 1.2× 10⁶.Qualitatively, these look very similar, so they have not been plotted here, though profiles at z/H = 0.0are compared in Figure 12 to illustrate the subtlety of the differences at different Re. We will insteadcompare and contrast the wake behavior by examining spectra and wake transport terms in theequations that govern the downstream evolution of mean momentum and kinetic energy.

Energies 2016, 9, 73 12 of 18
3 2 1 0 1 2 3y/R
0. 000. 130. 250. 380. 500. 63
z/H
0. 1U∞
0. 150. 300. 450. 600. 750. 901. 051. 20
U/U
∞
Figure 10. Mean velocity field at x/D = 1, λ = 1.9, and ReD = 1.0× 10⁶.
3 2 1 0 1 2 3y/R
0. 000. 130. 250. 380. 500. 63
z/H
0. 000. 010. 020. 030. 040. 050. 060. 070. 080. 09
k/U
2 ∞
Figure 11. Turbulence kinetic energy at x/D = 1, λ = 1.9, and ReD = 1.0× 10⁶.
3 2 1 0 1 2 3y/R
0. 2
0. 4
0. 6
0. 8
1. 0
1. 2
U/U
∞
(a)
0.4e60.6e60.8e61.0e61.2e6
3 2 1 0 1 2 3y/R
0. 00
0. 01
0. 02
0. 03
0. 04
0. 05
0. 06
k/U
2 ∞
(b)
Figure 12. Mean streamwise velocity (a) and turbulence kinetic energy (b) profiles at z/H = 0.0.Turbine diameter Reynolds number ReD is indicated by the legend.
3.2.1. Dominant Timescales and Turbulence Spectra
Spectra of the cross-stream velocity normalized by the free stream were computed using a fastFourier transform-based method, applying a Hanning window and averaging over four adjacentfrequency bands to decrease confidence intervals. These spectra are plotted in Figure 13 for regions oneither side of the turbine. On the −y side of the turbine, there is broadband turbulence produced byblade stall, and on the +y side, there is a clear peak in the spectra caused by the blade passage. We seethat on both sides, there is higher spectral energy at lower Reynolds numbers. On the +y side of theturbine, we notice higher spectral energy at the blade passage frequency’s first harmonic, or 6 fturbine.This is likely due to the blade’s shed vorticity being less stable at higher Re.

Energies 2016, 9, 73 13 of 18
100 101
f/fturbine
10-8
10-7
10-6
10-5
10-4
10-3
10-2
10-1
Spec
tral d
ensi
ty
(a)
ReD = 0. 4× 10⁶
ReD = 0. 6× 10⁶
ReD = 0. 8× 10⁶
ReD = 1. 0× 106
ReD = 1. 2× 10⁶
100 101
f/fturbine
10-8
10-7
10-6
10-5
10-4
10-3
10-2
10-1
Spec
tral d
ensi
ty
(b)
Figure 13. Cross-stream velocity (normalized by U∞) spectra at z/H = 0.25, y/R = −1.0 (−0.5 min Figure 3) (a) and y/R = 1.5 (+0.75 m in Figure 3) (b). Dashed vertical lines indicate [1, 3, 6, 9]times the turbine rotational frequency. Shaded regions indicate 95% confidence intervals assuming aχ2 distribution.
3.2.2. Transport of Mean Momentum and Kinetic Energy
The relative importance of various physical processes on mean streamwise momentum andkinetic energy transport/recovery in the streamwise direction were assessed by examining thegoverning equations rearranged to isolate the streamwise partial derivative (∂/∂x) for the quantitiesof interest [22], i.e., momentum:
∂U∂x
=1U
[−V
∂U∂y−W
∂U∂z
− 1ρ
∂P∂x
− ∂
∂xu′u′ − ∂
∂yu′v′ − ∂
∂zu′w′
+ ν
(∂2U∂x2 +
∂2U∂y2 +
∂2U∂z2
) ],
(8)
and mean kinetic energy:
∂K∂x
=1U
[−V
∂K∂y︸ ︷︷ ︸
y-adv.
−W∂K∂z︸ ︷︷ ︸
z-adv.
−1ρ
∂
∂xjPUiδij +
∂
∂xj2νUiSij −
12
∂
∂xju′iu′jUi︸ ︷︷ ︸
Turb.trans.
+ u′iu′j∂Ui∂xj︸ ︷︷ ︸
k-prod.
− 2νSijSij︸ ︷︷ ︸Mean diss.
],
(9)
where advection is abbreviated by “adv.,” turbulent transport by “turb. trans.,” production by “prod.,”and dissipation by “diss.”
Note that Equations (8) and (9) only differ from the typical forms of the mean momentum andmean kinetic energy equations by a factor of 1/U, but importantly, the other convective terms (∂U/∂y,∂U/∂z, and ∂K/∂y, ∂K/∂z) are moved to the right-hand sides of the equations to illustrate with whatsign they add to the streamwise recovery of streamwise momentum or mean kinetic energy.

Energies 2016, 9, 73 14 of 18
Results from the terms that can be computed from the experimental data (i.e., excluding ∂/∂x)from the right-hand sides of Equations (8) and (9) are plotted in Figures 14 and 15, respectively.Derivatives were computed using a second order finite difference scheme, with central differencing forinterior points and inward facing schemes for the boundaries. A weighted average for each term wasthen calculated based on the grid spacing. We note that similar to [22], the vertical advection at thispoint in the wake is the dominant contributor to positive wake recovery, caused by the unique vortexpattern created by the blade tips and blade wakes.
−V Uy
−W Uz −
yu ′v ′ −
zu ′w ′ ν
2U
y2(× 103) ν
2U
z2(× 103)
0. 06
0. 04
0. 02
0. 00
0. 02
0. 04
0. 06
0. 08
Utr
ansp
ort
UU∞D−
1
ReD = 0. 4× 10⁶
ReD = 0. 6× 10⁶
ReD = 0. 8× 10⁶
ReD = 1. 0× 106
ReD = 1. 2× 10⁶
Figure 14. Normalized streamwise momentum transport quantities computed as weighted averagesfrom Equation (8).
y-adv. z-adv. y-turb. z-turb. k-prod. Mean diss. (× 103)0. 10
0. 05
0. 00
0. 05
0. 10
0. 15
Ktr
ansp
ort
UK∞D−
1
ReD = 0. 4× 10⁶
ReD = 0. 6× 10⁶
ReD = 0. 8× 10⁶
ReD = 1. 0× 106
ReD = 1. 2× 10⁶
Figure 15. Normalized mean kinetic energy transport quantities computed as weighted averagesbased on Equation (9), omitting the non-measured streamwise derivatives. Note that directions of theturbulent transport terms refer to the directions of their partial derivatives.
We see that in general, levels of turbulent transport are slightly lower at larger Reynolds numbers.The viscous diffusion and dissipation, though still three orders of magnitude smaller than the otherterms, do increase at low Reynolds numbers, which is consistent with the physical meaning of theReynolds number itself. From these results, one might expect that the viscous effects will becomesignificant to the wake dynamics as the Reynolds number is decreased below ReD ∼ 104.
Transport due to cross-stream advection appears to become more negative at higher Re. This couldbe a consequence of increasing free surface deformation (higher Fr), which then decreases the effectiveflow cross-sectional area downstream of the turbine, forcing more flow to accelerate around the sides
Energies 2016, 9, 73 15 of 18
of the turbine. Note that we also observe slightly higher drag coefficients at higher Re (potentially forthe same reason), which also helps explain larger negative values of cross-stream advection.
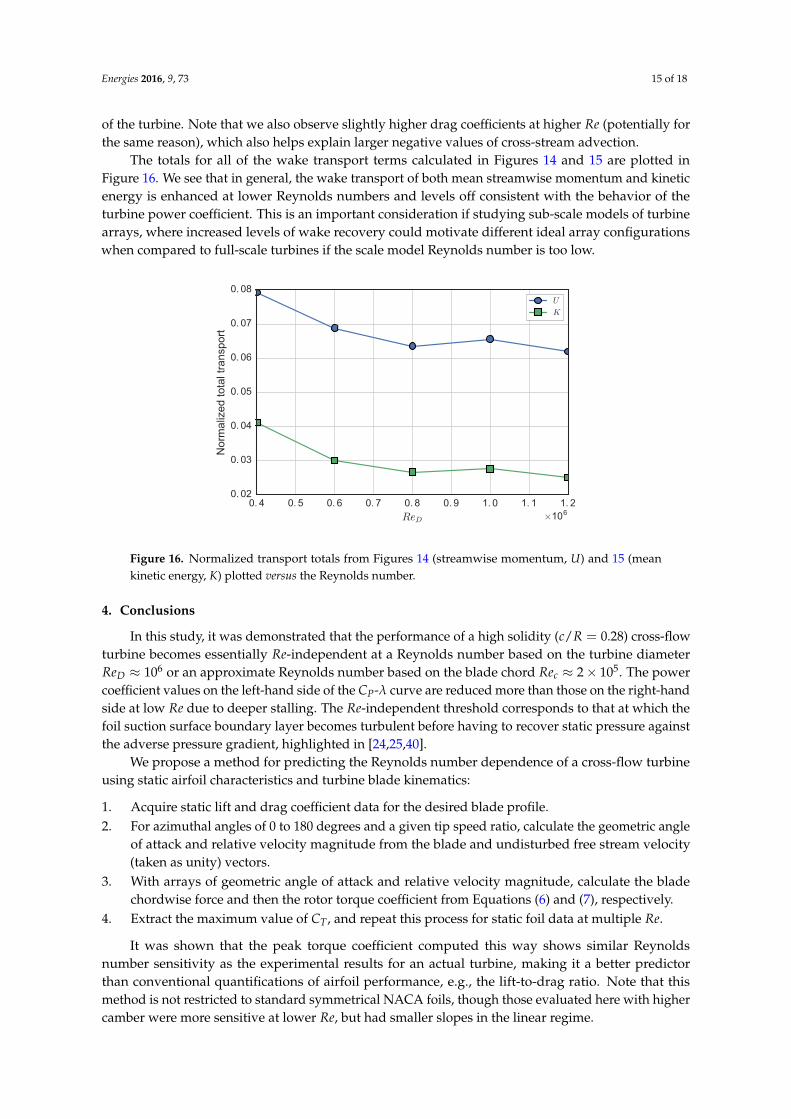
The totals for all of the wake transport terms calculated in Figures 14 and 15 are plotted inFigure 16. We see that in general, the wake transport of both mean streamwise momentum and kineticenergy is enhanced at lower Reynolds numbers and levels off consistent with the behavior of theturbine power coefficient. This is an important consideration if studying sub-scale models of turbinearrays, where increased levels of wake recovery could motivate different ideal array configurationswhen compared to full-scale turbines if the scale model Reynolds number is too low.
0. 4 0. 5 0. 6 0. 7 0. 8 0. 9 1. 0 1. 1 1. 2ReD ×106
0. 02
0. 03
0. 04
0. 05
0. 06
0. 07
0. 08
Nor
mal
ized
tota
l tra
nspo
rt
U
K
Figure 16. Normalized transport totals from Figures 14 (streamwise momentum, U) and 15 (meankinetic energy, K) plotted versus the Reynolds number.
4. Conclusions
In this study, it was demonstrated that the performance of a high solidity (c/R = 0.28) cross-flowturbine becomes essentially Re-independent at a Reynolds number based on the turbine diameterReD ≈ 106 or an approximate Reynolds number based on the blade chord Rec ≈ 2× 10⁵. The powercoefficient values on the left-hand side of the CP-λ curve are reduced more than those on the right-handside at low Re due to deeper stalling. The Re-independent threshold corresponds to that at which thefoil suction surface boundary layer becomes turbulent before having to recover static pressure againstthe adverse pressure gradient, highlighted in [24,25,40].
We propose a method for predicting the Reynolds number dependence of a cross-flow turbineusing static airfoil characteristics and turbine blade kinematics:
1. Acquire static lift and drag coefficient data for the desired blade profile.2. For azimuthal angles of 0 to 180 degrees and a given tip speed ratio, calculate the geometric angle
of attack and relative velocity magnitude from the blade and undisturbed free stream velocity(taken as unity) vectors.
3. With arrays of geometric angle of attack and relative velocity magnitude, calculate the bladechordwise force and then the rotor torque coefficient from Equations (6) and (7), respectively.
4. Extract the maximum value of CT , and repeat this process for static foil data at multiple Re.
It was shown that the peak torque coefficient computed this way shows similar Reynoldsnumber sensitivity as the experimental results for an actual turbine, making it a better predictorthan conventional quantifications of airfoil performance, e.g., the lift-to-drag ratio. Note that thismethod is not restricted to standard symmetrical NACA foils, though those evaluated here with highercamber were more sensitive at lower Re, but had smaller slopes in the linear regime.

Energies 2016, 9, 73 16 of 18
In the near-wake of the turbine, we observed lower levels of turbulence with increasing Reynoldsnumber, along with lower levels of turbulent transport with respect to mean streamwise momentumand mean kinetic energy recovery in the streamwise direction. Vertical advection, the largest transportmechanism measured, showed little Re-dependence, whereas the negative effects of cross-streamadvection were enhanced at high Re, which may be due to larger free surface deformation effectivelyreducing the near-wake’s cross-sectional area. Despite being orders of magnitude smaller than othertransport processes, viscous diffusion increased rapidly with decreasing Re and is expected to becomesignificant to the wake dynamics around ReD ∼ 104. Overall, the total wake transport measuredleveled off at essentially the same Reynolds number that the performance did: ReD ≈ 0.8× 10⁶.
From these results, we recommend that physical model tests of cross-flow turbines be performedat ReD ∼ 106 or greater to provide reasonable predictions of full-scale performance. This thresholdalso applies to the validation of predictive engineering models, especially for high-fidelity CFD modelswhere the boundary layer is to be resolved, since transition to turbulence plays an important role inoverall blade loading. Note that in our case, blockage, though reasonably low, may be increasing flowthrough the turbine compared to a free case, which could mean Re thresholds for free flows couldbe slightly higher, though a reliable blockage correction algorithm has not yet been agreed upon forCFTs [32].
If using scaled physical models to predict array performance, where turbine power output ismeasured, it may also be important to keep all turbines in the regime where the power coefficientvaries linearly to avoid exaggerated power deficiencies for downstream turbines, despite similaritiesin wake characteristics. Results here also suggest that low Reynolds number physical model studies ofturbine arrays may see exaggerated levels of wake recovery, leading to inadequate or inappropriatespacing or layouts.
Acknowledgments: The authors would like to acknowledge funding through a National Science FoundationCAREER award (principal investigator Martin Wosnik, NSF 1150797, Energy for Sustainability, program managerGregory L. Rorrer), a grant through the Leslie S. Hubbard Marine Program Endowment to purchase acoustic flowmeasurement instrumentation, and a grant for laboratory infrastructure upgrades through the U.S. Departmentof Energy.
Author Contributions: Peter Bachant conducted the experiments and analyzed the data. Both authors contributedequally to the writing and editing of the manuscript.
Conflicts of Interest: The authors declare no conflict of interest.
References
1. Acheson, D. Elementary Fluid Dynamics; Oxford University Press: Oxford, UK, 1990.2. Baker, C.; Brockie, N. Wind tunnel tests to obtain train aerodynamic drag coefficients: Reynolds number and
ground simulation effects. J. Wind Eng. Ind. Aerodyn. 1991, 38, 23–28.3. Paraschivoiu, I. Wind Turbine Design with Emphasis on Darrieus Concept, 1st ed.; Polytechnic International:
Montreal, QC, Canada, 2002.4. Templin, R.J. Aerodynamic Performance Theory for the NRC Vertical Axis Wind Turbine; Technical Report
LTR-LA-160; National Research Council Canada: Ottawa, ON, Canada, 1974.5. Fiedler, A.J.; Tullis, S. Blade offset and pitch effects on a high solidity vertical axis wind turbine. Wind Eng.
2009, 33, 237–246.6. Migliore, P.G.; Wolfe, W.P.; Fanucci, J.B. Flow curvature effects on darrieus turbine blade aerodynamics.
J. Energy 1980, 4, 49–55.7. Blackwell, B.; Sheldahl, R.; Feltz, L. Wind Tunnel Performance Data for the Darrieus Wind Turbine with NACA
0012 Blades; Report SAND76-0130; Sandia National Laboratories: Albuquerque, NM, USA, 1976.8. Polagye, B.L.; Cavagnaro, R.J.; Niblick, A.L. Micropower from tidal turbines. In Proceedings of the ASME
Fluids Engineering Division Summer Meeting, Incline Village, NV, USA, 7–11 July 2013.9. Bravo, R.; Tullis, S.; Ziada, S. Performance testing of a small vertical-axis wind turbine. In Proceedings of
the 21st Canadian Congress of Applied Mechanics CANCAM, Toronto, ON, Canada, 3–7 June 2007.

Energies 2016, 9, 73 17 of 18
10. Bachant, P.; Wosnik, M. Reynolds number dependence of cross-flow turbine performance and near-wakecharacteristics. In Proceedings of the 2nd Marine Energy Technology Symposium METS2014, Seattle, WA,USA, 15–18 April 2014.
11. Brochier, G.; Fraunie, P.; Beguier, C.; Paraschivoiu, I. Water channel experiments of dynamic stall on darrieuswind turbine blades. AIAA J. Propuls. Power 1986, 2, 46–510.
12. Fujisawa, N.; Shibuya, S. Observations of dynamic stall on Darrieus wind turbine blades. J. Wind Eng.Ind. Aerodyn. 2001, 89, 201–214.
13. Tescione, G.; Ragni, D.; He, C.; Simão Ferreira, C.J.; van Bussel, G.J.W. Near wake flow analysis of a verticalaxis wind turbine by stereoscopic particle image velocimetery. Renew. Energy 2014, 70, 47–61.
14. Krogstad, P.; Adaramola, M.S. Performance and near wake measurements of a model horizontal axis windturbine. Wind Energy 2012, 15, 743–756.
15. Walker, J.M.; Flack, K.A.; Lust, E.E.; Luznik, M.P.S.L. Experimental and numerical studies of blade roughnessand fouling on marine current turbine performance. Renew. Energy 2014, 66, 257–267.
16. McTavish, S.; Feszty, D.; Nitzsche, F. Evaluating Reynolds number effects in small-scale wind turbineexperiments. J. Wind Eng. Ind. Aerodyn. 2013, 120, 81–90.
17. Chamorro, L.P.; Arndt, R.E.A.; Sotiropoulos, F. Turbulent flow properties around a staggered wind farm.Bound. Layer Meteorol. 2011, 141, 349–367.
18. Chamorro, L.P.; Porte-Agel, F. Turbulent flow inside and above a wind farm: A wind-tunnel study. Energies2011, 4, 1916–1936.
19. Goldenberg, J.; Fekete, G. Mean flow energy content of boundary layer downstream of vertical-axiswind-turbine simulators. J. Wind Eng. Ind. Aerodyn. 1983, 12, 1–14.
20. Dabiri, J. Potential order-of-magnitude enhancement of wind farm power density via counter-rotatingvertical-axis wind turbine arrays. J. Renew. Sustain. Energy 2011, 3, 1–13.
21. Kinzel, M.; Mulligan, Q.; Dabiri, J.O. Energy exchange in an array of vertical-axis wind turbines. J. Turbul.2012, 13, 1–13.
22. Bachant, P.; Wosnik, M. Characterising the near-wake of a cross-flow turbine. J. Turbul. 2015, 16, 392–410.23. Jacobs, E.N.; Sherman, A. Airfoil Section Characteristics as Affected by Variation of the Reynolds Number; Technical
Report; National Advisory Committee for Aeronautics: Langley Field, VA, USA, 1937.24. Lissaman, P.B.S. Low-Reynolds-number airfoils. Ann. Rev. Fluid Mech. 1983, 15, 223–239.25. McMasters, J.H.; Henderson, M.L. Low-speed single-element airfoil synthesis. Tech. Soar. 1980, 6, 1–21.26. Bedon, G.; Antonini, E.G.; Betta, S.D.; Castelli, M.R.; Benini, E. Evaluation of the different aerodynamic
databases for vertical axis wind turbine simulations. Renew. Sustain. Energy Rev. 2014, 40, 386–399.27. Bousman, W.G. Evaluation of airfoil dynamic stall characteristics for maneuverability. In Proceedings of the
26th European Rotorcraft Forum, The Hague, The Netherlands, 26–29 September 2000.28. Singleton, J.D.; Yeager, W.T., Jr. Important scaling parameters for testing model-scale helicopter rotors.
J. Aircr. 2000, 37, 396–402.29. Yoon, H.; Hill, D.; Balachandar, S.; Adrian, R.; Ha, M. Reynolds number scaling of flow in a Rushton turbine
stirred tank. Part I—Mean flow, circular jet and tip vortex scaling. Chem. Eng. Sci. 2005, 60, 3169–3183.30. Chamorro, L.P.; Arndt, R.E.A.; Sotiropolous, F. Reynolds number dependence of turbulence statistics in the
wake of wind turbines. Wind Energy 2012, 15, 733–742.31. Neary, V.S.; Previsic, M.; Jepsen, R.A.; Lawson, M.J.; Yu, Y.H.; Copping, A.E.; Fontaine, A.A.; Hallett, K.C.;
Murray, D.K. Methodology for Design and Economic Analysis of Marine Energy Conversion (MEC) Technologies;Technical Report SAND2014-9040; Sandia National Laboratories: Albuquerque, NM, USA, 2014.
32. Cavagnaro, R.; Polagye, B. An evaluation of blockage corrections for a helical cross-flow turbine.In Proceedings of the 3rd Oxford Tidal Energy Workshop, Oxford, UK, 7–8 April 2014.
33. Bachant, P.; Wosnik, M. UNH-RVAT CAD Models. Figshare. Available online: http://dx.doi.org/10.6084/m9.figshare.1062009 (accessed on 20 June 2014).
34. Bachant, P.; Wosnik, M. UNH-RVAT Reynolds Number Dependence Experiment: Reduced Datasetand Processing Code. Figshare. Available online: http://dx.doi.org/10.6084/m9.figshare.1286960(accessed on 22 January 2016).
35. Coleman, H.W.; Steele, W.G. Experimentation, Validation, and Uncertainty Analysis for Engineers, 3rd ed.;John Wiley & Sons: Hoboken, NJ, USA, 2009.

Energies 2016, 9, 73 18 of 18
36. Drela, M. XFOIL: An Analysis and Design System for Low Reynolds Number Airfoils. In Low ReynoldsNumber Aerodynamics; Lecture Notes in Engineering; Springer Verlag: Berlin, Germany, 1989; Volume 54.
37. Castelli, M.R.; Garbo, F.; Benini, E. Numerical investigation of laminar to turbulent boundary layer transitionon a NACA 0012 airfoil for vertical-axis wind turbine applications. Wind Eng. 2011, 35, 661–686.
38. Marten, D.; Wendler, J.; Pechlivanoglou, G.; Nayeri, C.; Paschereit, C. QBlade: An open source tool fordesign and simulation of horizontal and vertical axis wind turbines. Int. J. Emerg. Technol. Adv. Eng. 2013,3, 264–269.
39. Bachant, P.; Wosnik, M. NACA XX20 XFOIL Coefficients. Zenodo. Available online: http://dx.doi.org/10.5281/zenodo.45099 (accessed on 22 January 2016).
40. Carmichael, B.H. Low Reynolds Number Airfoil Survey Volume I. Technical Report, National Aeronautics andSpace Administration: Capistrano Beach, CA, USA, 1981.
c© 2016 by the authors; licensee MDPI, Basel, Switzerland. This article is an open accessarticle distributed under the terms and conditions of the Creative Commons by Attribution(CC-BY) license (http://creativecommons.org/licenses/by/4.0/).
Copyright © 2022 FDOKUMEN