Effects of no-take area size and age of marine protected areas on fisheries yields: a...
15
Effects of no-take area size and age of marine protected areas on fisheries yields: a meta-analytical approach Frederic Vandeperre 1 , Ruth M. Higgins 1 , Julio Sa ´nchez-Meca 2 , Francesc Maynou 3 , Raquel Gon ˜i 4 , Pablo Martı ´n-Sosa 5 , Angel Pe ´rez-Ruzafa 6 , Pedro Afonso 1 , Iacopo Bertocci 7 , Romain Crec’hriou 8 , Giovanni D’Anna 9 , Mark Dimech 10 , Carmelo Dorta 11 , Oscar Esparza 6 , Jesu ´s M. Falco ´n 5,11 , Aitor Forcada 12 , Ivan Guala 13 , Laurence Le Direach 14 , Concepcio ´n Marcos 6 , Celia Ojeda-Martı ´nez 12 , Carlo Pipitone 9 , Patrick J. Schembri 10 , Vanessa Stelzenmu ¨ ller 3 , Ben Stobart 4 & Ricardo S. Santos 1 1 Departamento de Oceanografia e Pescas, Universidade dos Ac ¸ores, PT-9901-862 Horta, Portugal; 2 The Meta-analysis Unit, Universidad de Murcia, Campus de Espinardo, 30100 Murcia, Spain; 3 Institut de Cie `ncies del Mar (CSIC). Psg. Marı ´tim de la Barceloneta 37-49, 08003-Barcelona, Spain; 4 Centro Oceanogra ´fico de Baleares, Instituto Espan ˜ ol de Oceanografı ´a, Muelle Poniente s/n, Palma de Mallorca 07015, Spain; 5 Centro Oceanogra ´fico de Canarias, Instituto Espan ˜ol de Oceanografı ´a, Avda. Tres de Mayo, 73, Edf. Sanahuja. 38005 Santa Cruz de Tenerife, Canary Islands; 6 Deptartamento Ecologı ´a e Hidrologı ´a, Universidad de Murcia, Campus de Espinardo, 30100 Murcia, Spain; 7 Dipartimento di Biologia, CoNISMa, University of Pisa, Via Derna 1, I-56126 Pisa, Italy; 8 UMR 5244 CNRS-EPHE-UPVD, Biologie et Ecologie Tropicale et Me ´diterrane ´enne, Universite ´ de Perpignan Via Domitia, 52 Avenue Paul Alduy, 66860 Perpignan Cedex, France; 9 CNR-IAMC Sede di Castellammare del Golfo, via Giovanni da Verrazzano 17, I-91014 Castellammare del Golfo, Italy; 10 Department of Biology, University of Malta, Msida MSD2080, Malta; 11 Grupo de Investigacio ´n BIOECOMAC, Dpto. de Biologı ´a Animal (Ciencias Marinas), Facultad de Biologı ´a, Universidad de la Laguna, c/ Francisco Sa ´ nchez s/n, 38206 La Laguna, Canary Islands; 12 Unidad de Biologı ´a Marina, Departamento de Ciencias del Mar y Biologı ´a Aplicada, Universidad de Alicante. POB 99, E-03080 Alicante, Spain; 13 Fondazione IMC, International Marine Centre, Onlus, Loc. Sa Mardini, 09072 Torregrande (Oristano), Italy; 14 Groupement d’Inte ´re ˆt Scientifique (GIS) Posidonie, Parc Scientifique et Technologique de Luminy, 13288 Marseille Cedex 9, France Abstract Marine protected areas (MPAs) are often promoted as tools for biodiversity conservation as well as for fisheries management. Despite increasing evidence of their usefulness, questions remain regarding the optimal design of MPAs, in particular concerning their function as fisheries management tools, for which empirical studies are still lacking. Using 28 data sets from seven MPAs in Southern Europe, we developed a meta-analytical approach to investigate the effects of protection on adjacent fisheries and asking how these effects are influenced by MPA size and age. Southern European MPAs showed clear effects on the surrounding fisheries, on the ‘catch per unit effort’ (CPUE) of target species, but especially on the CPUE of the marketable catch. These effects depended on the time of protection and on the size of the no-take area. CPUE of both target species and the marketable catch increased gradually by 2–4% per year over a long time period (at least 30 years). The influence of the size of the no-take area appeared to be more complex. The catch rates of the entire fishery in and around the MPA were higher when the no-take areas were smaller. Conversely, catch rates of selected fisheries that were expected to benefit most from protection increased when the no-take area was larger. Our results emphasize the importance of MPA size on its export functions and suggest that an adequate, often extended, time frame be used for the management and the evaluation of effectiveness of MPAs. Correspondence: Frederic Vandeperre, Departamento de Oceanografia e Pescas, Universidade dos Ac¸ores, PT-9901- 862, Horta, Portugal Tel.: +351 292 200400 Fax: +351 292 200411 E-mail: vandeperre@ uac.pt Current addresses: Vanessa Stelzenmu¨l- ler: Johann Heinrich von Thu¨nen Institute (vTI), Federal Research Institute for Rural Areas, Forestry and Fisheries, Insti- tute of Sea Fisheries, Palmaille 9, 22767 F I S H and F I S H E R I E S , 2011, 12, 412–426 412 DOI: 10.1111/j.1467-2979.2010.00401.x Ó 2010 Blackwell Publishing Ltd
-
Upload
independent -
Category
Documents
-
view
0 -
download
0
Transcript of Effects of no-take area size and age of marine protected areas on fisheries yields: a...
Effects of no-take area size and age of marine protected areas
on fisheries yields: a meta-analytical approach
Frederic Vandeperre1, Ruth M. Higgins1, Julio Sanchez-Meca2, Francesc Maynou3, Raquel Goni4,
Pablo Martın-Sosa5, Angel Perez-Ruzafa6, Pedro Afonso1, Iacopo Bertocci7, Romain Crec’hriou8, Giovanni D’Anna9,
Mark Dimech10, Carmelo Dorta11, Oscar Esparza6, Jesus M. Falcon5,11, Aitor Forcada12, Ivan Guala13,
Laurence Le Direach14, Concepcion Marcos6, Celia Ojeda-Martınez12, Carlo Pipitone9, Patrick J. Schembri10,
Vanessa Stelzenmuller3, Ben Stobart4 & Ricardo S. Santos1
1Departamento de Oceanografia e Pescas, Universidade dos Acores, PT-9901-862 Horta, Portugal; 2 The Meta-analysis
Unit, Universidad de Murcia, Campus de Espinardo, 30100 Murcia, Spain; 3Institut de Ciencies del Mar (CSIC). Psg. Marıtim
de la Barceloneta 37-49, 08003-Barcelona, Spain; 4Centro Oceanografico de Baleares, Instituto Espanol de Oceanografıa,
Muelle Poniente s/n, Palma de Mallorca 07015, Spain; 5Centro Oceanografico de Canarias, Instituto Espanol de
Oceanografıa, Avda. Tres de Mayo, 73, Edf. Sanahuja. 38005 Santa Cruz de Tenerife, Canary Islands; 6Deptartamento
Ecologıa e Hidrologıa, Universidad de Murcia, Campus de Espinardo, 30100 Murcia, Spain; 7Dipartimento di Biologia,
CoNISMa, University of Pisa, Via Derna 1, I-56126 Pisa, Italy; 8UMR 5244 CNRS-EPHE-UPVD, Biologie et Ecologie
Tropicale et Mediterraneenne, Universite de Perpignan Via Domitia, 52 Avenue Paul Alduy, 66860 Perpignan Cedex,
France; 9CNR-IAMC Sede di Castellammare del Golfo, via Giovanni da Verrazzano 17, I-91014 Castellammare del Golfo,
Italy; 10Department of Biology, University of Malta, Msida MSD2080, Malta; 11Grupo de Investigacion BIOECOMAC, Dpto.
de Biologıa Animal (Ciencias Marinas), Facultad de Biologıa, Universidad de la Laguna, c/ Francisco Sanchez s/n, 38206 La
Laguna, Canary Islands; 12Unidad de Biologıa Marina, Departamento de Ciencias del Mar y Biologıa Aplicada, Universidad
de Alicante. POB 99, E-03080 Alicante, Spain; 13Fondazione IMC, International Marine Centre, Onlus, Loc. Sa Mardini,
09072 Torregrande (Oristano), Italy; 14Groupement d’Interet Scientifique (GIS) Posidonie, Parc Scientifique et
Technologique de Luminy, 13288 Marseille Cedex 9, France
Abstract
Marine protected areas (MPAs) are often promoted as tools for biodiversity
conservation as well as for fisheries management. Despite increasing evidence of
their usefulness, questions remain regarding the optimal design of MPAs, in
particular concerning their function as fisheries management tools, for which
empirical studies are still lacking. Using 28 data sets from seven MPAs in Southern
Europe, we developed a meta-analytical approach to investigate the effects of
protection on adjacent fisheries and asking how these effects are influenced by MPA
size and age. Southern European MPAs showed clear effects on the surrounding
fisheries, on the ‘catch per unit effort’ (CPUE) of target species, but especially on the
CPUE of the marketable catch. These effects depended on the time of protection and
on the size of the no-take area. CPUE of both target species and the marketable catch
increased gradually by 2–4% per year over a long time period (at least 30 years). The
influence of the size of the no-take area appeared to be more complex. The catch rates
of the entire fishery in and around the MPA were higher when the no-take areas were
smaller. Conversely, catch rates of selected fisheries that were expected to benefit most
from protection increased when the no-take area was larger. Our results emphasize
the importance of MPA size on its export functions and suggest that an adequate,
often extended, time frame be used for the management and the evaluation of
effectiveness of MPAs.
Correspondence:
Frederic Vandeperre,
Departamento de
Oceanografia e
Pescas, Universidade
dos Acores, PT-9901-
862, Horta, Portugal
Tel.:
+351 292 200400
Fax:
+351 292 200411
E-mail: vandeperre@
uac.pt
Current addresses:
Vanessa Stelzenmul-
ler: Johann Heinrich
von Thunen Institute
(vTI), Federal
Research Institute for
Rural Areas, Forestry
and Fisheries, Insti-
tute of Sea Fisheries,
Palmaille 9, 22767
F I S H and F I S H E R I E S , 2011, 12, 412–426
412 DOI: 10.1111/j.1467-2979.2010.00401.x � 2010 Blackwell Publishing Ltd
Introduction 413
Material and methods 415
Case studies and data 415
Meta-analysis approach 418
Results 419
Meta-analysis 419
Simple meta-regressions 419
Multiple meta-regressions 421
Discussion 422
Acknowledgements 424
References 424
Introduction
Marine protected areas (MPA) are increasingly
popular as management tools within the context
of an ecosystem approach to fisheries management
(Gell and Roberts 2003). They have the potential to
sustain the fisheries adjacent to the protected areas
while safeguarding species and habitats within.
While much research effort has been invested in
investigating the effects of protection on the con-
servation of habitats and species, less is known
about the potential of MPAs to sustain fisheries
(Hilborn et al. 2004; Sale et al. 2005). Within this
context, this study attempts to fill the important
need of empirical studies investigating the influence
of MPA features such as no-take area size and age
on its function as a fisheries management tool.
There are two main mechanisms through which
MPAs can directly increase yields: (i) export of eggs
and larvae from the MPA to the surrounding fished
areas and (ii) spillover of juvenile and adult biomass
across the MPA boundaries (Russ 2002; Gell and
Roberts 2003; Sale et al. 2005). Spillover across
MPA boundaries is the mechanism that has been
most extensively investigated, partly because larval
export is technically much more difficult to assess.
Most evidence of MPA spillover effects comes from
tropical systems (e.g. McClanahan and Kaunda-
Arara 1996; Russ and Alcala 1996, 1998; McCl-
anahan and Mangi 2000; Kaunda-Arara and Rose
2004; Abesamis and Russ 2005; Floeter et al.
2006), whereas studies from the Mediterranean
(Goni et al. 2006, 2008; Stelzenmuller et al. 2007,
2008a,b, Stobart et al. 2009) and other temperate
systems (Piet and Rijnsdorp 1998; Murawski et al.
2004, 2005; Jaworski et al. 2006) are more rare.
Spillover has been investigated mainly for single
MPAs through the observation of density gradients
across reserve boundaries, the analysis of fisheries
catch per unit effort/area (CPUE/CPUA) patterns
and the examination of the size composition of
fishery catches near reserves. The few studies that
investigated effects of several temperate MPAs on
surrounding fisheries (Murawski et al. 2004, 2005;
Goni et al. 2008; Stelzenmuller et al. 2008a) pro-
vided evidence of effort concentration and negative
gradients of fisheries CPUE and CPUA with distance
to the no-take area boundary.
Keywords Catch per unit effort, fishery yields, marine protected area design, marine
reserve, meta-analysis, spillover
Hamburg, Germany
Iacopo Bertocci:
CIIMAR, Centro
Interdisciplinar de
Investigacao Marinha
e Ambiental, Rua dos
Bragas 289, 4050-123,
Porto, Portugal
Received 20 Jan 2010
accepted 22 Nov 2010
MPA size and age: effects on fisheries F Vandeperre et al.
� 2010 Blackwell Publishing Ltd, F I S H and F I S H E R I E S , 12, 412–426 413
These previous studies have revealed that the
direction and magnitude of MPA effects on fisheries
can vary and are in fact difficult to predict
(McClanahan and Mangi 2000; Sale et al. 2005).
Although the number of studies investigating effects
of MPAs is increasing, there is still a lack of
empirical work evaluating the contribution of
MPA design and age to the effects of MPAs,
especially regarding effects on fisheries (Botsford
et al. 2003; Hilborn et al. 2004; Sale et al. 2005).
Most of our knowledge is based on modelling studies
(De Martini 1993; Hastings and Botsford 1999,
2003; Nowlis and Roberts 1999; Rodwell et al.
2002, 2003; Botsford et al. 2003; Zeller and Reinert
2004), while only a few empirical studies attempted
to tackle this issue. One of the difficulties lies in the
way that MPAs have been designed. MPAs have
often been created for conservation purposes and
were designed on an opportunistic basis, resulting
from political and economical compromises, rather
than based on ecological criteria (Harmelin 2000).
Moreover, a general framework for designing MPAs
to allow their subsequent evaluation (e.g. through
adaptive management) is lacking (Hilborn et al.
2004; Sale et al. 2005). Therefore, the few studies
that did evaluate MPA features resulted from
occasional changes in management plans (e.g.
McClanahan and Mangi 2000). Another difficulty
is the general scarcity of time series of spatially
replicated monitoring data of appropriate resolution
to allow for an evaluation of MPA effectiveness (Gell
and Roberts 2003; Willis et al. 2003). Only recently
have studies evaluated differences in MPA design
and estimated recovery rates through multiple MPA
comparisons. A common strategy has been to use
certain types of meta-analysis, using published data
(Mosqueira et al. 2000; Cote et al. 2001; Halpern
and Warner 2002; Halpern 2003; Micheli et al.
2004; Molloy et al. 2009), raw empirical data (Russ
et al. 2005; Claudet et al. 2008), or both (Guidetti
and Sala 2007). These studies analysed biological
variables such as fish density (Mosqueira et al.
2000; Cote et al. 2001; Halpern and Warner
2002; Halpern 2003; Micheli et al. 2004; Guidetti
and Sala 2007; Claudet et al. 2008; Molloy et al.
2009), fish biomass (Halpern and Warner 2002;
Halpern 2003; Micheli et al. 2004; Russ et al. 2005;
Guidetti and Sala 2007), fish size (Halpern and
Warner 2002; Halpern 2003) and fish diversity
measures (Cote et al. 2001; Halpern and Warner
2002; Halpern 2003; Claudet et al. 2008), compar-
ing locations inside and outside MPAs, and offered
important insights into the mechanisms by which
MPAs may contribute to the protection and resto-
ration of biomass and biodiversity. However, to our
knowledge, no multiple comparative studies have
attempted to investigate the influence of MPA
features, such as age and no-take area size, on the
export functions of MPAs, in spite of many authors
arguing for the need for such studies (Roberts et al.
2001; Hilborn et al. 2004; Sale et al. 2005). The
results of these meta-analytical studies were often
inconsistent and somewhat contradictory: no age
effect (Mosqueira et al. 2000; Cote et al. 2001) vs.
slow (Russ et al. 2005; Guidetti and Sala 2007;
Claudet et al. 2008; Molloy et al. 2009) vs. fast
recovery (Halpern and Warner 2002) and no effect
(Cote et al. 2001; Halpern 2003; Guidetti and Sala
2007) vs. positive effect of no-take area size (Claudet
et al. 2008), leading us to expect similarly variable
results for fisheries data.
The aim of the present study was to evaluate the
effects of MPAs on catches of the surrounding
fisheries, and the extent to which these vary with
the following MPA features: time of protection, size
of the no-take area and distance from the no-take
area border. Therefore, we collected catch and effort
data from in and around 13 MPAs located in the
Mediterranean and NE Atlantic region. These
regions are characterized by a largely artisanal,
multispecies fishery, which in the Mediterranean
accounts for 80% of the EU fishing fleet and
generates more than 100 000 jobs (COM 2002).
These artisanal fisheries are typified by highly
diverse fishing gears and target species, as well as
a marked seasonality. While they may have specific
target species, they also may tend to optimize the
aggregated catch (Goni et al. 2008). For artisanal
fisheries in particular, which are showing signs of
decline in many coastal areas (Gomez et al. 2006),
MPAs may be the most opportune management tool
(Hilborn et al. 2004). We developed a meta-analyt-
ical approach to (i) analyse trends in CPUE data
gathered in and around Atlanto-Mediterranean
MPAs and (ii) to relate these trends to important
MPA features. The advantage of using raw empir-
ical data from a single biogeographical region is that
it allows us to avoid problems resulting from
publication bias as well as those associated with
analysing results from different biogeographical
regions (Claudet et al. 2008). We performed the
analysis on four different response variables, differ-
entiating between CPUE of a single gear (1)
(targeting a particular species/group) and standard-
MPA size and age: effects on fisheries F Vandeperre et al.
414 � 2010 Blackwell Publishing Ltd, F I S H and F I S H E R I E S , 12, 412–426
ized gears (S) (combining CPUEs from all the gears
that intentionally or unintentionally catch those
species/groups) and between CPUE of target species
(T) and the marketable catch (M), assuming differ-
ent responses to protection. We calculated the
response variables for standardized gears to enable
generalizations on the effects of MPAs on an entire
fishery for a given species/group. In contrast, in the
case of the analysis for single gears, we investigated
the effects of MPAs for fisheries that specifically
target that species/group and that are expected to
benefit most from protection.
Material and methods
Case studies and data
To investigate the effects of protection on commer-
cial catches in and around MPAs in the western
Mediterranean and eastern Atlantic region, we
collected raw catch and landings data from the
commercial fisheries from 13 MPAs and yielded 80
data sets, each data set representing catch or
landings data for 1 year for a specific MPA. The
data were derived from existing databases that were
compiled from a variety of national and interna-
tional programmes and research projects in which
the co-authors participated. The data were
subsequently filtered using the following criteria:
(i) reliable and detailed spatially referenced catch
and effort data, (ii) presence of adequate reference
areas and (iii) comparable protection status (for
instance the presence of a no-take area and the level
of enforcement), resulting in a reduced data set of
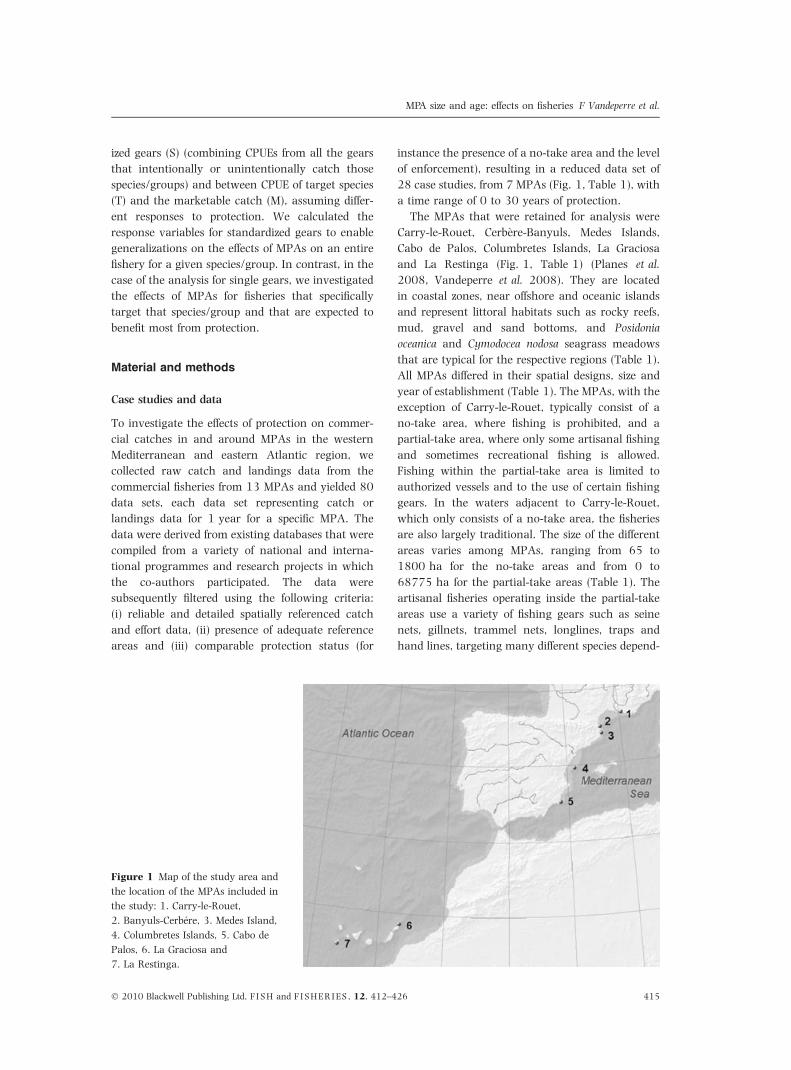
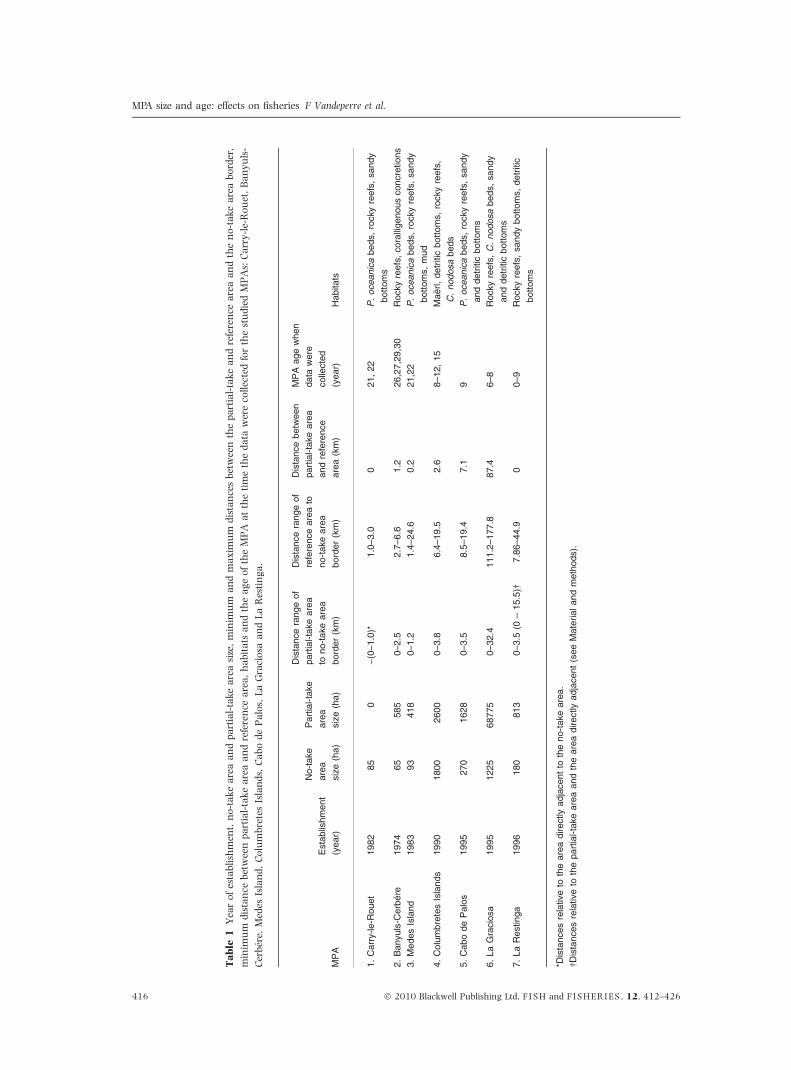
28 case studies, from 7 MPAs (Fig. 1, Table 1), with
a time range of 0 to 30 years of protection.
The MPAs that were retained for analysis were
Carry-le-Rouet, Cerbere-Banyuls, Medes Islands,
Cabo de Palos, Columbretes Islands, La Graciosa
and La Restinga (Fig. 1, Table 1) (Planes et al.
2008, Vandeperre et al. 2008). They are located
in coastal zones, near offshore and oceanic islands
and represent littoral habitats such as rocky reefs,
mud, gravel and sand bottoms, and Posidonia
oceanica and Cymodocea nodosa seagrass meadows
that are typical for the respective regions (Table 1).
All MPAs differed in their spatial designs, size and
year of establishment (Table 1). The MPAs, with the
exception of Carry-le-Rouet, typically consist of a
no-take area, where fishing is prohibited, and a
partial-take area, where only some artisanal fishing
and sometimes recreational fishing is allowed.
Fishing within the partial-take area is limited to
authorized vessels and to the use of certain fishing
gears. In the waters adjacent to Carry-le-Rouet,
which only consists of a no-take area, the fisheries
are also largely traditional. The size of the different
areas varies among MPAs, ranging from 65 to
1800 ha for the no-take areas and from 0 to
68775 ha for the partial-take areas (Table 1). The
artisanal fisheries operating inside the partial-take
areas use a variety of fishing gears such as seine
nets, gillnets, trammel nets, longlines, traps and
hand lines, targeting many different species depend-
Figure 1 Map of the study area and
the location of the MPAs included in
the study: 1. Carry-le-Rouet,
2. Banyuls-Cerbere, 3. Medes Island,
4. Columbretes Islands, 5. Cabo de
Palos, 6. La Graciosa and
7. La Restinga.
MPA size and age: effects on fisheries F Vandeperre et al.
� 2010 Blackwell Publishing Ltd, F I S H and F I S H E R I E S , 12, 412–426 415
Ta
ble
1Y
ear
of
esta
bli
shm
ent,
no
-ta
ke
are
aa
nd
pa
rtia
l-ta
ke
are
asi
ze,
min
imu
ma
nd
ma
xim
um
dis
tan
ces
bet
wee
nth
ep
art
ial-
tak
ea
nd
refe
ren
cea
rea
an
dth
en
o-t
ak
ea
rea
bo
rder
,
min
imu
md
ista
nce
bet
wee
np
art
ial-
tak
ea
rea
an
dre
fere
nce
are
a,
ha
bit
ats
an
dth
ea
ge
of
the
MP
Aa
tth
eti
me
the
da
taw
ere
coll
ecte
dfo
rth
est
ud
ied
MP
As:
Ca
rry
-le-
Ro
uet
,B
an
yu
ls-
Cer
ber
e,M
edes
Isla
nd
,C
olu
mb
rete
sIs
lan
ds,
Ca
bo
de
Pa
los,
La
Gra
cio
saa
nd
La
Res
tin
ga
.
MP
A
Esta
blis
hm
ent
(year)
No-t
ake
are
a
siz
e(h
a)
Part
ial-ta
ke
are
a
siz
e(h
a)
Dis
tance
range
of
part
ial-ta
ke
are
a
tono-t
ake
are
a
bord
er
(km
)
Dis
tance
range
of
refe
rence
are
ato
no-t
ake
are
a
bord
er
(km
)
Dis
tance
betw
een
part
ial-ta
ke
are
a
and
refe
rence
are
a(k
m)
MP
Aage
when
data
were
colle
cte
d
(year)
Habitats
1.
Carr
y-le-R
ouet
1982
85
0)
(0–1.0
)*1.0
–3.0
021,
22
P.
oceanic
abeds,
rocky
reefs
,sandy
bott
om
s
2.
Banyuls
-Cerb
ere
1974
65
585
0–2.5
2.7
–6.6
1.2
26,2
7,2
9,3
0R
ocky
reefs
,cora
lligenous
concre
tions
3.
Medes
Isla
nd
1983
93
418
0–1.2
1.4
–24.6
0.2
21,2
2P
.oceanic
abeds,
rocky
reefs
,sandy
bott
om
s,
mud
4.
Colu
mbre
tes
Isla
nds
1990
1800
2600
0–3.8
6.4
–19.5
2.6
8–12,
15
Maerl,
detr
itic
bott
om
s,
rocky
reefs
,
C.
nodosa
beds
5.
Cabo
de
Palo
s1995
270
1628
0–3.5
8.5
–19.4
7.1
9P
.oceanic
abeds,
rocky
reefs
,sandy
and
detr
itic
bott
om
s
6.
La
Gra
cio
sa
1995
1225
68775
0–32.4
111.2
–177.8
87.4
6–8
Rocky
reefs
,C
.nodosa
beds,
sandy
and
detr
itic
bott
om
s
7.
La
Restinga
1996
180
813
0–3.5
(0–
15.5
)�7.8
6–44.9
00–9
Rocky
reefs
,sandy
bott
om
s,
detr
itic
bott
om
s
*Dis
tances
rela
tive
toth
eare
adirectly
adja
cent
toth
eno-t
ake
are
a.
�Dis
tances
rela
tive
toth
epart
ial-ta
ke
are
aand
the
are
adirectly
adja
cent
(see
Mate
rial
and
meth
ods).
MPA size and age: effects on fisheries F Vandeperre et al.
416 � 2010 Blackwell Publishing Ltd, F I S H and F I S H E R I E S , 12, 412–426
ing on the season. Close examination of Table 1
reveals some gaps in our data set, i.e. a shortage of
case studies with intermediate characteristics, such
as MPAs with intermediate sizes and studies con-
ducted between 15–22 and 22–26 years after MPA
establishment, and a trend for more recent MPAs to
be larger. This is especially so for the partial-take
areas where some fishing is still allowed. These
limitations need to be considered for the analyses
and their interpretation.
A major problem in measuring effects of protec-
tion by MPAs is the lack of independent control sites
(Gell and Roberts 2003; Halpern et al. 2004;
Samoilys et al. 2007). To overcome this, we adopted
a comparative approach. CPUE data of the area
directly adjacent to the no-take area of the MPA
were compared to data from a comparable area far
from the MPA, i.e. an area with similar habitat
characteristics (Russ et al. 2005) and subjected to
similar fishing practises where no or limited influ-
ence of the MPA is expected. This reference area
cannot be considered a control site sensu strictu,
mainly because the extent of the influence of MPAs
and the factors determining this extent are complex
and often unknown (Gell and Roberts 2003; Halp-
ern et al. 2004). We chose the reference areas with
particular care on a case-by-case basis and only
those MPAs where an acceptable reference location
could be designated were retained for analysis. The
area directly adjacent to the no-take area coincided
with the partial-take area or, in the case of Carry-le-
Rouet, with the area directly outside the MPA. In
the case of La Restinga, the fishing tactics and the
boats operating in the partial-take area and the
immediate vicinity of the MPA are the same, even
though different regulations are in place. As the
landings in these two areas were not recorded
separately, we considered the two zones as one
entity for the analysis.
We developed a generic approach using different
response variables as artisanal fisheries in this study
were very diverse in relation to their tactics and
target species. We considered four different response
variables: (T1) CPUE of target species for a single
gear, (M1) CPUE of the marketable catch for a single
gear, (TS) CPUE of target species for standardized
gears and (MS) CPUE of the marketable catch for
standardized gears. The marketable catch (M1 and
MS) was the aggregated catch of all target and
commercialized by-catch species, i.e. species with
commercial value that are not specifically targeted
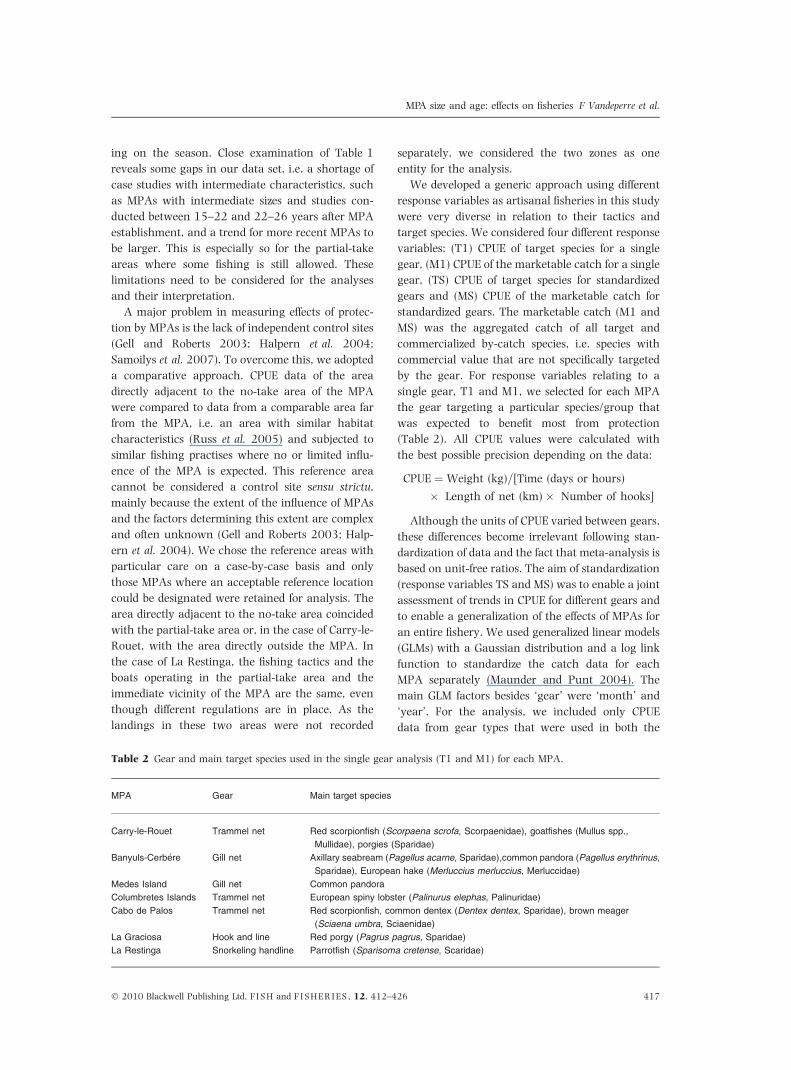
by the gear. For response variables relating to a
single gear, T1 and M1, we selected for each MPA
the gear targeting a particular species/group that
was expected to benefit most from protection
(Table 2). All CPUE values were calculated with
the best possible precision depending on the data:
CPUE ¼Weight (kg)=[Time (days or hours)
� Length of net (km)� Number of hooks]
Although the units of CPUE varied between gears,
these differences become irrelevant following stan-
dardization of data and the fact that meta-analysis is
based on unit-free ratios. The aim of standardization
(response variables TS and MS) was to enable a joint
assessment of trends in CPUE for different gears and
to enable a generalization of the effects of MPAs for
an entire fishery. We used generalized linear models
(GLMs) with a Gaussian distribution and a log link
function to standardize the catch data for each
MPA separately (Maunder and Punt 2004). The
main GLM factors besides ‘gear’ were ‘month’ and
‘year’. For the analysis, we included only CPUE
data from gear types that were used in both the
Table 2 Gear and main target species used in the single gear analysis (T1 and M1) for each MPA.
MPA Gear Main target species
Carry-le-Rouet Trammel net Red scorpionfish (Scorpaena scrofa, Scorpaenidae), goatfishes (Mullus spp.,
Mullidae), porgies (Sparidae)
Banyuls-Cerbere Gill net Axillary seabream (Pagellus acarne, Sparidae),common pandora (Pagellus erythrinus,
Sparidae), European hake (Merluccius merluccius, Merluccidae)
Medes Island Gill net Common pandora
Columbretes Islands Trammel net European spiny lobster (Palinurus elephas, Palinuridae)
Cabo de Palos Trammel net Red scorpionfish, common dentex (Dentex dentex, Sparidae), brown meager
(Sciaena umbra, Sciaenidae)
La Graciosa Hook and line Red porgy (Pagrus pagrus, Sparidae)
La Restinga Snorkeling handline Parrotfish (Sparisoma cretense, Scaridae)
MPA size and age: effects on fisheries F Vandeperre et al.
� 2010 Blackwell Publishing Ltd, F I S H and F I S H E R I E S , 12, 412–426 417
areas surrounding the no-take area and the
reference area. The gear types included different
types of gillnets, trammel nets, bottom longlines
and hand lines targeting fishes of the families
Sparidae, Scorpaenidae, Mullidae, Lophiidae, Ser-
ranidae, Scaridae, Berycidae, Polymixiidae and
Balistidae as well as Palinurid lobsters. Further,
we excluded from the analyses catch data of highly
migratory species and catches of fishing gears
targeting these species as possible MPA benefits for
these species are unlikely to be detected by our
methodology (see Le Quesne and Codling 2009).
Because not all response variables could be calcu-
lated for each data set, the different analyses were
conducted on a subset of MPAs (5–6) and case
studies (20–26) (see Tables 3, 4 and 5).
Meta-analysis approach
We developed a meta-analytical approach to relate
differences in CPUEs between fishing grounds adja-
cent to no-take areas and at reference sites with MPA
features (time since protection, size of the no-take
area and distance from the no-take area border). We
used log-response ratios (L), a unit-free measure,
comparing the mean CPUE adjacent to the no-take
area and at the reference site (Hedges et al. 1999):
Li ¼ LogeðX
i;A
Xi;F
Þ
and calculated the corresponding within-study
variances vL,i as follows (Hedges et al. 1999):
vL;i ¼s2
i;A
ni;AX2
i;A
þs2
i;F
ni;FX2
i;F
where Li is the log-response ratio for case study i,
Xi;A
and Xi;F
are the mean CPUEs adjacent to the
no-take area (A) and at the reference site (F), s2i;A and
s2i;F are the variances associated with X
i;Aand X
i;F, n is
the sample size, i.e. the number of hauls (or fishing
sets sampled). We included zero values for the
calculation of mean CPUE of target species, while no
zero catches were registered for the marketable catch.
Positive values of these log-response ratios indicate
higher CPUE values adjacent to than far from the
MPA. For every case study, the distance to the no-
take area border was calculated as the mean distance
to the border of each haul or each trip inside the
adjacent area or of the mean distance to the border of
the area itself, depending on the available data.
Weighted average effect sizes were computed
using random effects meta-analysis, assuming that
the effect estimates for each case study measured
different parametric effects inherent to the different
designs and characteristics of the MPAs. Therefore,
the analysis explicitly takes both the within-study
and between-study variances into account for the
weighting (Gurevitch and Hedges 1999; Hedges
et al. 1999):
wi ¼1
vL;i þ vb
where wi is the weight of case study i, VL,i
is the within-study variance of case study i and vb
is the between-study variance.
Association between effect sizes and moderator
variables, i.e. the MPA features, was first analysed
using weighted simple mixed-effects regression
models (by restricted maximum likelihood) (Rosen-
berg et al. 2000). In a second step, we constructed
three weighted multiple mixed-effects regression
models (by unrestricted maximum likelihood) for
each response variable i.e. the three possible com-
binations of two moderator variables: model A –
Time since protection · Distance from no-take area,
model B – Time since protection · Size of the
no-take area and model C – Distance from no-take
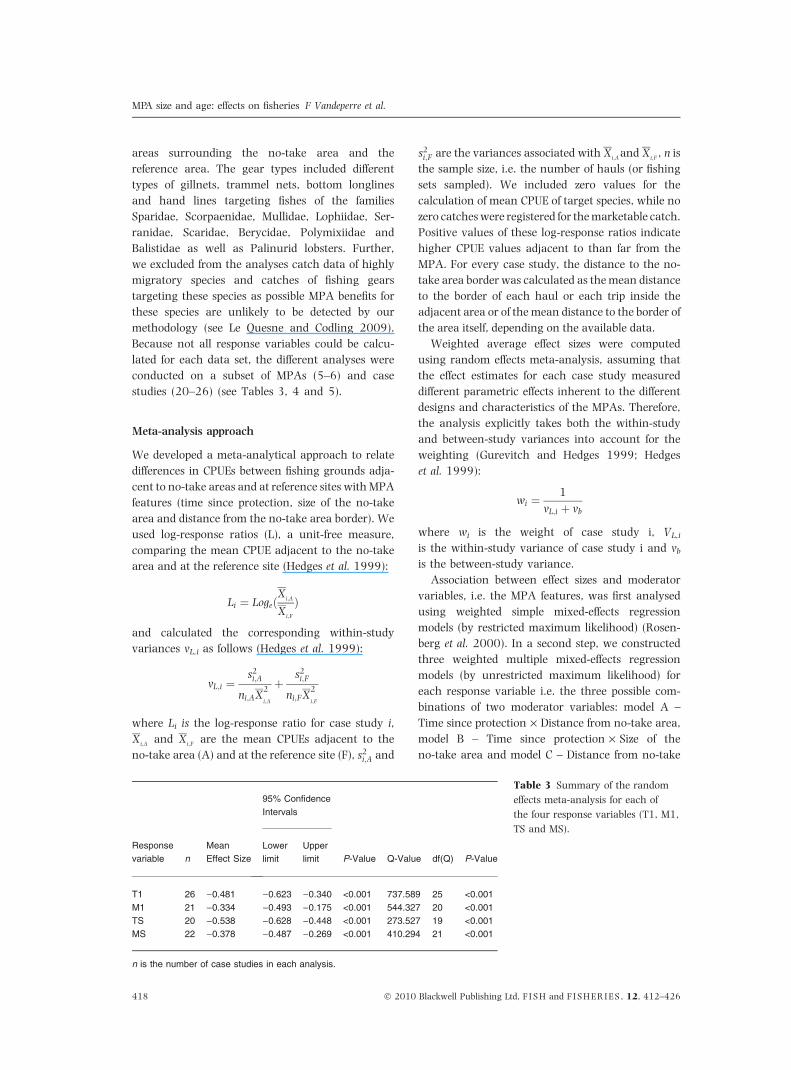
Table 3 Summary of the random
effects meta-analysis for each of
the four response variables (T1, M1,
TS and MS).
Response
variable n
Mean
Effect Size
95% Confidence
Intervals
P-Value Q-Value df(Q) P-Value
Lower
limit
Upper
limit
T1 26 )0.481 )0.623 )0.340 <0.001 737.589 25 <0.001
M1 21 )0.334 )0.493 )0.175 <0.001 544.327 20 <0.001
TS 20 )0.538 )0.628 )0.448 <0.001 273.527 19 <0.001
MS 22 )0.378 )0.487 )0.269 <0.001 410.294 21 <0.001
n is the number of case studies in each analysis.
MPA size and age: effects on fisheries F Vandeperre et al.
418 � 2010 Blackwell Publishing Ltd, F I S H and F I S H E R I E S , 12, 412–426
area · Size of the no-take area (Rosenberg et al.
2000). The number of studies (n) did not allow
constructing models with all three moderator vari-
ables. We tested for linear correlation between
moderator variables to account for collinearity.
Analyses were carried out using the following
software packages: R, Comprehensive Meta-analysis
2, SPSS 15.0 (meta-analysis macro metareg.sps,
developed by D.B. Wilson) and Statistica 6.0.
Results
Meta-analysis
Mean effect sizes were negative for all analyses,
implying that the CPUEs from the area adjacent to
the no-take area were lower than in the reference
locations (Table 3). Yet, effect sizes for all response
variables were heterogeneous (Q statistics, Table 3),
suggesting that the influence on CPUEs varied
among MPAs. The mean effect sizes were lower for
the catches of target species (TS and T1), compared
to the marketable catch (MS and M1). The mean
effect size for TS and MS were lower than T1 and
M1, respectively (Table 3).
Simple meta-regressions
Simple meta-regressions revealed a positive rela-
tionship between effect size and time of protection
for all four response variables, which was significant
for three out of four response variables (TS, MS and
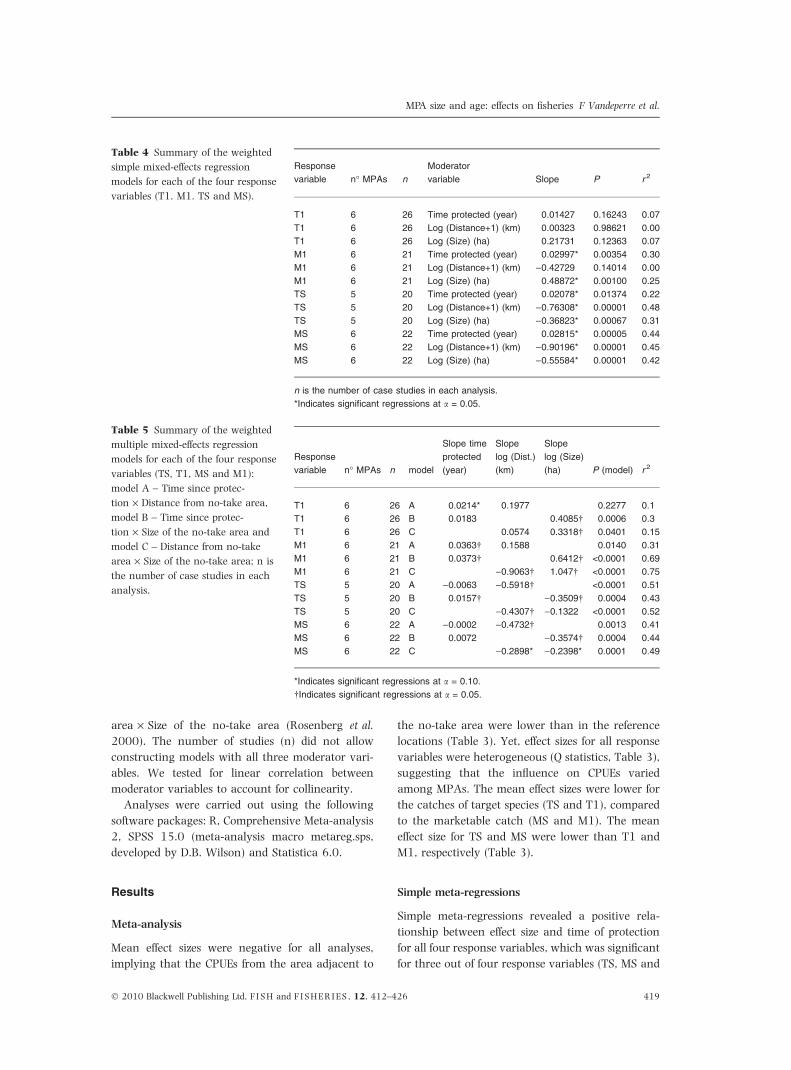
Table 4 Summary of the weighted
simple mixed-effects regression
models for each of the four response
variables (T1. M1. TS and MS).
Response
variable n� MPAs n
Moderator
variable Slope P r 2
T1 6 26 Time protected (year) 0.01427 0.16243 0.07
T1 6 26 Log (Distance+1) (km) 0.00323 0.98621 0.00
T1 6 26 Log (Size) (ha) 0.21731 0.12363 0.07
M1 6 21 Time protected (year) 0.02997* 0.00354 0.30
M1 6 21 Log (Distance+1) (km) )0.42729 0.14014 0.00
M1 6 21 Log (Size) (ha) 0.48872* 0.00100 0.25
TS 5 20 Time protected (year) 0.02078* 0.01374 0.22
TS 5 20 Log (Distance+1) (km) )0.76308* 0.00001 0.48
TS 5 20 Log (Size) (ha) )0.36823* 0.00067 0.31
MS 6 22 Time protected (year) 0.02815* 0.00005 0.44
MS 6 22 Log (Distance+1) (km) )0.90196* 0.00001 0.45
MS 6 22 Log (Size) (ha) )0.55584* 0.00001 0.42
n is the number of case studies in each analysis.
*Indicates significant regressions at a = 0.05.
Table 5 Summary of the weighted
multiple mixed-effects regression
models for each of the four response
variables (TS, T1, MS and M1):
model A – Time since protec-
tion · Distance from no-take area,
model B – Time since protec-
tion · Size of the no-take area and
model C – Distance from no-take
area · Size of the no-take area; n is
the number of case studies in each
analysis.
Response
variable n� MPAs n model
Slope time
protected
(year)
Slope
log (Dist.)
(km)
Slope
log (Size)
(ha) P (model) r 2
T1 6 26 A 0.0214* 0.1977 0.2277 0.1
T1 6 26 B 0.0183 0.4085� 0.0006 0.3
T1 6 26 C 0.0574 0.3318� 0.0401 0.15
M1 6 21 A 0.0363� 0.1588 0.0140 0.31
M1 6 21 B 0.0373� 0.6412� <0.0001 0.69
M1 6 21 C )0.9063� 1.047� <0.0001 0.75
TS 5 20 A )0.0063 )0.5918� <0.0001 0.51
TS 5 20 B 0.0157� )0.3509� 0.0004 0.43
TS 5 20 C )0.4307� )0.1322 <0.0001 0.52
MS 6 22 A )0.0002 )0.4732� 0.0013 0.41
MS 6 22 B 0.0072 )0.3574� 0.0004 0.44
MS 6 22 C )0.2898* )0.2398* 0.0001 0.49
*Indicates significant regressions at a = 0.10.
�Indicates significant regressions at a = 0.05.
MPA size and age: effects on fisheries F Vandeperre et al.
� 2010 Blackwell Publishing Ltd, F I S H and F I S H E R I E S , 12, 412–426 419
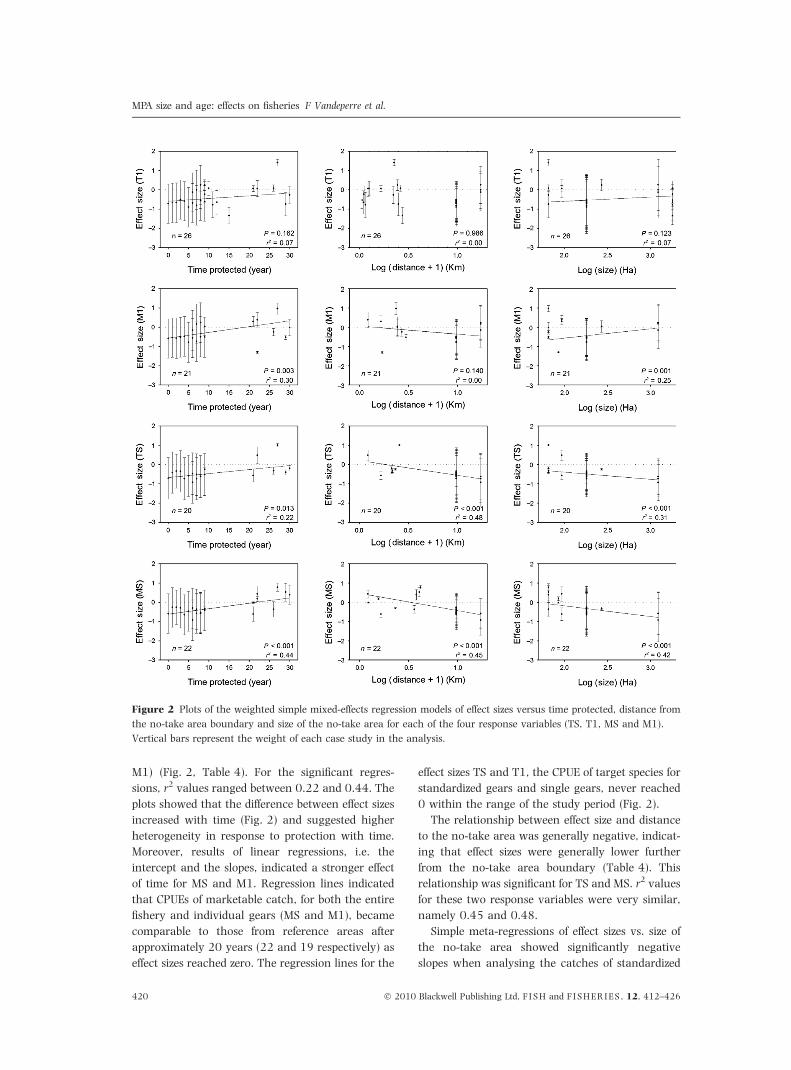
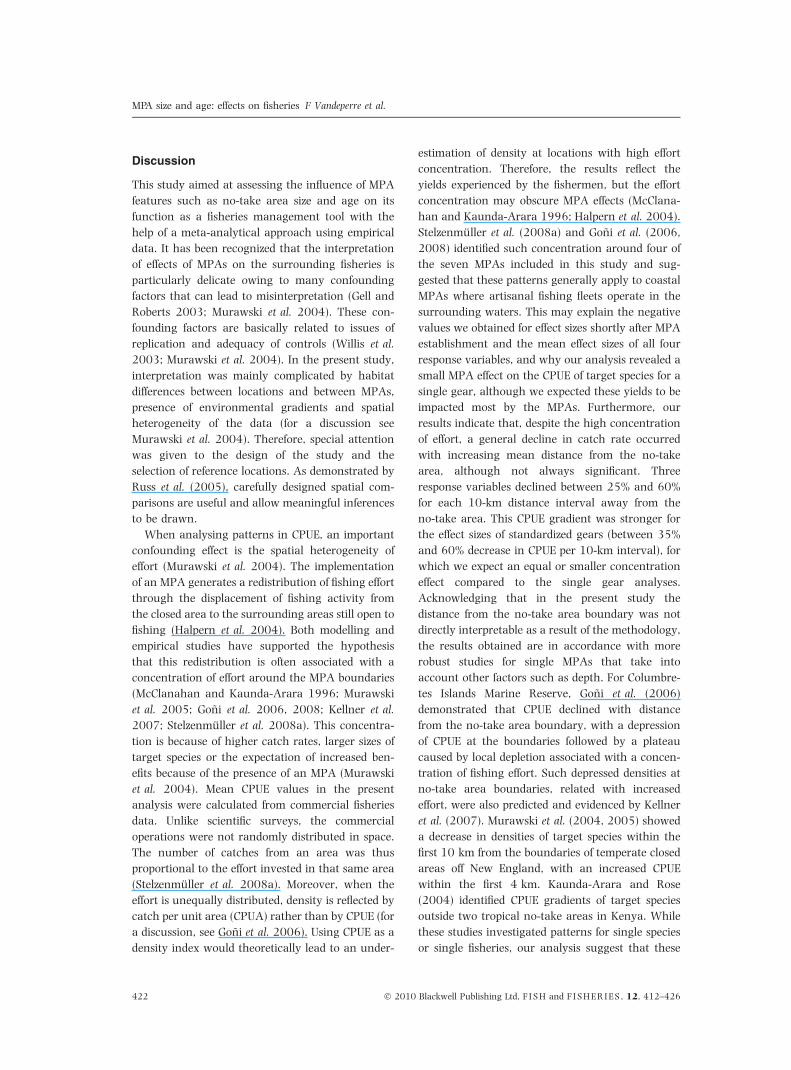
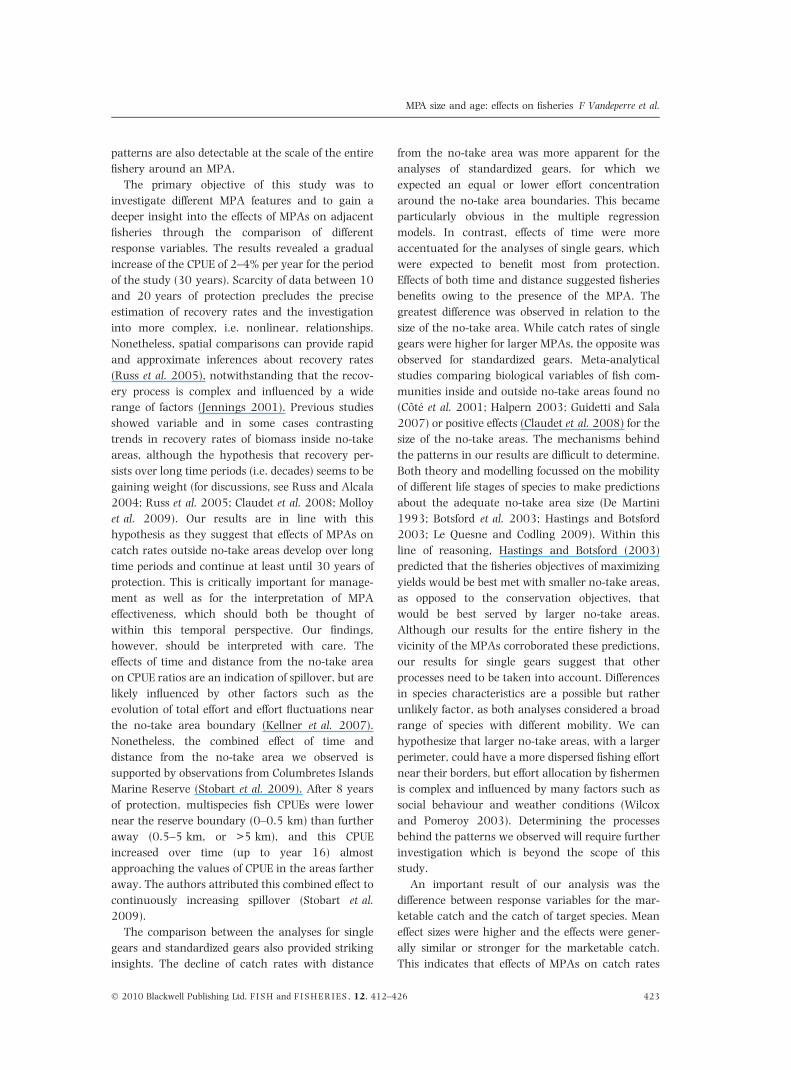
M1) (Fig. 2, Table 4). For the significant regres-
sions, r2 values ranged between 0.22 and 0.44. The
plots showed that the difference between effect sizes
increased with time (Fig. 2) and suggested higher
heterogeneity in response to protection with time.
Moreover, results of linear regressions, i.e. the
intercept and the slopes, indicated a stronger effect
of time for MS and M1. Regression lines indicated
that CPUEs of marketable catch, for both the entire
fishery and individual gears (MS and M1), became
comparable to those from reference areas after
approximately 20 years (22 and 19 respectively) as
effect sizes reached zero. The regression lines for the
effect sizes TS and T1, the CPUE of target species for
standardized gears and single gears, never reached
0 within the range of the study period (Fig. 2).
The relationship between effect size and distance
to the no-take area was generally negative, indicat-
ing that effect sizes were generally lower further
from the no-take area boundary (Table 4). This
relationship was significant for TS and MS. r2 values
for these two response variables were very similar,
namely 0.45 and 0.48.
Simple meta-regressions of effect sizes vs. size of
the no-take area showed significantly negative
slopes when analysing the catches of standardized
Figure 2 Plots of the weighted simple mixed-effects regression models of effect sizes versus time protected, distance from
the no-take area boundary and size of the no-take area for each of the four response variables (TS, T1, MS and M1).
Vertical bars represent the weight of each case study in the analysis.
MPA size and age: effects on fisheries F Vandeperre et al.
420 � 2010 Blackwell Publishing Ltd, F I S H and F I S H E R I E S , 12, 412–426
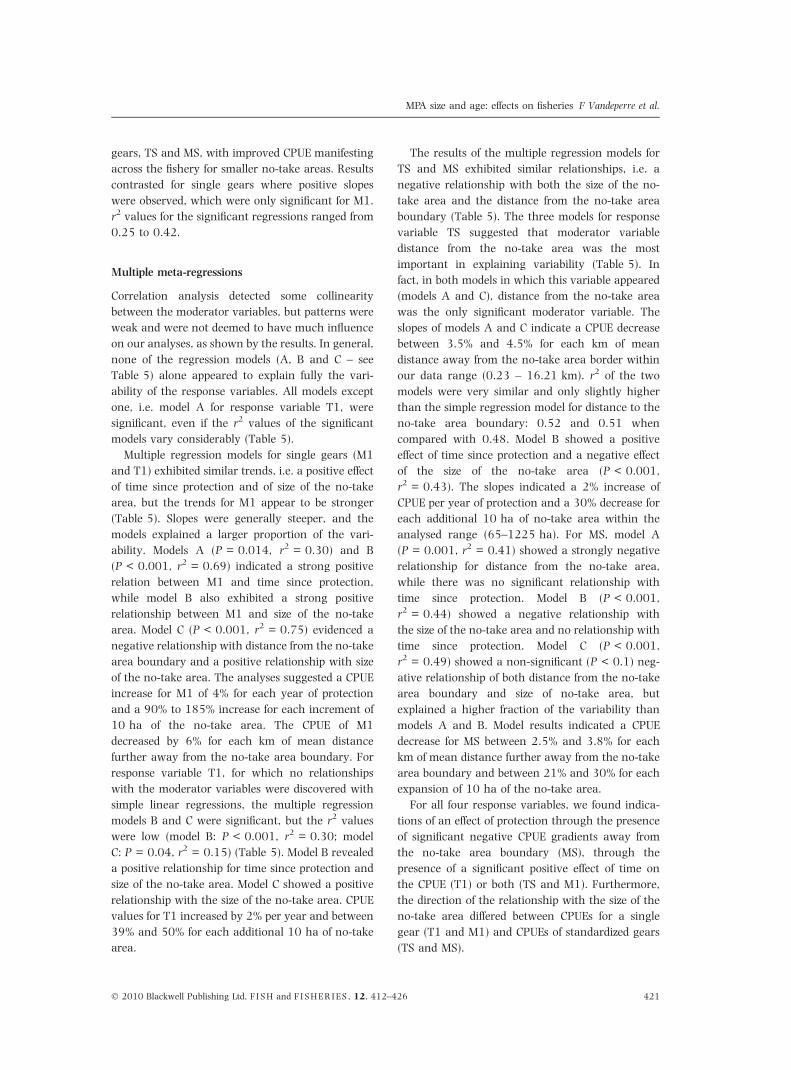
gears, TS and MS, with improved CPUE manifesting
across the fishery for smaller no-take areas. Results
contrasted for single gears where positive slopes
were observed, which were only significant for M1.
r2 values for the significant regressions ranged from
0.25 to 0.42.
Multiple meta-regressions
Correlation analysis detected some collinearity
between the moderator variables, but patterns were
weak and were not deemed to have much influence
on our analyses, as shown by the results. In general,
none of the regression models (A, B and C – see
Table 5) alone appeared to explain fully the vari-
ability of the response variables. All models except
one, i.e. model A for response variable T1, were
significant, even if the r2 values of the significant
models vary considerably (Table 5).
Multiple regression models for single gears (M1
and T1) exhibited similar trends, i.e. a positive effect
of time since protection and of size of the no-take
area, but the trends for M1 appear to be stronger
(Table 5). Slopes were generally steeper, and the
models explained a larger proportion of the vari-
ability. Models A (P = 0.014, r2 = 0.30) and B
(P < 0.001, r2 = 0.69) indicated a strong positive
relation between M1 and time since protection,
while model B also exhibited a strong positive
relationship between M1 and size of the no-take
area. Model C (P < 0.001, r2 = 0.75) evidenced a
negative relationship with distance from the no-take
area boundary and a positive relationship with size
of the no-take area. The analyses suggested a CPUE
increase for M1 of 4% for each year of protection
and a 90% to 185% increase for each increment of
10 ha of the no-take area. The CPUE of M1
decreased by 6% for each km of mean distance
further away from the no-take area boundary. For
response variable T1, for which no relationships
with the moderator variables were discovered with
simple linear regressions, the multiple regression
models B and C were significant, but the r2 values
were low (model B: P < 0.001, r2 = 0.30; model
C: P = 0.04, r2 = 0.15) (Table 5). Model B revealed
a positive relationship for time since protection and
size of the no-take area. Model C showed a positive
relationship with the size of the no-take area. CPUE
values for T1 increased by 2% per year and between
39% and 50% for each additional 10 ha of no-take
area.
The results of the multiple regression models for
TS and MS exhibited similar relationships, i.e. a
negative relationship with both the size of the no-
take area and the distance from the no-take area
boundary (Table 5). The three models for response
variable TS suggested that moderator variable
distance from the no-take area was the most
important in explaining variability (Table 5). In
fact, in both models in which this variable appeared
(models A and C), distance from the no-take area
was the only significant moderator variable. The
slopes of models A and C indicate a CPUE decrease
between 3.5% and 4.5% for each km of mean
distance away from the no-take area border within
our data range (0.23 – 16.21 km). r2 of the two
models were very similar and only slightly higher
than the simple regression model for distance to the
no-take area boundary: 0.52 and 0.51 when
compared with 0.48. Model B showed a positive
effect of time since protection and a negative effect
of the size of the no-take area (P < 0.001,
r2 = 0.43). The slopes indicated a 2% increase of
CPUE per year of protection and a 30% decrease for
each additional 10 ha of no-take area within the
analysed range (65–1225 ha). For MS, model A
(P = 0.001, r2 = 0.41) showed a strongly negative
relationship for distance from the no-take area,
while there was no significant relationship with
time since protection. Model B (P < 0.001,
r2 = 0.44) showed a negative relationship with
the size of the no-take area and no relationship with
time since protection. Model C (P < 0.001,
r2 = 0.49) showed a non-significant (P < 0.1) neg-
ative relationship of both distance from the no-take
area boundary and size of no-take area, but
explained a higher fraction of the variability than
models A and B. Model results indicated a CPUE
decrease for MS between 2.5% and 3.8% for each
km of mean distance further away from the no-take
area boundary and between 21% and 30% for each
expansion of 10 ha of the no-take area.
For all four response variables, we found indica-
tions of an effect of protection through the presence
of significant negative CPUE gradients away from
the no-take area boundary (MS), through the
presence of a significant positive effect of time on
the CPUE (T1) or both (TS and M1). Furthermore,
the direction of the relationship with the size of the
no-take area differed between CPUEs for a single
gear (T1 and M1) and CPUEs of standardized gears
(TS and MS).
MPA size and age: effects on fisheries F Vandeperre et al.
� 2010 Blackwell Publishing Ltd, F I S H and F I S H E R I E S , 12, 412–426 421
Discussion
This study aimed at assessing the influence of MPA
features such as no-take area size and age on its
function as a fisheries management tool with the
help of a meta-analytical approach using empirical
data. It has been recognized that the interpretation
of effects of MPAs on the surrounding fisheries is
particularly delicate owing to many confounding
factors that can lead to misinterpretation (Gell and
Roberts 2003; Murawski et al. 2004). These con-
founding factors are basically related to issues of
replication and adequacy of controls (Willis et al.
2003; Murawski et al. 2004). In the present study,
interpretation was mainly complicated by habitat
differences between locations and between MPAs,
presence of environmental gradients and spatial
heterogeneity of the data (for a discussion see
Murawski et al. 2004). Therefore, special attention
was given to the design of the study and the
selection of reference locations. As demonstrated by
Russ et al. (2005), carefully designed spatial com-
parisons are useful and allow meaningful inferences
to be drawn.
When analysing patterns in CPUE, an important
confounding effect is the spatial heterogeneity of
effort (Murawski et al. 2004). The implementation
of an MPA generates a redistribution of fishing effort
through the displacement of fishing activity from
the closed area to the surrounding areas still open to
fishing (Halpern et al. 2004). Both modelling and
empirical studies have supported the hypothesis
that this redistribution is often associated with a
concentration of effort around the MPA boundaries
(McClanahan and Kaunda-Arara 1996; Murawski
et al. 2005; Goni et al. 2006, 2008; Kellner et al.
2007; Stelzenmuller et al. 2008a). This concentra-
tion is because of higher catch rates, larger sizes of
target species or the expectation of increased ben-
efits because of the presence of an MPA (Murawski
et al. 2004). Mean CPUE values in the present
analysis were calculated from commercial fisheries
data. Unlike scientific surveys, the commercial
operations were not randomly distributed in space.
The number of catches from an area was thus
proportional to the effort invested in that same area
(Stelzenmuller et al. 2008a). Moreover, when the
effort is unequally distributed, density is reflected by
catch per unit area (CPUA) rather than by CPUE (for
a discussion, see Goni et al. 2006). Using CPUE as a
density index would theoretically lead to an under-
estimation of density at locations with high effort
concentration. Therefore, the results reflect the
yields experienced by the fishermen, but the effort
concentration may obscure MPA effects (McClana-
han and Kaunda-Arara 1996; Halpern et al. 2004).
Stelzenmuller et al. (2008a) and Goni et al. (2006,
2008) identified such concentration around four of
the seven MPAs included in this study and sug-
gested that these patterns generally apply to coastal
MPAs where artisanal fishing fleets operate in the
surrounding waters. This may explain the negative
values we obtained for effect sizes shortly after MPA
establishment and the mean effect sizes of all four
response variables, and why our analysis revealed a
small MPA effect on the CPUE of target species for a
single gear, although we expected these yields to be
impacted most by the MPAs. Furthermore, our
results indicate that, despite the high concentration
of effort, a general decline in catch rate occurred
with increasing mean distance from the no-take
area, although not always significant. Three
response variables declined between 25% and 60%
for each 10-km distance interval away from the
no-take area. This CPUE gradient was stronger for
the effect sizes of standardized gears (between 35%
and 60% decrease in CPUE per 10-km interval), for
which we expect an equal or smaller concentration
effect compared to the single gear analyses.
Acknowledging that in the present study the
distance from the no-take area boundary was not
directly interpretable as a result of the methodology,
the results obtained are in accordance with more
robust studies for single MPAs that take into
account other factors such as depth. For Columbre-
tes Islands Marine Reserve, Goni et al. (2006)
demonstrated that CPUE declined with distance
from the no-take area boundary, with a depression
of CPUE at the boundaries followed by a plateau
caused by local depletion associated with a concen-
tration of fishing effort. Such depressed densities at
no-take area boundaries, related with increased
effort, were also predicted and evidenced by Kellner
et al. (2007). Murawski et al. (2004, 2005) showed
a decrease in densities of target species within the
first 10 km from the boundaries of temperate closed
areas off New England, with an increased CPUE
within the first 4 km. Kaunda-Arara and Rose
(2004) identified CPUE gradients of target species
outside two tropical no-take areas in Kenya. While
these studies investigated patterns for single species
or single fisheries, our analysis suggest that these
MPA size and age: effects on fisheries F Vandeperre et al.
422 � 2010 Blackwell Publishing Ltd, F I S H and F I S H E R I E S , 12, 412–426
patterns are also detectable at the scale of the entire
fishery around an MPA.
The primary objective of this study was to
investigate different MPA features and to gain a
deeper insight into the effects of MPAs on adjacent
fisheries through the comparison of different
response variables. The results revealed a gradual
increase of the CPUE of 2–4% per year for the period
of the study (30 years). Scarcity of data between 10
and 20 years of protection precludes the precise
estimation of recovery rates and the investigation
into more complex, i.e. nonlinear, relationships.
Nonetheless, spatial comparisons can provide rapid
and approximate inferences about recovery rates
(Russ et al. 2005), notwithstanding that the recov-
ery process is complex and influenced by a wide
range of factors (Jennings 2001). Previous studies
showed variable and in some cases contrasting
trends in recovery rates of biomass inside no-take
areas, although the hypothesis that recovery per-
sists over long time periods (i.e. decades) seems to be
gaining weight (for discussions, see Russ and Alcala
2004; Russ et al. 2005; Claudet et al. 2008; Molloy
et al. 2009). Our results are in line with this
hypothesis as they suggest that effects of MPAs on
catch rates outside no-take areas develop over long
time periods and continue at least until 30 years of
protection. This is critically important for manage-
ment as well as for the interpretation of MPA
effectiveness, which should both be thought of
within this temporal perspective. Our findings,
however, should be interpreted with care. The
effects of time and distance from the no-take area
on CPUE ratios are an indication of spillover, but are
likely influenced by other factors such as the
evolution of total effort and effort fluctuations near
the no-take area boundary (Kellner et al. 2007).
Nonetheless, the combined effect of time and
distance from the no-take area we observed is
supported by observations from Columbretes Islands
Marine Reserve (Stobart et al. 2009). After 8 years
of protection, multispecies fish CPUEs were lower
near the reserve boundary (0–0.5 km) than further
away (0.5–5 km, or >5 km), and this CPUE
increased over time (up to year 16) almost
approaching the values of CPUE in the areas farther
away. The authors attributed this combined effect to
continuously increasing spillover (Stobart et al.
2009).
The comparison between the analyses for single
gears and standardized gears also provided striking
insights. The decline of catch rates with distance
from the no-take area was more apparent for the
analyses of standardized gears, for which we
expected an equal or lower effort concentration
around the no-take area boundaries. This became
particularly obvious in the multiple regression
models. In contrast, effects of time were more
accentuated for the analyses of single gears, which
were expected to benefit most from protection.
Effects of both time and distance suggested fisheries
benefits owing to the presence of the MPA. The
greatest difference was observed in relation to the
size of the no-take area. While catch rates of single
gears were higher for larger MPAs, the opposite was
observed for standardized gears. Meta-analytical
studies comparing biological variables of fish com-
munities inside and outside no-take areas found no
(Cote et al. 2001; Halpern 2003; Guidetti and Sala
2007) or positive effects (Claudet et al. 2008) for the
size of the no-take areas. The mechanisms behind
the patterns in our results are difficult to determine.
Both theory and modelling focussed on the mobility
of different life stages of species to make predictions
about the adequate no-take area size (De Martini
1993; Botsford et al. 2003; Hastings and Botsford
2003; Le Quesne and Codling 2009). Within this
line of reasoning, Hastings and Botsford (2003)
predicted that the fisheries objectives of maximizing
yields would be best met with smaller no-take areas,
as opposed to the conservation objectives, that
would be best served by larger no-take areas.
Although our results for the entire fishery in the
vicinity of the MPAs corroborated these predictions,
our results for single gears suggest that other
processes need to be taken into account. Differences
in species characteristics are a possible but rather
unlikely factor, as both analyses considered a broad
range of species with different mobility. We can
hypothesize that larger no-take areas, with a larger
perimeter, could have a more dispersed fishing effort
near their borders, but effort allocation by fishermen
is complex and influenced by many factors such as
social behaviour and weather conditions (Wilcox
and Pomeroy 2003). Determining the processes
behind the patterns we observed will require further
investigation which is beyond the scope of this
study.
An important result of our analysis was the
difference between response variables for the mar-
ketable catch and the catch of target species. Mean
effect sizes were higher and the effects were gener-
ally similar or stronger for the marketable catch.
This indicates that effects of MPAs on catch rates
MPA size and age: effects on fisheries F Vandeperre et al.
� 2010 Blackwell Publishing Ltd, F I S H and F I S H E R I E S , 12, 412–426 423
are more easily detectable for the marketable catch.
Furthermore, simple regressions demonstrated that
the difference becomes greater with time, although
this could not be formally tested. Only the regression
lines of the marketable catch attained positive
values during the period of the study (after approx-
imately 20 years). It is unclear whether this is an
indication of a more diverse fish community in the
vicinity of the no-take area. Even so, in terms of
CPUE, the greatest benefit for the fishermen seems to
be realized through the increased by-catch per unit
of effort. By the definition of by-catch, this is a real
benefit because it represents increased return to the
fishermen relative to the effort they invest. In-
creased income in the vicinity of an MPA has
previously been shown to overlap with increased
species diversity (Stelzenmuller et al. 2008b).
The present study demonstrates that southern
European MPAs have clear effects on the surround-
ing fisheries: on the catch rate of target species, but
especially on the catch rate of the total marketable
catch. Moreover, these effects depend on the length
of time an area has benefited from protection and on
the size of the no-take area. It needs to be
emphasized that although the multiple regression
models were often significant, they explained
between 15% and 75% of the total variability,
indicating that the heterogeneity in catch rates is
also influenced by other factors. These factors could
be related to the design (size and regulations of the
partial-take area(s), connectivity with other MPAs),
physical environment and history (exploitation and
poaching history) of the MPAs. While these factors
could not be investigated because they could not be
satisfactorily quantified or did not show enough
variation, the robustness of the present study would
also have benefitted from a better spread of the
covariates we analysed (i.e. time, size and distance).
Compiling such a data set, especially for a single
biogeographical region, would be very challenging,
especially considering that the present analyses
draw upon some of the more available CPUE data
for both this region and perhaps internationally, but
undoubtedly a worthwhile endeavour. In this con-
text, it is important to highlight that we did not
consider any biological information, such as mobil-
ity and life-history traits, of the species in our
analyses, although these characteristics are likely
to influence the observed patterns. For each
gear, species were simply categorized as target or
by-catch and grouped together for analysis because
there was no single species that was sufficiently
abundant and similarly commercially important in
all MPAs. Despite these limitations and acknowl-
edging that this study is no substitute for properly
designed monitoring studies, which can also provide
information on mechanisms driving MPA effects, we
conclude that our findings provide crucial informa-
tion for the design, management and evaluation of
MPAs as fisheries management tools.
Acknowledgements
This work has been carried out with financial
support from the Commission of the European
Community, specific RTD programme ‘‘Specific
Support to Policies’’, SSP-2003-006539 ‘‘European
Marine Protected Areas as Tools for Fisheries
Management and Conservation (EMPAFISH)’’. It
does not necessarily reflect its views and in no way
anticipates the Commission’s future policy in this
area. We also thank all the people involved in
gathering and making available of the data included
in this study.
References
Abesamis, R.A. and Russ, G.R. (2005) Density-Dependent
Spillover From a Marine Reserve: Long-Term Evidence.
Ecological Applications 15, 1798–1812.
Botsford, L.W., Micheli, F. and Hastings, A. (2003)
Principles for the Design of Marine Reserves. Ecological
Applications 13, S25–S31.
Claudet, J., Osenberg, C.W., Benedetti-Cecchi, L. et al.
(2008) Marine Reserves: Size and Age Do Matter.
Ecology Letters 11, 481–489.
COM (2002) 535 final. Communication from the Com-
mission to the Council and the European Parliament
laying down a Community Action Plan for the conser-
vation and sustainable exploitation of fisheries resources
in the Mediterranean Sea under the Common Fisheries
Policy.
Cote, I.M., Mosqueira, I. and Reynolds, J.D. (2001) Effects
of Marine Reserve Characteristics on the Protection of
Fish Populations: a Meta-Analysis. Journal of Fish Biology
59, 178–189.
De Martini, E.E. (1993) Modeling the Potential of Fishery
Reserves for Managing Pacific Coral Reef Fishes. Fishery
Bulletin 91, 414–427.
Floeter, S.R., Halpern, B.S. and Ferreira, C.E.L. (2006)
Effects of fishing and protection on Brazilian reef fishes.
Biological Conservation 128, 391–402.
Gell, F.R. and Roberts, C.M. (2003) Benefits Beyond
Boundaries: the Fishery Effects of Marine Reserves.
Trends in Ecology & Evolution 18, 448–455.
MPA size and age: effects on fisheries F Vandeperre et al.
424 � 2010 Blackwell Publishing Ltd, F I S H and F I S H E R I E S , 12, 412–426

Gomez, S., Lloret, J., Demestre, M. and Riera, V. (2006)
The decline of the artisanal fisheries in the Mediterra-
nean coastal areas: the case of Cap de Creus (Cape
Creus). Coastal Management 34, 217–232.
Goni, R., Quetglas, A. and Renones, O. (2006) Spillover of
Spiny Lobsters Palinurus Elephas From a Marine
Reserve to an Adjoining Fishery. Marine Ecology-Progress
Series 308, 207–219.
Goni, R., Adlerstein, S., Alvarez-Berastegui, D. et al. (2008)
Spillover from six western Mediterranean marine pro-
tected areas: evidence from artisanal fisheries. Marine
Ecology-Progress Series 366, 159–174.
Guidetti, P. and Sala, E. (2007) Community-Wide Effects of
Marine Reserves in the Mediterranean Sea. Marine
Ecology-Progress Series 335, 43–56.
Gurevitch, J. and Hedges, L.V. (1999) Statistical issues in
ecological meta-analyses. Ecology 80, 1142–1149.
Halpern, B.S. (2003) The Impact of Marine Reserves: Do
Reserves Work and Does Reserve Size Matter? Ecological
Applications 13, S117–S137.
Halpern, B.S. and Warner, R.R. (2002) Marine Reserves
Have Rapid and Lasting Effects. Ecology Letters 5, 361–
366.
Halpern, B.S., Gaines, S.D. and Warner, R.R. (2004)
Confounding Effects of the Export of Production and the
Displacement of Fishing Effort From Marine Reserves.
Ecological Applications 14, 1248–1256.
Harmelin, J.G. (2000) Mediterranean Marine Protected
Areas: Some Prominent Traits and Promising Trends.
Environmental Conservation 27, 104–105.
Hastings, A. and Botsford, L.W. (1999) Equivalence in
Yield From Marine Reserves and Traditional Fisheries
Management. Science 284, 1537–1538.
Hastings, A. and Botsford, L.W. (2003) Comparing Designs
of Marine Reserves for Fisheries and for Biodiversity.
Ecological Applications 13, S65–S70.
Hedges, L.V., Gurevitch, J. and Curtis, P.S. (1999) The
meta-analysis of response ratios in experimental ecol-
ogy. Ecology 80, 1150–1156.
Hilborn, R., Stokes, K., Maguire, J.J. et al. (2004) When
Can Marine Reserves Improve Fisheries Management?
Ocean & Coastal Management 47, 197–205.
Jaworski, A., Solmundsson, J. and Ragnarsson, S.A.
(2006) The Effect of Area Closures on the Demersal
Fish Community Off the East Coast of Iceland. ICES
Journal of Marine Science 63, 897–911.
Jennings, S. (2001) Patterns and Prediction of population
recovery in marine reserves. Reviews in Fish Biology and
Fisheries 10, 209–231.
Kaunda-Arara, B. and Rose, G.A. (2004) Effects of marine
reef National Parks on fishery CPUE in coastal Kenya.
Biological Conservation 118, 1–13.
Kellner, J.B., Tetreault, I., Gaines, S.D. and Nisbet, R.M.
(2007) Fishing the Line Near Marine Reserves in Single
and Multispecies Fisheries. Ecological Applications 17,
1039–1054.
Le Quesne, W.J.F. and Codling, E.A. (2009) Managing
mobile species with MPAs: the effects of mobility, larval
dispersal, and fishing mortality on closure size. ICES
Journal of Marine Science 66, 122–131.
Maunder, M.N. and Punt, A.E. (2004) Standardizing catch
and effort data: a review of recent approaches. Fisheries
Research 70, 141–159.
McClanahan, T.R. and Kaunda-Arara, B. (1996) Fishery
Recovery in a Coral-Reef Marine Park and Its Effect on
the Adjacent Fishery. Conservation Biology 10, 1187–
1199.
McClanahan, T.R. and Mangi, S. (2000) Spillover of
Exploitable Fishes From a Marine Park and Its Effect on
the Adjacent Fishery. Ecological Applications 10, 1792–
1805.
Micheli, F., Halpern, B.S., Botsford, L.W. and Warner, R.R.
(2004) Trajectories and Correlates of Community
Change in No-Take Marine Reserves. Ecological Applica-
tions 14, 1709–1723.
Molloy, P.P., McLean, I.B. and Cote, I.M. (2009) Effects of
marine reserve age on fish populations: a global meta-
analysis. Journal of Applied Ecology 46, 743–751.
Mosqueira, I., Cote, I.M., Jennings, S. and Reynolds, J.D.
(2000) Conservation Benefits of Marine Reserves for Fish
Populations. Animal Conservation 3, 321–332.
Murawski, S.A., Rago, P.J. and Fogarty, M.J. (2004).
Spillover Effects from Temperate Marine Protected
Areas. in: Aquatic Protected Areas as Fisheries Manage-
ment Tools (Proceedings of the American Fisheries Society
Symposium 42, Quebec, 11-12 August, 2003) (ed. J.B.
Shipley). American Fisheries Society, Bethesda, pp. 167–
184.
Murawski, S.A., Wigley, S.E., Fogarty, M.J., Rago, P.J. and
Mountain, D.G. (2005) Effort Distribution and Catch
Patterns Adjacent to Temperate MPAs. ICES Journal of
Marine Science 62, 1150–1167.
Nowlis, J.S. and Roberts, C.M. (1999) Fisheries Benefits
and Optimal Design of Marine Reserves. Fishery Bulletin
97, 604–616.
Piet, G.J. and Rijnsdorp, A.D. (1998) Changes in the
Demersal Fish Assemblage in the South-Eastern North
Sea Following the Establishment of a Protected Area
(‘‘Plaice Box’’). ICES Journal of Marine Science 55, 420–
429.
Planes, S., Garcia-Charton, J.A., Marcos, C. and Perez-
Ruzafa, A. (Coord.) (2008). Ecological effects of Atlanto-
Mediterranean marine protected areas in the European
Union. EMPAFISH project, Booklet n1. Editum. 158pp.
Available at http://www.um.es/empafish. (Accessed
10/11/2010).
Roberts, C.M., Bohnsack, J.A., Gell, F., Hawkins, J.P. and
Goodridge, R. (2001) Effects of Marine Reserves on
Adjacent Fisheries. Science 294, 1920–1923.
Rodwell, L.D., Barbier, E.B., Roberts, C.M. and Mcclana-
han, T.R. (2002) A Model of Tropical Marine Reserve-
MPA size and age: effects on fisheries F Vandeperre et al.
� 2010 Blackwell Publishing Ltd, F I S H and F I S H E R I E S , 12, 412–426 425

Fishery Linkages. Natural Resource Modelling 15, 453–
486.
Rodwell, L.D., Barbier, E.B., Roberts, C.M. and Mcclana-
han, T.R. (2003) The Importance of Habitat Quality for
Marine Reserve Fishery Linkages. Canadian Journal of
Fisheries and Aquatic Sciences 60, 171–181.
Rosenberg, M.S., Adams, D.C. and Gurevitch, J. (2000)
MetaWin: Statistical software for meta-analysis (vers. 2.0).
Sunderland, MA: Sinauer Associates, Inc.
Russ, G.R. (2002) Marine Reserves as Reef Fisheries
Management Tools: Yet Another Review. In: Coral Reef
Fishes, Dynamics and diversity in a complex ecosystem (ed.
P.F. Sale). Academic Press, San Diego, California, USA,
pp. 421–443.
Russ, G.R. and Alcala, A.C. (1996) Marine Reserves: Rates
and Patterns of Recovery and Decline of Large Predatory
Fish. Ecological Applications 6, 947–961.
Russ, G.R. and Alcala, A.C. (1998) Natural Fishing
Experiments in Marine Reserves 1983 - 1993: Roles of
Life History and Fishing Intensity in Family Responses.
Coral Reefs 17, 399–416.
Russ, G.R. and Alcala, A.C. (2004) Marine reserves: long-
term protection is required for full recovery of predatory
fish populations. Oecologia 138, 622–627.
Russ, G.R., Stockwell, B. and Alcala, A.C. (2005) Inferring
Versus Measuring Rates of Recovery in No-Take Marine
Reserves. Marine Ecology-Progress Series 292, 1–12.
Sale, P.F., Cowen, R.K., Danilowicz, B.S. et al. (2005)
Critical Science Gaps Impede Use of No-Take Fishery
Reserves. Trends in Ecology & Evolution 20, 74–80.
Samoilys, M.A., Martin-Smith, K.M., Giles, B.G. et al.
(2007) Effectiveness of Five Small Philippines’ Coral
Reef Reserves for Fish Populations Depends on Site-
Specific Factors, Particularly Enforcement History. Bio-
logical Conservation 136, 584–601.
Stelzenmuller, V., Maynou, F. and Martin, P. (2007)
Spatial Assessment of Benefits of a Coastal Mediterra-
nean Marine Protected Area. Biological Conservation
136, 571–583.
Stelzenmuller, V., Maynou, F., Bernard, G. et al. (2008a)
Spatial assessment of fishing effort around European
marine reserves: implications for successful fisheries
management. Marine Pollution Bulletin 56, 2018–2026.
Stelzenmuller, V., Maynou, F. and Martin, P. (2008b)
Patterns of species and functional diversity around a
coastal marine reserve: a fisheries perspective. Aquatic
Conservation: Marine and Freshwater Ecosystems 18,
1–12.
Stobart, B., Warwick, R., Gonzalez, C. et al. (2009) Long-
term and spillover effects of a marine protected area on
an exploited fish community. Marine Ecology-Progress
Series 384, 47–60.
Vandeperre, F., Higgins, R., Santos, R.S., Marcos, C. and
Perez-Ruzafa, A. (Coord.) (2008) Fishery regimes in
Atlanto-Mediterranean European marine protected
areas. EMPAFISH project, Booklet n2. Editum. 108pp.
Available at http://www.um.es/empafish. (Accessed 10/
11/2010).
Wilcox, C. and Pomeroy, C. (2003) Do commercial fishers
aggregate around marine reserves? Evidence from Big
Creek Marine Ecological Reserve, central California.
North American Journal of Fisheries Management 23, 241–
250.
Willis, T.J., Millar, R.B., Babcock, R.C. and Tolimieri, N.
(2003) Burdens of Evidence and the Benefits of Marine
Reserves: Putting Descartes Before Des Horse? Environ-
mental Conservation 30, 97–103.
Zeller, D. and Reinert, J. (2004) Modelling Spatial Closures
and Fishing Effort Restrictions in the Faroe Islands
Marine Ecosystem. Ecological Modelling 172, 403–420.
MPA size and age: effects on fisheries F Vandeperre et al.
426 � 2010 Blackwell Publishing Ltd, F I S H and F I S H E R I E S , 12, 412–426