Moisture sorption isotherms and thermodynamic properties of ...
Upload
independentCategory
view
3download
0
(IIHFWV�RI�ODQG�FRYHU�FKDQJH�RQ�PRLVWXUH�DYDLODELOLW\�DQG�SRWHQWLDO�FURS�\LHOG�LQ�WKH�ZRUOGಬV
EUHDGEDVNHWV
This article has been downloaded from IOPscience. Please scroll down to see the full text article.
2012 Environ. Res. Lett. 7 014009
(http://iopscience.iop.org/1748-9326/7/1/014009)
Download details:IP Address: 144.92.131.150The article was downloaded on 24/01/2012 at 19:16
Please note that terms and conditions apply.
View the table of contents for this issue, or go to the journal homepage for more
Home Search Collections Journals About Contact us My IOPscience
IOP PUBLISHING ENVIRONMENTAL RESEARCH LETTERS
Environ. Res. Lett. 7 (2012) 014009 (9pp) doi:10.1088/1748-9326/7/1/014009
Effects of land cover change on moisture
availability and potential crop yield in the
world’s breadbaskets
Justin E Bagley
1,2,5,6, Ankur R Desai
1,2, Paul A Dirmeyer
3and
Jonathan A Foley
4
1 Center for Sustainability and the Global Environment (SAGE), University of Wisconsin-Madison, WI,USA2 Department of Atmospheric and Oceanic Sciences, University of Wisconsin-Madison, WI, USA3 Center for Ocean–Land–Atmosphere Studies (COLA), Calverton, MD, USA4 Institute on the Environment (IonE), University of Minnesota, St Paul, MN, USA
E-mail: [email protected], [email protected], [email protected] and [email protected]
Received 18 September 2011Accepted for publication 3 January 2012Published 24 January 2012Online at stacks.iop.org/ERL/7/014009
Abstract
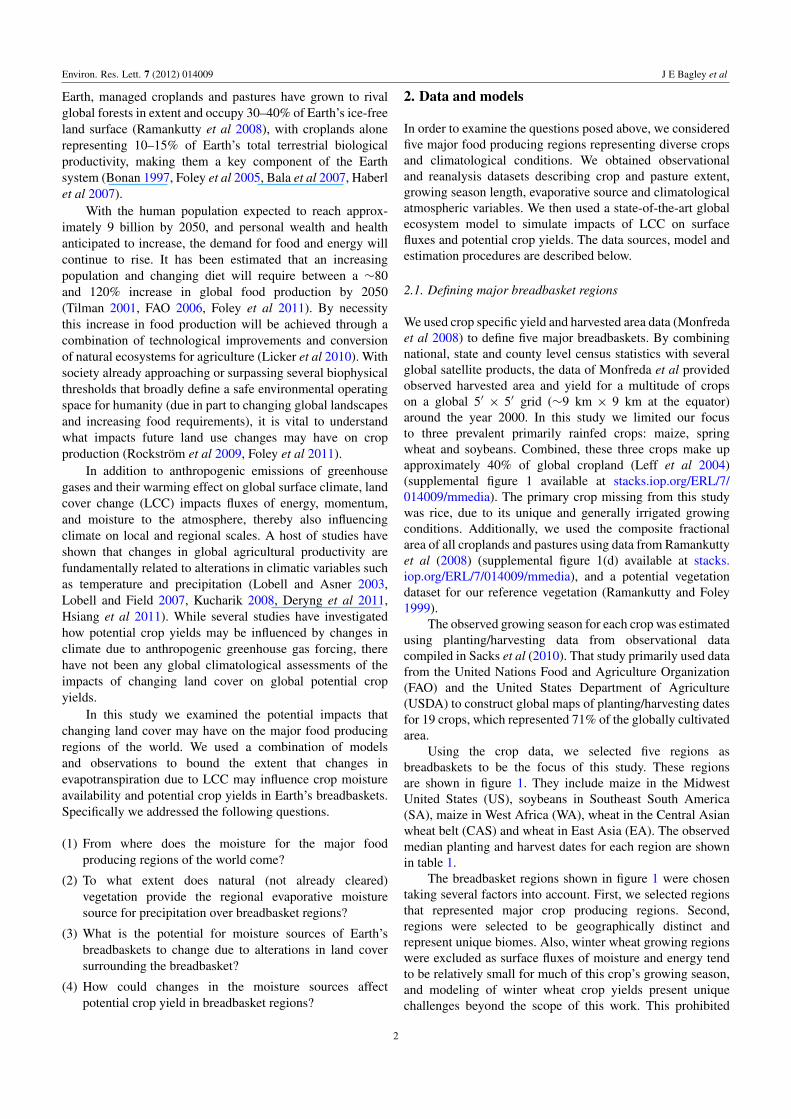
The majority of the world’s food production capability is inextricably tied to globalprecipitation patterns. Changes in moisture availability—whether from changes in climatefrom anthropogenic greenhouse gas emissions or those induced by land cover change(LCC)—can have profound impacts on food production. In this study, we examined thepatterns of evaporative sources that contribute to moisture availability over five major globalfood producing regions (breadbaskets), and the potential for land cover change to influencethese moisture sources by altering surface evapotranspiration. For a range of LCC scenarioswe estimated the impact of altered surface fluxes on crop moisture availability and potentialyield using a simplified linear hydrologic model and a state-of-the-art ecosystem and cropmodel. All the breadbasket regions were found to be susceptible to reductions in moistureowing to perturbations in evaporative source (ES) from LCC, with reductions in moistureavailability ranging from 7 to 17% leading to potential crop yield reductions of 1–17%, whichare magnitudes comparable to the changes anticipated with greenhouse warming. Thesensitivity of these reductions in potential crop yield to varying magnitudes of LCC was notconsistent among regions. Two variables explained most of these differences: the first was themagnitude of the potential moisture availability change, with regions exhibiting greaterreductions in moisture availability also tending to exhibit greater changes in potential yield;the second was the soil moisture within crop root zones. Regions with mean growing seasonsoil moisture fractions of saturation >0.5 typically had reduced impacts on potential cropyield. Our results indicate the existence of LCC thresholds that have the capability to createmoisture shortages adversely affecting crop yields in major food producing regions, whichcould lead to future food supply disruptions in the absence of increased irrigation or otherforms of water management.
Keywords: land use change, global crop yield, land–atmosphere interactionsS Online supplementary data available from stacks.iop.org/ERL/7/014009/mmedia
5 Present address: Institute for Genomic Biology (IGB), University ofIllinois Urbana-Champaign, USA.6 Author to whom any correspondence should be addressed.
1. Introduction
In order to meet the requirements necessary to fuel andfeed the nearly seven billion people that currently populate
11748-9326/12/014009+09$33.00 c� 2012 IOP Publishing Ltd Printed in the UK
Environ. Res. Lett. 7 (2012) 014009 J E Bagley et al
Earth, managed croplands and pastures have grown to rivalglobal forests in extent and occupy 30–40% of Earth’s ice-freeland surface (Ramankutty et al 2008), with croplands alonerepresenting 10–15% of Earth’s total terrestrial biologicalproductivity, making them a key component of the Earthsystem (Bonan 1997, Foley et al 2005, Bala et al 2007, Haberlet al 2007).
With the human population expected to reach approx-imately 9 billion by 2050, and personal wealth and healthanticipated to increase, the demand for food and energy willcontinue to rise. It has been estimated that an increasingpopulation and changing diet will require between a ⇠80and 120% increase in global food production by 2050(Tilman 2001, FAO 2006, Foley et al 2011). By necessitythis increase in food production will be achieved through acombination of technological improvements and conversionof natural ecosystems for agriculture (Licker et al 2010). Withsociety already approaching or surpassing several biophysicalthresholds that broadly define a safe environmental operatingspace for humanity (due in part to changing global landscapesand increasing food requirements), it is vital to understandwhat impacts future land use changes may have on cropproduction (Rockstrom et al 2009, Foley et al 2011).
In addition to anthropogenic emissions of greenhousegases and their warming effect on global surface climate, landcover change (LCC) impacts fluxes of energy, momentum,and moisture to the atmosphere, thereby also influencingclimate on local and regional scales. A host of studies haveshown that changes in global agricultural productivity arefundamentally related to alterations in climatic variables suchas temperature and precipitation (Lobell and Asner 2003,Lobell and Field 2007, Kucharik 2008, Deryng et al 2011,Hsiang et al 2011). While several studies have investigatedhow potential crop yields may be influenced by changes inclimate due to anthropogenic greenhouse gas forcing, therehave not been any global climatological assessments of theimpacts of changing land cover on global potential cropyields.
In this study we examined the potential impacts thatchanging land cover may have on the major food producingregions of the world. We used a combination of modelsand observations to bound the extent that changes inevapotranspiration due to LCC may influence crop moistureavailability and potential crop yields in Earth’s breadbaskets.Specifically we addressed the following questions.
(1) From where does the moisture for the major foodproducing regions of the world come?
(2) To what extent does natural (not already cleared)vegetation provide the regional evaporative moisturesource for precipitation over breadbasket regions?
(3) What is the potential for moisture sources of Earth’sbreadbaskets to change due to alterations in land coversurrounding the breadbasket?
(4) How could changes in the moisture sources affectpotential crop yield in breadbasket regions?
2. Data and models
In order to examine the questions posed above, we consideredfive major food producing regions representing diverse cropsand climatological conditions. We obtained observationaland reanalysis datasets describing crop and pasture extent,growing season length, evaporative source and climatologicalatmospheric variables. We then used a state-of-the-art globalecosystem model to simulate impacts of LCC on surfacefluxes and potential crop yields. The data sources, model andestimation procedures are described below.
2.1. Defining major breadbasket regions
We used crop specific yield and harvested area data (Monfredaet al 2008) to define five major breadbaskets. By combiningnational, state and county level census statistics with severalglobal satellite products, the data of Monfreda et al providedobserved harvested area and yield for a multitude of cropson a global 50 ⇥ 50 grid (⇠9 km ⇥ 9 km at the equator)around the year 2000. In this study we limited our focusto three prevalent primarily rainfed crops: maize, springwheat and soybeans. Combined, these three crops make upapproximately 40% of global cropland (Leff et al 2004)(supplemental figure 1 available at stacks.iop.org/ERL/7/014009/mmedia). The primary crop missing from this studywas rice, due to its unique and generally irrigated growingconditions. Additionally, we used the composite fractionalarea of all croplands and pastures using data from Ramankuttyet al (2008) (supplemental figure 1(d) available at stacks.iop.org/ERL/7/014009/mmedia), and a potential vegetationdataset for our reference vegetation (Ramankutty and Foley1999).
The observed growing season for each crop was estimatedusing planting/harvesting data from observational datacompiled in Sacks et al (2010). That study primarily used datafrom the United Nations Food and Agriculture Organization(FAO) and the United States Department of Agriculture(USDA) to construct global maps of planting/harvesting datesfor 19 crops, which represented 71% of the globally cultivatedarea.
Using the crop data, we selected five regions asbreadbaskets to be the focus of this study. These regionsare shown in figure 1. They include maize in the MidwestUnited States (US), soybeans in Southeast South America(SA), maize in West Africa (WA), wheat in the Central Asianwheat belt (CAS) and wheat in East Asia (EA). The observedmedian planting and harvest dates for each region are shownin table 1.
The breadbasket regions shown in figure 1 were chosentaking several factors into account. First, we selected regionsthat represented major crop producing regions. Second,regions were selected to be geographically distinct andrepresent unique biomes. Also, winter wheat growing regionswere excluded as surface fluxes of moisture and energy tendto be relatively small for much of this crop’s growing season,and modeling of winter wheat crop yields present uniquechallenges beyond the scope of this work. This prohibited
2

Environ. Res. Lett. 7 (2012) 014009 J E Bagley et al
Figure 1. The maize (yellow), soybean (green) and wheat (blue) breadbasket regions used in this study.
Table 1. Median planting and harvest dates of crops for each regionusing data from Sacks et al (2010).
Region Plant date Harvest date
East Asia wheat March 30 July 31Central Asia wheat May 18 September 3North America maize May 11 October 18South America soybeans November 24 April 16West Africa maize May 31 September 31
investigation of the extensive Indian and Western Europeanwheat growing regions observed in supplemental figure1(b) (available at stacks.iop.org/ERL/7/014009/mmedia).Finally, we selected regions that represented a diverse setof climatological and meteorological conditions. The USand CAS regions represented agricultural regions whereprecipitation is largely influenced by midlatitude storm tracks.The SA region encompasses a relatively large range in latitudeand is influenced by a combination of the tropical movementof the Intertropical Convergence Zone (ITCZ) and midlatitudesystems. Precipitation in WA is strongly tied to seasonalmovements of the ITCZ and tropical dynamics. Finally,EA represents a midlatitude crop growing region where themoisture for crop production is influenced by monsoonalsystems (Wallace and Hobbs 1977, Hastenrath 1991).
2.2. Evaporative source data
The sources of water that precipitated over breadbasketregions were found using an evaporative source (ES)dataset developed in Dirmeyer and Brubaker (1999, 2007)and Brubaker et al (2001). For each terrestrial gridpoint ona global T62 Gaussian grid (⇠1.9� ⇥ 1.9� at the surfaceon the equator), this source provided a 25 yr (1979–2004)mean monthly climatology of where the precipitation thatfell over a given point last evaporated from Earth’s surface(mm H2O m�2). These data have been used in a varietyof applications including studies of moisture recycling,hydrological feedbacks of floods in the Midwest UnitedStates, and estimates of atmospheric water vapor transports
between countries (Dirmeyer and Brubaker 2007, Dirmeyeret al 2009, Dirmeyer and Kinter 2010). For more details ofthe ES data see supplementary information (SI1 available atstacks.iop.org/ERL/7/014009/mmedia). There are alternativemethods for calculating ES such as those by Yoshimura et al(2004) and van der Ent et al (2010). While a full comparisonof these methods is beyond the scope of this study, we doacknowledge that our results may vary to some degree withalternative methods for ES estimation. Here, we used theES dataset to calculate the total ES footprint of moisturethat precipitates over the fraction of each breadbasket regioncontaining the specified crop. This was aggregated over thegrowing season of each of the breadbasket regions, withthe growing season defined as the time interval betweenthe observed median planting date and median harvest date(table 1). 30 yr mean NCEP reanalysis-II 850 mb fields werealso used in this analysis (Kanamitsu et al 2002).
2.3. Simulating LCC and potential crop yield using thePEGASUS model
To determine changes in surface fluxes of moisture associatedwith LCC, and potential changes in crop yield associatedwith changing moisture availability, we used 25 yr runsof the Predicting Ecosystem Goods and Services UsingScenarios (PEGASUS) model described in Bagley et al(2011) and Deryng et al (2011). To simulate the effectsof LCC, PEGASUS used a set of fifteen biomes and threecrops (maize, soybean and spring wheat) to describe thevegetative state at each gridpoint. The biome assigned toany gridpoint was manually altered to represent a change insurface cover by LCC. Associated with each biome were a setof literature-derived parameters describing water, energy, andnutrient properties.
Potential crop yields in PEGASUS were calculated byintegrating the effects of climate, planting dates, crop specificirrigated areas, cultivar choices and fertilizer choices formaize, wheat and soybeans. For this study, nutrients wereassumed to be unlimited, planting and harvesting dates wereset to those currently observed using the planting/harvesting
3

Environ. Res. Lett. 7 (2012) 014009 J E Bagley et al
data from Sacks et al (2010), and all crops were assumed to berainfed, assumptions that we examine later in this letter. Thesensitivity of potential crop yields in PEGASUS to changes inprecipitation and moisture availability can be found in Derynget al (2011). Further description of the PEGASUS model,and its simulation of surface energy balance and potentialcrop yield can be found in the supplemental information (SI2available at stacks.iop.org/ERL/7/014009/mmedia).
2.4. The linear moisture availability model
To determine the potential impact of LCC on breadbasketmoisture availability via alterations to a region’s ES wedeveloped a simple linear model. To begin, the total moistureavailability (M) at gridpoint i (mm H2O day�1 m�2) can bewritten as:
Mi =Pn
j=0 Si,jAj
Ai(1)
where s is the ES (mm H2O day�1 m�2) of gridpoint i atgridpoint j, n represents the global number of gridpoints, andA (m2) is the area represented by a given gridpoint. Nextwe assumed that fractional change in ES for gridpoint i dueto LCC at gridpoint j was equal to the fractional change insurface evapotranspiration E (mm H2O day�1):
S0i,j
Si,j= E0
j
Ej(2)
where overbars indicate climatological means, and primesindicate perturbed values due to LCC. Thus the fractionalchange in moisture availability (F) due to LCC can be writtenas:
Fi = M0i
Mi=
Pnj=1 Si,jAj
E0j
EjPnj=1 Si,jAj
. (3)
Equation (3) allowed us to estimate potential changes in mois-ture availability in breadbasket regions for LCC scenarios,and required only fractional changes in evapotranspirationfrom each scenario. These changes in evapotranspirationwere modeled with PEGASUS and depended on soil andvegetative properties, as well as climatological rates ofprecipitation. Essentially, the linear model assumes thatfractional changes in ES for any grid point proportionallychange the precipitation and hence moisture availability atall downwind grid points, as determined by the ES dataset.It should be noted that although changes in atmosphericcirculation and stability are key to fully encompass changesin precipitation due to LCC (Charney 1975, Eltahir 1996, DeRidder 1997, Nobre et al 2009), they are not accounted for inthis study in order to focus exclusively on changes in moistureavailability due to alterations in moisture supply from LCC,and results should be interpreted with this caveat in mind.Depending on whether the circulation and stability feedbackson precipitation are negative or positive, our approach mayoverestimate or underestimate the impact of LCC on croplandmoisture availability.
To estimate the maximum potential impact of LCC onbreadbasket moisture availability, we simulated two 25 yrscenarios using the PEGASUS model. In the first, we setthe land surface to potential vegetation and precipitationto CRU 2.1 30 yr monthly means linearly interpolated todaily values. This scenario represented the climatologicalmeans (si,j, Mi, Ej) in equation (3). In the second scenarioall land that was not agricultural land, as depicted insupplemental figure 1(d) (available at stacks.iop.org/ERL/7/014009/mmedia), was converted to bare soil. This representedthe maximum potential impact of LCC on moisture flux(although other possible conversions such as vegetation tourban landscapes could have larger impacts on moisturefluxes). This scenario represented the perturbed values dueto LCC in equation (3) (E0
j, M0j). Using equation (3) we
estimated the potential change in breadbasket moistureavailability for points containing a given crop within eachbreadbasket region shown in figure 1. Finally, 25 yrPEGASUS model simulations with precipitation patternsaltered to reflect changes in moisture availability as calculatedabove were integrated to calculate changes in potential cropyield relative to climatological conditions. Additionally, aseries of LCC scenarios were considered by limiting LCC toencroaching areas around breadbasket regions excluding landalready under agricultural usage and incrementally increasingthe magnitude of LCC (SI3 available at stacks.iop.org/ERL/7/014009/mmedia).
3. Results
3.1. The evaporative source of breadbasket moistureavailability
To investigate the potential impacts of land cover change onthe breadbasket regions, we determined the spatial patternsof ES for each region. The ES (shaded) results are shown infigure 2, along with the fractional area of the crop (contours)and NCEP reanalysis-II climatological 850 mb wind vectors.
In East Asia (figure 2(a)), there was evidence of extensivemoisture recycling within the region, with much of themoisture that precipitates over wheat last evaporating offthe surface from the region itself. The East Asia regionalso had a long westward tail that followed the grasslandand mixed forest biome to the north and west of the GobiDesert, which contributed significant amounts of moisture togrowing season moisture availability in the northern portionof the breadbasket region. Meanwhile only a small percentageof wheat’s moisture source in the region originated overthe ocean, and that evaporation was largely constrained tothe Yellow Sea and South China Sea. This was related tocirculation patterns associated with the East Asian summermonsoon, which is the climatologically dominate featurethroughout much of the April–July growing season of wheatin the region (Lee et al 2008).
For the Central Asian wheat belt region, the ES patternwas primarily zonal for the May–August growing period,with large amounts of moisture recycling (figure 2(c)).This was anticipated given the large range of longitude
4

Environ. Res. Lett. 7 (2012) 014009 J E Bagley et al
Figure 2. Evaporative source (mm H2O m�2) of crop growing sections of each region during its growing season as defined by theplanting/harvesting dates shown in table 1 (shaded). Also shown are the observed crop fractional area (�) (contours), NCEP Reanalysis-II850 mb climatological winds (m s�1) (arrows), and breadbasket regions (terrestrial locations within black boxes).
(⇠40�) encompassed by the region and the zonal flow ofclimatological winds in the region. In the extensive wheatcrops of the Ukraine, Kazakhstan and Russia the moistureavailability was largely dependent on water supplied byterrestrial evaporation from Eastern Europe and local sources.This region had a very limited oceanic influence, although theBlack Sea and Caspian Sea did contribute to the ES.
In the Midwestern United States, moisture for maizegrowth is largely supplied by terrestrial evaporation to thesouthwest of the main growing region (figure 2(d)). Here,the regional recycling appeared to be small relative to otherregions. There was also a clear influence in the US maize’sES from the Gulf of Mexico. Previous studies have foundsignificant variations in precipitation in the United States tobe correlated to changes in the nocturnal low-level jet ofsoutherly flow from the Gulf of Mexico over the Great Plains,as well as changes in circulation associated with El Nino(Helfand and Schuber 1999, Hu and Feng 2001). Helfandand Schuber (1999) estimate that approximately one-third ofthe moisture entering the United States enters via the Great
Plains low-level jet. This suggests that potential land coverchanges which alter the ability of the surface to absorb andre-transpire moisture as it moves from the Gulf of Mexicoto the maize crop in the Midwestern United States maysignificantly influence moisture availability and productivityof the region.
In the South American region (figure 2(b)) we foundthat the climatological ES footprint for soybean producingareas was largely terrestrial for the November–April growingseason. With the Andes physically bounding the west sideof the region, much of the moisture that contributes tosoybean crops comes from the north and northwest, witha substantial fraction of the ES being located over theBrazilian Amazon. Nearly the entire terrestrial ES resideswithin the region, indicating large moisture recycling. This isof particular consequence for this region, as multiple studieshave indicated that human modifications to the area have thepotential to drastically reduce evapotranspiration (Dickinsonand Henderson-Sellers 1988, Zhang and Henderson-Sellers1996, Snyder et al 2004). Additionally, this is a critical region
5

Environ. Res. Lett. 7 (2012) 014009 J E Bagley et al
for investigation of water vapor transport, with ⇠15% ofthe Brazilian rainforest already converted to agriculture, andmodeling studies suggesting that vegetation in this regionmay be susceptible to diebacks due to positive feedbacksassociated with reduced water vapor flows (Oyama and Nobre2003).
Finally, for West African wheat, the June–Septembergrowing season is directly related to the Northward movementof the ITCZ, with peak rainfall typically lagging its passage byseveral months (Hastenrath 1991). Figure 2(e) shows that theterrestrial ES is relatively local, with significant contributionsfrom the tropical rainforest and savanna regions of CentralAfrica, and is negligible to the north due to the presence of theSahara Desert. There was also evidence that a large fractionof the West African wheat ES footprint is oceanic relative toother regions.
3.2. Potential impact of land cover change on breadbasketevaporative source, moisture availability and crop yield
Figure 3 provides quantitative estimates of the ES contributionfor relevant areal groupings, and shows the total potentialimpact of LCC on ES. We found that the impact of removingvegetation from regions not under agricultural usage typicallyreduced moisture availability for breadbasket crops between6 and 17% (yellow bars in figure 3, table 2), and potentialcrop yields from 1 to 17% (table 2). The smallest impact onmoisture availability was found to be for North Americanmaize, and the largest were South American soybeans andCentral Asian wheat. These changes impacted potential cropyields greatest in the East and Central Asian wheat andNorth American maize regions, and least in the West Africanmaize region. Additionally, as described in supplementalinformation (SI3 available at stacks.iop.org/ERL/7/014009/mmedia), the rates at which breadbasket regions respondedto different magnitudes of LCC around a region variedgreatly. Large fractions of the potential changes in moistureavailability in Central Asia (table 2; figure 3) were foundto occur with the first 20% of maximum potential LCC(supplemental figure 2 available at stacks.iop.org/ERL/7/014009/mmedia), while other regions had a more gradualresponse.
There were several factors that contributed to thelarge reduction of ES for Central Asian wheat and SouthAmerican soybeans with the removal of natural vegetationfrom non-agricultural land (figures 3(b) and (c); table 2). Alarge contributor to this was that the moisture sources forthese regions tended to be densely concentrated over heavilyforested biomes, where LCC has been found to most stronglyinfluence growing season evapotranspiration. This impactwas especially evident for South American soybeans whereapproximately 60% of the evaporative source for region’ssoybeans was recycled within the region, and a significantportion of that was from tropical rainforests, where vegetationremoval has been shown to significantly reduce moisture fluxto the atmosphere (Gash and Nobre 1997, Fisch et al 2004,Bagley et al 2011).
In the case of Central Asian wheat, the relatively smallmagnitude of total precipitation over the growing season
coupled with the impact of temperate deciduous forestencompassing a significant fraction of the ES footprint playeda large role on the impact of the removal of vegetation oncrop water availability. Temperate deciduous forests transpirelarge amounts of moisture during the summer growing season.When this terrestrial moisture source to the atmosphere isreplaced exclusively by evaporation from Earth’s surface, thesoil must be relatively moist to maintain high evaporationrates. If this is not the case, water that precipitated overdevegetated regions gets partitioned into soil and groundwaterstorage and runoff and does not immediately return to theatmosphere. As shown in table 2, the modeled growing seasonsoil moisture fraction (actual water content/field capacitywater content) for the Central Asian wheat region wassignificantly lower than that of the South American soybeanregion. As a result, when vegetation cover was removed,leaving behind bare soil, the evapotranspiration and henceES over the non-agricultural land was significantly reducedfor this region. This relationship between soil moisturefraction and potential crop yield impact was consistentacross breadbaskets. Potential crop yield in regions that hadmodeled climatological soil moisture fractions >0.5 hadlimited susceptibility to reduced precipitation due to LCC.
4. Discussion
By comparing the patterns of land surface water flux andlower atmospheric circulation among regions, we were ablediscern the major climatic influences on breadbasket moistureavailability. Additionally, we estimated the potential impactof land cover change on breadbasket moisture sources, withthe assumption that perturbations to atmospheric regionalcirculation and local stability are a secondary response to landcover changes.
We found that moisture availability in regions thathad large fractions of their ES contribution from terrestriallocations were particularly susceptible to changes in ES withland cover change. These regions included the East Asianwheat, Central Asian wheat and South American soybeanregions. Moreover these impacts were magnified in regionswhere LCC removed vegetation that was identified as largesources of water vapor during the crops’ growing seasons.This was particularly evident for the Central Asian wheat andSouth American soybean regions, where deciduous or tropicalforests were a significant source of moisture for precipitationover the crops. In these regions we calculated that LCC hadthe potential to reduce moisture availability for wheat cropsby up to 17%.
Another major factor that controlled the impact ofland cover change on breadbaskets appeared to be moisturerecycling within the regions. For breadbasket regions such asCentral Asian wheat and South American soybeans, moisturethat evaporated from within the regions themselves accountedfor 47–60% of the total moisture that fell as precipitationover the crops. This demonstrated that ES was relativelyconcentrated in area and that natural vegetation within theseareas was strongly transpiring and hence susceptible toLCC. Therefore, it is expected that moisture availability and
6

Environ. Res. Lett. 7 (2012) 014009 J E Bagley et al
Figure 3. The growing season contribution of different surface classes to the total ES (gray) for each breadbasket region. For each graphthe ocean (blue) and land (green) categories sum to the total ES. These represent the magnitudes of the oceanic and terrestrial sources ofmoisture for each region. The region category (brown) represents the amount of precipitated moisture that last evaporated from the regionitself (the black bar within it represents that which evaporated off the specific crop in the region). The agricultural land shows the totalmoisture contributed by crops and pastures to breadbasket precipitation, with the remaining available land being labeled non-agriculturalland. The non-agricultural land and managed land sum to the total land. Finally, the yellow bars show the ES of unmanaged land and totalES for the total LCC scenario.
potential crop yield could be more susceptible to reductionsdue to land cover change in these regions.
Although moisture availability for crops in all regionswere found to be somewhat vulnerable to changes inevaporative sources due to LCC, with potential reductionsof 7–16%, their prospective impact on potential crop yieldsvaried widely among the regions (1–17% range in reductionof potential crop yield). There were two key variables thatexplained differences in potential crop yield. The first was
the magnitude of potential moisture availability change, withregions exhibiting greater potential reductions in moistureavailability tending to also show greater changes in potentialcrop yield. The second was the soil moisture fraction withinroot zones. Regions that had climatological soil moisturefractions greater than ⇠0.5 tended to minimize potential cropyield impacts from changing moisture availability.
These results indicate that alterations to surface energyand moisture fluxes due to LCC have the potential to
7
Environ. Res. Lett. 7 (2012) 014009 J E Bagley et al
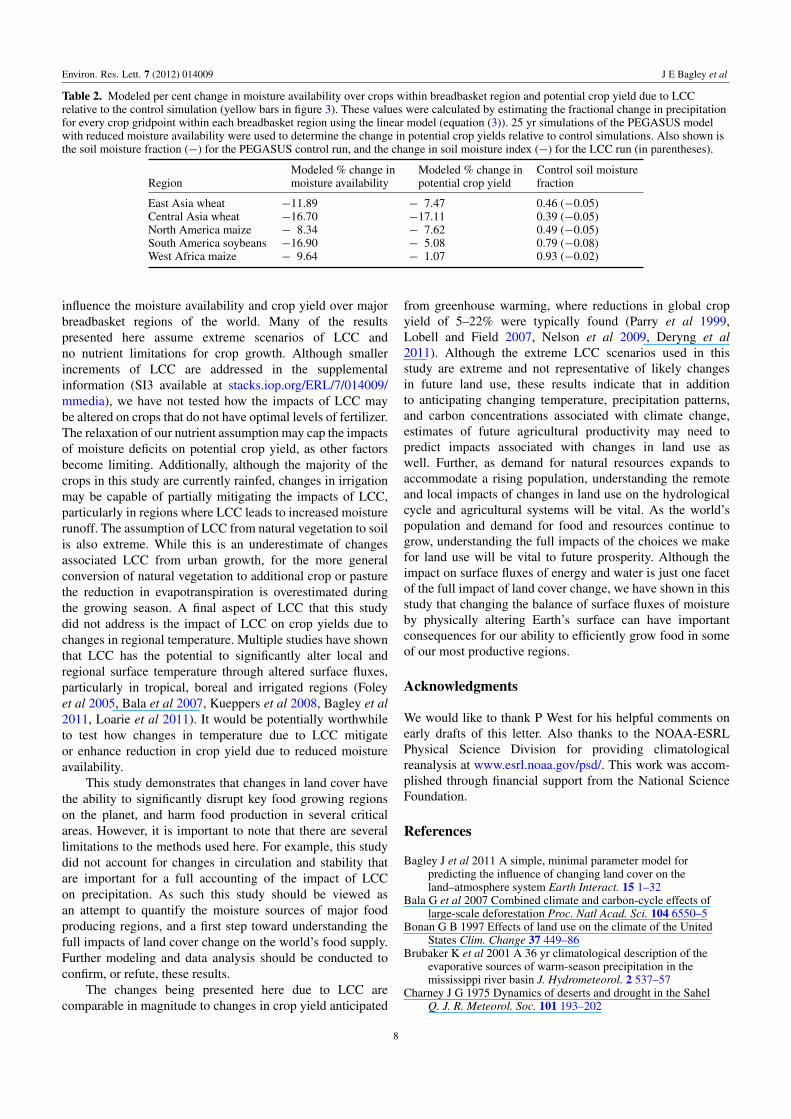
Table 2. Modeled per cent change in moisture availability over crops within breadbasket region and potential crop yield due to LCCrelative to the control simulation (yellow bars in figure 3). These values were calculated by estimating the fractional change in precipitationfor every crop gridpoint within each breadbasket region using the linear model (equation (3)). 25 yr simulations of the PEGASUS modelwith reduced moisture availability were used to determine the change in potential crop yields relative to control simulations. Also shown isthe soil moisture fraction (�) for the PEGASUS control run, and the change in soil moisture index (�) for the LCC run (in parentheses).
RegionModeled % change inmoisture availability
Modeled % change inpotential crop yield
Control soil moisturefraction
East Asia wheat �11.89 � 7.47 0.46 (�0.05)Central Asia wheat �16.70 �17.11 0.39 (�0.05)North America maize � 8.34 � 7.62 0.49 (�0.05)South America soybeans �16.90 � 5.08 0.79 (�0.08)West Africa maize � 9.64 � 1.07 0.93 (�0.02)
influence the moisture availability and crop yield over majorbreadbasket regions of the world. Many of the resultspresented here assume extreme scenarios of LCC andno nutrient limitations for crop growth. Although smallerincrements of LCC are addressed in the supplementalinformation (SI3 available at stacks.iop.org/ERL/7/014009/mmedia), we have not tested how the impacts of LCC maybe altered on crops that do not have optimal levels of fertilizer.The relaxation of our nutrient assumption may cap the impactsof moisture deficits on potential crop yield, as other factorsbecome limiting. Additionally, although the majority of thecrops in this study are currently rainfed, changes in irrigationmay be capable of partially mitigating the impacts of LCC,particularly in regions where LCC leads to increased moisturerunoff. The assumption of LCC from natural vegetation to soilis also extreme. While this is an underestimate of changesassociated LCC from urban growth, for the more generalconversion of natural vegetation to additional crop or pasturethe reduction in evapotranspiration is overestimated duringthe growing season. A final aspect of LCC that this studydid not address is the impact of LCC on crop yields due tochanges in regional temperature. Multiple studies have shownthat LCC has the potential to significantly alter local andregional surface temperature through altered surface fluxes,particularly in tropical, boreal and irrigated regions (Foleyet al 2005, Bala et al 2007, Kueppers et al 2008, Bagley et al2011, Loarie et al 2011). It would be potentially worthwhileto test how changes in temperature due to LCC mitigateor enhance reduction in crop yield due to reduced moistureavailability.
This study demonstrates that changes in land cover havethe ability to significantly disrupt key food growing regionson the planet, and harm food production in several criticalareas. However, it is important to note that there are severallimitations to the methods used here. For example, this studydid not account for changes in circulation and stability thatare important for a full accounting of the impact of LCCon precipitation. As such this study should be viewed asan attempt to quantify the moisture sources of major foodproducing regions, and a first step toward understanding thefull impacts of land cover change on the world’s food supply.Further modeling and data analysis should be conducted toconfirm, or refute, these results.
The changes being presented here due to LCC arecomparable in magnitude to changes in crop yield anticipated
from greenhouse warming, where reductions in global cropyield of 5–22% were typically found (Parry et al 1999,Lobell and Field 2007, Nelson et al 2009, Deryng et al2011). Although the extreme LCC scenarios used in thisstudy are extreme and not representative of likely changesin future land use, these results indicate that in additionto anticipating changing temperature, precipitation patterns,and carbon concentrations associated with climate change,estimates of future agricultural productivity may need topredict impacts associated with changes in land use aswell. Further, as demand for natural resources expands toaccommodate a rising population, understanding the remoteand local impacts of changes in land use on the hydrologicalcycle and agricultural systems will be vital. As the world’spopulation and demand for food and resources continue togrow, understanding the full impacts of the choices we makefor land use will be vital to future prosperity. Although theimpact on surface fluxes of energy and water is just one facetof the full impact of land cover change, we have shown in thisstudy that changing the balance of surface fluxes of moistureby physically altering Earth’s surface can have importantconsequences for our ability to efficiently grow food in someof our most productive regions.
Acknowledgments
We would like to thank P West for his helpful comments onearly drafts of this letter. Also thanks to the NOAA-ESRLPhysical Science Division for providing climatologicalreanalysis at www.esrl.noaa.gov/psd/. This work was accom-plished through financial support from the National ScienceFoundation.
References
Bagley J et al 2011 A simple, minimal parameter model forpredicting the influence of changing land cover on theland–atmosphere system Earth Interact. 15 1–32
Bala G et al 2007 Combined climate and carbon-cycle effects oflarge-scale deforestation Proc. Natl Acad. Sci. 104 6550–5
Bonan G B 1997 Effects of land use on the climate of the UnitedStates Clim. Change 37 449–86
Brubaker K et al 2001 A 36 yr climatological description of theevaporative sources of warm-season precipitation in themississippi river basin J. Hydrometeorol. 2 537–57
Charney J G 1975 Dynamics of deserts and drought in the SahelQ. J. R. Meteorol. Soc. 101 193–202
8

Environ. Res. Lett. 7 (2012) 014009 J E Bagley et al
De Ridder K 1997 Land surface processes and the potential forconvective precipitation J. Geophys. Res. 102 30085–90
Deryng D, Sacks W J, Barford C C and Ramankutty N 2011Simulating the effects of climate and agricultural managementpractices on global crop yield Glob. Biogeochem. Cycles25 GB2006
Dickinson R and Henderson-Sellers A 1988 Modelling tropicaldeforestation: a study of GCM land-surface parametrizationsQ. J. R. Meteorol. Soc. 114 439–62
Dirmeyer P A and Brubaker K L 1999 Contrasting evaporativemoisture sources during the drought of 1988 and the flood of1993 J. Geophys. Res. 104 19383–97
Dirmeyer P A and Brubaker K L 2007 Characterization of theglobal hydrologic cycle from a back-trajectory analysis ofatmospheric water vapor J. Hydrometeorol. 8 20–37
Dirmeyer P A and Kinter J L 2010 Floods over the US Midwest: aregional water cycle perspective J. Hydrometeorol. 11 1172–81
Dirmeyer P A et al 2009 Import and export of atmospheric watervapor between nations J. Hydrol. 365 11–22
Eltahir E 1996 Role of vegetation in sustaining large-scaleatmospheric circulations in the tropics J. Geophys. Res.101 4255–68
FAO (UN Food and Agriculture Organisation) 2006 Worldagriculture: towards 2030/2050 Prospects for Food, Nutrition,Agriculture and Major Commodity Groups (Rome: GlobalPerspective Studies Unit for the Food and AgriculturalOrganization of the United Nations)
Fisch G et al 2004 The convective boundary layer over pasture andforest in Amazonia Theor. Appl. Climatol. 78 47–59
Foley J A et al 2005 Global consequences of land use Science309 570–4
Foley J A et al 2011 Solutions for a cultivated planet Nature478 337–42
Gash J and Nobre C 1997 Climatic effects of Amazoniandeforestation: some results from ABRACOS Bull. Am.Meteorol. Soc. 78 823–30
Haberl H et al 2007 Quantifying and mapping the humanappropreation of net primary production in earth’s terrestrialecosystems Proc. Natl Acad. Sci. 104 12942–7
Hastenrath S 1991 Climate Dynamics of the Tropics (Dordrecht:Kluwer) p 488
Helfand M and Schuber S 1999 Climatology of the simulated greatplains low-level jet and its contribution to the continentalmoisture budget of the United States J. Clim. 8 784–805
Hsiang S M et al 2011 Civil conflicts are associated with the globalclimate Nature 476 438–41
Hu Q and Feng S 2001 Climatic role of the southerly flow from theGulf of Mexico in interannual variations in summer rainfall inthe central United States J. Clim. 14 3156–70
Kanamitsu M et al 2002 NCEP–DOE AMIP-II reanalysis (R-2)Bull. Am. Meteorol. Soc. 83 1631–43
Kucharik C J 2008 Contribution of planting date trends to increasedmaize yields in the central United States Agron. J. 100 1–9
Kueppers L M et al 2008 Seasonal temperature responses toland-use change in the western United States Glob. Planet.Change 60 250–64
Lee E et al 2008 Seasonal forecasting of East Asian summermonsoon based on oceanic heat sources Int. J. Climatol.28 667–78
Leff B, Ramankutty N and Foley J A 2004 Geographic distributionof major crops across the world Glob. Biogeochem. Cycles18 GB1009
Licker R et al 2010 Mind the gap: how do climate and agriculturalmanagement explain the ‘yield gap’ of croplands around theworld? Glob. Ecol. Biogeogr. 19 769–82
Loarie S R et al 2011 Direct impacts on local climate of sugar-caneexpansion in Brazil Nature Clim. Change 1 105–9
Lobell D B and Asner G P 2003 Climate and managementcontributions to recent trends in US agricultural yields Science299 1032
Lobell D B and Field C B 2007 Global scale climate-crop yieldrelationships and the impacts of recent warming Environ. Res.Lett. 2 014002
Monfreda C, Ramankutty N and Foley J A 2008 Farming the planet:2. Geographic distribution of crop areas, yields, physiologicaltypes, and net primary production in the year 2000 Glob.Biogeochem. Cycles 22 GB1022
Nelson G C et al 2009 Climate Change: Impact on Agriculture andCosts of Adaptation (Washington, DC: International FoodPolicy Research Institute (IFPRI))
Nobre P et al 2009 Amazon deforestation and climate change in acoupled model simulation J. Clim. 22 5686–97
Oyama M D and Nobre C A 2003 A new climate-vegetationequilibrium state for tropical South America Geophys. Res.Lett. 30 2199
Parry M et al 1999 Climate change and world food security: a newassessment Glob. Environ. Change 9 S51–67
Ramankutty N, Evan A T, Monfreda C and Foley J A 2008 Farmingthe planet: 1. Geographic distribution of global agriculturallands in the year 2000 Glob. Biogeochem. Cycles 22 GB1003
Ramankutty N and Foley J 1999 Estimating historical changes inglobal land cover: croplands from 1700 to 1992 Glob.Biogeochem. Cycles 13 997–1027
Rockstrom J et al 2009 A safe operating space for humanity Nature461 472–5
Sacks W J et al 2010 Crop planting dates: an analysis of globalpatterns Glob. Ecol. Biogeogr. 19 607–20
Snyder P et al 2004 Evaluating the influence of different vegetationbiomes on the global climate Clim. Dyn. 23 279–302
Tilman D 2001 Forecasting agriculturally driven globalenvironmental change Science 292 281–4
van der Ent R J et al 2010 Origin and fate of atmospheric moistureover continents Water Resour. Res. 46 1–12
Wallace J and Hobbs P 1977 Atmospheric Science an IntroductorySurvey (London: Academic) p 467
Yoshimura K et al 2004 Colored moisture analysis estimates ofvariations in 1998 J. Meteor. Soc. Japan 82 1315–29
Zhang H and Henderson-Sellers A 1996 Impacts of tropicaldeforestation. Part I: process analysis of local climatic changeJ. Clim. 9 1497–517
9

Supplemental Information
SI 1. Evaporative source data description
To construct the evaporative source (ES) dataset, Dirmeyer and Brubaker (1999)
developed a quasi-isentropic back-trajectory scheme. In this scheme, water vapor was treated as
a passive tracer from the time it is evaporated from the earth’s surface to the time it returns as
precipitation. The water vapor was tracked backward in time from precipitation events observed
in the gridded precipitation data of Xie and Arkin (1997). Within the precipitation event’s region,
multiple water vapor parcels were initialized with horizontal and vertical spacing to sample the
total water vapor contributing to the event. These parcels were then traced backward in time
along paths determined using wind and temperature from NCEP-DOE AMIP II reanalysis data
(Kanamitsu et al. 2002). Reanalysis evaporation and total column precipitable water data were
also used along the tracer path to calculate the fraction of water vapor in the parcel that
originated at that point in the path. By aggregating the tracers across observed precipitation
events for a single gridpoint, a probability distribution function for the evaporation that supplies
moisture to precipitation at the point could be calculated. From this probability distribution the
ES for a gridpoint was determined, with the global integral of the ES weighted by area being
equal to the monthly-mean rainfall for the region represented by the gridpoint. A recent study by
Trenberth et al. (2011) has indicated that reanalysis products tend to overestimate atmospheric
recycling of water, which can cause water vapor to have an artificially short atmospheric
lifespan. This may contribute to an overestimate of the localization of ES for breadbasket regions
in this study. For more details on the method used to construct the ES estimates see Dirmeyer
and Brubaker (2007).

SI 2. PEGASUS model description
The PEGASUS model is a minimal parameter 5’ x 5’ global ecosystem model with crop and
atmospheric boundary layer modeling capabilities. With the exception of radiative and boundary
layer processes it uses a daily timestep. For this study, the model was forced by CRU 2.1 30-year
mean values of temperature, precipitation, and cloud cover that were linearly interpolated to
produce daily values (New et al. 2002). The model also used the ISRIC-WISE 5’
latitude/longitude map of soil available water capacity to estimate soil properties (Batjes 2006).
When land cover is altered, the surface energy balance will generally shift. In PEGASUS
the surface energy balance over the course of a day is represented as:
(S1)
where SWin,out is the incoming/outgoing shortwave radiation that is linearly dependent on surface
albedo, Rn is the net longwave radiation, L is the latent heat flux, H is the sensible heat flux, and
G is the surface heat storage and is assumed to be negligible over the course of a day. This
assumption is consistent with other global ecosystem models. For the purposes of this study we
focussed on the latent heat flux, but a full description of how PEGASUS calculates each of the
fluxes can be found in Bagley et al. (2011). The potential evapotranspiration (PET) was
estimated using a Priestley-Taylor approach, and actual evapotranspiration was calculated as a
fraction of PET. When vegetative cover is altered, L is directly impacted as different biomes
release moisture uniquely depending on a variety of factors including surface roughness, root
depth, and stomatal conductance. Also, physical plant structures intercept different amounts of
precipitation and allow different magnitudes of evaporation from the earth’s surface, further
altering the water flux to the atmosphere.

Potential crop yields in PEGASUS were calculated by integrating the effects of climate,
planting dates, crop specific irrigated areas, cultivar choices, and fertilizer choices for maize,
wheat, and soybeans. These factors were combined using a dynamic carbon allocation scheme
designed to realistically allocate carbon to crop organs combined with surface energy budget,
soil water balance, and a light use efficiency model (Deryng et al. 2011). Net biomass production
(B) of each crop was calculated as:
(S2)
where H is the light use efficiency coefficient, APAR is mean daily available photosynthetically
active radiation, fT is a temperature limiting factor, fW is a water limiting factor, and fn is a
nutrient limiting factor (Deryng et al. 2011).
SI 3. Estimating Impacts of Incremental Changes in LCC on Moisture Availability and Potential
Crop Yield
Determining the potential impact of the total removal of vegetation of non-agricultural
land on the ES of breadbasket precipitation is a useful exercise for finding the bounds of
vegetative influence. However, it is not a realistic scenario for the foreseeable future. In this
section we investigate the range of influence that removing vegetation at different scales has on
breadbasket moisture availability and potential crop yield.
In order to estimate the range of impacts that incrementally increasing LCC had on
moisture availability and potential crop yield in breadbasket regions, we developed a metric that
ranked gridpoints in the order in which they would be affected by LCC:
(6)

where Ri is a generic rank metric of a given gridpoint ‘i', fa,i is the agricultural fractional area,
and min(xi,j) is the shortest distance (km) of gridpoint ‘i' from any local maxima of crop
fractional area ‘j’.
The generic rank metric was constructed following a simple set of assumptions. First, we
assumed that the fractional area of a region that was already used as cropland or pasture
(Supplemental Figure 1d) was not be eligible for vegetation removal, and would remain
agricultural land. Second, we made the conservative assumption that pristine regions that were
completely non-agricultural (fractional area equal to zero in Supplemental Figure 1d) were
unsuitable or inaccessible for agriculture, and would remain unmanaged. Third, areas that
already contained large fractions of crops or pasture and were proximal to local maxima of
fractional area in each breadbasket region shown in Figure 2 (contours) would be subject to LCC
first. Lastly, we did not consider LCC beyond 3000km from each region’s local maxima of
fractional area.
Beginning with the point with the largest Ri and proceeding to the lowest Ri we removed
vegetation in 5% increments of the total land available for conversion within and around each
breadbasket region. At each increment we calculated the change in evapotranspiration using 25-
year PEGASUS model runs, and estimated the change in moisture availability using the linear
model from Section 2.4. Finally, in each breadbasket region we altered the climatological
precipitation in PEGASUS to reflect the change in moisture availability and modeled how the
change in vegetation would impact potential crop yields in the region. For these simulations it
was assumed that nutrients were not limited, crops were rainfed, and planting/harvesting dates
were set to currently observed values.

Supplemental Figure 2 shows the impact of incremental vegetation removal on potential
crop yield. We found there were critical differences in the rate at which moisture availability
responded to land conversion. For example for Central Asian wheat, ~46% of the total potential
change in moisture availability occurred with just 20% of the available vegetation removed,
while for South American soybeans only ~36% of the total potential change in moisture
availabilty occurred with 20% of available vegetation removed. This suggests that moisture that
contributes to Central Asian wheat growth is particularly sensitive to changes in terrestrial LCC
within and near the region itself.
Although decreases in moisture availability due to LCC always resulted in lower crop
growth, we found that regions with potential crop yield most susceptible to LCC were those with
low soil moisture fractions in the root zone during the growing period (Table 2 and triangles in
Supplemental Figure 2) In general, the regions that maintained a soil moisture fraction in the root
zone above 0.5, such as South America and West Africa were relatively unsusceptible to
potential crop yields being impacted by changing precipitation due to LCC. Regions with mean
soil moisture fractions below 0.5, including North America, Central Asia, and East Asia were far
more sensitive to changes from LCC.

Supplem(c) usingpasture frtotal agri
mental Figure described in
fractional areicultural area
e 1: Observedn Monfreda ea (d) (using a for the purp
d fractional get al. (2008)data describ
poses of this
growing are). Also showbed in Ramas study.
a of maize (wn are the comankutty et al.
(a), wheat (bmbined tota. 2008) that r
), and soybel crop and represents th
eans
he

Supplemfraction iin each brepresentfraction i
mental Figurein the root zobreadbasket rted as a percin the root zo
e 2: The chanone (triangleregion. The mcentage of thone is shown
nge in mean es), and totalmean moistueir climatolon as its raw v
moisture avl potential crure availabilogical controvalue.
vailability (asrop yield (dility and meanol run values
sterisks), meamonds) forn soil moistus, and the me
ean soil moisr increasing Lure are ean soil moi
sture LCC
isture

Supplemental References Batjes, N. (2006), 'ISRIC-WISE Derived Soil Properties on a 5 by 5 Arc-Minutes Global Grid (Version 1.0), Wageningen: ISRIC—World Soil Information.
Deryng, D., W. J. Sacks, C. C. Barford, and N. Ramankutty (2011), Simulating the effects of climate and agricultural management practices on global crop yield, Global Biogeochem. Cycles, 25, GB2006, doi:10.1029/2009GB003765. !Dirmeyer, P. A., and K. L. Brubaker (1999), Contrasting Evaporative Moisture Sources During the Drought of 1988 and the Flood of 1993, J. of Geophysical Research, 19383-19397.
Dirmeyer, P. A., and K. L. Brubaker (2007), Characterization of the Global Hydrologic Cycle from a Back-Trajectory Analysis of Atmospheric Water Vapor, Journal of Hydrometeorology, 8, 20-37.
Kanamitsu, M., et al. (2002), NCEP–DOE AMIP-II Reanalysis (R-2), Bull Amer Met Soc, 83, 1631-1643.
New, M., et al. (2002), A high-resolution data set of surface climate over global land areas, Climate Research, 21, 1-25.
Trenberth, K. (2011), Atmospheric moisture transports from ocean to land and global energy flows in reanalyses, J. of Climate, doi:!10.1175/2011JCLI4171.1
Xie, P., and P. Arkin (1997), Global precipitation: A 17-year monthly analysis based on gauge observations, satellite estimates and numerical model outputs, BAMS, 78, 2539-2558.
!
Copyright © 2022 FDOKUMEN