Effects of Injection Molding Process Parameters on the ... - MDPI
17
polymers Article Effects of Injection Molding Process Parameters on the Chemical Foaming Behavior of Polypropylene and Polystyrene Chen-Yuan Chung 1, *, Shyh-Shin Hwang 2 , Shia-Chung Chen 3 and Ming-Chien Lai 1 Citation: Chung, C.-Y.; Hwang, S.-S.; Chen, S.-C.; Lai, M.-C. Effects of Injection Molding Process Parameters on the Chemical Foaming Behavior of Polypropylene and Polystyrene. Polymers 2021, 13, 2331. https:// doi.org/10.3390/polym13142331 Academic Editor: Jose Antonio Ruiz Received: 28 May 2021 Accepted: 8 July 2021 Published: 16 July 2021 Publisher’s Note: MDPI stays neutral with regard to jurisdictional claims in published maps and institutional affil- iations. Copyright: © 2021 by the authors. Licensee MDPI, Basel, Switzerland. This article is an open access article distributed under the terms and conditions of the Creative Commons Attribution (CC BY) license (https:// creativecommons.org/licenses/by/ 4.0/). 1 Department of Mechanical Engineering, National Central University, Taoyuan City 320317, Taiwan; [email protected] 2 Department of Mechanical Engineering, Chien Hsin University of Science and Technology, Taoyuan City 320312, Taiwan; [email protected] 3 Department of Mechanical Engineering, Chung Yuan Christian University, Taoyuan City 320314, Taiwan; [email protected] * Correspondence: [email protected] or [email protected] Abstract: In the present study, semi-crystalline polypropylene (PP) and amorphous polystyrene (PS) were adopted as matrix materials. After the exothermic foaming agent azodicarbonamide was added, injection molding was implemented to create samples. The mold flow analysis program Moldex3D was then applied to verify the short-shot results. Three process parameters were adopted, namely injection speed, melt temperature, and mold temperature; three levels were set for each factor in the one-factor-at-a-time experimental design. The macroscopic effects of the factors on the weight, specific weight, and expansion ratios of the samples were investigated to determine foaming efficiency, and their microscopic effects on cell density and diameter were examined using a scanning electron microscope. The process parameters for the exothermic foaming agent were optimized accordingly. Finally, the expansion ratios of the two matrix materials in the optimal process parameter settings were compared. After the experimental database was created, the foaming module of the chemical blowing agents was established by Moldex3D Company. The results indicated that semi-crystalline materials foamed less due to their crystallinity. PP exhibits the highest expansion ratio at low injection speed, a high melt temperature, and a low mold temperature, whereas PS exhibits the highest expansion ratio at high injection speed, a moderate melt temperature, and a low mold temperature. Keywords: exothermic chemical foaming agent; foam injection molding; semi-crystalline material; amorphous material 1. Introduction With the development of environmental awareness, an increasing number of products have been created with an emphasis on structural weight reduction. Polymeric foam manufacturing was first introduced in the 1960s. Beyer and Dahl [1] mixed compounds that can be thermally expanded in thermoplastic resinous material to facilitate chemical foaming in the material structure. In the early 1980s, researchers at Massachusetts Institute of Technology developed microcellular foaming [2]. Foam products developed using this technology absorb sound [3], have low thermal conductivity [4], and are resistant to shrinkage and warpage [5]; these products can be applied in packaging and insulation. Foam injection molding is achieved with the aid of foaming agents, either a physical blow agent (PBA) or a chemical blow agent (CBA), which can be dosed into the polymer. PBA foaming involves the mixing of plastic melt and supercritical fluid (SCF) in a injection barrel [6]. The solubility of SCF is between that of liquid and gas; however, its diffusion coefficient is 10–100 times that of liquid. Therefore, the SCF mass transfer rate is higher than that of liquid. Moreover, SCF exhibits viscosity close to that of gas. These two characteristics enable SCF to dissolve in plastic melt. The pressure drop caused by the Polymers 2021, 13, 2331. https://doi.org/10.3390/polym13142331 https://www.mdpi.com/journal/polymers
-
Upload
khangminh22 -
Category
Documents
-
view
1 -
download
0
Transcript of Effects of Injection Molding Process Parameters on the ... - MDPI
polymers
Article
Effects of Injection Molding Process Parameters on theChemical Foaming Behavior of Polypropylene and Polystyrene
Chen-Yuan Chung 1,*, Shyh-Shin Hwang 2, Shia-Chung Chen 3 and Ming-Chien Lai 1
�����������������
Citation: Chung, C.-Y.; Hwang, S.-S.;
Chen, S.-C.; Lai, M.-C. Effects of
Injection Molding Process Parameters
on the Chemical Foaming Behavior of
Polypropylene and Polystyrene.
Polymers 2021, 13, 2331. https://
doi.org/10.3390/polym13142331
Academic Editor: Jose Antonio Ruiz
Received: 28 May 2021
Accepted: 8 July 2021
Published: 16 July 2021
Publisher’s Note: MDPI stays neutral
with regard to jurisdictional claims in
published maps and institutional affil-
iations.
Copyright: © 2021 by the authors.
Licensee MDPI, Basel, Switzerland.
This article is an open access article
distributed under the terms and
conditions of the Creative Commons
Attribution (CC BY) license (https://
creativecommons.org/licenses/by/
4.0/).
1 Department of Mechanical Engineering, National Central University, Taoyuan City 320317, Taiwan;[email protected]
2 Department of Mechanical Engineering, Chien Hsin University of Science and Technology,Taoyuan City 320312, Taiwan; [email protected]
3 Department of Mechanical Engineering, Chung Yuan Christian University, Taoyuan City 320314, Taiwan;[email protected]
* Correspondence: [email protected] or [email protected]
Abstract: In the present study, semi-crystalline polypropylene (PP) and amorphous polystyrene(PS) were adopted as matrix materials. After the exothermic foaming agent azodicarbonamide wasadded, injection molding was implemented to create samples. The mold flow analysis programMoldex3D was then applied to verify the short-shot results. Three process parameters were adopted,namely injection speed, melt temperature, and mold temperature; three levels were set for eachfactor in the one-factor-at-a-time experimental design. The macroscopic effects of the factors onthe weight, specific weight, and expansion ratios of the samples were investigated to determinefoaming efficiency, and their microscopic effects on cell density and diameter were examined usinga scanning electron microscope. The process parameters for the exothermic foaming agent wereoptimized accordingly. Finally, the expansion ratios of the two matrix materials in the optimal processparameter settings were compared. After the experimental database was created, the foaming moduleof the chemical blowing agents was established by Moldex3D Company. The results indicated thatsemi-crystalline materials foamed less due to their crystallinity. PP exhibits the highest expansionratio at low injection speed, a high melt temperature, and a low mold temperature, whereas PSexhibits the highest expansion ratio at high injection speed, a moderate melt temperature, and a lowmold temperature.
Keywords: exothermic chemical foaming agent; foam injection molding; semi-crystalline material;amorphous material
1. Introduction
With the development of environmental awareness, an increasing number of productshave been created with an emphasis on structural weight reduction. Polymeric foammanufacturing was first introduced in the 1960s. Beyer and Dahl [1] mixed compoundsthat can be thermally expanded in thermoplastic resinous material to facilitate chemicalfoaming in the material structure. In the early 1980s, researchers at Massachusetts Instituteof Technology developed microcellular foaming [2]. Foam products developed usingthis technology absorb sound [3], have low thermal conductivity [4], and are resistant toshrinkage and warpage [5]; these products can be applied in packaging and insulation.Foam injection molding is achieved with the aid of foaming agents, either a physical blowagent (PBA) or a chemical blow agent (CBA), which can be dosed into the polymer. PBAfoaming involves the mixing of plastic melt and supercritical fluid (SCF) in a injectionbarrel [6]. The solubility of SCF is between that of liquid and gas; however, its diffusioncoefficient is 10–100 times that of liquid. Therefore, the SCF mass transfer rate is higherthan that of liquid. Moreover, SCF exhibits viscosity close to that of gas. These twocharacteristics enable SCF to dissolve in plastic melt. The pressure drop caused by the
Polymers 2021, 13, 2331. https://doi.org/10.3390/polym13142331 https://www.mdpi.com/journal/polymers
Polymers 2021, 13, 2331 2 of 17
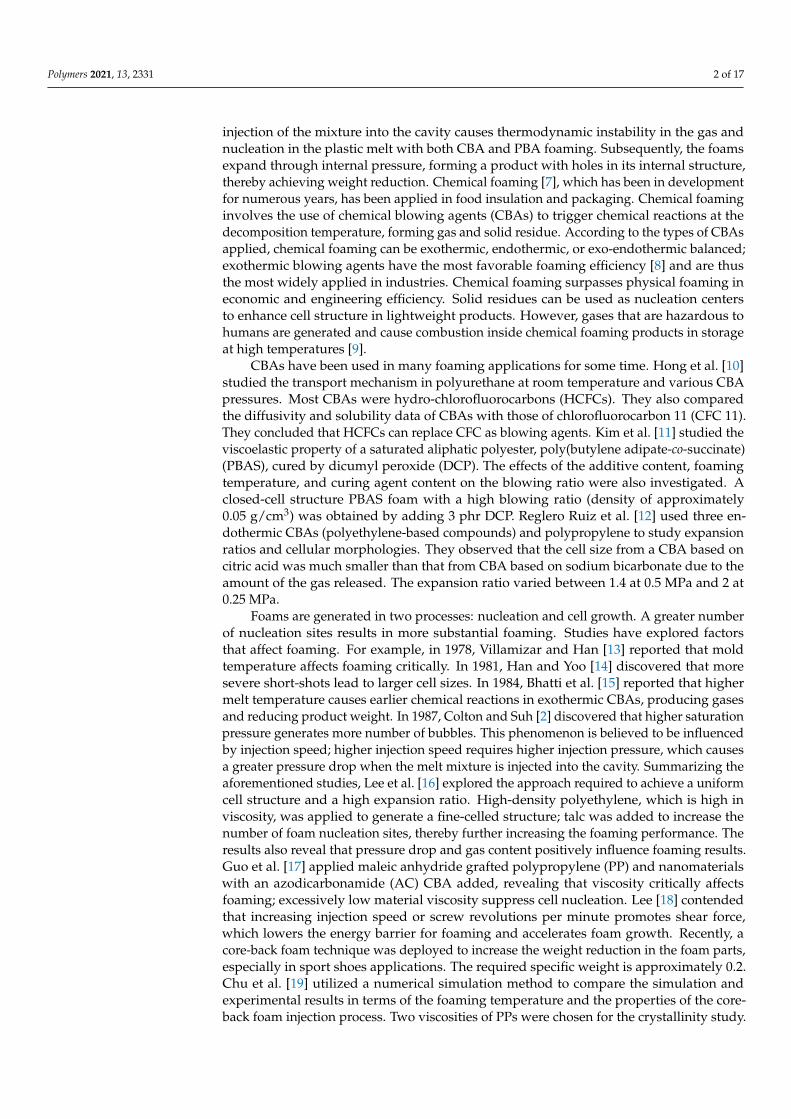
injection of the mixture into the cavity causes thermodynamic instability in the gas andnucleation in the plastic melt with both CBA and PBA foaming. Subsequently, the foamsexpand through internal pressure, forming a product with holes in its internal structure,thereby achieving weight reduction. Chemical foaming [7], which has been in developmentfor numerous years, has been applied in food insulation and packaging. Chemical foaminginvolves the use of chemical blowing agents (CBAs) to trigger chemical reactions at thedecomposition temperature, forming gas and solid residue. According to the types of CBAsapplied, chemical foaming can be exothermic, endothermic, or exo-endothermic balanced;exothermic blowing agents have the most favorable foaming efficiency [8] and are thusthe most widely applied in industries. Chemical foaming surpasses physical foaming ineconomic and engineering efficiency. Solid residues can be used as nucleation centersto enhance cell structure in lightweight products. However, gases that are hazardous tohumans are generated and cause combustion inside chemical foaming products in storageat high temperatures [9].
CBAs have been used in many foaming applications for some time. Hong et al. [10]studied the transport mechanism in polyurethane at room temperature and various CBApressures. Most CBAs were hydro-chlorofluorocarbons (HCFCs). They also comparedthe diffusivity and solubility data of CBAs with those of chlorofluorocarbon 11 (CFC 11).They concluded that HCFCs can replace CFC as blowing agents. Kim et al. [11] studied theviscoelastic property of a saturated aliphatic polyester, poly(butylene adipate-co-succinate)(PBAS), cured by dicumyl peroxide (DCP). The effects of the additive content, foamingtemperature, and curing agent content on the blowing ratio were also investigated. Aclosed-cell structure PBAS foam with a high blowing ratio (density of approximately0.05 g/cm3) was obtained by adding 3 phr DCP. Reglero Ruiz et al. [12] used three en-dothermic CBAs (polyethylene-based compounds) and polypropylene to study expansionratios and cellular morphologies. They observed that the cell size from a CBA based oncitric acid was much smaller than that from CBA based on sodium bicarbonate due to theamount of the gas released. The expansion ratio varied between 1.4 at 0.5 MPa and 2 at0.25 MPa.
Foams are generated in two processes: nucleation and cell growth. A greater numberof nucleation sites results in more substantial foaming. Studies have explored factorsthat affect foaming. For example, in 1978, Villamizar and Han [13] reported that moldtemperature affects foaming critically. In 1981, Han and Yoo [14] discovered that moresevere short-shots lead to larger cell sizes. In 1984, Bhatti et al. [15] reported that highermelt temperature causes earlier chemical reactions in exothermic CBAs, producing gasesand reducing product weight. In 1987, Colton and Suh [2] discovered that higher saturationpressure generates more number of bubbles. This phenomenon is believed to be influencedby injection speed; higher injection speed requires higher injection pressure, which causesa greater pressure drop when the melt mixture is injected into the cavity. Summarizing theaforementioned studies, Lee et al. [16] explored the approach required to achieve a uniformcell structure and a high expansion ratio. High-density polyethylene, which is high inviscosity, was applied to generate a fine-celled structure; talc was added to increase thenumber of foam nucleation sites, thereby further increasing the foaming performance. Theresults also reveal that pressure drop and gas content positively influence foaming results.Guo et al. [17] applied maleic anhydride grafted polypropylene (PP) and nanomaterialswith an azodicarbonamide (AC) CBA added, revealing that viscosity critically affectsfoaming; excessively low material viscosity suppress cell nucleation. Lee [18] contendedthat increasing injection speed or screw revolutions per minute promotes shear force,which lowers the energy barrier for foaming and accelerates foam growth. Recently, acore-back foam technique was deployed to increase the weight reduction in the foam parts,especially in sport shoes applications. The required specific weight is approximately 0.2.Chu et al. [19] utilized a numerical simulation method to compare the simulation andexperimental results in terms of the foaming temperature and the properties of the core-back foam injection process. Two viscosities of PPs were chosen for the crystallinity study.

Polymers 2021, 13, 2331 3 of 17
In their results, the PP with a low melt flow index had low crystallinity, a high crystallinerate, and a low crystallization temperature during cooling. The simulated and experimentalresults were consistent. Wu et al. [20] investigated the effects of process conditions (CBAdosage, shot size, mold temperature, injection speed, packing pressure, and core-backspeed) on the weight reduction and tensile strength of a core-back chemical foamingprocess. Wu et al. [21] used the same technology to study the effect of core-back foamingon the weld-line strength. A special reticular structure was observed near the weld-linearea. This reticular structure increased the weld-line strength. The aforementioned studieswere referenced for assessing the feasibility of the experimental results in the present study.
Several experimental design strategies may be considered for improving injectionmolded product quality based on process parameter evaluation. Among the various experi-mental design strategies, the Taguchi method and response surface methodology have beenwidely used to determine the optimal process parameters for injection molding [22,23].In the small factor change problem [24], because changing numerous factors is undesir-able, some variation on a one-factor-at-a-time (OFAT) strategy would be appropriate forundertaking quality improvement with minimal changes to factor levels. In addition, aseries of investigations [25,26] has demonstrated that OFAT has advantages over factorialexperimental designs when the experimental error is small or when interactions amongcontrol factors are large.
Although physical foaming has been demonstrated to outperform chemical foaming,it requires expensive machines. Therefore, most industry owners are inclined to favorchemical foaming. The preparation of CBAs has improved significantly; both chemicalreactions and foaming processes have improved considerably in efficiency. However, fewinvestigations of CBA foaming in injection molding have been reported due to need fora shut-off nozzle on machines. This study examined the design of experiments on CBAs,hoping to discover optimal injection parameters to improve product foaming efficiency.The relationship between macroscopic effects (weight and specific weight) and microscopiceffects (cell density and size) of a foaming product was explored. To the best of theauthors’ knowledge, no study has adopted the OFAT experimental design to examine infurther depth the effect of chemical foaming process conditions on expansion ratios. Theexperimental database in this study can serve as a guideline for the CBA foaming moduleof Moldex3D.
2. Experimental Method and Molding Simulation2.1. Facility
The injection molding machine employed in this study was an Arburg Allrounder420C (Arburg GmbH, Lossburg, Germany) equipped with Mucell capability and a screwdiameter of 40 mm. The screw L/D (length to diameter) ratio of 24 is slightly longer thanthat of a conventional screw due to the extra plasticization. However, it has a shut-offnozzle that can be used in the CBA foaming process. The temperature of the mold wascontrolled using the BYCW-021410FS mold temperature controller created by the ByyoungInternational Company (New Taipei City, Taiwan). Product weight was measured usingthe LB-210S precision digital balance machine manufactured by LWL Germany Make(Göttingen, Germany). Product density was examined using the MH-300E electronicdensimeter provided by MatsuHaku (Taichung City, Taiwan). The expansion ratio φ wascalculated using Equation (1) [27]; a smaller ρf indicates higher foaming efficiency and ahigher expansion ratio. The goal of this study was to maximize the expansion ratio throughthe optimization of process parameters.
φ =ρ0ρf
(1)
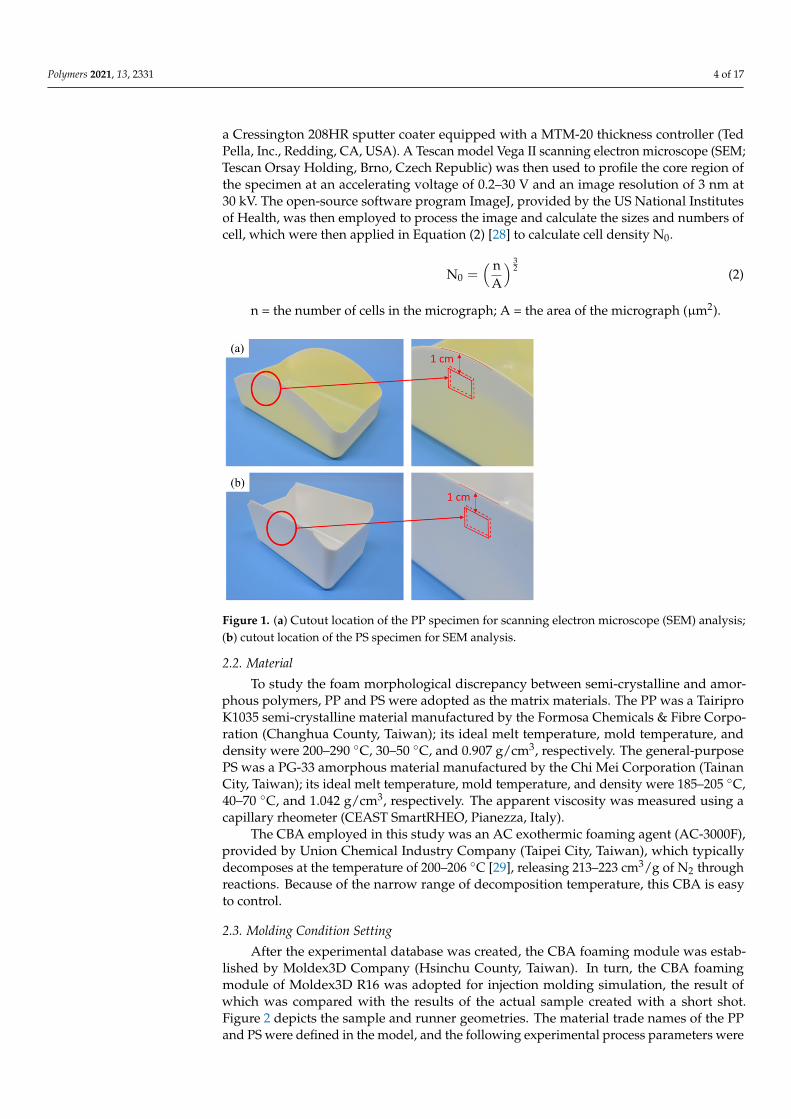
ρf = density after foaming; ρ0 = density before foaming.Figure 1 illustrates the location for the cutting of the specimen to remove a shape of
length 1 cm and width 0.5 cm. The specimen was coated with 20-nm-thick platinum in
Polymers 2021, 13, 2331 4 of 17
a Cressington 208HR sputter coater equipped with a MTM-20 thickness controller (TedPella, Inc., Redding, CA, USA). A Tescan model Vega II scanning electron microscope (SEM;Tescan Orsay Holding, Brno, Czech Republic) was then used to profile the core region ofthe specimen at an accelerating voltage of 0.2–30 V and an image resolution of 3 nm at30 kV. The open-source software program ImageJ, provided by the US National Institutesof Health, was then employed to process the image and calculate the sizes and numbers ofcell, which were then applied in Equation (2) [28] to calculate cell density N0.
N0 =( n
A
) 32 (2)
n = the number of cells in the micrograph; A = the area of the micrograph (µm2).
Polymers 2021, 13, x FOR PEER REVIEW 4 of 18
f
0
ρρ
=φ (1)
fρ = density after foaming; 0ρ = density before foaming. Figure 1 illustrates the location for the cutting of the specimen to remove a shape of
length 1 cm and width 0.5 cm. The specimen was coated with 20-nm-thick platinum in a Cressington 208HR sputter coater equipped with a MTM-20 thickness controller (Ted Pella, Inc., Redding, CA, USA). A Tescan model Vega II scanning electron microscope (SEM; Tescan Orsay Holding, Brno, Czech Republic) was then used to profile the core region of the specimen at an accelerating voltage of 0.2–30 V and an image resolution of 3 nm at 30 kV. The open-source software program ImageJ, provided by the US National Institutes of Health, was then employed to process the image and calculate the sizes and numbers of cell, which were then applied in Equation (2) [28] to calculate cell density N0.
23
0 AnN
= (2)
n = the number of cells in the micrograph; A = the area of the micrograph (µm2).
Figure 1. (a) Cutout location of the PP specimen for scanning electron microscope (SEM) analysis; (b) cutout location of the PS specimen for SEM analysis.
2.2. Material To study the foam morphological discrepancy between semi-crystalline and amor-
phous polymers, PP and PS were adopted as the matrix materials. The PP was a Tairipro K1035 semi-crystalline material manufactured by the Formosa Chemicals & Fibre Cor-poration (Changhua County, Taiwan); its ideal melt temperature, mold temperature, and density were 200–290 °C, 30–50 °C, and 0.907 g/cm3, respectively. The general-purpose PS was a PG-33 amorphous material manufactured by the Chi Mei Corporation (Tainan City, Taiwan); its ideal melt temperature, mold temperature, and density were 185–205 °C, 40–70 °C, and 1.042 g/cm3, respectively. The apparent viscosity was measured using a capillary rheometer (CEAST SmartRHEO, Pianezza, Italy).
The CBA employed in this study was an AC exothermic foaming agent (AC-3000F), provided by Union Chemical Industry Company (Taipei City, Taiwan), which typically decomposes at the temperature of 200–206 °C [29], releasing 213–223 cm3/g of N2 through reactions. Because of the narrow range of decomposition temperature, this CBA is easy to control.
Figure 1. (a) Cutout location of the PP specimen for scanning electron microscope (SEM) analysis;(b) cutout location of the PS specimen for SEM analysis.
2.2. Material
To study the foam morphological discrepancy between semi-crystalline and amor-phous polymers, PP and PS were adopted as the matrix materials. The PP was a TairiproK1035 semi-crystalline material manufactured by the Formosa Chemicals & Fibre Corpo-ration (Changhua County, Taiwan); its ideal melt temperature, mold temperature, anddensity were 200–290 ◦C, 30–50 ◦C, and 0.907 g/cm3, respectively. The general-purposePS was a PG-33 amorphous material manufactured by the Chi Mei Corporation (TainanCity, Taiwan); its ideal melt temperature, mold temperature, and density were 185–205 ◦C,40–70 ◦C, and 1.042 g/cm3, respectively. The apparent viscosity was measured using acapillary rheometer (CEAST SmartRHEO, Pianezza, Italy).
The CBA employed in this study was an AC exothermic foaming agent (AC-3000F),provided by Union Chemical Industry Company (Taipei City, Taiwan), which typicallydecomposes at the temperature of 200–206 ◦C [29], releasing 213–223 cm3/g of N2 throughreactions. Because of the narrow range of decomposition temperature, this CBA is easyto control.
2.3. Molding Condition Setting
After the experimental database was created, the CBA foaming module was estab-lished by Moldex3D Company (Hsinchu County, Taiwan). In turn, the CBA foamingmodule of Moldex3D R16 was adopted for injection molding simulation, the result ofwhich was compared with the results of the actual sample created with a short shot.Figure 2 depicts the sample and runner geometries. The material trade names of the PPand PS were defined in the model, and the following experimental process parameters were

Polymers 2021, 13, 2331 5 of 17
set: injection speed of 100 cm3/s, melt temperature of 210 ◦C, mold temperature of 60 ◦C,and CBA dosage of 1 wt%. The rate of formation of bubbles can be described using the cellnucleation model [30], where the threshold of bubble was set as default to 0.1 cm−3·sec−1.The bubble growth behavior model proposed by Han and Yoo was adopted [14], and theshot weight percentage was selected using the shot weight control for a weight reductioneffect identical to that for the product. According to the experimental results, the weightsof the solid parts in the PP and PS samples were 31.349 g and 39.99 g, respectively. Theapparent viscosities of the PP and PS were measured at 210 ◦C (Figure 3). The apparentshear viscosity ηa is defined as Equation (3) [31]. As indicated by Figure 3, the apparentviscosity of the PS is higher than that of the PP.
ηa =τwa.γwa
(3)
τwa is the apparent shear stress at the wall;.γwa is the apparent shear rate at the wall.
Polymers 2021, 13, x FOR PEER REVIEW 5 of 18
2.3. Molding Condition Setting After the experimental database was created, the CBA foaming module was estab-
lished by Moldex3D Company (Hsinchu County, Taiwan). In turn, the CBA foaming module of Moldex3D R16 was adopted for injection molding simulation, the result of which was compared with the results of the actual sample created with a short shot. Figure 2 depicts the sample and runner geometries. The material trade names of the PP and PS were defined in the model, and the following experimental process parameters were set: injection speed of 100 cm3/s, melt temperature of 210 °C, mold temperature of 60 °C, and CBA dosage of 1 wt%. The rate of formation of bubbles can be described using the cell nucleation model [30], where the threshold of bubble was set as default to 0.1 cm−3∙sec−1. The bubble growth behavior model proposed by Han and Yoo was adopted [14], and the shot weight percentage was selected using the shot weight control for a weight reduction effect identical to that for the product. According to the experimental results, the weights of the solid parts in the PP and PS samples were 31.349 g and 39.99 g, respectively. The apparent viscosities of the PP and PS were measured at 210 °C (Figure 3). The apparent shear viscosity aη is defined as Equation (3) [31]. As indicated by Fig-ure 3, the apparent viscosity of the PS is higher than that of the PP.
wa
waa γ
τη
= (3)
waτ is the apparent shear stress at the wall; waγ is the apparent shear rate at the wall.
Figure 2. (a) Model including sample and runner; (b) naming of the sample sides. Figure 2. (a) Model including sample and runner; (b) naming of the sample sides.
Polymers 2021, 13, x FOR PEER REVIEW 6 of 18
Figure 3. Apparent viscosities of PP and PS at 210 °C.
3. Experimental Design Process parameters are key factors affecting the properties of injection molded parts.
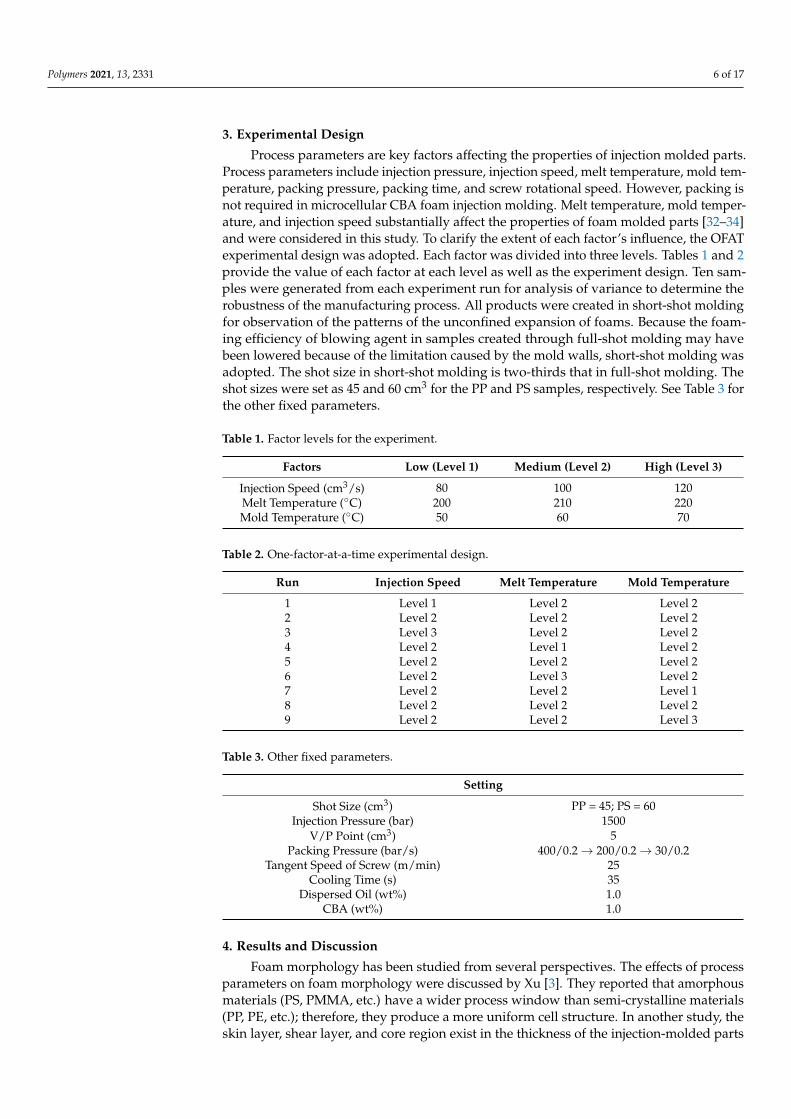
Process parameters include injection pressure, injection speed, melt temperature, mold temperature, packing pressure, packing time, and screw rotational speed. However, packing is not required in microcellular CBA foam injection molding. Melt temperature, mold temperature, and injection speed substantially affect the properties of foam molded parts [32–34] and were considered in this study. To clarify the extent of each factor’s in-fluence, the OFAT experimental design was adopted. Each factor was divided into three levels. Tables 1 and 2 provide the value of each factor at each level as well as the exper-iment design. Ten samples were generated from each experiment run for analysis of variance to determine the robustness of the manufacturing process. All products were created in short-shot molding for observation of the patterns of the unconfined expansion of foams. Because the foaming efficiency of blowing agent in samples created through full-shot molding may have been lowered because of the limitation caused by the mold walls, short-shot molding was adopted. The shot size in short-shot molding is two-thirds that in full-shot molding. The shot sizes were set as 45 and 60 cm3 for the PP and PS samples, respectively. See Table 3 for the other fixed parameters.
Table 1. Factor levels for the experiment.
Factors Low (Level 1) Medium (Level 2) High (Level 3) Injection Speed (cm3/s) 80 100 120 Melt Temperature (°C) 200 210 220 Mold Temperature (°C) 50 60 70
Figure 3. Apparent viscosities of PP and PS at 210 ◦C.
Polymers 2021, 13, 2331 6 of 17
3. Experimental Design
Process parameters are key factors affecting the properties of injection molded parts.Process parameters include injection pressure, injection speed, melt temperature, mold tem-perature, packing pressure, packing time, and screw rotational speed. However, packing isnot required in microcellular CBA foam injection molding. Melt temperature, mold temper-ature, and injection speed substantially affect the properties of foam molded parts [32–34]and were considered in this study. To clarify the extent of each factor’s influence, the OFATexperimental design was adopted. Each factor was divided into three levels. Tables 1 and 2provide the value of each factor at each level as well as the experiment design. Ten sam-ples were generated from each experiment run for analysis of variance to determine therobustness of the manufacturing process. All products were created in short-shot moldingfor observation of the patterns of the unconfined expansion of foams. Because the foam-ing efficiency of blowing agent in samples created through full-shot molding may havebeen lowered because of the limitation caused by the mold walls, short-shot molding wasadopted. The shot size in short-shot molding is two-thirds that in full-shot molding. Theshot sizes were set as 45 and 60 cm3 for the PP and PS samples, respectively. See Table 3 forthe other fixed parameters.
Table 1. Factor levels for the experiment.
Factors Low (Level 1) Medium (Level 2) High (Level 3)
Injection Speed (cm3/s) 80 100 120Melt Temperature (◦C) 200 210 220Mold Temperature (◦C) 50 60 70
Table 2. One-factor-at-a-time experimental design.
Run Injection Speed Melt Temperature Mold Temperature
1 Level 1 Level 2 Level 22 Level 2 Level 2 Level 23 Level 3 Level 2 Level 24 Level 2 Level 1 Level 25 Level 2 Level 2 Level 26 Level 2 Level 3 Level 27 Level 2 Level 2 Level 18 Level 2 Level 2 Level 29 Level 2 Level 2 Level 3
Table 3. Other fixed parameters.
Setting
Shot Size (cm3) PP = 45; PS = 60Injection Pressure (bar) 1500
V/P Point (cm3) 5Packing Pressure (bar/s) 400/0.2→ 200/0.2→ 30/0.2
Tangent Speed of Screw (m/min) 25Cooling Time (s) 35
Dispersed Oil (wt%) 1.0CBA (wt%) 1.0
4. Results and Discussion
Foam morphology has been studied from several perspectives. The effects of processparameters on foam morphology were discussed by Xu [3]. They reported that amorphousmaterials (PS, PMMA, etc.) have a wider process window than semi-crystalline materials(PP, PE, etc.); therefore, they produce a more uniform cell structure. In another study, theskin layer, shear layer, and core region exist in the thickness of the injection-molded parts

Polymers 2021, 13, 2331 7 of 17
due to the characteristics of the injection molding process. The maximum shear rate (shearstress) occurred at 1/10 thickness under the skin layer of a sample [35].
4.1. Melt-Front Comparison of Simulated and Experimental Results
The model parameters used to compare the simulated results with the experimentalresults were those of the medium-level process (i.e., 100 cm3/s injection speed, 210 ◦C melttemperature, and 60 ◦C mold temperature). The melt front revealed a similarity betweenthe simulated and experimental results in flows (Figure 4). The flow length was measuredfrom the center of the box base (gating location) to the center of the short-shot side. Theflow length on each side was quantified for comparison (Figure 5). The error in the flowlengths of the shorter sides (i.e., sides I and III) in the PP sample was 26.24%; those inthe flow lengths of the longer sides (i.e., sides II and IV) was 11.51%. The error in theflow lengths of the shorter sides (i.e., side I and III) in the PS sample was 9.26%. Boththe simulated and experimental results for the flow lengths of the longer sides of the PSsample (i.e., sides II and IV) reached the margin of 90 mm. The discrepancy of the flowlength on sides I/III and II/IV was caused by the mold precision and gravity (the moldwas positioned on the machine such that the longer side was vertical to the ground level).The actual wall thickness was not uniform on each side; however, uniform thickness wasassumed in the simulation. Greater wall thickness resulted in longer flow length.
Polymers 2021, 13, x FOR PEER REVIEW 8 of 18
Figure 4. Simulated and experimental results using medium-level process parameters (i.e., 100 cm3/s injection speed, 210 °C melt temperature, and 60 °C mold temperature): (a) simulated result for the PP sample, (b) actual experimental result for the PP sample, (c) simulated result for the PS sample, (d) actual experimental result for the PS sample.
Figure 5. Experimental and simulated flow lengths for medium-level parameters in the process: (a) PP matrix and AC CBA; (b) PS matrix and AC CBA.
4.2. Effect of Injection Speed According to Chen et al. [36], a higher shear rate causes an increased melt temper-
ature due to shear heating, thus promoting cell nucleation and decreasing viscosity in PS melt. In turn, higher shear stress (shear rate) leads to favorable cell nucleation. As shown in Table 4 and Figure 6b, the weight and specific weight of the PS sample decreased sig-nificantly as the injection speed increased, whereas no significant deviation was noted in those of the PP samples among the three levels of injection speed. These PP foam results are in agreement with the results for the PET foam studied by Gómez-Gómez et al. [37]. According to their report, a higher injection speed resulted in larger cores [37]. A high injection speed causes high shear heating, which occurs under the skin layer, thus in-ducing a large region of core [35]. Among other reasons, PP is a semi-crystalline material, whereas PS is an amorphous material. PP exhibits higher specific heat than PS does; therefore, shear heating caused by an increase in the injection speed leads to an insignif-icant change in the PP temperature. Hence, it is insufficient to cause the blowing agent to decompose violently. Moreover, because PS exhibits higher viscosity (Figure 3) than PP does, PS receives higher shear stress than PP does at equal injection speed. As illustrated
Figure 4. Simulated and experimental results using medium-level process parameters (i.e., 100 cm3/s injection speed,210 ◦C melt temperature, and 60 ◦C mold temperature): (a) simulated result for the PP sample, (b) actual experimentalresult for the PP sample, (c) simulated result for the PS sample, (d) actual experimental result for the PS sample.

Polymers 2021, 13, 2331 8 of 17
Polymers 2021, 13, x FOR PEER REVIEW 8 of 18
Figure 4. Simulated and experimental results using medium-level process parameters (i.e., 100 cm3/s injection speed, 210 °C melt temperature, and 60 °C mold temperature): (a) simulated result for the PP sample, (b) actual experimental result for the PP sample, (c) simulated result for the PS sample, (d) actual experimental result for the PS sample.
Figure 5. Experimental and simulated flow lengths for medium-level parameters in the process: (a) PP matrix and AC CBA; (b) PS matrix and AC CBA.
4.2. Effect of Injection Speed According to Chen et al. [36], a higher shear rate causes an increased melt temper-
ature due to shear heating, thus promoting cell nucleation and decreasing viscosity in PS melt. In turn, higher shear stress (shear rate) leads to favorable cell nucleation. As shown in Table 4 and Figure 6b, the weight and specific weight of the PS sample decreased sig-nificantly as the injection speed increased, whereas no significant deviation was noted in those of the PP samples among the three levels of injection speed. These PP foam results are in agreement with the results for the PET foam studied by Gómez-Gómez et al. [37]. According to their report, a higher injection speed resulted in larger cores [37]. A high injection speed causes high shear heating, which occurs under the skin layer, thus in-ducing a large region of core [35]. Among other reasons, PP is a semi-crystalline material, whereas PS is an amorphous material. PP exhibits higher specific heat than PS does; therefore, shear heating caused by an increase in the injection speed leads to an insignif-icant change in the PP temperature. Hence, it is insufficient to cause the blowing agent to decompose violently. Moreover, because PS exhibits higher viscosity (Figure 3) than PP does, PS receives higher shear stress than PP does at equal injection speed. As illustrated
Figure 5. Experimental and simulated flow lengths for medium-level parameters in the process: (a) PP matrix and AC CBA;(b) PS matrix and AC CBA.
4.2. Effect of Injection Speed
According to Chen et al. [36], a higher shear rate causes an increased melt temperaturedue to shear heating, thus promoting cell nucleation and decreasing viscosity in PS melt. Inturn, higher shear stress (shear rate) leads to favorable cell nucleation. As shown in Table 4and Figure 6b, the weight and specific weight of the PS sample decreased significantly asthe injection speed increased, whereas no significant deviation was noted in those of the PPsamples among the three levels of injection speed. These PP foam results are in agreementwith the results for the PET foam studied by Gómez-Gómez et al. [37]. According totheir report, a higher injection speed resulted in larger cores [37]. A high injection speedcauses high shear heating, which occurs under the skin layer, thus inducing a large regionof core [35]. Among other reasons, PP is a semi-crystalline material, whereas PS is anamorphous material. PP exhibits higher specific heat than PS does; therefore, shear heatingcaused by an increase in the injection speed leads to an insignificant change in the PPtemperature. Hence, it is insufficient to cause the blowing agent to decompose violently.Moreover, because PS exhibits higher viscosity (Figure 3) than PP does, PS receives highershear stress than PP does at equal injection speed. As illustrated in Figure 7, at equalinjection speed, the PS sample exhibited a higher expansion ratio than the PP sample did.
Table 4. Macroscopic effects of injection speed on weight, specific weight, and expansion ratio.
Polypropylene
Injection Speed(cm3/s) 80 100 120
Weight (g) 31.55 (±0.048) 31.56 (±0.008) 31.58 (±0.007)
Specific Weight 0.805 (±0.002) 0.807 (±0.003) 0.810 (±0.003)
Expansion Ratio 1.126 (±0.002) 1.123 (±0.003) 1.119 (±0.004)
Polystyrene
Injection Speed(cm3/s) 80 100 120
Weight (g) 48.82 (±0.586) 48.94 (±0.413) 47.65 (±1.418)
Specific Weight 0.918 (±0.020) 0.923 (±0.019) 0.890 (±0.013)
Expansion Ratio 1.133 (±0.024) 1.127 (±0.022) 1.169 (±0.017)

Polymers 2021, 13, 2331 9 of 17
Polymers 2021, 13, x FOR PEER REVIEW 9 of 18
in Figure 7, at equal injection speed, the PS sample exhibited a higher expansion ratio than the PP sample did.
Table 4. Macroscopic effects of injection speed on weight, specific weight, and expansion ratio.
Polypropylene Injection Speed (cm3/s) 80 100 120
Weight (g) 31.55 (±0.048) 31.56 (±0.008) 31.58 (±0.007) Specific Weight 0.805 (±0.002) 0.807 (±0.003) 0.810 (±0.003) Expansion Ratio 1.126 (±0.002) 1.123 (±0.003) 1.119 (±0.004)
Polystyrene Injection Speed (cm3/s) 80 100 120
Weight (g) 48.82 (±0.586) 48.94 (±0.413) 47.65 (±1.418) Specific Weight 0.918 (±0.020) 0.923 (±0.019) 0.890 (±0.013) Expansion Ratio 1.133 (±0.024) 1.127 (±0.022) 1.169 (±0.017)
Figure 6. Weights and specific weights at different injection speeds: (a) PP matrix and AC CBA; (b) PS matrix and AC CBA.
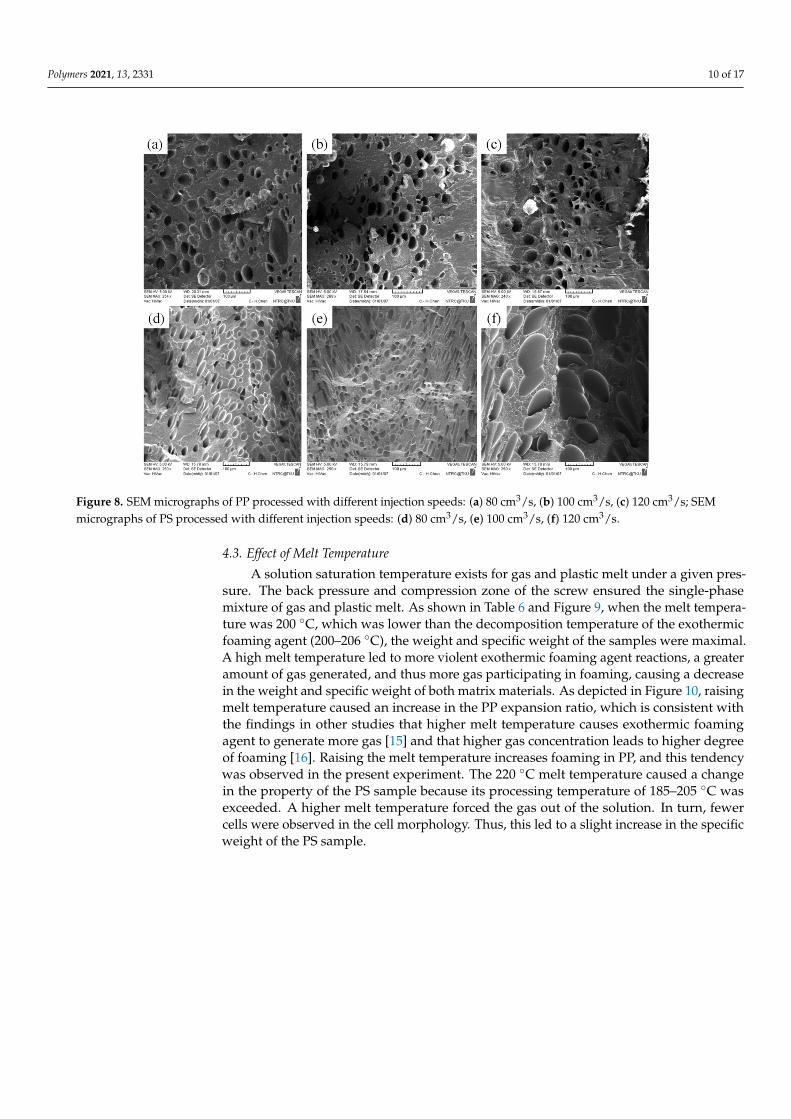
No significant macroscopic change was detected in the weight of the PP sample. As for at the microscopic level (Figure 8b,c), injection speed did not affect the cell density or cell size significantly (Table 5). Chen et al. [36] claimed that the cell density is signifi-cantly affected by shear stress nucleation resulting from the transformation of mechanical shear energy into surface energy. Our PS sample exhibited more favorable foaming at a higher injection speed; however, the cell morphology changed from closed to coalesced, as depicted in Figure 8f. Accordingly, although increasing injection speed promotes foam nucleation and growth, excessively rapid expansion causes open-cell structure, lowering the overall cell density (Table 5). Higher injection speed leads to higher expansion ratio. This is in consistent with findings by Chen et al. [36].
Figure 6. Weights and specific weights at different injection speeds: (a) PP matrix and AC CBA; (b) PS matrix and AC CBA.
Polymers 2021, 13, x FOR PEER REVIEW 10 of 18
Figure 7. Expansion ratios at various injection speeds: (a) PP matrix and AC CBA; (b) PS matrix and AC CBA.
Table 5. Microscopic effects of injection speed on the PP and PS cells as observed through the SEM.
Polypropylene Injection Speed (cm3/s) 80 100 120
Cell Density (1/cc) 5.893 × 10 1.132 × 10 8.609 × 10 Cell Diameter (µm) 42.434 32.887 40.292
Polystyrene Injection Speed (cm3/s) 80 100 120
Cell Density (1/cc) 1.801 × 10 4.055 × 10 2.098 × 10 Cell Diameter (µm) 39.041 32.337 95.469
Figure 8. SEM micrographs of PP processed with different injection speeds: (a) 80 cm3/s, (b) 100 cm3/s, (c) 120 cm3/s; SEM micrographs of PS processed with different injection speeds: (d) 80 cm3/s, (e) 100 cm3/s, (f) 120 cm3/s.
Figure 7. Expansion ratios at various injection speeds: (a) PP matrix and AC CBA; (b) PS matrix and AC CBA.
No significant macroscopic change was detected in the weight of the PP sample. Asfor at the microscopic level (Figure 8b,c), injection speed did not affect the cell density orcell size significantly (Table 5). Chen et al. [36] claimed that the cell density is significantlyaffected by shear stress nucleation resulting from the transformation of mechanical shearenergy into surface energy. Our PS sample exhibited more favorable foaming at a higher in-jection speed; however, the cell morphology changed from closed to coalesced, as depictedin Figure 8f. Accordingly, although increasing injection speed promotes foam nucleationand growth, excessively rapid expansion causes open-cell structure, lowering the overallcell density (Table 5). Higher injection speed leads to higher expansion ratio. This is inconsistent with findings by Chen et al. [36].
Table 5. Microscopic effects of injection speed on the PP and PS cells as observed through the SEM.
Polypropylene
Injection Speed (cm3/s) 80 100 120
Cell Density (1/cc) 5.893× 10⁶ 1.132× 10⁷ 8.609× 10⁶
Cell Diameter (µm) 42.434 32.887 40.292
Polystyrene
Injection Speed (cm3/s) 80 100 120
Cell Density (1/cc) 1.801× 10⁷ 4.055× 10⁷ 2.098× 10⁶
Cell Diameter (µm) 39.041 32.337 95.469
Polymers 2021, 13, 2331 10 of 17
Polymers 2021, 13, x FOR PEER REVIEW 10 of 18
Figure 7. Expansion ratios at various injection speeds: (a) PP matrix and AC CBA; (b) PS matrix and AC CBA.
Table 5. Microscopic effects of injection speed on the PP and PS cells as observed through the SEM.
Polypropylene Injection Speed (cm3/s) 80 100 120
Cell Density (1/cc) 5.893 × 10 1.132 × 10 8.609 × 10 Cell Diameter (µm) 42.434 32.887 40.292
Polystyrene Injection Speed (cm3/s) 80 100 120
Cell Density (1/cc) 1.801 × 10 4.055 × 10 2.098 × 10 Cell Diameter (µm) 39.041 32.337 95.469
Figure 8. SEM micrographs of PP processed with different injection speeds: (a) 80 cm3/s, (b) 100 cm3/s, (c) 120 cm3/s; SEM micrographs of PS processed with different injection speeds: (d) 80 cm3/s, (e) 100 cm3/s, (f) 120 cm3/s.
Figure 8. SEM micrographs of PP processed with different injection speeds: (a) 80 cm3/s, (b) 100 cm3/s, (c) 120 cm3/s; SEMmicrographs of PS processed with different injection speeds: (d) 80 cm3/s, (e) 100 cm3/s, (f) 120 cm3/s.
4.3. Effect of Melt Temperature
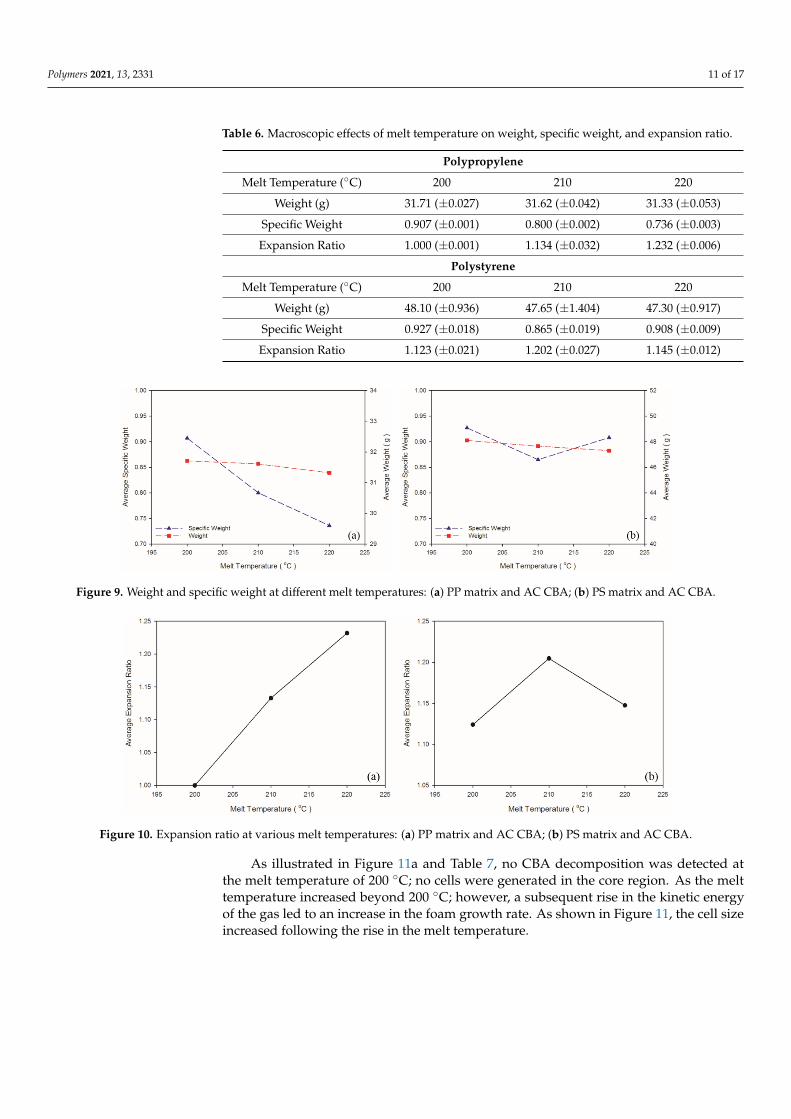
A solution saturation temperature exists for gas and plastic melt under a given pres-sure. The back pressure and compression zone of the screw ensured the single-phasemixture of gas and plastic melt. As shown in Table 6 and Figure 9, when the melt tempera-ture was 200 ◦C, which was lower than the decomposition temperature of the exothermicfoaming agent (200–206 ◦C), the weight and specific weight of the samples were maximal.A high melt temperature led to more violent exothermic foaming agent reactions, a greateramount of gas generated, and thus more gas participating in foaming, causing a decreasein the weight and specific weight of both matrix materials. As depicted in Figure 10, raisingmelt temperature caused an increase in the PP expansion ratio, which is consistent withthe findings in other studies that higher melt temperature causes exothermic foamingagent to generate more gas [15] and that higher gas concentration leads to higher degreeof foaming [16]. Raising the melt temperature increases foaming in PP, and this tendencywas observed in the present experiment. The 220 ◦C melt temperature caused a changein the property of the PS sample because its processing temperature of 185–205 ◦C wasexceeded. A higher melt temperature forced the gas out of the solution. In turn, fewercells were observed in the cell morphology. Thus, this led to a slight increase in the specificweight of the PS sample.
Polymers 2021, 13, 2331 11 of 17
Table 6. Macroscopic effects of melt temperature on weight, specific weight, and expansion ratio.
Polypropylene
Melt Temperature (◦C) 200 210 220
Weight (g) 31.71 (±0.027) 31.62 (±0.042) 31.33 (±0.053)
Specific Weight 0.907 (±0.001) 0.800 (±0.002) 0.736 (±0.003)
Expansion Ratio 1.000 (±0.001) 1.134 (±0.032) 1.232 (±0.006)
Polystyrene
Melt Temperature (◦C) 200 210 220
Weight (g) 48.10 (±0.936) 47.65 (±1.404) 47.30 (±0.917)
Specific Weight 0.927 (±0.018) 0.865 (±0.019) 0.908 (±0.009)
Expansion Ratio 1.123 (±0.021) 1.202 (±0.027) 1.145 (±0.012)
Polymers 2021, 13, x FOR PEER REVIEW 11 of 18
4.3. Effect of Melt Temperature A solution saturation temperature exists for gas and plastic melt under a given
pressure. The back pressure and compression zone of the screw ensured the single-phase mixture of gas and plastic melt. As shown in Table 6 and Figure 9, when the melt tem-perature was 200 °C, which was lower than the decomposition temperature of the exo-thermic foaming agent (200–206 °C), the weight and specific weight of the samples were maximal. A high melt temperature led to more violent exothermic foaming agent reac-tions, a greater amount of gas generated, and thus more gas participating in foaming, causing a decrease in the weight and specific weight of both matrix materials. As de-picted in Figure 10, raising melt temperature caused an increase in the PP expansion ra-tio, which is consistent with the findings in other studies that higher melt temperature causes exothermic foaming agent to generate more gas [15] and that higher gas concen-tration leads to higher degree of foaming [16]. Raising the melt temperature increases foaming in PP, and this tendency was observed in the present experiment. The 220 °C melt temperature caused a change in the property of the PS sample because its processing temperature of 185–205 °C was exceeded. A higher melt temperature forced the gas out of the solution. In turn, fewer cells were observed in the cell morphology. Thus, this led to a slight increase in the specific weight of the PS sample.
Table 6. Macroscopic effects of melt temperature on weight, specific weight, and expansion ratio.
Polypropylene Melt Temperature (°C) 200 210 220
Weight (g) 31.71 (±0.027) 31.62 (±0.042) 31.33 (±0.053) Specific Weight 0.907 (±0.001) 0.800 (±0.002) 0.736 (±0.003) Expansion Ratio 1.000 (±0.001) 1.134 (±0.032) 1.232 (±0.006)
Polystyrene Melt Temperature (°C) 200 210 220
Weight (g) 48.10 (±0.936) 47.65 (±1.404) 47.30 (±0.917) Specific Weight 0.927 (±0.018) 0.865 (±0.019) 0.908 (±0.009) Expansion Ratio 1.123 (±0.021) 1.202 (±0.027) 1.145 (±0.012)
Figure 9. Weight and specific weight at different melt temperatures: (a) PP matrix and AC CBA; (b) PS matrix and AC CBA. Figure 9. Weight and specific weight at different melt temperatures: (a) PP matrix and AC CBA; (b) PS matrix and AC CBA.
Polymers 2021, 13, x FOR PEER REVIEW 12 of 18
Figure 10. Expansion ratio at various melt temperatures: (a) PP matrix and AC CBA; (b) PS matrix and AC CBA.
As illustrated in Figure 11a and Table 7, no CBA decomposition was detected at the melt temperature of 200 °C; no cells were generated in the core region. As the melt tem-perature increased beyond 200 °C; however, a subsequent rise in the kinetic energy of the gas led to an increase in the foam growth rate. As shown in Figure 11, the cell size in-creased following the rise in the melt temperature.
Table 7. Microscopic effects of melt temperature on the PP and PS cells as observed through the SEM.
Polypropylene Melt Temperature (°C) 200 210 220
Cell Density (1/cc) N/A 7.759 × 10 7.242 × 10 Cell Diameter (µm) N/A 41.980 47.927
Polystyrene Melt Temperature (°C) 200 210 220
Cell Density (1/cc) 3.918 × 10 1.756 × 10 7.271 × 10 Cell Diameter (µm) 27.057 57.444 130.113
Figure 10. Expansion ratio at various melt temperatures: (a) PP matrix and AC CBA; (b) PS matrix and AC CBA.
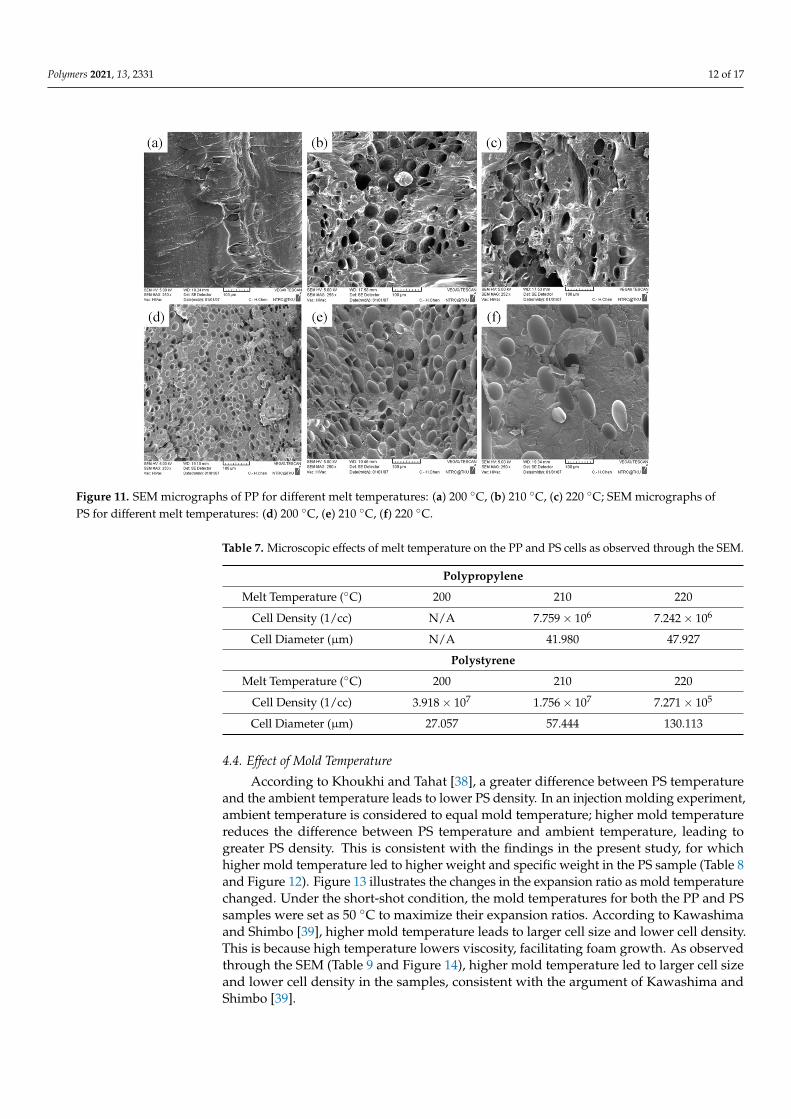
As illustrated in Figure 11a and Table 7, no CBA decomposition was detected atthe melt temperature of 200 ◦C; no cells were generated in the core region. As the melttemperature increased beyond 200 ◦C; however, a subsequent rise in the kinetic energyof the gas led to an increase in the foam growth rate. As shown in Figure 11, the cell sizeincreased following the rise in the melt temperature.
Polymers 2021, 13, 2331 12 of 17Polymers 2021, 13, x FOR PEER REVIEW 13 of 18
Figure 11. SEM micrographs of PP for different melt temperatures: (a) 200 °C, (b) 210 °C, (c) 220 °C; SEM micrographs of PS for different melt temperatures: (d) 200 °C, (e) 210 °C, (f) 220 °C.
4.4. Effect of Mold Temperature According to Khoukhi and Tahat [38], a greater difference between PS temperature
and the ambient temperature leads to lower PS density. In an injection molding experi-ment, ambient temperature is considered to equal mold temperature; higher mold tem-perature reduces the difference between PS temperature and ambient temperature, leading to greater PS density. This is consistent with the findings in the present study, for which higher mold temperature led to higher weight and specific weight in the PS sam-ple (Table 8 and Figure 12). Figure 13 illustrates the changes in the expansion ratio as mold temperature changed. Under the short-shot condition, the mold temperatures for both the PP and PS samples were set as 50 °C to maximize their expansion ratios. Ac-cording to Kawashima and Shimbo [39], higher mold temperature leads to larger cell size and lower cell density. This is because high temperature lowers viscosity, facilitat-ing foam growth. As observed through the SEM (Table 9 and Figure 14), higher mold temperature led to larger cell size and lower cell density in the samples, consistent with the argument of Kawashima and Shimbo [39].
Figure 11. SEM micrographs of PP for different melt temperatures: (a) 200 ◦C, (b) 210 ◦C, (c) 220 ◦C; SEM micrographs ofPS for different melt temperatures: (d) 200 ◦C, (e) 210 ◦C, (f) 220 ◦C.
Table 7. Microscopic effects of melt temperature on the PP and PS cells as observed through the SEM.
Polypropylene
Melt Temperature (◦C) 200 210 220
Cell Density (1/cc) N/A 7.759× 10⁶ 7.242× 10⁶
Cell Diameter (µm) N/A 41.980 47.927
Polystyrene
Melt Temperature (◦C) 200 210 220
Cell Density (1/cc) 3.918× 10⁷ 1.756× 10⁷ 7.271× 10⁵
Cell Diameter (µm) 27.057 57.444 130.113
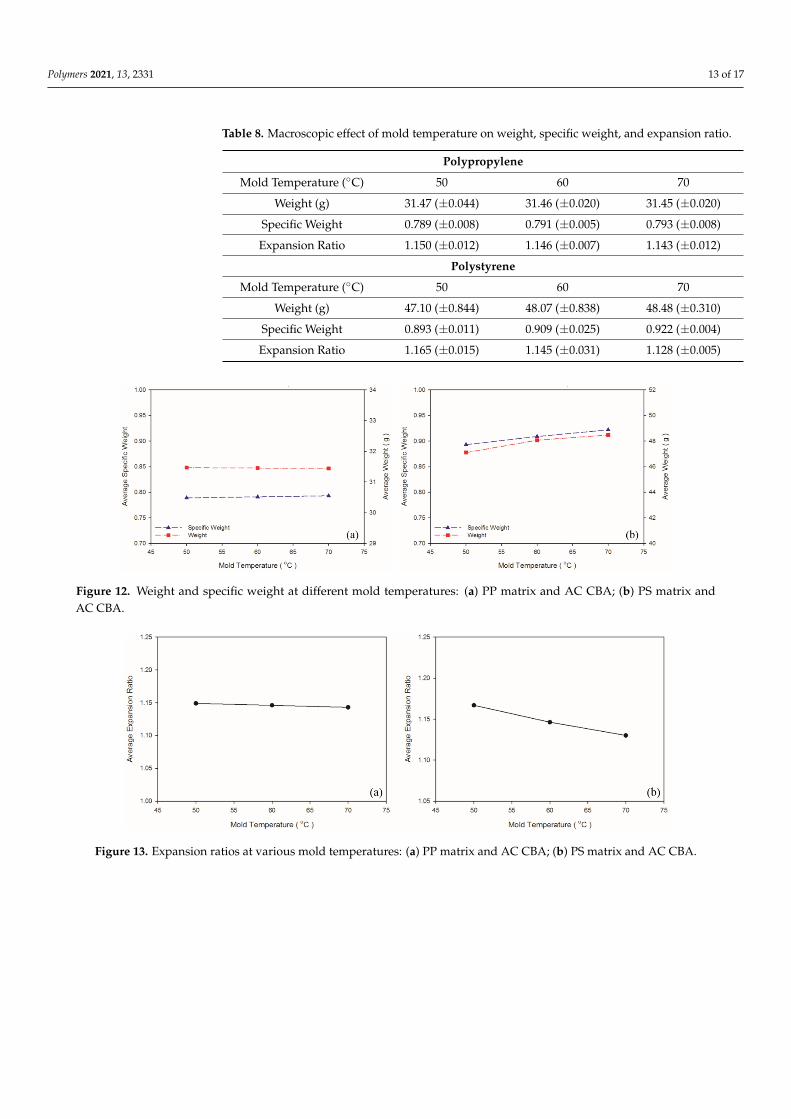
4.4. Effect of Mold Temperature
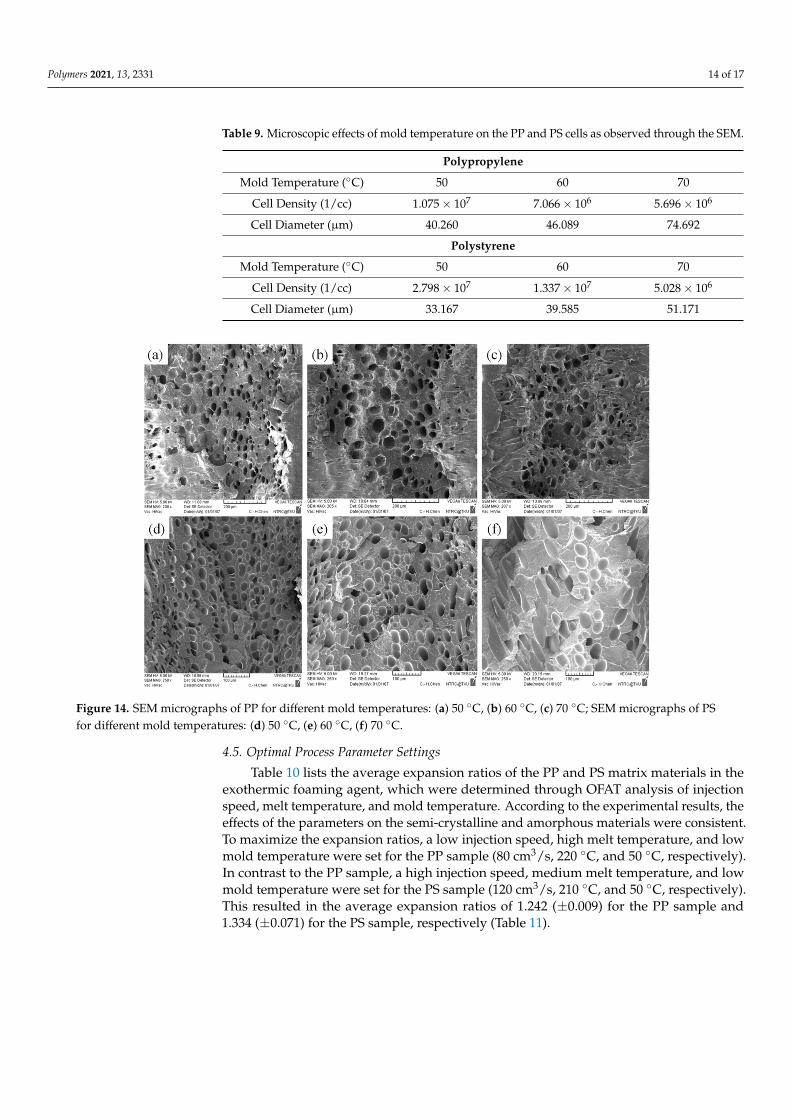
According to Khoukhi and Tahat [38], a greater difference between PS temperatureand the ambient temperature leads to lower PS density. In an injection molding experiment,ambient temperature is considered to equal mold temperature; higher mold temperaturereduces the difference between PS temperature and ambient temperature, leading togreater PS density. This is consistent with the findings in the present study, for whichhigher mold temperature led to higher weight and specific weight in the PS sample (Table 8and Figure 12). Figure 13 illustrates the changes in the expansion ratio as mold temperaturechanged. Under the short-shot condition, the mold temperatures for both the PP and PSsamples were set as 50 ◦C to maximize their expansion ratios. According to Kawashimaand Shimbo [39], higher mold temperature leads to larger cell size and lower cell density.This is because high temperature lowers viscosity, facilitating foam growth. As observedthrough the SEM (Table 9 and Figure 14), higher mold temperature led to larger cell sizeand lower cell density in the samples, consistent with the argument of Kawashima andShimbo [39].
Polymers 2021, 13, 2331 13 of 17
Table 8. Macroscopic effect of mold temperature on weight, specific weight, and expansion ratio.
Polypropylene
Mold Temperature (◦C) 50 60 70
Weight (g) 31.47 (±0.044) 31.46 (±0.020) 31.45 (±0.020)
Specific Weight 0.789 (±0.008) 0.791 (±0.005) 0.793 (±0.008)
Expansion Ratio 1.150 (±0.012) 1.146 (±0.007) 1.143 (±0.012)
Polystyrene
Mold Temperature (◦C) 50 60 70
Weight (g) 47.10 (±0.844) 48.07 (±0.838) 48.48 (±0.310)
Specific Weight 0.893 (±0.011) 0.909 (±0.025) 0.922 (±0.004)
Expansion Ratio 1.165 (±0.015) 1.145 (±0.031) 1.128 (±0.005)
Polymers 2021, 13, x FOR PEER REVIEW 14 of 18
Table 8. Macroscopic effect of mold temperature on weight, specific weight, and expansion ratio.
Polypropylene Mold Temperature (°C) 50 60 70
Weight (g) 31.47 (±0.044) 31.46 (±0.020) 31.45 (±0.020) Specific Weight 0.789 (±0.008) 0.791 (±0.005) 0.793 (±0.008) Expansion Ratio 1.150 (±0.012) 1.146 (±0.007) 1.143 (±0.012)
Polystyrene Mold Temperature (°C) 50 60 70
Weight (g) 47.10 (±0.844) 48.07 (±0.838) 48.48 (±0.310) Specific Weight 0.893 (±0.011) 0.909 (±0.025) 0.922 (±0.004) Expansion Ratio 1.165 (±0.015) 1.145 (±0.031) 1.128 (±0.005)
Figure 12. Weight and specific weight at different mold temperatures: (a) PP matrix and AC CBA; (b) PS matrix and AC CBA.
Figure 13. Expansion ratios at various mold temperatures: (a) PP matrix and AC CBA; (b) PS matrix and AC CBA.
Table 9. Microscopic effects of mold temperature on the PP and PS cells as observed through the SEM.
Polypropylene Mold Temperature (°C) 50 60 70
Cell Density (1/cc) 1.075 × 10 7.066 × 10 5.696 × 10 Cell Diameter (µm) 40.260 46.089 74.692
Polystyrene Mold Temperature (°C) 50 60 70
Cell Density (1/cc) 2.798 × 10 1.337 × 10 5.028 × 10 Cell Diameter (µm) 33.167 39.585 51.171
Figure 12. Weight and specific weight at different mold temperatures: (a) PP matrix and AC CBA; (b) PS matrix andAC CBA.
Polymers 2021, 13, x FOR PEER REVIEW 14 of 18
Table 8. Macroscopic effect of mold temperature on weight, specific weight, and expansion ratio.
Polypropylene Mold Temperature (°C) 50 60 70
Weight (g) 31.47 (±0.044) 31.46 (±0.020) 31.45 (±0.020) Specific Weight 0.789 (±0.008) 0.791 (±0.005) 0.793 (±0.008) Expansion Ratio 1.150 (±0.012) 1.146 (±0.007) 1.143 (±0.012)
Polystyrene Mold Temperature (°C) 50 60 70
Weight (g) 47.10 (±0.844) 48.07 (±0.838) 48.48 (±0.310) Specific Weight 0.893 (±0.011) 0.909 (±0.025) 0.922 (±0.004) Expansion Ratio 1.165 (±0.015) 1.145 (±0.031) 1.128 (±0.005)
Figure 12. Weight and specific weight at different mold temperatures: (a) PP matrix and AC CBA; (b) PS matrix and AC CBA.
Figure 13. Expansion ratios at various mold temperatures: (a) PP matrix and AC CBA; (b) PS matrix and AC CBA.
Table 9. Microscopic effects of mold temperature on the PP and PS cells as observed through the SEM.
Polypropylene Mold Temperature (°C) 50 60 70
Cell Density (1/cc) 1.075 × 10 7.066 × 10 5.696 × 10 Cell Diameter (µm) 40.260 46.089 74.692
Polystyrene Mold Temperature (°C) 50 60 70
Cell Density (1/cc) 2.798 × 10 1.337 × 10 5.028 × 10 Cell Diameter (µm) 33.167 39.585 51.171
Figure 13. Expansion ratios at various mold temperatures: (a) PP matrix and AC CBA; (b) PS matrix and AC CBA.
Polymers 2021, 13, 2331 14 of 17
Table 9. Microscopic effects of mold temperature on the PP and PS cells as observed through the SEM.
Polypropylene
Mold Temperature (◦C) 50 60 70
Cell Density (1/cc) 1.075× 10⁷ 7.066× 10⁶ 5.696× 10⁶
Cell Diameter (µm) 40.260 46.089 74.692
Polystyrene
Mold Temperature (◦C) 50 60 70
Cell Density (1/cc) 2.798× 10⁷ 1.337× 10⁷ 5.028× 10⁶
Cell Diameter (µm) 33.167 39.585 51.171
Polymers 2021, 13, x FOR PEER REVIEW 15 of 18
Figure 14. SEM micrographs of PP for different mold temperatures: (a) 50 °C, (b) 60 °C, (c) 70 °C; SEM micrographs of PS for different mold temperatures: (d) 50 °C, (e) 60 °C, (f) 70 °C.
4.5. Optimal Process Parameter Settings Table 10 lists the average expansion ratios of the PP and PS matrix materials in the
exothermic foaming agent, which were determined through OFAT analysis of injection speed, melt temperature, and mold temperature. According to the experimental results, the effects of the parameters on the semi-crystalline and amorphous materials were con-sistent. To maximize the expansion ratios, a low injection speed, high melt temperature, and low mold temperature were set for the PP sample (80 cm3/s, 220 °C, and 50 °C, re-spectively). In contrast to the PP sample, a high injection speed, medium melt tempera-ture, and low mold temperature were set for the PS sample (120 cm3/s, 210 °C, and 50 °C, respectively). This resulted in the average expansion ratios of 1.242 (±0.009) for the PP sample and 1.334 (±0.071) for the PS sample, respectively (Table 11).
Table 10. Average expansion ratios according to OFAT parameter settings.
Average expansion ratio of polypropylene Levels
Low Medium High Parameters
Injection speed (cm3/s) 1.126 1.123 1.119 Melt temperature (°C) 1.000 1.134 1.232 Mold temperature (°C) 1.150 1.146 1.143
Average expansion ratio of polystyrene Levels
Low Medium High Parameters
Injection speed (cm3/s) 1.133 1.127 1.169 Melt temperature (°C) 1.123 1.202 1.145 Mold temperature (°C) 1.165 1.145 1.128
Figure 14. SEM micrographs of PP for different mold temperatures: (a) 50 ◦C, (b) 60 ◦C, (c) 70 ◦C; SEM micrographs of PSfor different mold temperatures: (d) 50 ◦C, (e) 60 ◦C, (f) 70 ◦C.
4.5. Optimal Process Parameter Settings
Table 10 lists the average expansion ratios of the PP and PS matrix materials in theexothermic foaming agent, which were determined through OFAT analysis of injectionspeed, melt temperature, and mold temperature. According to the experimental results, theeffects of the parameters on the semi-crystalline and amorphous materials were consistent.To maximize the expansion ratios, a low injection speed, high melt temperature, and lowmold temperature were set for the PP sample (80 cm3/s, 220 ◦C, and 50 ◦C, respectively).In contrast to the PP sample, a high injection speed, medium melt temperature, and lowmold temperature were set for the PS sample (120 cm3/s, 210 ◦C, and 50 ◦C, respectively).This resulted in the average expansion ratios of 1.242 (±0.009) for the PP sample and1.334 (±0.071) for the PS sample, respectively (Table 11).

Polymers 2021, 13, 2331 15 of 17
Table 10. Average expansion ratios according to OFAT parameter settings.
Average expansion ratio of polypropylene
LevelsLow Medium High
Parameters
Injection speed (cm3/s) 1.126 1.123 1.119
Melt temperature (◦C) 1.000 1.134 1.232
Mold temperature (◦C) 1.150 1.146 1.143
Average expansion ratio of polystyrene
LevelsLow Medium High
Parameters
Injection speed (cm3/s) 1.133 1.127 1.169
Melt temperature (◦C) 1.123 1.202 1.145
Mold temperature (◦C) 1.165 1.145 1.128
Table 11. Expansion ratios with the optimal process parameter settings.
Materials Parameters Expansion Ratio
PPInjection Speed 80 cm3/s
1.242 (±0.009)Melt Temperature 220 ◦CMold Temperature 50 ◦C
PSInjection Speed 120 cm3/s
1.334 (±0.071)Melt Temperature 210 ◦CMold Temperature 50 ◦C
5. Conclusions
Table 10 lists the average expansion ratios as obtained through the OFAT experimentaldesign. Overall, the expansion ratio of the PS sample was higher than that of the PP sample.This was because PS is an amorphous material, and its specific volume is not considerablyaffected by temperature or pressure, thereby providing foams with sufficient space toexpand. Furthermore, because PS exhibits a higher viscosity than PP does, PS is moreeasily affected by shear stress than PP. In summary, PS exhibits a higher expansion ratioand cell density than PP does.
The cell density data obtained in the present study were compared with those acquiredby Guo et al. [17], revealing that all the cell density values fell within the 107 cc−1 range.Guo et al. [17] applied both nanocomposits and an exothermic CBA (AC-3000F) to increasefoaming efficiency. In the present study, only pure PP was used. Because the nonpolarmolecules of PP are not grafted, its miscibility with other polymers was poor. Therefore, atsome of the manufacturing parameter settings, the cell density in the present study waslower than that in the findings by Guo et al. [17].
In the OFAT experimental design, optimal parameters were determined for the selectedmatrix materials, and higher expansion ratios were obtained than those in the experimentalplanning (Table 10). The expansion ratios of PP and PS increased by 6.25% and 13.15%,respectively, verifying that OFAT parameter optimization effectively improved the qualityof the foaming products.
This study employed the short-shot approach to examine the effect of various manu-facturing parameters on the foaming phenomenon. Under the short-shot condition, themelt front was not limited by the mold walls. The simulated and experimental flow lengthswere compared to verify the accuracy of the simulations, and the comparison revealedthe error between the simulated and experimental results to be ≤30%. In future studiesfocusing on the full-shot condition, simulated data on volumetric shrinkage, weight, andcell density can be compared with experimental data. The use of the OFAT experimental
Polymers 2021, 13, 2331 16 of 17
design is generally discouraged by experts in experimental design strategies and qualityimprovement [40]. However, substantial support exists for the proposal that OFAT canbe more effective than orthogonal arrays when the pure experimental error is low or in-teractions between parameter settings are strong [25,26]. Although the OFAT approachreacts more quickly to data, future studies may adopt Taguchi’s orthogonal arrays tosystematically and efficiently adjust control factors or may employ a response surfacemethodology to examine interactions among control factors, thus verifying the reliabilityof the present study.
Author Contributions: Conceptualization, C.-Y.C., S.-S.H. and S.-C.C.; methodology, C.-Y.C. andS.-S.H.; software, C.-Y.C.; validation, C.-Y.C., S.-S.H. and M.-C.L.; formal analysis, C.-Y.C. andM.-C.L.; investigation, C.-Y.C.; resources, C.-Y.C., S.-S.H. and S.-C.C.; data curation, C.-Y.C. andM.-C.L.; writing—original draft preparation, C.-Y.C.; writing—review and editing, C.-Y.C. and S.-S.H.; visualization, C.-Y.C.; supervision, C.-Y.C.; project administration, C.-Y.C.; funding acquisition,C.-Y.C. All authors have read and agreed to the published version of the manuscript.
Funding: This work was partially supported by the Ministry of Science and Technology in Taiwan(grant number MOST 108-2628-E-008-004-MY2). This work was also supported by CoreTech System(Moldex3D) Company Limited. The injection molding simulation software Moldex3D was run underthe academic license with the serial number 29769.
Institutional Review Board Statement: Not applicable.
Informed Consent Statement: Not applicable.
Data Availability Statement: The data presented in this study are available on request from thecorresponding author.
Conflicts of Interest: The authors have no competing financial interests to declare.
References1. Beyer, C.E.; Dahl, R.B. A Method of Molding Expandable Thermoplastic Resinous Beads. U.S. Patent 3058161, 16 October 1962.2. Colton, J.S.; Suh, N.P. Nucleation of microcellular foam: Theory and practice. Polym. Eng. Sci. 1987, 27, 500–503. [CrossRef]3. Xu, J. Microcellular Injecion Molding; John Wiley & Sons: Hoboken, NJ, USA, 2010.4. Park, C.B.; Suh, N.P. Filamentary extrusion of microcellular polymers using a rapid decompressive element. Polym. Eng. Sci.
1996, 36, 34–48. [CrossRef]5. Hwang, S.-S.; Ke, Z.-S. The dimensional stability of a microcellular injection molded gear shaft. Int. Commun. Heat Mass Transf.
2008, 35, 263–275. [CrossRef]6. Cha, S.W.; Suh, N.P.; Baldwin, D.F.; Park, C.B. Microcellular Thermoplastic Foamed with Supercritical Fluid. U.S. Patent 5158986,
27 October 1992.7. Bledzki, A.K.; Faruk, O. Effects of the chemical foaming agents, injection parameters, and melt-flow index on the microstructure
and mechanical properties of microcellular injection-molded wood-fiber/polypropylene composites. J. Appl. Polym. Sci. 2005, 97,1090–1096. [CrossRef]
8. Scholz, D. Development of endothermic chemical foaming/nucleation agents and its processes. In Polymeric Foams: Technologyand Developments in Regulation, Process, and Products; Lee, S.-T., Scholz, D., Eds.; CRC Press: Boca Raton, FL, USA; Taylor & FrancisGroup: Boca Raton, FL, USA, 2009.
9. Wypych, G. Handbook of Foaming and Blowing Agents; ChemTec Publishing: Toronto, ON, Canada, 2017.10. Hong, S.U.; Albouy, A.; Duda, J.L. Transport of blowing agents in polyurethane. J. Appl. Polym. Sci. 2001, 79, 696–702. [CrossRef]11. Kim, D.J.; Kim, S.W.; Kang, H.J.; Seo, K.H. Foaming of aliphatic polyester using chemical blowing agent. J. Appl. Polym. Sci. 2001,
81, 2443–2454. [CrossRef]12. Reglero Ruiz, J.A.; Vincent, M.; Agassant, J.-F.; Sadik, T.; Pillon, C.; Carrot, C. Polymer foaming with chemical blowing agents:
Experiment and modeling. Polym. Eng. Sci. 2015, 55, 2018–2029. [CrossRef]13. Villamizar, C.; Han, C.D. Studies on structural foam processing II. Bubble dynamics in foam injection molding. Polym. Eng. Sci.
1978, 18, 699–710. [CrossRef]14. Han, C.D.; Yoo, H.J. Studies on structural foam processing. IV. Bubble growth during mold filling. Polym. Eng. Sci. 1981, 21,
518–533. [CrossRef]15. Bhatti, A.S.; Dollimore, D.; Goddard, R.; O’Donnell, G. The effects of additives on the thermal decomposition of azodicarbonamide.
Thermochim. Acta 1984, 76, 273–286. [CrossRef]16. Lee, J.W.S.; Wang, J.; Yoon, J.D.; Park, C.B. Strategies to achieve a uniform cell structure with a high void fraction in advanced
structural foam molding. Ind. Eng. Chem. Res. 2008, 47, 9457–9464. [CrossRef]

Polymers 2021, 13, 2331 17 of 17
17. Guo, M.-C.; Heuzey, M.-C.; Carreau, P.J. Cell structure and dynamic properties of injection molded polypropylene foams. Polym.Eng. Sci. 2007, 47, 1070–1081. [CrossRef]
18. Lee, S.-T. Shear effects on thermoplastic foam nucleation. Polym. Eng. Sci. 1993, 33, 418–422. [CrossRef]19. Chu, R.K.; Mark, L.H.; Jahani, D.; Park, C.B. Estimation of the foaming temperature of mold-opening foam injection molding
process. J. Cell. Plast. 2016, 52, 619–641. [CrossRef]20. Wu, H.; Zhao, G.; Wang, G.; Zhang, W.; Li, Y. A new core-back foam injection molding method with chemical blowing agents.
Mater. Des. 2018, 144, 331–342. [CrossRef]21. Wu, H.; Zhao, G.; Wang, J.; Wang, G.; Zhang, M. A kind of special weld lines with high specific strength and elongation obtained
by core-back chemical foam injection molding. eXPRESS Polym. Lett. 2019, 13, 1041–1056. [CrossRef]22. Wilczynski, K.; Narowski, P. A Strategy for problem solving of filling imbalance in geometrically balanced injection molds.
Polymers 2020, 12, 805. [CrossRef]23. Fernandes, C.; Pontes, A.J.; Viana, J.C.; Gaspar-Cunha, A. Modeling and optimization of the injection-molding process: A review.
Adv. Polym. Technol. 2018, 37, 429–449. [CrossRef]24. McDaniel, W.R.; Ankenman, B.E. Comparing experimental design strategies for quality improvement with minimal changes to
factor levels. Qual. Reliab. Eng. Int. 2000, 16, 355–362. [CrossRef]25. Frey, D.D.; Engelhardt, F.; Greitzer, E.M. A role for “one-factor-at-a-time” experimentation in parameter design. Res. Eng. Des.
2003, 14, 65–74. [CrossRef]26. Frey, D.D.; Jugulum, R. How one-factor-at-a-time experimentation can lead to greater improvements than orthogonal arrays.
In Proceedings of the DETC’03 ASME 2003 Design Engineering Technical Conferences and Computers and Information inEngineering Conference, Chicago, IL, USA, 2–6 September 2003; pp. 505–513.
27. Ameli, A.; Jahani, D.; Nofar, M.; Jung, P.U.; Park, C.B. Development of high void fraction polylactide composite foams usinginjection molding: Mechanical and thermal insulation properties. Compos. Sci. Technol. 2014, 90, 88–95. [CrossRef]
28. Barzegari, M.R.; Rodrigue, D. The effect of injection molding conditions on the morphology of polymer structural foams. Polym.Eng. Sci. 2009, 49, 949–959. [CrossRef]
29. Wypych, G. Databook of Blowing and Auxiliary Agents; ChemTec Publishing: Toronto, ON, Canada, 2017.30. Blander, M.; Katz, J.L. Bubble nucleation in liquids. AIChE J. 1975, 21, 833–848. [CrossRef]31. Mahapatra, S.P.; Tripathy, D.K. Rheological behavior of a microcellular, oil-extended ethylene–propylene–diene rubber compound:
Effects of the blowing agent, curing agent, and conductive carbon black filler. J. Appl. Polym. Sci. 2008, 109, 1022–1030. [CrossRef]32. Turng, L.-S.; Kharbas, H. Effect of process conditions on the weld-line strength and microstructure of microcellular injection
molded parts. Polym. Eng. Sci. 2003, 43, 157–168. [CrossRef]33. Mi, H.-Y.; Jing, X.; Peng, J.; Turng, L.-S.; Peng, X.-F. Influence and prediction of processing parameters on the properties of
microcellular injection molded thermoplastic polyurethane based on an orthogonal array test. J. Cell. Plast. 2013, 49, 439–458.[CrossRef]
34. Llewelyn, G.; Rees, A.; Griffiths, C.A.; Scholz, S.G. Advances in microcellular injection moulding. J. Cell. Plast. 2020, 56, 646–674.[CrossRef]
35. Strong, A.B. Plastics: Materials and Processing, 2nd ed.; Prentice Hall: Englewood Cliffs, NJ, USA, 2000.36. Chen, L.; Wang, X.; Straff, R.; Blizard, K. Shear stress nucleation in microcellular foaming process. Polym. Eng. Sci. 2002, 42,
1151–1158. [CrossRef]37. Gómez-Gómez, J.F.; Arencón, D.; Sánchez-Soto, M.Á.; Martínez, A.B. Influence of the injection moulding parameters on the
microstructure and thermal properties of microcellular polyethylene terephthalate glycol foams. J. Cell. Plast. 2013, 49, 47–63.[CrossRef]
38. Khoukhi, M.; Tahat, M. Effect of temperature and density variations on thermal conductivity of polystyrene insulation materialsin Oman climate. J. Eng. Phys. Thermophys. 2015, 88, 994–998. [CrossRef]
39. Kawashima, H.; Shimbo, M. Effect of key process variables on microstructure of injection molded microcellular polystyrenefoams. Cell. Polym. 2003, 22, 175–190. [CrossRef]
40. Czitrom, V. One-factor-at-a-time versus designed experiments. Am. Stat. 1999, 53, 126–131.