Effects of Geometrical and Flow Rates on the Prediction of ...
9
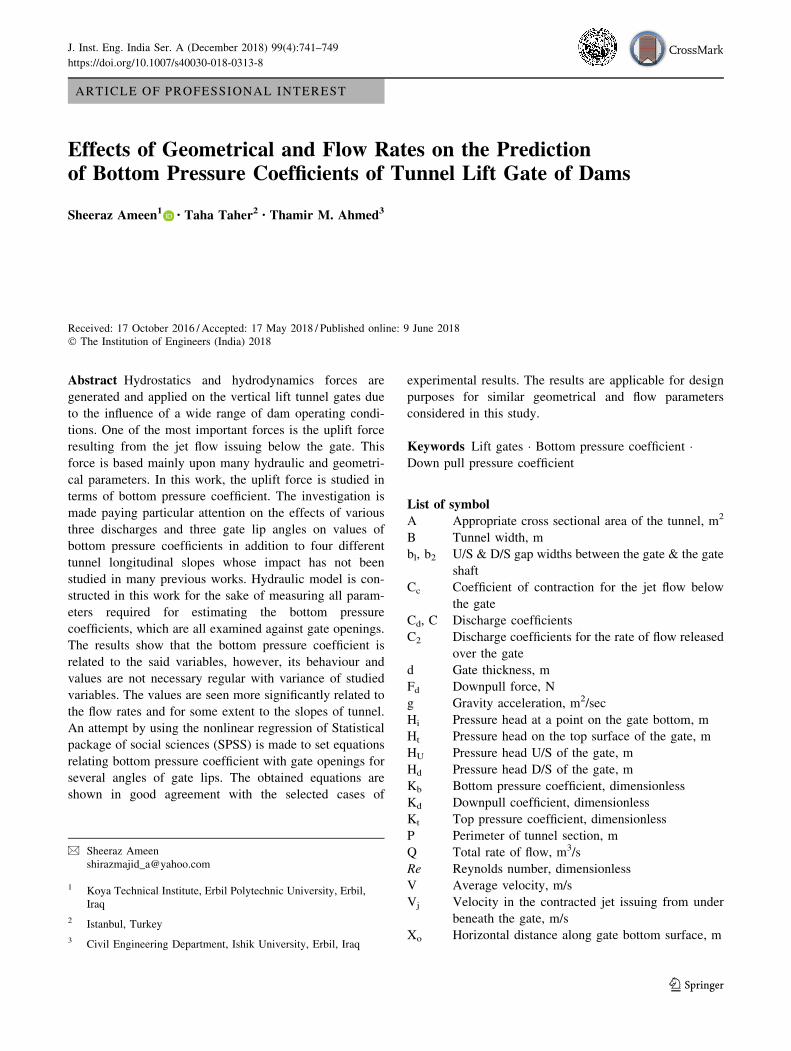
ARTICLE OF PROFESSIONAL INTEREST Effects of Geometrical and Flow Rates on the Prediction of Bottom Pressure Coefficients of Tunnel Lift Gate of Dams Sheeraz Ameen 1 • Taha Taher 2 • Thamir M. Ahmed 3 Received: 17 October 2016 / Accepted: 17 May 2018 / Published online: 9 June 2018 Ó The Institution of Engineers (India) 2018 Abstract Hydrostatics and hydrodynamics forces are generated and applied on the vertical lift tunnel gates due to the influence of a wide range of dam operating condi- tions. One of the most important forces is the uplift force resulting from the jet flow issuing below the gate. This force is based mainly upon many hydraulic and geometri- cal parameters. In this work, the uplift force is studied in terms of bottom pressure coefficient. The investigation is made paying particular attention on the effects of various three discharges and three gate lip angles on values of bottom pressure coefficients in addition to four different tunnel longitudinal slopes whose impact has not been studied in many previous works. Hydraulic model is con- structed in this work for the sake of measuring all param- eters required for estimating the bottom pressure coefficients, which are all examined against gate openings. The results show that the bottom pressure coefficient is related to the said variables, however, its behaviour and values are not necessary regular with variance of studied variables. The values are seen more significantly related to the flow rates and for some extent to the slopes of tunnel. An attempt by using the nonlinear regression of Statistical package of social sciences (SPSS) is made to set equations relating bottom pressure coefficient with gate openings for several angles of gate lips. The obtained equations are shown in good agreement with the selected cases of experimental results. The results are applicable for design purposes for similar geometrical and flow parameters considered in this study. Keywords Lift gates Bottom pressure coefficient Down pull pressure coefficient List of symbol A Appropriate cross sectional area of the tunnel, m 2 B Tunnel width, m b l ,b 2 U/S & D/S gap widths between the gate & the gate shaft C c Coefficient of contraction for the jet flow below the gate C d ,C Discharge coefficients C 2 Discharge coefficients for the rate of flow released over the gate d Gate thickness, m F d Downpull force, N g Gravity acceleration, m 2 /sec H i Pressure head at a point on the gate bottom, m H t Pressure head on the top surface of the gate, m H U Pressure head U/S of the gate, m H d Pressure head D/S of the gate, m K b Bottom pressure coefficient, dimensionless K d Downpull coefficient, dimensionless K t Top pressure coefficient, dimensionless P Perimeter of tunnel section, m Q Total rate of flow, m 3 /s Re Reynolds number, dimensionless V Average velocity, m/s V j Velocity in the contracted jet issuing from under beneath the gate, m/s X o Horizontal distance along gate bottom surface, m & Sheeraz Ameen [email protected] 1 Koya Technical Institute, Erbil Polytechnic University, Erbil, Iraq 2 Istanbul, Turkey 3 Civil Engineering Department, Ishik University, Erbil, Iraq 123 J. Inst. Eng. India Ser. A (December 2018) 99(4):741–749 https://doi.org/10.1007/s40030-018-0313-8
-
Upload
khangminh22 -
Category
Documents
-
view
1 -
download
0
Transcript of Effects of Geometrical and Flow Rates on the Prediction of ...
ARTICLE OF PROFESSIONAL INTEREST
Effects of Geometrical and Flow Rates on the Predictionof Bottom Pressure Coefficients of Tunnel Lift Gate of Dams
Sheeraz Ameen1 • Taha Taher2 • Thamir M. Ahmed3
Received: 17 October 2016 /Accepted: 17 May 2018 / Published online: 9 June 2018
� The Institution of Engineers (India) 2018
Abstract Hydrostatics and hydrodynamics forces are
generated and applied on the vertical lift tunnel gates due
to the influence of a wide range of dam operating condi-
tions. One of the most important forces is the uplift force
resulting from the jet flow issuing below the gate. This
force is based mainly upon many hydraulic and geometri-
cal parameters. In this work, the uplift force is studied in
terms of bottom pressure coefficient. The investigation is
made paying particular attention on the effects of various
three discharges and three gate lip angles on values of
bottom pressure coefficients in addition to four different
tunnel longitudinal slopes whose impact has not been
studied in many previous works. Hydraulic model is con-
structed in this work for the sake of measuring all param-
eters required for estimating the bottom pressure
coefficients, which are all examined against gate openings.
The results show that the bottom pressure coefficient is
related to the said variables, however, its behaviour and
values are not necessary regular with variance of studied
variables. The values are seen more significantly related to
the flow rates and for some extent to the slopes of tunnel.
An attempt by using the nonlinear regression of Statistical
package of social sciences (SPSS) is made to set equations
relating bottom pressure coefficient with gate openings for
several angles of gate lips. The obtained equations are
shown in good agreement with the selected cases of
experimental results. The results are applicable for design
purposes for similar geometrical and flow parameters
considered in this study.
Keywords Lift gates � Bottom pressure coefficient �Down pull pressure coefficient
List of symbol
A Appropriate cross sectional area of the tunnel, m2
B Tunnel width, m
bl, b2 U/S & D/S gap widths between the gate & the gate
shaft
Cc Coefficient of contraction for the jet flow below
the gate
Cd, C Discharge coefficients
C2 Discharge coefficients for the rate of flow released
over the gate
d Gate thickness, m
Fd Downpull force, N
g Gravity acceleration, m2/sec
Hi Pressure head at a point on the gate bottom, m
Ht Pressure head on the top surface of the gate, m
HU Pressure head U/S of the gate, m
Hd Pressure head D/S of the gate, m
Kb Bottom pressure coefficient, dimensionless
Kd Downpull coefficient, dimensionless
Kt Top pressure coefficient, dimensionless
P Perimeter of tunnel section, m
Q Total rate of flow, m3/s
Re Reynolds number, dimensionless
V Average velocity, m/s
Vj Velocity in the contracted jet issuing from under
beneath the gate, m/s
Xo Horizontal distance along gate bottom surface, m
& Sheeraz Ameen
1 Koya Technical Institute, Erbil Polytechnic University, Erbil,
Iraq
2 Istanbul, Turkey
3 Civil Engineering Department, Ishik University, Erbil, Iraq
123
J. Inst. Eng. India Ser. A (December 2018) 99(4):741–749
https://doi.org/10.1007/s40030-018-0313-8
X The horizontally distance from the leading edge of
gate lip toward trailin edge, m
Y Height of gate opening, m
Yo Tunnel height, m
v Kinematic viscosity, m2/s
h Angle between horizontal and sloping bottom of
the gate, degree
q Density of water, kg/m3
c Specific weight of water, N/m3
Introduction
The dam tunnel lift vertical gates are mainly exposed to
many hydrodynamics forces exerted by pressurized water
flow in different direction. The tunnel flow stream lines
almost take two paths, and accordingly the two major
forces will be created. The uplift pressure force is produced
by water jet flow issuing beneath the gate and caused big
effects on its bottom surface and consequently on the
mechanical system of gate operation. The other force is
established vertically downward along the gate top surface
due to the effects of water flow passing from upstream to
downstream gate shaft clearances. The net force obtained
from the difference of these two forces is named as
downpull force which consists a very important reference
for safe and economical design of gates.
The hydrodynamic forces are influenced by many main
parameters that were studied by many researchers through
mathematical and experimental approaches. The flow
conditions and gate lip geometrics have been examined and
many results were analysed and suggestions being recom-
mended. Cox et al. proposed the dimensionless relationship
of hydrodynamic force [8], which reflects the impact of
aeration, geometry of gate bottom, and clearances of gate
shaft on the stability of the gate. Such criterion was used in
analytical approach adopted by many subsequent
researches.
Naudascher et al. conducted the air tunnel tests [12] to
evaluate the influences of flow conditions and geometry
limits on downpull force applied to high head leaf gates. It
is found that the following one-dimensional form based
upon the bottom and top pressure coefficients and can be
utilized for evaluating the downpul force.
Fd ¼ Kt � Kbð Þ � B � d � q ð1Þ
where Fd = downpull force, N, B = gate width, m,
d = gate thickness, m, q = water mass density, Kg/m3,
and Vj = velocity of the contracted jet issuing from
underneath the gate, m/s.
Kt ¼ 2g � ðHt � HdÞ=V2j ð2Þ
Kb ¼ 2g � ðHi � HdÞ=V2j ð3Þ
where Ht = Piezometric head on gate top surface, m,
Hd = Piezometric head just downstream the gate shaft m,
Hi = Piezometric head at a point on the gate bottom, m.
Elder presents the experimental simulation of the TVAS
Melton Hill Dam 3-leaf intake gate (1964) [9] to explore
the effects of gate geometries on downpull force. The study
includes five suggested shapes and nine of normal shapes.
The tests failed to attain the satisfactory design due to
excessive hydraulic forces caused by gate lip shapes,
oscillation of the gate during closure, and in many designs,
leaf failure to close. The combination of lip shapes has led
to an acceptable design.
The limited estimation of downpull forces were obtained
from two empirical methods as suggested by Sagar
[14–16], first one named, the downpull coefficient method
is based on Fort Randall Dam data while the other, pressure
distribution method, which is based on estimating the total
forces acting on the top and bottom surfaces of the gate.
These two methods are restricted to be applicable for
similar gate shapes.
Bhargava [7] examined the pressure fluctuations on
different geometries of vertical-lift gate. The study inves-
tigated numerous hydraulic parameters that influence the
values and distributions of pressure heads for various gate
openings. The intensity of pressure and its distribution
pattern were studied when the gate is enforced to vibrate in
the vertical direction at specific frequencies and amplitude.
Total intensity of fluctuating pressures on vibrating gates
was obtained by integrating the profiles of pressure fluc-
tuations over the gate thickness. The study specifies a
pressure of common frequency, which is considered as
critical condition for gate design.
The unsteady loads applied for different lip geometries
and flow conditions of vertical lift gate were studied by
Nguyen [18]. The behaviour of the gate was examined
under the effects of vibrations that had been created as
results of separation and reattachment of flow streamlines
beneath the gate bottom surface with specific ranges of
dimensionless velocities. Such fluctuation was caused by
the combined action of instable shear layer below the gate
bottom and the vortices established just upstream the gate
edge. The analysis leads to indicate the critical range of
gate opening corresponding to potential gate vibrations
(Table 1).
The one-dimensional finite element model conducted by
Al-Kadi estimated the downpull force [4].This model is
based upon the velocity and mean pressure distribution
along the bottom gate surface. Two cases were considered,
one with invariant eddy viscosity and the other with
742 J. Inst. Eng. India Ser. A (December 2018) 99(4):741–749
123
variable eddy viscosity. The model was verified with the
results of analytical prediction and gave a good agreement.
Ahmed [1] investigated the effect of many gate
geometries with various gate width ratios on down pull
forces, the study was based on the analytical results of the
measurements gained by the experimental runs conducted
by using hydraulic lab model. This study concludes that the
downpull coefficient is influenced by various parameters
such as gate geometry and gate opening.
Experimental work on downpull force on gates installed
in the intake structures of hydroelectric power plants
including lip pressure distribution measurements and direct
weighing of downpull was presented by Aydin et al. [6].
The downpull coefficient was defined as a function of the
lip angle and gate opening. The function is combined with
unsteady flow one-dimensional mathematical model, which
based on the integral energy and continuity equations. The
downpull force was evaluated for both cases of stationary
and closing modes. The Predicted mathematical model was
compared with the results obtained from the direct
weighing method in order to confirm its validity.
A two-dimensional CFD model is applied by Almani
et al. [5] to predict a downpull coefficient (KT and KB)
which is named as FLUENT program. The finite volume
method is employed on a Reynolds averaged Navier–
Stokes equations. The turbulence effects are simulated
using the standard (k–e) model. The simulation model was
used for relevant experimental data obtained from
hydraulic model tests conducted by (Ahmed 1999) in lab-
oratory for nine gate lip shape with different gate openings
for each gate lip geometry. It is found that the minimum
positive downpull force can be reached for lip geometry
with (h = 35�).The distribution of pressure around the bottom of outlet
leaf gate and its potential risk of cavitation and destructive
vibrations of the gates were studied by Khosrojerdi [10].
The study is based upon the three dimensional simulation
of numerical method which was used to indicate the change
in pressure and downpull forces during the vertical gate
movements. It is found the downpull forces are influenced
by the upward and downward direction of gate movements.
Naderi and Hadipour [13] examined the distribution of
pressure and consequently the related hydrodynamic forces
on the valve of channel outlet for many opening ratios by
utilizing the numerical method based upon the finite vol-
ume principles. The numerical model was verified by the
corresponding results of physical as well as previous
studies where the comparison gave good agreement. The
study reveals that the differences in top and bottom of the
valve pressures lead to create downpull force.
Markovic-Brankovic and Drobier [11] exhibited new
smooth upstream face high head gate form that reduces
hydrodynamic forces in conjunction to a total (negative
downpull) forces. The investigation distinguished various
changes in the configuration, which would decrease
downpull and by and by the expense. After various
attempts, an adequate development change was found in
the model. The consequences of the model tests demon-
strate that an expansion in vertical openings of the gate leaf
reduces the hydrodynamic forces fundamentally.
Mehmet Akis Uysal in 2014 [19] proposed a method to
predict the downpull forces on the tunnel gates which is
installed in the intake of a hydropower plant. It is focusing
on the evaluation of downpull forces for various closure
rates and gate lip geometries. The outcomes contrasted
with results, which were achieved by using ANSYS
FLUENT programming as a tool for calculation. Downpull
coefficients, which have been got from computational
study, demonstrated great concurrence with those obtained
from measurements.
Taher et al. [17] used a random hydraulic model to study
the effects of twelve gate lips orientation on the behaviour
of flow and consequently on the bottom pressure coeffi-
cient. The main conclusion indicates that the values of
bottom pressure coefficient (Kb) are inversely proportional
to gate opening ratios (Y/Y0) and range from high values
with small gate openings ratios and low values for (Y/
Y0[ 30%). The study finds that the bottom pressure
coefficient (Kb) and the fluctuations flow pattern below the
gate surface h influenced mainly by the gate geometry.
In the current study, the down pull forces on the gates
are evaluated for different flow rates, different gate lip
geometries and different longitudinal slopes. The PASW
Statistical Program is used for analyses and surfer program
to represent the results. The measurements are carried out
by using the hydraulic of tunnel model with seven different
lip shapes. The Validity of the results is indicated by the
comparison with corresponding cases of previous related
works.
Experimental Set-Up
The experiments were conducted by using the random
hydraulic model which was designed by Ahmed [3] and
has been established in Hydraulic Laboratory of Ishik
University/Erbil/Iraq. The model consists of a rectangular
Table 1 Mean values of submerged flow rates and corresponding
Reynolds number
Q QLow (m3/s) Qmed (m3/s) Qmax (m
3/s)
Mean value & 0.028 & 0.035 & 0.04
Reynolds number 1.12 9 105 1.4 9 105 1.6 9 105
J. Inst. Eng. India Ser. A (December 2018) 99(4):741–749 743
123
recirculation flume, 4 m long, 0.2 m wide and 0.3 m deep.
The bed and both sides of channel were made by glass and
covered along its upper part by a thick plate representing
the tunnel roof. The steel gate shaft (0.3 9 0.15 9 0.6) m
was installed mid-way above the flume roof.
The head of tunnel was fed by stilling tank to reduce the
effects of turbulence. The flow is returned to the storage
tank through the control sluice gate which was installed at
the end tunnel. The control gate is essential to provide a
pressurized status for all different flow conditions required
for this study. AC motor was used to derive a 4 kW pump,
thereby providing the discharge which was adjusted by a
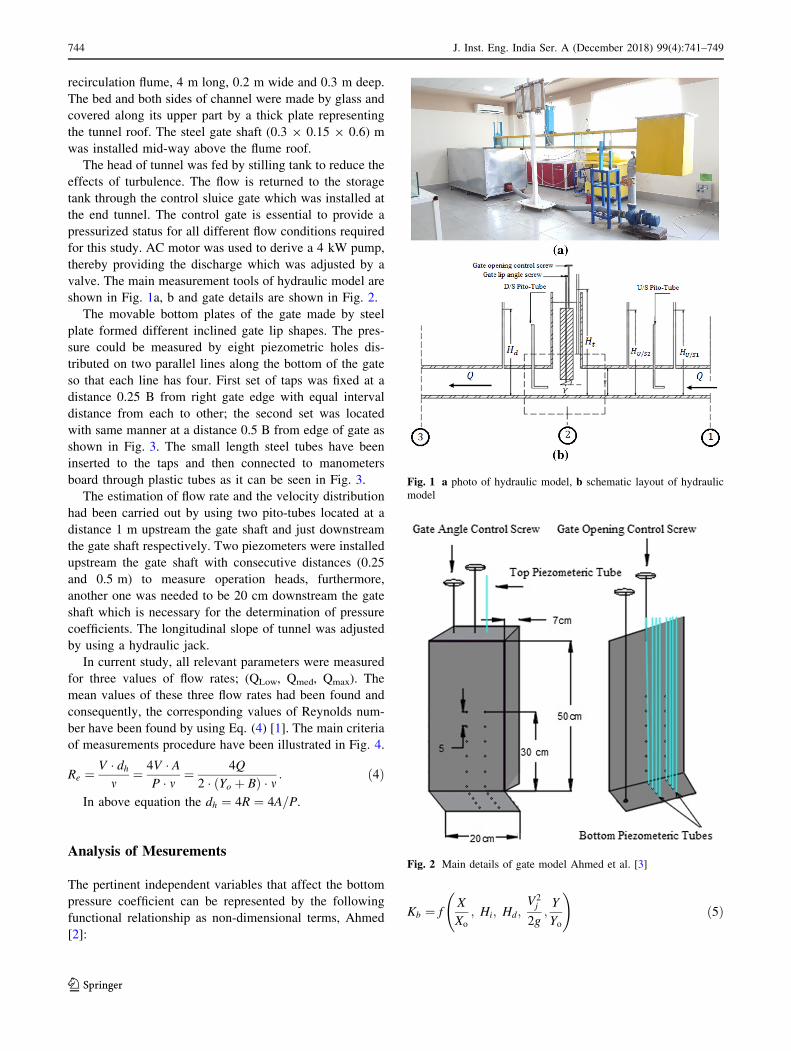
valve. The main measurement tools of hydraulic model are
shown in Fig. 1a, b and gate details are shown in Fig. 2.
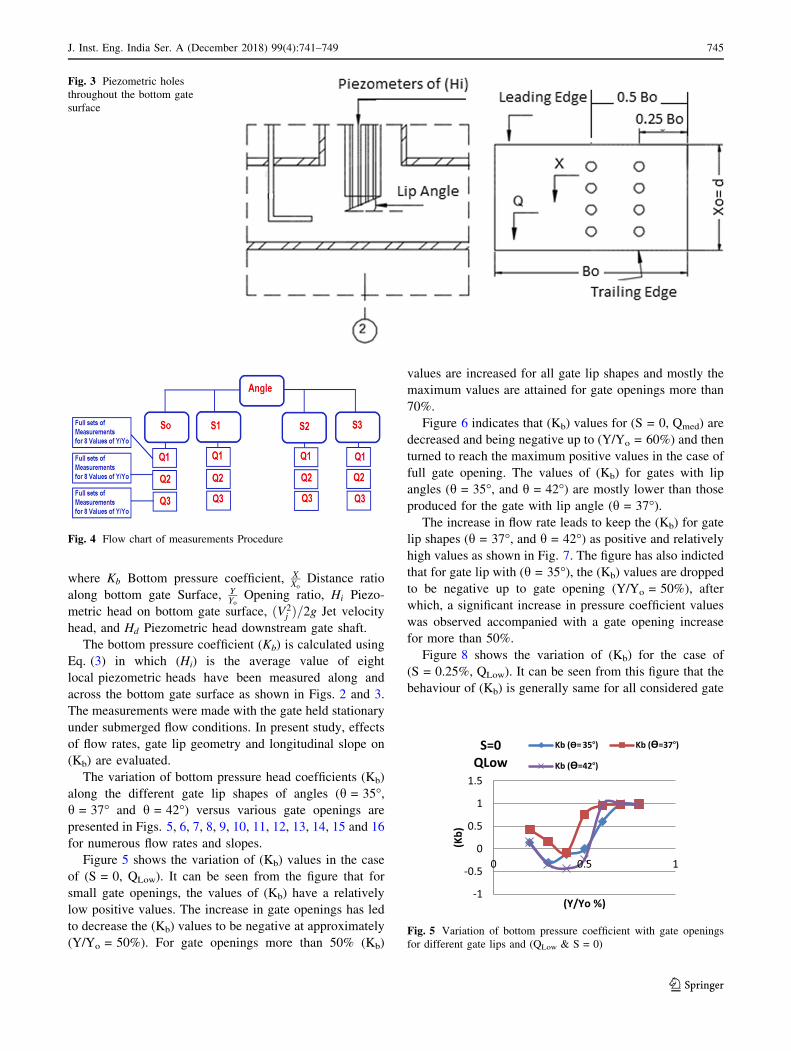
The movable bottom plates of the gate made by steel
plate formed different inclined gate lip shapes. The pres-
sure could be measured by eight piezometric holes dis-
tributed on two parallel lines along the bottom of the gate
so that each line has four. First set of taps was fixed at a
distance 0.25 B from right gate edge with equal interval
distance from each to other; the second set was located
with same manner at a distance 0.5 B from edge of gate as
shown in Fig. 3. The small length steel tubes have been
inserted to the taps and then connected to manometers
board through plastic tubes as it can be seen in Fig. 3.
The estimation of flow rate and the velocity distribution
had been carried out by using two pito-tubes located at a
distance 1 m upstream the gate shaft and just downstream
the gate shaft respectively. Two piezometers were installed
upstream the gate shaft with consecutive distances (0.25
and 0.5 m) to measure operation heads, furthermore,
another one was needed to be 20 cm downstream the gate
shaft which is necessary for the determination of pressure
coefficients. The longitudinal slope of tunnel was adjusted
by using a hydraulic jack.
In current study, all relevant parameters were measured
for three values of flow rates; (QLow, Qmed, Qmax). The
mean values of these three flow rates had been found and
consequently, the corresponding values of Reynolds num-
ber have been found by using Eq. (4) [1]. The main criteria
of measurements procedure have been illustrated in Fig. 4.
Re ¼V � dhm
¼ 4V � AP � m ¼ 4Q
2 � Yo þ Bð Þ � m : ð4Þ
In above equation the dh ¼ 4R ¼ 4A=P.
Analysis of Mesurements
The pertinent independent variables that affect the bottom
pressure coefficient can be represented by the following
functional relationship as non-dimensional terms, Ahmed
[2]:
Kb ¼ fX
Xo
; Hi; Hd;V2j
2g;Y
Yo
!ð5Þ
Fig. 1 a photo of hydraulic model, b schematic layout of hydraulic
model
Fig. 2 Main details of gate model Ahmed et al. [3]
744 J. Inst. Eng. India Ser. A (December 2018) 99(4):741–749
123
where Kb Bottom pressure coefficient, XXo
Distance ratio
along bottom gate Surface, YYo
Opening ratio, Hi Piezo-
metric head on bottom gate surface, ðV2j Þ=2g Jet velocity
head, and Hd Piezometric head downstream gate shaft.
The bottom pressure coefficient (Kb) is calculated using
Eq. (3) in which (Hi) is the average value of eight
local piezometric heads have been measured along and
across the bottom gate surface as shown in Figs. 2 and 3.
The measurements were made with the gate held stationary
under submerged flow conditions. In present study, effects
of flow rates, gate lip geometry and longitudinal slope on
(Kb) are evaluated.
The variation of bottom pressure head coefficients (Kb)
along the different gate lip shapes of angles (h = 35�,h = 37� and h = 42�) versus various gate openings are
presented in Figs. 5, 6, 7, 8, 9, 10, 11, 12, 13, 14, 15 and 16
for numerous flow rates and slopes.
Figure 5 shows the variation of (Kb) values in the case
of (S = 0, QLow). It can be seen from the figure that for
small gate openings, the values of (Kb) have a relatively
low positive values. The increase in gate openings has led
to decrease the (Kb) values to be negative at approximately
(Y/Yo = 50%). For gate openings more than 50% (Kb)
values are increased for all gate lip shapes and mostly the
maximum values are attained for gate openings more than
70%.
Figure 6 indicates that (Kb) values for (S = 0, Qmed) are
decreased and being negative up to (Y/Yo = 60%) and then
turned to reach the maximum positive values in the case of
full gate opening. The values of (Kb) for gates with lip
angles (h = 35�, and h = 42�) are mostly lower than those
produced for the gate with lip angle (h = 37�).The increase in flow rate leads to keep the (Kb) for gate
lip shapes (h = 37�, and h = 42�) as positive and relatively
high values as shown in Fig. 7. The figure has also indicted
that for gate lip with (h = 35�), the (Kb) values are dropped
to be negative up to gate opening (Y/Yo = 50%), after
which, a significant increase in pressure coefficient values
was observed accompanied with a gate opening increase
for more than 50%.
Figure 8 shows the variation of (Kb) for the case of
(S = 0.25%, QLow). It can be seen from this figure that the
behaviour of (Kb) is generally same for all considered gate
Fig. 3 Piezometric holes
throughout the bottom gate
surface
Fig. 4 Flow chart of measurements Procedure
-1
-0.5
0
0.5
1
1.5
0 0.5 1
(Kb)
(Y/Yo %)
S=0 QLow
Kb (Ө= 35°) Kb (Ө=37°)
Kb (Ө=42°)
Fig. 5 Variation of bottom pressure coefficient with gate openings
for different gate lips and (QLow & S = 0)
J. Inst. Eng. India Ser. A (December 2018) 99(4):741–749 745
123
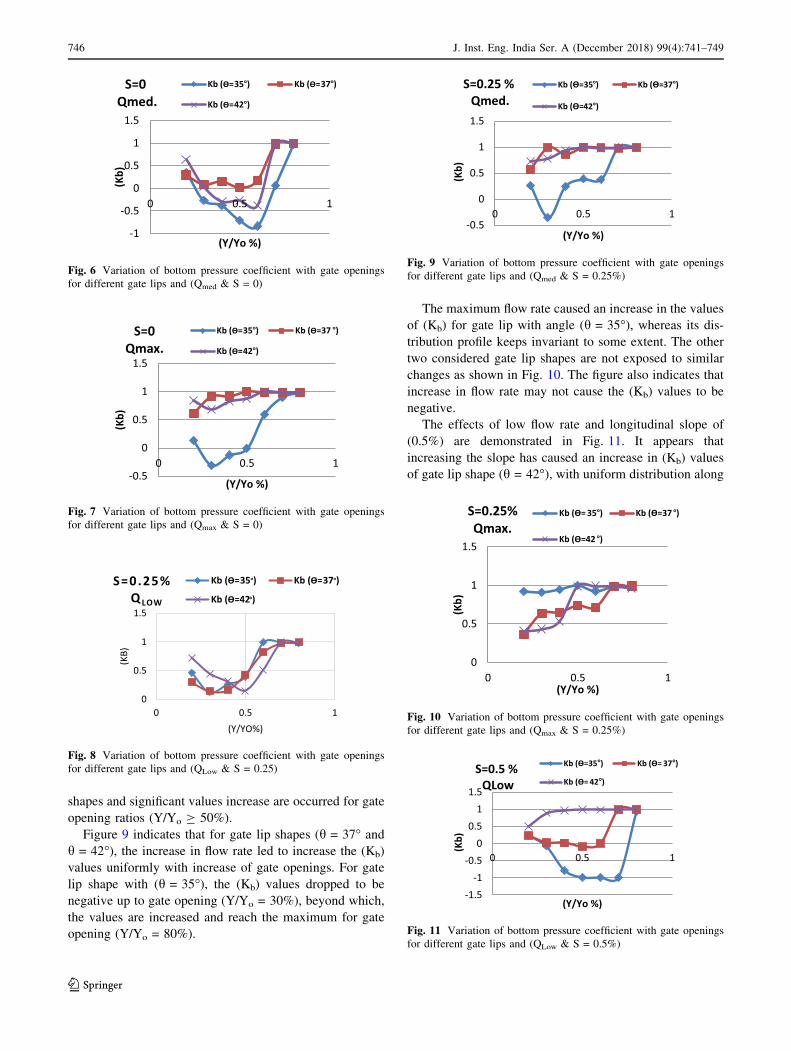
shapes and significant values increase are occurred for gate
opening ratios (Y/Yo C 50%).
Figure 9 indicates that for gate lip shapes (h = 37� andh = 42�), the increase in flow rate led to increase the (Kb)
values uniformly with increase of gate openings. For gate
lip shape with (h = 35�), the (Kb) values dropped to be
negative up to gate opening (Y/Yo = 30%), beyond which,
the values are increased and reach the maximum for gate
opening (Y/Yo = 80%).
The maximum flow rate caused an increase in the values
of (Kb) for gate lip with angle (h = 35�), whereas its dis-
tribution profile keeps invariant to some extent. The other
two considered gate lip shapes are not exposed to similar
changes as shown in Fig. 10. The figure also indicates that
increase in flow rate may not cause the (Kb) values to be
negative.
The effects of low flow rate and longitudinal slope of
(0.5%) are demonstrated in Fig. 11. It appears that
increasing the slope has caused an increase in (Kb) values
of gate lip shape (h = 42�), with uniform distribution along
-1
-0.5
0
0.5
1
1.5
0 0.5 1
(Kb)
(Y/Yo %)
S=0 Qmed.
Kb (Ө=35°) Kb (Ө=37°)
Kb (Ө=42°)
Fig. 6 Variation of bottom pressure coefficient with gate openings
for different gate lips and (Qmed & S = 0)
-0.5
0
0.5
1
1.5
0 0.5 1
(Kb)
(Y/Yo %)
S=0 Qmax.
Kb (Ө=35°) Kb (Ө=37 °)
Kb (Ө=42°)
Fig. 7 Variation of bottom pressure coefficient with gate openings
for different gate lips and (Qmax & S = 0)
0
0.5
1
1.5
0 0.5 1
(KB)
(Y/YO%)
S=0.25%Q LOW
Kb (Ө=35°) Kb (Ө=37°)
Kb (Ө=42°)
Fig. 8 Variation of bottom pressure coefficient with gate openings
for different gate lips and (QLow & S = 0.25)
-0.5
0
0.5
1
1.5
0 0.5 1
(Kb)
(Y/Yo %)
S=0.25 % Qmed.
Kb (Ө=35°) Kb (Ө=37°)
Kb (Ө=42°)
Fig. 9 Variation of bottom pressure coefficient with gate openings
for different gate lips and (Qmed & S = 0.25%)
0
0.5
1
1.5
0 0.5 1
(Kb)
(Y/Yo %)
S=0.25% Qmax.
Kb (Ө= 35°) Kb (Ө=37 °)
Kb (Ө=42 °)
Fig. 10 Variation of bottom pressure coefficient with gate openings
for different gate lips and (Qmax & S = 0.25%)
-1.5-1
-0.50
0.51
1.5
0 0.5 1
(Kb)
(Y/Yo %)
S=0.5 % QLow
Kb (Ө=35°) Kb (Ө= 37°)
Kb (Ө= 42°)
Fig. 11 Variation of bottom pressure coefficient with gate openings
for different gate lips and (QLow & S = 0.5%)
746 J. Inst. Eng. India Ser. A (December 2018) 99(4):741–749
123
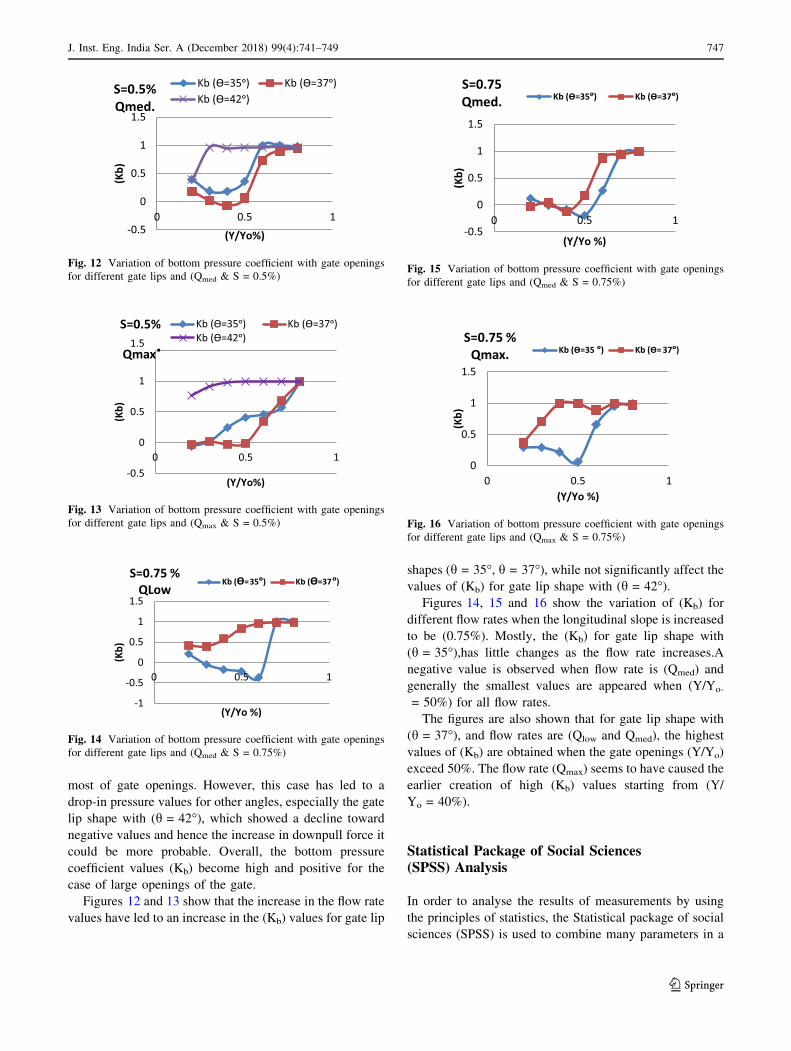
most of gate openings. However, this case has led to a
drop-in pressure values for other angles, especially the gate
lip shape with (h = 42�), which showed a decline toward
negative values and hence the increase in downpull force it
could be more probable. Overall, the bottom pressure
coefficient values (Kb) become high and positive for the
case of large openings of the gate.
Figures 12 and 13 show that the increase in the flow rate
values have led to an increase in the (Kb) values for gate lip
shapes (h = 35�, h = 37�), while not significantly affect the
values of (Kb) for gate lip shape with (h = 42�).Figures 14, 15 and 16 show the variation of (Kb) for
different flow rates when the longitudinal slope is increased
to be (0.75%). Mostly, the (Kb) for gate lip shape with
(h = 35�),has little changes as the flow rate increases.A
negative value is observed when flow rate is (Qmed) and
generally the smallest values are appeared when (Y/Yo-
= 50%) for all flow rates.
The figures are also shown that for gate lip shape with
(h = 37�), and flow rates are (Qlow and Qmed), the highest
values of (Kb) are obtained when the gate openings (Y/Yo)
exceed 50%. The flow rate (Qmax) seems to have caused the
earlier creation of high (Kb) values starting from (Y/
Yo = 40%).
Statistical Package of Social Sciences(SPSS) Analysis
In order to analyse the results of measurements by using
the principles of statistics, the Statistical package of social
sciences (SPSS) is used to combine many parameters in a
-0.5
0
0.5
1
1.5
0 0.5 1
(Kb)
(Y/Yo%)
S=0.5% Qmed.
Kb (Ө=35ᵒ) Kb (Ө=37ᵒ) Kb (Ө=42ᵒ)
Fig. 12 Variation of bottom pressure coefficient with gate openings
for different gate lips and (Qmed & S = 0.5%)
-0.5
0
0.5
1
1.5
0 0.5 1
(Kb)
(Y/Yo%)
S=0.5%
Qmax.Kb (Ө=35ᵒ) Kb (Ө=37ᵒ)Kb (Ө=42ᵒ)
Fig. 13 Variation of bottom pressure coefficient with gate openings
for different gate lips and (Qmax & S = 0.5%)
-1
-0.5
0
0.5
1
1.5
0 0.5 1
(Kb)
(Y/Yo %)
S=0.75 % QLow
Kb (Ө=35ᵒ) Kb (Ө=37ᵒ)
Fig. 14 Variation of bottom pressure coefficient with gate openings
for different gate lips and (Qmed & S = 0.75%)
-0.5
0
0.5
1
1.5
0 0.5 1
(Kb)
(Y/Yo %)
S=0.75 Qmed. Kb (Ө=35ᵒ) Kb (Ө=37ᵒ)
Fig. 15 Variation of bottom pressure coefficient with gate openings
for different gate lips and (Qmed & S = 0.75%)
0
0.5
1
1.5
0 0.5 1
(Kb)
(Y/Yo %)
S=0.75 % Qmax. Kb (Ө=35 ᵒ) Kb (Ө= 37ᵒ)
Fig. 16 Variation of bottom pressure coefficient with gate openings
for different gate lips and (Qmax & S = 0.75%)
J. Inst. Eng. India Ser. A (December 2018) 99(4):741–749 747
123
suitable predictive function. Many functions are available,
but the selection should be controlled by an accept-
able value of correlation coefficient, which represents one
of the best ways to get a good confidence for the applica-
bility of function.
In present study the following form of sixth order
polynomial function is selected in which the (Kb) is con-
sidered as dependent variable and has been taken as
function of gate lip angle (h) and gate opening (Y):
Kb ¼ Aþ B � Y þ C � Y2 þD � Y3 þ E � Y4 þ . . .þ N � Yn� �
ð6Þ
where A, B, etc. are constants obtained from the results of
regression process of software.
Many cases of results were introduced to software to
carry out the analysis of nonlinear regression for the data of
different opening ratios (Y/Yo) and angles (h). The fol-
lowing results with often-good values of correlations are
obtained.
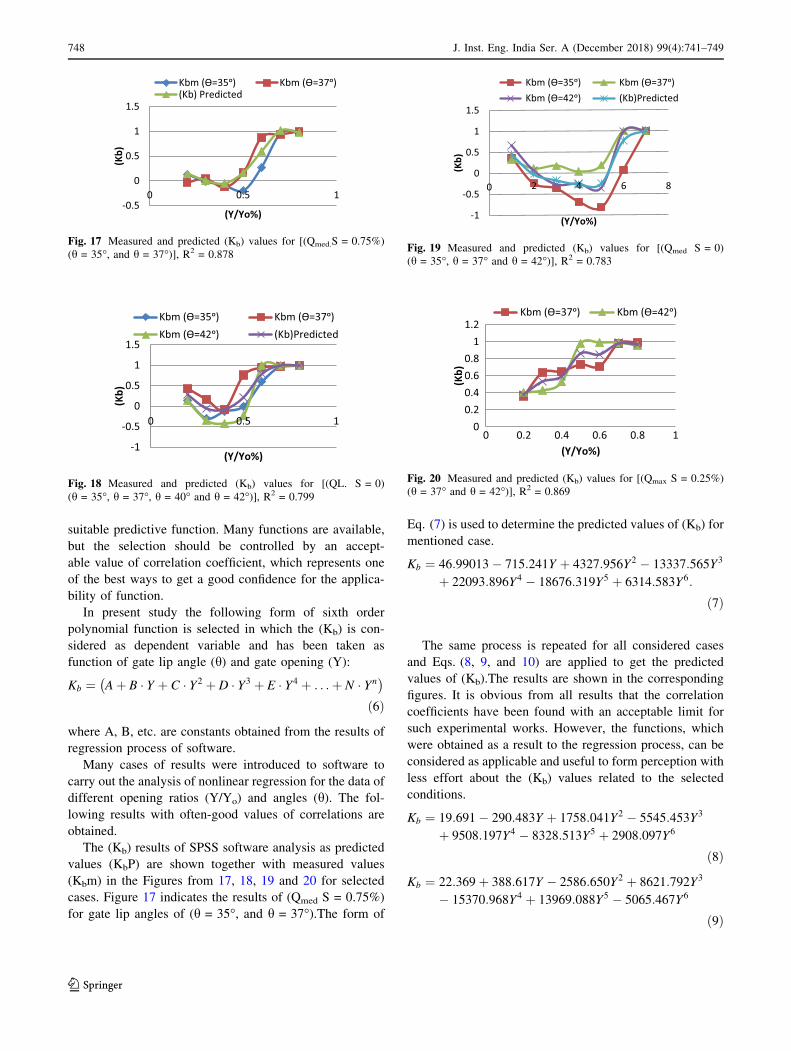
The (Kb) results of SPSS software analysis as predicted
values (KbP) are shown together with measured values
(Kbm) in the Figures from 17, 18, 19 and 20 for selected
cases. Figure 17 indicates the results of (Qmed S = 0.75%)
for gate lip angles of (h = 35�, and h = 37�).The form of
Eq. (7) is used to determine the predicted values of (Kb) for
mentioned case.
Kb ¼ 46:99013� 715:241Y þ 4327:956Y2 � 13337:565Y3
þ 22093:896Y4 � 18676:319Y5 þ 6314:583Y6:
ð7Þ
The same process is repeated for all considered cases
and Eqs. (8, 9, and 10) are applied to get the predicted
values of (Kb).The results are shown in the corresponding
figures. It is obvious from all results that the correlation
coefficients have been found with an acceptable limit for
such experimental works. However, the functions, which
were obtained as a result to the regression process, can be
considered as applicable and useful to form perception with
less effort about the (Kb) values related to the selected
conditions.
Kb ¼ 19:691� 290:483Y þ 1758:041Y2 � 5545:453Y3
þ 9508:197Y4 � 8328:513Y5 þ 2908:097Y6
ð8Þ
Kb ¼ 22:369þ 388:617Y � 2586:650Y2 þ 8621:792Y3
� 15370:968Y4 þ 13969:088Y5 � 5065:467Y6
ð9Þ
-0.5
0
0.5
1
1.5
0 0.5 1
(Kb)
(Y/Yo%)
Kbm (Ө=35ᵒ) Kbm (Ө=37ᵒ)(Kb) Predicted
Fig. 17 Measured and predicted (Kb) values for [(Qmed.S = 0.75%)
(h = 35�, and h = 37�)], R2 = 0.878
-1
-0.5
0
0.5
1
1.5
0 0.5 1
(Kb)
(Y/Yo%)
Kbm (Ө=35ᵒ) Kbm (Ө=37ᵒ)Kbm (Ө=42ᵒ) (Kb)Predicted
Fig. 18 Measured and predicted (Kb) values for [(QL. S = 0)
(h = 35�, h = 37�, h = 40� and h = 42�)], R2 = 0.799
-1
-0.5
0
0.5
1
1.5
0 2 4 6 8
(Kb)
(Y/Yo%)
Kbm (Ө=35ᵒ) Kbm (Ө=37ᵒ)Kbm (Ө=42ᵒ) (Kb)Predicted
Fig. 19 Measured and predicted (Kb) values for [(Qmed S = 0)
(h = 35�, h = 37� and h = 42�)], R2 = 0.783
00.20.40.60.8
11.2
0 0.2 0.4 0.6 0.8 1
(Kb)
(Y/Yo%)
Kbm (Ө=37ᵒ) Kbm (Ө=42ᵒ)
Fig. 20 Measured and predicted (Kb) values for [(Qmax S = 0.25%)
(h = 37� and h = 42�)], R2 = 0.869
748 J. Inst. Eng. India Ser. A (December 2018) 99(4):741–749
123
Kb ¼ �39:573þ 596:955Y � 3522:554Y2 þ 10566:195Y3
� 17043:619Y4 þ 14085:757Y5 þ�4680:751Y6:
ð10Þ
Conclusions
The bottom pressure head coefficient was estimated based
upon the results analysis of all sets of measurements.This
pressure head coefficient is examined with effects of dif-
ferent gate lip angles, flow rates and longitudinal slopes.
An attemp was used to analyze the results of bottom
pressure coefficients (Kb) by using the nonlinear regression
of Statistical package of social sciences (SPSS).The com-
parison between the measured and predicted values of (Kb)
for specific cases were disccused.
Some of major conclusions are listed as follows:
1. For gate lip shape of (h = 35�), the (Kb) values are
mostly being negative for a range of gate openings (Y/
Yo) around 50%, except at the case of (Qmed and Qmax
For S = 0.5%),the (Kb) values are positive and
increase with increasing the gate opening ratios.In
general, for different flow rates and longitudinal
slopes, the (Kb) values are lower than those obtained
from other gate lip shapes involved in current study.
2. For gate lip shape of (h = 37�), The (Kb) values are
positive and varied uniformly from 0.5 to approxi-
mately zero near to (Y/Yo = 50%), then increased as
gate openings increase. However, the considered
(Qmax) caused a general uniform trend of (Kb) values
and distribution along the all gate-opening ratios.
3. Regarding to the effects of varying flow rates on ((Kb)
values and distribution of gate lip shape of (h = 42�), itis noticed that these values are strongly related to the
said variance. Moreover, even when the longitudinal
slope is increased the (Kb) values are also significantly
increased. When longitudinal slope (S) is 0.5%, the
higher values along with uniform distribution are kept
obtained for (Kb) for all gate openings ratios.
4. Fluctuations in (Kb) values for all flow rates with slope
(S = 0.25%) were noticed to be embracing a general
trend of increase with (Y/Yo).
5. In general, the flow rates and slopes effects on the
average values of bottom pressure coefficients could
not be subjected to specific form.
6. Curves of (Kb) versus (Y/Yo) include in general a
turning point (minimum value and may be negative)
around (Y/Yo) of 50%, beyond which, the (Kb) values
rise to reach its maximum at (Y/Yo) of 70% or more.
7. The results of SPSS software analysis show that all the
correlation coefficients that have been found (0.878,
0.799, 0.783 and 0.869) are within the acceptable limits
for such experimental works. However, the functions,
which were obtained as a result to the regression
process, can mostly be useful for the estimation of (Kb)
values for conditions compatible with those considered
for this study. The results show that the range of
variance with the experimental measurements was ±
25%. This is considered acceptable regarding the
different conditions of testing.
References
1. T. M. Ahmed, Effect of gate lip shapes on the downpull force in
tunnel gates experimental study of pressure coefficient along
inclined bottom surface of dam tunnel gate, Ph.D. Thesis sub-
mitted to the College of Engineering, University of Baghdad,
1999
2. T.M. Ahmed, Experimental study of pressure coefficient along
inclined bottom surface of dam tunnel gate. Eurasian J. Sci. Eng.
1(2), 52–53 (2016)
3. T. M. Ahmed, A.O. Anwar, Effects of gate geometries on top
pressure coefficient of dam tunnel gate, in IEC 2016 Conference
Proceeding, pp. 85–90
4. B.T. AL-Kadi, Numerical evaluation of downpull force in tunnel
gates, Ph.D. Thesis submitted to the College of Engineering,
University of Baghdad, 1997
5. R.M. Almaini, M.T. Al-Kifae, S.A.M. Alhashimi, Prediction
downpull force on tunnel gate with different gate lip geometry.
J. Kerbala Univ. 8(4), 9 (2010)
6. I. Aydin, I. Telci, O. Dundar, Prediction of downpull on closing
high head gates. J. Hydraul. Res. 44(6), 822–831 (2006)
7. V.P. Bhargava, S. Narasimhan, Pressure fluctuations on gates.
J. Hydraul. Res. 27(2), 215–231 (1989)
8. G. Cox Robert, B.P. Ellis, W.P. Simmons, Hydraulic downpull on
high head gates, in ASCE Discussion Hy. 5 (1960)
9. R. A. Elder, J.M.Garrison ‘‘Flow induced hydraulic forces on
three leaf intake gates, in ASCE, vol. 90(3), IAHR/AIRH
Hydraulic Report, Balkema, Rotterdam, 2001, pp 215–233
10. A. Khosrojerdi, Hydraulic studies of pressure distribution around
vertical lift gates. Indian J. Sci. Technol. 5(3), 2268–2272 (2012)
11. J. Markovic–Brankovic, H. Drobier, New high head leaf gate
form with smooth upstream face. Tem J. 3, 19 (2013)
12. E. Naudaschers, H. Kobus, R.P.R. Rao, Hydrodynamic analysis
for high head leaf gates, ASCE, vol. 90(3) (1964)
13. M.N. Naderi, E. Hadipour, numerical simulation of flow in bot-
tom outlet of narmashir dam for calculating of hydrodynamic
forces. Bull. Env. Pharmacol. Life Sci 2(11), 87–93 (2013)
14. B.T.A. Sagar, ‘‘Downpull in High-head Gate Installations, Part 1.
Water Power Dam Construct 3, 38–39 (1977)
15. B.T.A. Sagar, ‘‘Downpull in High-head Gate Installations, Part 2.
Water Power Dam Construct. 4, 52–55 (1977)
16. B.T.A. Sagar, ‘‘Downpull in High-head Gate Installations, Part 3.
Water Power Dam Construct. 5, 29–35 (1977)
17. T.M. Taher, A.O. Anwa, Effects of gate lip orientation on bottom
pressure coefficient of dam tunnel gate. Arab. J. Sci. Eng. (2016).
https://doi.org/10.1007/s13369-016-2202-7
18. N.D. Thang, Gate vibrations due to unstable flow separation.
J. Hydraul. Eng. 116(3), 342–361 (1990)
19. Uysal, mehmet akis. Prediction of downpull on high head gates
using computational fluid dynamics. Diss. Middle east technical
university, 2014
J. Inst. Eng. India Ser. A (December 2018) 99(4):741–749 749
123