Effects of exercise on l-carnitine and lipid metabolism in African catfish ( Clarias gariepinus) fed...
12
Effects of exercise on L-carnitine and lipid metabolism in African catfish (Clarias gariepinus) fed different dietary L-carnitine and lipid levels Rodrigo O. A. Ozorio 1 *, Vincent J. T. Van Ginneken 2 , Rui J. B. Bessa 3 , Martin W. A. Verstegen 4 , Johan A. J. Verreth 5 and Elbertus A. Huisman 5 1 CIMAR/CIIMAR, Centro Interdisciplinar de Investigac ¸a ˜o Marinha e Ambiental, Universidade do Porto, Rua dos Bragas 289, 4050-123 Porto, Portugal 2 Plant Research International, Agrosystems Research, PO Box 616, 6700 AP Wageningen, The Netherlands 3 CIISA, Faculdade de Medicina Veterina ´ria, Universidade Te ´cnica de Lisboa, Polo Universita ´rio do Alto da Ajuda, 1300-477 Lisbon, Portugal 4 Wageningen University and Research Centre, Animal Nutrition Group, NL-6709 PG Wageningen, The Netherlands 5 Wageningen University and Research Centre, Fish Culture and Fisheries Group, NL-6700 AH Wageningen, The Netherlands (Received 14 July 2009 – Revised 20 October 2009 – Accepted 21 October 2009 – First published online 24 November 2009) African catfish (Clarias gariepinus) were fed four isonitrogenous diets (34 % crude protein), each containing one of two lipid (100 or 180 g/kg) and two L-carnitine (15 or 1000 mg/kg) levels. After 81 d of feeding, thirty-two fish (body weight 32 g) from each dietary group were randomly selected, sixteen fish were induced to a 3-h swim (speed of 1·5 body length (BL)/s), while the other sixteen fish were kept under resting condition. Fish fed 1000 mg L-carnitine accumulated 3·5 and 5 times more L-carnitine in plasma and muscle, respectively, than fish fed the 15 mg L-carnitine. Muscle L-carnitine content was significantly lower in exercised fish than in rested fish. High dietary lipid level (fish oil) led to an increase in muscle n-3 PUFA content and a decrease in SFA and MUFA content. In liver, the increase in dietary lipid level resulted in an increased levels of both n-6 and n-3 PUFA. L-carnitine supplementation significantly decreased n-3 PUFA content. Exercise decreased n-3 PUFA in both muscle and liver. Plasma lactate and lactate dehydrogenase, normally associated with increased glycolytic processes, were positively corre- lated with exercise and inversely correlated with dietary L-carnitine level. L-carnitine supplementation reduced significantly the RQ from 0·72 to 0·63, and an interaction between dietary L-carnitine and lipid was observed (P, 0·03). Our results indicate that an increase in fatty acids (FA) intake may promote FA oxidation, and both carnitine and exercise might influence the regulation of FA oxidation selectivity. African catfish: L-carnitine metabolism: Lipid metabolism: Exercise Fish are subjected to many changes in energy demand throughout their lifespan. As the lipid content of their diet increases so does the optimal dietary level of L-carnitine (1 – 3) , a multi-physiological, bioactive additive compound, syn- thesised from two essential amino acids, protein-bound lysine and methionine. It is not entirely understood whether animals require exogenous L-carnitine, and over the past 20 years, the scientific discussion regarding this subject con- tinued with ambiguous arguments. L-Carnitine plays several important physiological roles like shuttling the long-chain fatty acid (FA) across the inner mito- chondrial membrane for ATP production (4,5) and inhibition of superoxide radical formation (6) . According to Heo et al. (2,7) , L-carnitine biosynthesis might be sufficient to maintain growth of 20-kg pigs during optimum husbandry conditions. Nevertheless, extra dietary L-carnitine is efficiently retained in body tissues, playing a role in nutrient utilisation and thus on growth performance and body composition. The rate of lipid oxidation is determined by the energy requirements of working muscles and by the availability of free L-carnitine delivery to muscle mitochondria (8,9) . Since exogenous L-carnitine may influence energy utilis- ation efficiency, several studies using birds and mammals as animal models tested the effect of dietary L-carnitine supplementation on the exercise performance and on lipid metabolism (10 – 13) . Extra dietary L-carnitine has shown to improve, to a certain degree, the professional sport performances (14) and has improved exercise endurance in rats exposed to short and long-term exercise (15,16) . However, little is known about the effects of dietary L-carnitine supplements on the energy metabolism of exercised fish. Ozo ´rio et al. (17) working with the African catfish fed high-fat level (190 g/kg diet), showed that dietary L-carnitine supplementation alleviated fatigue during short-term exhaustive exercise by facilitating the recovery of muscle high-energy phosphates content (ATP and phosphocreatine). Ozo ´rio et al. (17) suggested that muscle ATP recovery was stimulated from body lipids. * Corresponding author: Rodrigo O. A. Ozorio, fax þ351 223390608, email [email protected] Abbreviation: FA, fatty acids. British Journal of Nutrition (2010), 103, 1139–1150 doi:10.1017/S0007114509993035 q The Authors 2009 British Journal of Nutrition
-
Upload
independent -
Category
Documents
-
view
0 -
download
0
Transcript of Effects of exercise on l-carnitine and lipid metabolism in African catfish ( Clarias gariepinus) fed...

Effects of exercise on L-carnitine and lipid metabolism in African catfish
(Clarias gariepinus) fed different dietary L-carnitine and lipid levels
Rodrigo O. A. Ozorio1*, Vincent J. T. Van Ginneken2, Rui J. B. Bessa3, Martin W. A. Verstegen4,
Johan A. J. Verreth5 and Elbertus A. Huisman5
1CIMAR/CIIMAR, Centro Interdisciplinar de Investigacao Marinha e Ambiental, Universidade do Porto, Rua dos Bragas 289,
4050-123 Porto, Portugal2Plant Research International, Agrosystems Research, PO Box 616, 6700 AP Wageningen, The Netherlands3CIISA, Faculdade de Medicina Veterinaria, Universidade Tecnica de Lisboa, Polo Universitario do Alto da Ajuda, 1300-477
Lisbon, Portugal4Wageningen University and Research Centre, Animal Nutrition Group, NL-6709 PG Wageningen, The Netherlands5Wageningen University and Research Centre, Fish Culture and Fisheries Group, NL-6700 AH Wageningen, The Netherlands
(Received 14 July 2009 – Revised 20 October 2009 – Accepted 21 October 2009 – First published online 24 November 2009)
African catfish (Clarias gariepinus) were fed four isonitrogenous diets (34 % crude protein), each containing one of two lipid (100 or 180 g/kg) and
two L-carnitine (15 or 1000 mg/kg) levels. After 81 d of feeding, thirty-two fish (body weight 32 g) from each dietary group were randomly
selected, sixteen fish were induced to a 3-h swim (speed of 1·5 body length (BL)/s), while the other sixteen fish were kept under resting condition.
Fish fed 1000 mg L-carnitine accumulated 3·5 and 5 times more L-carnitine in plasma and muscle, respectively, than fish fed the 15 mg L-carnitine.
Muscle L-carnitine content was significantly lower in exercised fish than in rested fish. High dietary lipid level (fish oil) led to an increase in
muscle n-3 PUFA content and a decrease in SFA and MUFA content. In liver, the increase in dietary lipid level resulted in an increased
levels of both n-6 and n-3 PUFA. L-carnitine supplementation significantly decreased n-3 PUFA content. Exercise decreased n-3 PUFA in
both muscle and liver. Plasma lactate and lactate dehydrogenase, normally associated with increased glycolytic processes, were positively corre-
lated with exercise and inversely correlated with dietary L-carnitine level. L-carnitine supplementation reduced significantly the RQ from 0·72 to
0·63, and an interaction between dietary L-carnitine and lipid was observed (P,0·03). Our results indicate that an increase in fatty acids (FA)
intake may promote FA oxidation, and both carnitine and exercise might influence the regulation of FA oxidation selectivity.
African catfish: L-carnitine metabolism: Lipid metabolism: Exercise
Fish are subjected to many changes in energy demandthroughout their lifespan. As the lipid content of their dietincreases so does the optimal dietary level of L-carnitine(1 – 3),a multi-physiological, bioactive additive compound, syn-thesised from two essential amino acids, protein-boundlysine and methionine. It is not entirely understood whetheranimals require exogenous L-carnitine, and over the past20 years, the scientific discussion regarding this subject con-tinued with ambiguous arguments.
L-Carnitine plays several important physiological roles likeshuttling the long-chain fatty acid (FA) across the inner mito-chondrial membrane for ATP production(4,5) and inhibition ofsuperoxide radical formation(6). According to Heo et al. (2,7),L-carnitine biosynthesis might be sufficient to maintaingrowth of 20-kg pigs during optimum husbandry conditions.Nevertheless, extra dietary L-carnitine is efficiently retainedin body tissues, playing a role in nutrient utilisation and thuson growth performance and body composition. The rate oflipid oxidation is determined by the energy requirements of
working muscles and by the availability of free L-carnitinedelivery to muscle mitochondria(8,9).
Since exogenous L-carnitine may influence energy utilis-ation efficiency, several studies using birds and mammalsas animal models tested the effect of dietary L-carnitinesupplementation on the exercise performance and onlipid metabolism(10 – 13). Extra dietary L-carnitine has shownto improve, to a certain degree, the professional sportperformances(14) and has improved exercise endurance inrats exposed to short and long-term exercise(15,16). However,little is known about the effects of dietary L-carnitinesupplements on the energy metabolism of exercised fish.Ozorio et al. (17) working with the African catfish fed high-fatlevel (190 g/kg diet), showed that dietary L-carnitinesupplementation alleviated fatigue during short-termexhaustive exercise by facilitating the recovery of musclehigh-energy phosphates content (ATP and phosphocreatine).Ozorio et al. (17) suggested that muscle ATP recovery wasstimulated from body lipids.
*Corresponding author: Rodrigo O. A. Ozorio, fax þ351 223390608, email [email protected]
Abbreviation: FA, fatty acids.
British Journal of Nutrition (2010), 103, 1139–1150 doi:10.1017/S0007114509993035q The Authors 2009
British
Journal
ofNutrition

Simultaneous respirometric measurements using the differ-ential concentration of O2, CO2 and total ammonia nitrogenis useful tool to accurately determine substrate preferencesunder forced swimming activity(18 – 20). The oxygen consump-tion of swimming fish will increase considerably above itsresting level. The level of the RQ (RQ ¼ CO2produced/O2consumed) indicates the type of fuel being utilised underdifferent metabolic conditions. The RQ for the catabolism ofcarbohydrates, lipids, and protein are 1·0, 0·7 and about 0·8,respectively. Under resting conditions, the RQ of rainbowtrout (Oncorhynchus mykiss), goldfish and African catfishrange from 0·83 to 1·0(21,22). When African catfish is fedextra L-carnitine, RQ and total ammonia nitrogen tend todecrease, indicating better use of lipids and a decrease of pro-tein catabolism, the so-called protein sparing action.
The aim of the present study was to study the combinedeffect of dietary L-carnitine and lipid levels on lipid metab-olism in the African catfish (Clarias gariepinus) exposed toforced swimming exercise, a condition common both innature and in intensive aquaculture systems.
Materials and methods
This experiment was approved by the Ethical Committee Jud-ging Animal Experiments (DEC) of Wageningen University.
Fish and facilities
The experiment was conducted in the experimental facility,‘De Haar vissen’ of the Wageningen University, The Nether-lands. The African catfish (C. gariepinus) had a startingweight of 8·4 (SEM 0·3) g. The experimental animals were sib-lings with an identical nutritional history. The fish were keptin sixteen glass aquaria of 70 litres each, connected to a recir-culation system. Water temperature (25·2 ^ 0·68C) and elec-tric conductivity (6·5 ^ 1·2 mS/cm) were daily checked.
Dissolved oxygen (11·1 (SEM 2·0) mg/l), pH (7·3 (SEM 0·3)),NHþ
4 (0·2 (SEM 0·2) mg/l), NO3 (137·5 (SEM 78·9) mg/l) andNO2 (0·2 (SEM 0·2) mg/l) were weekly checked.
Experimental diet and design
Four diets were selected to test two L-carnitine levels (15 or1000 mg/kg) and two lipid levels (100 or 180 g/kg; Table 1).Carniking (50 % L-carnitine, 35 % silica and 15 % water,Lonza) was used to increase the dietary carnitine level. Allthe diets were isoproteic (336–340 g crude protein/kg diet)and had equal amounts of fishmeal. To obtain a basal dietwith low L-carnitine level, fishmeal (main L-carnitine sourceingredient) was kept at low level (153 g/kg diet). Thus, toobtain isoproteic diets at 340 g/kg, gluten, feather meal andblood meal was adjusted accordingly. To keep the dietsclose to isoenergetic (20 MJ/kg) at different lipid levels, cape-lin oil was exchanged by starch and wheat. Fat levels were setat the out margins of the accepted inclusion range for Africancatfish(23). In addition, to enhance the effects of dietaryL-carnitine supplementation, biosynthesis was set to a mini-mum by formulating diets with a low, but sufficient, lysinelevels. The later was achieved by using a combination ofwheat meal and maize gluten as primary protein sources.
The experiment was carried out according to a 2 £ 2 factor-ial design with four replications each. Fish were acclimatedfor 7 d to the laboratory conditions before the feeding trial.During the acclimatisation period, fish were fed close toapparent satiation with the experimental diet containing100 g lipid/kg diet and non-supplemented L-carnitine level(14 mg/kg). Thereafter, fish were randomly allocated to six-teen aquaria (forty-five fish/aquarium) and hand-fed twice aday with one of the four experimental diets for 81 d. Feed con-sumption and dead fish were recorded on a daily basis.
After the feeding trial, thirty-two fish from each dietarygroup were randomly selected, sixteen of them were inducedto a 3-h swim (speed of 1·5 BL/s) in a Blazka swimmingtunnel, previously described by Van Ginneken(24), and the
Table 1. Ingredients, proximate composition and fatty acid (FA)content of diets containing different L-carnitine (15 or 1000 mg/kg) andlipid (100 or 180 g/kg) levels*
L-Carnitine 15 1000
Lipid 100 180 100 180
IngredientsFishmeal 153·1 152·9 153·1 152·9Feather meal 102·0 – 102·0 –Gluten 183·7 314·0 183·7 314·0Wheat 133·7 213·0 133·7 213·0Pregelatinised maize starch 255·1 86·6 255·1 86·6Capelin oil 56·1 122·3 56·1 122·3Vitamin and mineral premix† 5·1 5·1 5·1 5·1Durabon binder 25·5 24·5 25·5 24·5Cellulose 84·7 80·6 84·7 80·6Carniking (mg/kg)‡ – – 1600 1600
Chemical compositionDM 985·1 988·3 985·1 988·3Crude protein 335·9 339·2 335·9 339·2Crude lipid 106·9 185·75 106·9 185·75Ash 135·1 133·4 135·1 133·4Carbohydrate§ 326·0 240·3 326·0 240·3Gross energy (MJ/kg) 19·2 21·6 19·4 21·5Lys 11·4 11·5 11·7 11·4Met 3·24 2·56 5·58 2·87L-Carnitine (mg/kg) 14·3 17·1 972·0 1071·0
FA (g/kg)14 : 0 3·16 5·93 3·19 6·2116 : 0 12·21 21·97 12·31 22·7318 : 0 2·11 3·38 2·21 3·5016 : 1 3·64 6·51 3·50 6·8718 : 1 13·61 24·24 14·08 25·1120 : 1 2·30 5·40 2·34 5·6922 : 1 3·55 8·48 3·65 8·6918 : 2n-6 6·62 10·53 6·76 11·0418 : 3n-3 0·78 1·48 0·76 1·5618 : 4n-3 1·42 2·89 1·39 3·0820 : 5n-3 5·56 10·11 5·57 10·6922 : 5n-3 0·56 0·87 0·57 1·0322 : 6n-3 5·34 10·86 5·30 11·39P
SFA 18·12 32·53 18·37 33·77PMUFA 23·73 45·97 24·23 47·67P(n-6) 7·50 12·03 7·54 12·64P(n-3) 13·99 27·00 13·96 28·59
* Values are expressed as g/kg as fed basis, unless otherwise stated.† Ingredient supplied per kilogram of feed. Vitamins: 774 mg Vitamin A; 6·25 mg
vitamin D; 20 000 mg vitamin E. Minerals: 501 mg CuSO4; 15 000 mg ZnSO4;0·01 mg MnSO4; 500 CoSO4; 500 mg KI; 35 mg Na2SeO3.
‡ 65 % L-carnitine, 20 % silica and 15 % water. Provided by Lonza Group Ltd(Basel, Germany and Switzerland).
§ Gelatinised starch plus glucose was determined according to Goelema et al. (83).
R. O. A. Ozorio et al.1140
British
Journal
ofNutrition

results were compared with the sixteen rested fish. The samehandling procedures were performed on all fish to imposesimilar levels of stress on all animals before the swimmingexperiment.
The Blazka swimming tunnel (Fig. 1) had a length of200 cm and consists of two tubes. The diameter of the outerand inner (the actual swimming tube) tubes were 28·8 and19·0 cm, respectively, with a total volume of 127 litres. Theengine power was 400 W and the propeller consisted ofthree blades of 7·5 in. with a pitch of 7 in. The motor speedcorresponding to 1·5 BL/s was calculated by the followingequation: Y ¼ 0·001307 £ X 2 0·01 724, elucidated by Laser-Doppler techniques at the Hydraulics Laboratory TU (Delft,The Netherlands), where: Y ¼ water velocity in meter persecond; X ¼ rpm of the engine of the Blazka swim tunnel.Here 0·001307 and 0·01 724 are constants relating to thesize of the tunnel and motor. This equation relates thenumber of rpm of the motor with the mean water velocity inthe tunnel.
Sampling, measurements and analytical procedure
During the feeding trial, animals were weighed at the start andat the end of the experiment and total feed intake were deter-mined for each aquarium at the end of the trial. Before everysampling, fish were fasted for 24-h, anaesthetised with tricainemethane sulphonate (Crescent Research Chemicals, Phoenix,AZ, USA), individually weighed and measured. The initial(twenty fish from the initial stock population) and finalsamples (thirty fish/treatment) of whole body were taken andstored at 2208C. During the final sampling, dorsal musclesample and whole liver were withdrawn from nine fish pertreatment, individually weighed and stored at 2808C pendinganalyses.
Diet and muscle tissue were homogenised with a meatmincer, liver samples were pooled per aquarium before the
homogenisation using an Ultra Torax. Blood (0·5 ml/fish)was collected from the caudal vein, centrifuged (10 min at1500 g, 48C) and plasma immediately stored at 2208C.After blood sampling, fish were sacrificed with an overdoseof tricaine methane sulphonate buffered with NaHCO3
(0·3 g þ 0·4 g/l water).L-Carnitine was determined for diets, muscle and plasma
according to Christiansen & Bremer(25). In brief, L-carnitineanalyses were performed by radiometric detection of free andL-carnitine esters. The assay is based on the reaction of freeL-carnitine with acetyl-CoA catalysed by L-carnitine acetyl-transferase with the production of acetyl L-carnitine and coen-zyme A. All the samples were deproteinated with perchloricacid, subsequently neutralised with KOH, centrifuged and thesupernatant was collected. L-carnitine was extracted by step-wise heating, ultrasonic treatment or extraction with variousdetergents. Additionally, alkaline hydrolysis was performedfor the determination of L-carnitine esters.
DM (4 h at 1038C), ash (6 h at 5508C), protein (macro-Kjel-dahl N £ 6·25), lipid (petroleum diethyl ether extraction usingSoxlet) and energy (bomb calorimetry) analyses were deter-mined for diets, muscle and liver samples.
FA concentrations of the diets, muscle and liver were deter-mined as FA methyl esters according to Ozorio et al. (26).Freeze-dried sample (0·2 g/fish) and internal standard(1·99 mg Tricosanoic acid methyl ester (23:0)/ml hexane)were saponified and esterified (dry bath, 228C for 90 min)with methanolic KOH and the methyl esters extracted intohexane (1 hexane:1 KOH). Supernatant hexane was thenseparated and taken for automatic injection (2ml/sample) ina gas chromatograph (Varian 3300) with a cross linked30 m £ 0·25 mm column silicate type, internal diameter of0·53 mm and H2 as the carrier gas. The injection and detectortemperatures were 2808C and peak identification and quantifi-cation was done by using the relative retention times of thereference FA methyl esters standards.
Fig. 1. Schematic drawing of a 2·0-m swim-tunnel. The tunnel consists of two concentric perspex tubes of 2 m and two PVC end-caps. A, electromotor; B, propel-
ler; C, perspex outer swim-tunnel tube; D, perspex inner swim-tunnel tube; E, PVC end-streamer; F, animal compartment; G, PVC front streamer. The propeller
pushes water into the outer ring and ‘sucks it’ out from the inner tube. The cross-section area of the inner tube and of the outer ring has the same surface area.
This results in equal flow rates at both sides. The turbulent water is pushed through streamers that have internal diameters of about 10 mm.
Lipid and carnitine in exercised catfish 1141
British
Journal
ofNutrition

Plasma analyses were carried out for total protein (colori-metric method, Roche Diagnostics GmbH, Mannheim,Germany), TAG (colorimetric method, Boehringer MannheimGmbh Diagnostica, Mannheim, Germany), cholesterol (choles-terol esterase colorimetric method, Boehringer MannheimGmbh Diagnostica), lactate dehydrogenase (kinetic determi-nation of the LDH activity, Boehringer Mannheim GmbhDiagnostica), lactate (enzymatic method, Roche DiagnosticsGmbH), urea (urease–glutamate dehydrogenase reaction, Boeh-ringer Mannheim). All the above plasma assays were carriedout using a Hitachi 717 Automatic Analyser from BoehringerMannheim. Plasma glucose levels were determined with depro-teinated samples by the GOD method (Boehringer MannheimGmbh Diagnostica) and NEFA were determined by NEFA-C-Test kit (WAKO, GmbH, Germany) using ELISA reader at420 nm-wave length. Plasma cortisol levels were measuredby RIA(27).
During the forced swimming trial, the RQ (RQ ¼ CO2produced/O2consumed) and nitrogen quotient (NQ ¼ Nproduced/O2consumed)were determined by using an automated auto analyser (SkalarB.V., Breda, The Netherlands) according to Ozorio et al. (22).
Table
2.
Eff
ects
of
die
tary
L-c
arn
itin
e(1
5or
1000
mg/k
g)
and
lipid
(100
or
180
g/k
g)
levels
and
exerc
ise
on
free
and
este
rified
L-c
arn
itin
econte
nt
inm
uscle
(mg/k
g)
and
pla
sm
a(m
mol/l)
of
Afr
ican
catfi
sh
(Clariasgariepinus)
Resting
Exerc
ised
L-C
arn
itin
e15
1000
15
1000
AN
OV
A
Lip
id100
180
100
180
SE
M100
180
100
180
SE
ML-C
LE
C£
L
Muscle
Fre
e111
138
432
599
7102
111
403
564
13
,0·0
001
,0·0
001
0·0
4,
0·0
001
Este
rified
120
206
565
623
10
124
139
572
568
12
,0·0
001
0·0
3–
–P
lasm
aF
ree
1·7
51·7
35·6
7·2
50·2
81·8
81·7
85·7
7·0
50·2
6,
0·0
001
0·0
3–
0·0
2E
ste
rified
1·8
32·2
34·7
38·1
50·6
72·3
82·0
55·3
56·8
0·4
6,
0·0
001
––
–
SE
M,
poole
dsta
ndard
err
or
of
mean:
sta
ndard
devia
tion/pn;
L-C
,L-c
arn
itin
e;
L,
lipid
;E
,exerc
ise;
–,
NS
.
Fig. 2. Relationship between muscle and plasma total L-carnitine content
(thirty-two observations). y ¼ 0·0115x þ 0·7474; R 2 0·94.
Table 3. Effects of dietary L-carnitine (15 or 1000 mg/kg) and lipid(100 or 180 g/kg) levels on growth performance and feed utilisation ofAfrican catfish (Clarias gariepinus)
Dietary L-carnitine 15 1000
Dietary lipid 100 180 100 180 SEM
Initial weight (g) 8·4 8·4 8·5 8·4 0·1Final weight (g) 29·2 31·7 27·1 29·6 0·8DGI (% BW/d)* 1·27 1·38 1·18 1·29 0·03VFI (% BW/d)† 2·40 2·31 2·11 1·99 0·06FCR (g/g) ‡ 1·79 1·63 1·65 1·48 0·05PER (g/g)§ 1·67 1·83 1·83 2·05 0·06HSI (% BW)k 4·1 4·4 3·7 4·1 0·1Condition factor{ 0·6 0·6 0·6 0·6 0·0Mortality (%) 13·9 9·4 11·1 11·7 3·2
DGI, daily growth index; BW, body weight; VFI, voluntary feed intake; FCR, feedconversion ratio; PER, protein efficiency ratio; HSI, hepatosomatic index.
SEM, pooled standard error of mean: standard deviation/pn.
* DGI ¼ (FBW1/3 2 IBW1/3/(t), where IBW, initial BW; FBW, final BW; t, trial duration.† VFI ¼ feed [(100) (intake/average BW (ABW)/(t)], where ABW ¼ (IBW þ FBW)/2.‡ FCR ¼ total dry feed intake (g)/total wet weight gain (g).§ PER ¼ wet weight gain (g)/crude protein intake (g).kHSI ¼ liver weight £ 100/BW (%).{K ¼ [(100)(FBW, g)/(Lt3, cm)], where Lt is the final standard length.
R. O. A. Ozorio et al.1142
British
Journal
ofNutrition

Statistical analysis
The data were analysed as 3 £ 2 factorial using a generallinear model (Proc GLM, SAS, Cary, NC, USA) that includedthe effect of exercise (resting and swimming), dietaryL-carnitine (15 and 1000 mg/kg diet) and dietary lipid(100 and 180 g/kg diet) as main factors and their interactions.Differences between means were reported as significant ifP,0·05, using Bonferroni’s multiple t tests. Normality wastested using Shapiro–Wilk test. Homogeneity was checkedusing the absolute residuals according to Levene’s test.Non-homogeneous data were arcsine transformed beforefurther statistical analysis.
Results
Fish fed 1000 mg L-carnitine accumulated 3·5-fold more L-car-nitine in plasma than fish fed 15 mg L-carnitine did (Table 2).Exercise had no detectable effect on total, free or esterifiedL-carnitine levels in plasma. Dietary L-carnitine significantlyincreased the L-carnitine levels in muscle by 5-fold. Therewas a strong interaction between dietary L-carnitine andlipid levels, resulting in a steep increase in the free L-carnitinecontent with increasing dietary lipid level. Exercised fishretained significantly less free L-carnitine in muscle whencompared with rested fish. Muscle total L-carnitine contentwas positively correlated to plasma total L-carnitine content(Fig. 2). The relationship between muscle and plasma L-carni-tine content was fitted using a linear regression, described asY ¼ 0·0115X þ 0·7474, R 2 0·94. Plasma L-carnitine contentalso increased moderately when muscle L-carnitine accumu-lated from 200 to 500 mg/kg, thereafter a sharp increase inplasma L-carnitine with increase in muscle L-carnitine wasobserved.
Depending upon the dietary treatment, fish grew from theinitial 8·4 g to a mean final body weight of 27–32 g(Table 3). Growth rates varied between 1·18 and 1·38 %body weight/d. The average mortality during the experimentranged from 9 to 14 % with no effect of diet. Dietary L-carni-tine and lipid content had no significant effect on growthperformance and feed utilisation.
Liver and muscle proximate composition was significantlyaffected as a result of experimental treatments (Table 4).DM content increased with the dietary lipid (P,0·0003) anddecreased with the dietary L-carnitine (P,0·009). Protein con-tent was inversely related with the dietary lipid (P,0·0001)and a three-way interaction was observed. Liver lipid contentincreased with increasing dietary lipid (P,0·0003) anddecreased with the L-carnitine levels (P,0·0007). Exercisedid not alter the lipid content in liver. Liver energy wassignificantly affected by all experimental treatments.
The effects of dietary composition and exercise were lessevident in muscle proximate composition than in liver.Dietary lipid and L-carnitine levels did not affect musclelipid content. Exercised fish tended to have higher DM content(248–256 g/kg) than non-exercised fish (235–246 g/kg).Exercised fish retained significantly more lipid than non-exercised fish, and an interaction between dietary lipid andexercise was observed.
FA content (mg/g lipids) in muscle (Table 5) and liver(Table 6) were influenced by exercise and dietary treatments.T
able
4.
Eff
ects
of
die
tary
L-c
arn
itin
e(1
5or
1000
mg/k
g)
and
lipid
(100
or
180
g/k
g)
levels
and
exerc
ise
on
pro
xim
ate
com
positio
n*
of
muscle
and
liver
of
Afr
ican
catfi
sh
(Clariasgariepinus)
Resting
Exerc
ised
L-C
arn
itin
e15
1000
15
1000
AN
OV
A
Lip
id100
180
100
180
SE
M100
180
100
180
SE
ML-C
LE
L£
EL-C
£L£
E
Liv
er
DM
501
·9537
491
502
10
502
534
485
520
70·0
09
0·0
003
––
–C
rude
pro
tein
77
·363·2
74
·870
·81·0
72
·864·2
75·8
66
·80·7
–0·0
001
––
0·0
48
Cru
de
lipid
354
·8373·9
323
·7364·4
10·1
363
·9376·4
337·3
345
·38·4
0·0
007
0·0
003
––
–A
sh
7·0
6·0
7·0
6·5
0·1
6·0
5·0
6·5
5·5
0·1
––
0·0
001
––
Gro
ss
energ
y(M
J/k
g)
16
·617·1
16
·117
·10·3
16
·116·6
15·6
16
·10·3
0·0
20·0
001
0·0
1–
–M
uscle
DM
237
242
235
246
4248
256
252
251
4–
–0·0
009
––
Cru
de
pro
tein
156
·9155·5
157
·4149·1
1·0
153
·3150·0
151·2
152
·60·7
––
0·0
002
––
Cru
de
lipid
54
·556·2
54
·362
·12·9
61
·460·9
59·7
55
·52·6
––
0·0
20·0
45
–A
sh
19
·018·7
18
·718
·20·2
17
·517·5
17·5
17
·80·1
––
––
–G
ross
energ
y(M
J/k
g)
5·9
5·9
5·9
5·9
0·1
5·5
5·7
5·5
5·5
0·1
––
––
–
SE
M,
poole
dsta
ndard
err
or
of
mean:
sta
ndard
devia
tion/pn;
L-C
,L-c
arn
itin
e;
L,
lipid
;E
,exerc
ise;
–,
NS
.*V
alu
es
are
g/k
gunle
ss
oth
erw
ise
sta
ted,
wet
weig
ht
basis
.
Lipid and carnitine in exercised catfish 1143
British
Journal
ofNutrition

In muscle, L-carnitine supplementation increased the contentof most FA, whereas high dietary lipid level increased the n-3PUFA and decreased the SFA and MUFA. The effect of exerciseon muscle FA content was less pronounced but exercisedecreased n-3 PUFA and tended (P,0·06) to decrease SFA.None of the interactions between main factors were significant.
In liver, L-carnitine supplementation decreased the n-3PUFA and tended (P,0·07) to increase MUFA, whereashigh dietary lipid level increased the n-3 PUFA and decreasedthe SFA and MUFA. However, a significant interactionbetween dietary levels of L-carnitine and lipids were observedfor most of the n-3 PUFA, and also 18 : 2n-6 and 22 : 1n-11.All these FA increased with the level of lipid in the diet,but the increase was higher in fish fed non-supplemented L-carnitine diet (Fig. 3). Exercised fish had lower n-3 PUFAlevels in liver than non-exercised fish.
Table 7 shows the means of selected plasma parameters offish fed different experimental diets, with or without swim-ming exercise. Dietary L-carnitine combined with exerciseevoked significant changes on several plasma metabolites,such as cholesterol, lactate, lactate dehydrogenase, NEFAand cortisol. Cholesterol levels increased with increasingdietary L-carnitine. Plasma lactate decreased with increasingdietary L-carnitine. Plasma lactate and lactate dehydrogenaseshowed a significant increase during exercise. Plasma cortisolwas significantly lower in the resting fish (63mg/l) whencompared with exercised fish (166mg/l). There were inter-actions between dietary L-carnitine, lipid and exercise
(P,0·02) on plasma cortisol and NEFA levels. Plasma pro-tein and glucose levels were not affected by dietary treat-ments or exercise also L-carnitine and exercise tended todecrease plasma urea. Plasma TAG were slightly higher infish fed 1000 mg L-carnitine and tended to decrease withexercise.
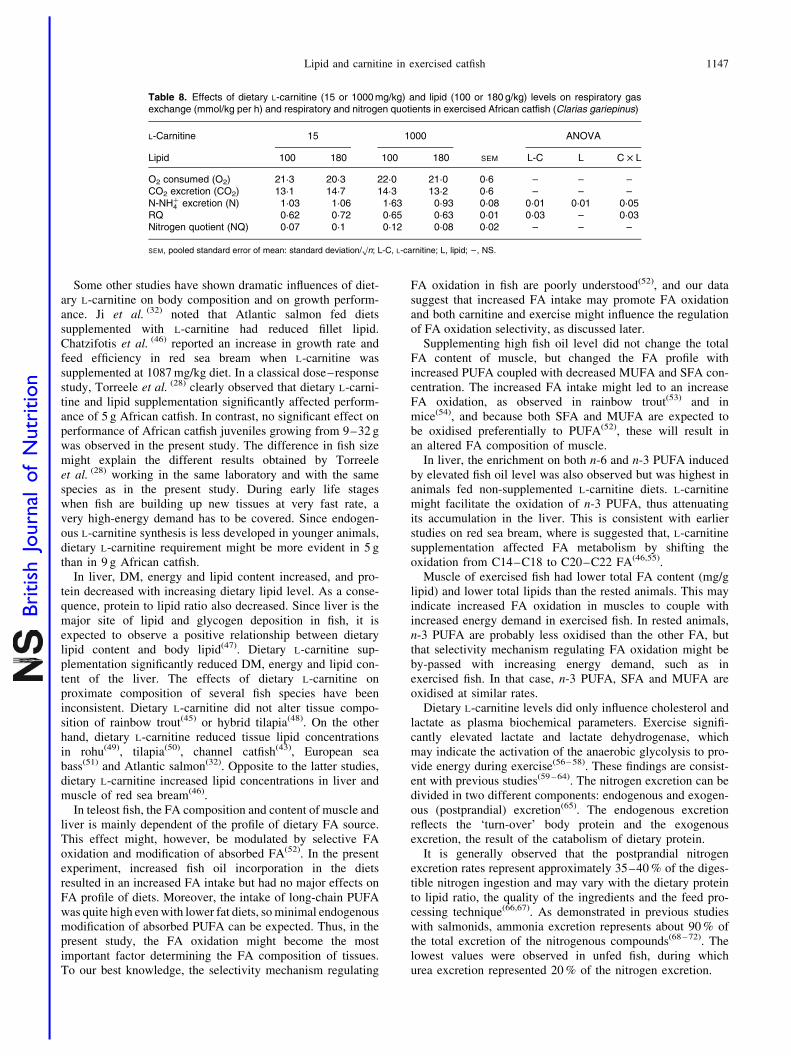
The effects of dietary L-carnitine and lipid supplements ongas exchange, respiratory and nitrogen quotients in exercisedAfrican catfish is depicted in Table 8. During exercise, theO2 uptake tended to increase with dietary L-carnitine sup-plementation. The changes in O2 uptake led to a RQ rangingfrom 0·62 to 0·72. Dietary L-carnitine supplementation signifi-cantly reduced the RQ from 0·72 to 0·63, and an interactionbetween dietary L-carnitine and lipid was observed (P,0·03).
Nitrogen (N-NHþ4 ) excretion was significantly influenced by
the dietary L-carnitine and lipid level (P,0·01). In groupssupplemented with 1000 mg L-carnitine, nitrogen excretionwas significantly reduced when fed 180 g lipid/kg diet (0·93and 1·06 mmol/kg per h) compared with fish fed 100 g lipid(1·03 and 1·63 mmol/kg per h), and an interaction betweendietary L-carnitine and lipid levels was observed (P,0·05).The nitrogen quotient ranged from 0·07 to 0·12 and was notaffected by the dietary treatment.
Discussion
L-Carnitine is available from endogenous biosynthesis andfrom dietary sources. The body distribution of L-carnitine is
Table 5. Effects of dietary L-carnitine (15 or 1000 mg/kg) and lipid (100 or 180 g/kg) levels and exercise on total fatty acid (FA) concentration (mg/gmuscle and mg/g lipids) and individual FA composition (mg/g lipids) of African catfish (Clarias gariepinus) muscle
Carnitine Lipid Exercise
15 1000 100 180 Resting Exercise SEM C L E
FAFA (mg/g muscle) 174·0 184·0 178·0 179·0 181·0 177·0 0·0 – – –FA (mg/g Lipids) 718·0 785·0 768·0 734·0 773·0 729·0 15·2 0·004 – 0·05014 : 0 24·0 26·4 23·8 26·6 25·9 24·5 0·51 0·003 ,0·001 0·05016 : 0 172·0 191·0 197·0 167·0 187·0 176·0 3·7 0·001 ,0·001 –18 : 0 39·9 44·8 46·6 38·1 43·5 41·2 1·0 0·002 ,0·001 –16 : 1n-7 36·8 41·0 42·2 35·6 39·8 38·0 0·8 0·001 ,0·001 –18 : 1n-9 151·0 166·0 173·0 145·0 163·0 155·0 3·5 0·005 ,0·001 –18 : 1n-7 16·8 18·6 18·7 16·7 18·4 17·0 0·4 0·002 ,0·001 0·01320 : 1n-9 20·1 21·6 18·6 23·1 21·6 20·1 0·4 0·015 ,0·001 0·02222 : 1n-11 15·4 17·0 13·3 19·0 16·6 15·7 0·4 0·007 ,0·001 –18 : 2n-6 59·3 63·7 61·6 61·4 63·9 59·0 1·4 0·037 – 0·01918 : 3n-6 1·36 1·34 1·25 1·44 1·37 1·33 0·04 – 0·002 –20 : 2n-6 2·64 2·85 2·61 2·87 2·68 2·82 0·08 – 0·027 –20 : 3n-6 2·93 3·24 3·69 2·47 3·21 2·96 0·09 0·021 ,0·001 –20 : 4n-6 3·21 3·57 3·48 3·29 3·59 3·19 0·10 0·019 – 0·01022 : 2n-6 3·92 4·21 4·38 3·76 3·37 4·77 0·25 – – ,0·00118 : 3n-3 6·10 6·58 5·75 6·92 6·54 6·13 0·14 0·018 ,0·001 0·04018 : 4n-3 8·47 8·77 7·21 10·0 8·89 8·34 0·21 – ,0·001 –20 : 3n-3 0·69 0·74 0·60 0·82 0·73 0·70 0·03 – ,0·001 –20 : 4n-3 3·49 3·86 3·17 4·19 3·78 3·57 0·09 0·011 ,0·001 –20 : 5n-3 30·3 31·1 27·6 33·8 32·1 29·4 0·6 – ,0·001 0·00622 : 5n-3 8·38 9·11 8·38 9·10 9·00 8·47 0·18 0·007 0·008 0·04322 : 6n-3 74·1 79·9 69·6 84·4 80·1 73·8 1·6 0·018 ,0·001 0·011Total SFA 242·0 269·0 273·0 237·0 263·0 248·0 5·2 0·001 ,0·001 –Total MUFA 252 278 277 253 272 258 5·5 0·004 0·004 –n-6 73·4 78·9 77·0 75·3 78·2 74·1 1·70 0·032 – –n-3 131 140 122 149 141 130 2·7 0·037 ,0·001 0·010Total PUFA 205 219 199 225 219 204 4·4 0·033 ,0·001 0·025
SEM, pooled standard error of mean: standard deviation/pn; n-3 and n-6, total FA of (n-3) or (n-6) series; L-C, L-carnitine; L, lipid; E, exercise; –, NS.
R. O. A. Ozorio et al.1144
British
Journal
ofNutrition

determined by a series of systems that transport L-carnitineinto cells against a concentration gradient, and the liverplays a unique role in the whole-body L-carnitine homeostasis.In the present study, the levels of dietary L-carnitine (15 and1000 mg/kg) were selected to represent the below and aboveoptimal level for catfish(26,28). L-Carnitine deficiency can beobtained by decreasing synthesis(5), increasing excretion(29)
or by reducing dietary L-carnitine availability. In the presentstudy, L-carnitine deficiency was induced by limiting dietarylysine level to a sub-optimum level, so as to restrict biosyn-thesis and reducing dietary L-carnitine availability(5).Ozorio(30,31) and Harpaz(4) suggested that when limiting thelevel of L-carnitine precursor, L-carnitine supplementationmight compensate for the low level of a dietary precursor.The optimal L-carnitine level seems to vary and depends onseveral biotic and abiotic factors, such as age, diet, metabolicconditions and tissue dependence on FA oxidation.
In the present study, free and acyl L-carnitine contentsin muscle and plasma were linearly correlated with dietaryL-carnitine level (3 to 5 times greater in the L-carnitinesupplemented groups than in the non-supplemented groups).The ability to take up and retain dietary L-carnitine was pre-viously observed in African catfish(17,26), as well as in Atlanticsalmon(32), red sea bream(33), rabbits(34), piglets(35), rats(36),among others.
L-Carnitine concentrations are typically higher in tissuesthan in extracellular fluid compartments(5). Indeed, in the
present study the concentration of L-carnitine was over50 times higher in skeletal muscle than that in plasma. Freeand acyl L-carnitine content in skeletal muscle was linearlycorrelated (R 2 0·91) with plasma L-carnitine, indicating thatL-carnitine supplements were taken up by tissues and availablefor intermediary metabolism. Since L-carnitine determination
Table 6. Effects of dietary L-carnitine (15 or 1000 mg/kg) and lipid (100 or 180 g/kg) levels and exercise on total fatty acid (FA) concentration (mg/gtissue and mg/g lipids) and individual FA composition (mg/g lipids) of African catfish (Clarias gariepinus) liver
Carnitine Lipid Exercise
15 1000 100 180 Resting Exercise SEM C L E
FAFA (mg/g liver) 448 438 418 467 447 439 8 – ,0·001 –FA (mg/g lipids) 611 643 609 645 635 619 14·1 – – –14 : 0 12·1 12·2 10·4 13·8 12·4 11·9 0·269 – ,0·001 –16 : 0 188 206 202 192 200 194 4·5 0·008 – –18 : 0 41·7 44·9 44·3 42·3 43·0 43·6 1·50 – – –16 : 1n-7 41·7 46·0 48·2 39·6 44·8 43·0 1·09 0·008 ,0·001 –18 : 1n-9 186 199 202 183 193 192 5·62 – 0·027 –18 : 1n-7 14·3 16·1 15·5 15·0 15·4 15·1 0·30 ,0·001 0·252 –20 : 1n-9 13·6 14·1 11·9 15·9 13·9 13·8 0·31 – ,0·001 –22 : 1n-11 2·39 2·25 1·27 3·37 2·37 2·26 0·046 0·039 ,0·001 –18 : 2n-6 23·8 22·4 15·9 30·3 23·7 22·5 0·66 – ,0·001 –18 : 3n-6 1·05 0·96 0·76 1·25 1·04 0·97 0·035 0·054 ,0·001 –20 : 2n-6 3·05 3·04 2·40 3·68 3·05 3·03 0·055 – ,0·001 –20 : 3n-6 4·66 4·70 4·11 5·26 4·81 4·55 0·101 – ,0·001 –20 : 4n-6 1·60 1·58 1·41 1·76 1·71 1·46 0·059 – ,0·001 0·00622 : 2n-6 7·47 7·53 8·13 6·89 6·85 8·16 0·485 – – –18 : 3n-3 1·70 1·46 0·75 2·40 1·64 1·52 0·057 0·005 ,0·001 –18 : 4n-3 0·66 0·52 0·31 0·87 0·64 0·54 0·032 0·005 ,0·001 0·02820 : 3n-3 0·53 0·58 0·35 0·75 0·57 0·53 0·030 – ,0·001 –20 : 4n-3 1·88 1·52 0·65 2·75 1·81 1·59 0·072 0·001 ,0·001 0·03420 : 5n-3 7·17 5·30 2·98 9·49 6·61 5·87 0·198 ,0·001 ,0·001 0·01422 : 5n-3 5·75 4·49 2·65 7·59 5·28 4·96 0·154 ,0·001 ,0·001 –22 : 6n-3 31·2 28·1 17·1 42·1 31·8 27·4 0·89 0·020 ,0·001 0·002Total SFA 244 266 259 252 258 253 6·1 0·018 – –Total MUFA 266 285 285 266 277 274 7·1 – – –Total n-6 41·6 40·2 32·7 49·1 41·2 40·7 0·85 – ,0·001 –Total n-3* 48·9 41·9 24·8 66·0 48·3 42·4 1·27 ,0·001 ,0·001 0·003Total PUFA 90·5 82·2 57·5 115 89·5 83·1 1·90 0·005 ,0·001 0·024
SEM, pooled standard error of mean: standard deviation/pn; L-C, L-carnitine; L, lipid; E, exercise; –, NS.
* Significant (P,0·05) interaction between L-carnitine and lipid.
Fig. 3. Combined effects of dietary lipid (100 £ 180 g/kg) and L-carnitine levels
(15 £ 1000 mg L-carnitine/kg diet) on liver total n-3 PUFA. a,b,c Values with
unlike letters were significantly different (P , 0·05).
Lipid and carnitine in exercised catfish 1145
British
Journal
ofNutrition

in plasma samples is a non-invasive method (favouringrepeated measurements throughout the experimental period),the relation between plasma and muscle L-carnitine levelswas validated from the results obtained from previousstudies(3,17,22,26), and because muscle tissue is the mainstorage site of L-carnitine, it is plausible to infer that plasmaL-carnitine content can be a good indicator of muscle L-carni-tine content in African catfish.
Dietary lipid supplementation appears to elevate L-carnitinelevels in the African catfish. Changes in optimal L-carnitinelevel are correlated with changes in the amount of circulatingL-carnitine. The size of L-carnitine pool in animals is main-tained by a combination of L-carnitine from supplementalsources, a modest rate of biosynthesis and an efficient reab-sorption(5). In the present study, an increase in the dietarylipid level caused a 30 % increase in muscle and in plasmaL-carnitine content. In human subjects, plasma L-carnitineconcentration is higher after a high-fat or high-proteindiet(37). As a consequence, more L-carnitine is reabsorbed,however, at lower efficiency rate. Berger & Sachan(38)
observed that the efficiency of L-carnitine reabsorption inrats decreased with increasing levels of circulating L-carnitine,thus more L-carnitine is excreted. These observations suggestthat dietary lipid levels may increase L-carnitine deposition,although body esterified L-carnitine level is often sub-estimated due to losses from excretion.
In fish, plasma and muscle L-carnitine contents increasedwith dietary L-carnitine level(3,22,39), as has been also observedfor other species(2,40). Gaylord & Gatlin(39) showed that hybridstriped bass fed 3000 mg L-carnitine/kg diet, had differencesranged from 11 to 61 mg L-carnitine/g muscle for fish fed5 and 20 % lipid, respectively. The mechanism by whichthis occurs is not clear, but it seems that L-carnitine transportand utilisation may be influenced by dietary lipid level.
Exercise significantly altered the free L-carnitine levels inmuscle tissue. From rest to 3-h of swimming at 1-BL/s,muscle free L-carnitine content decreased from 6 to 20 %.Hiatt et al. (41) observed in human subjects that from rest to10 min of high-intensity exercise, free L-carnitine contentdecreased by 66 %. According to Hiatt et al. (41), the alterationof the ratio esterified-to-free is dependent on the workload andis poorly reflected in the plasma and urine carnitine pools. Inthe present study, however, exercise did not affect the ratioesterified-to-free L-carnitine. Presumably, the workloadapplied to catfish was not very intense, and an extension ofthe swimming trial would have caused a more drasticalteration.
In the present study, the amount of lysine was 1·1 %, incomparison to the optimal 1·5 % as determined for catfish(42).Burtle & Liu(43) investigated the effects of 0·1 % dietary L-car-nitine in diets containing 1·1, 1·4 and 1·7 % dietary lysine inchannel catfish. L-Carnitine did not cause any effects on thegrowth rate, but a combination of L-Carnitine and lysinereduced body lipid content and visceral fat and increasedbody protein.
In the present study, L-Carnitine supplements had no cleareffect on growth, but clearly affected the lipid and energy con-tent in liver. The limited influence of L-Carnitine on Africancatfish growth and feed efficiency has been noted in a previousstudy in African catfish(26), as well as in other fishspecies(33,44,45).T
able
7.
Eff
ects
of
die
tary
L-c
arn
itin
e(1
5or
1000
mg/k
g)
and
lipid
(100
or
180
g/k
g)
levels
and
exerc
ise
on
sele
cte
dpla
sm
ain
dic
es
inA
fric
an
catfi
sh
(Clariasgariepinus)
Resting
Exerc
ised
L-C
arn
itin
e15
1000
15
1000
AN
OV
A
Lip
id100
180
100
180
SE
M100
180
100
180
SE
ML-C
EC£
LC£
EC£
L£
E
Tota
lpro
tein
(g/l)
31
·731
·629·5
30
·11·4
30
·631·0
31·1
30
·80·8
––
––
–T
AG
(mm
ol/l)
9·6
9·4
10·1
11
·31·1
8·0
9·6
7·3
9·1
1·9
––
––
–C
hole
ste
rol(m
mol/l)
4·9
5·0
5·3
5·5
0·2
4·5
5·0
5·0
5·3
0·3
0·0
2–
––
–Lacta
tedehydro
genase
(U/l)
965
·81039·0
1045·5
1130·5
80·9
1686·3
1411·5
1203·3
1322·8
139·2
–0·0
05
––
–Lacta
te(m
mol/l)
7·0
7·4
5·8
5·6
0·3
7·5
7·6
7·1
7·0
0·6
0·0
10·0
2–
––
Ure
a(m
mol/l)
0·6
0·6
0·6
0·6
0·1
0·9
0·6
0·6
0·8
0·1
––
––
–G
lucose
(mm
ol/l)
6·3
6·3
6·3
5·4
0·6
5·9
5·8
5·4
5·8
0·4
––
––
–N
EF
A(m
mol/l)
0·6
0·6
0·6
0·6
0·0
0·7
0·8
0·6
0·6
0·1
––
–0·0
4–
Cort
isol(m
g/m
l)71
·976
·863·2
86
·44·7
86
·2128·7
166·2
106
·411·4
–,
0·0
001
0·0
20·0
20·0
09
SE
M,
poole
dsta
ndard
err
or
of
mean:
sta
ndard
devia
tion/pn;
L-C
,L-c
arn
itin
e;
L,
lipid
;E
,exerc
ise;
–,
NS
.
R. O. A. Ozorio et al.1146
British
Journal
ofNutrition
Some other studies have shown dramatic influences of diet-ary L-carnitine on body composition and on growth perform-ance. Ji et al. (32) noted that Atlantic salmon fed dietssupplemented with L-carnitine had reduced fillet lipid.Chatzifotis et al. (46) reported an increase in growth rate andfeed efficiency in red sea bream when L-carnitine wassupplemented at 1087 mg/kg diet. In a classical dose–responsestudy, Torreele et al. (28) clearly observed that dietary L-carni-tine and lipid supplementation significantly affected perform-ance of 5 g African catfish. In contrast, no significant effect onperformance of African catfish juveniles growing from 9–32 gwas observed in the present study. The difference in fish sizemight explain the different results obtained by Torreeleet al. (28) working in the same laboratory and with the samespecies as in the present study. During early life stageswhen fish are building up new tissues at very fast rate, avery high-energy demand has to be covered. Since endogen-ous L-carnitine synthesis is less developed in younger animals,dietary L-carnitine requirement might be more evident in 5 gthan in 9 g African catfish.
In liver, DM, energy and lipid content increased, and pro-tein decreased with increasing dietary lipid level. As a conse-quence, protein to lipid ratio also decreased. Since liver is themajor site of lipid and glycogen deposition in fish, it isexpected to observe a positive relationship between dietarylipid content and body lipid(47). Dietary L-carnitine sup-plementation significantly reduced DM, energy and lipid con-tent of the liver. The effects of dietary L-carnitine onproximate composition of several fish species have beeninconsistent. Dietary L-carnitine did not alter tissue compo-sition of rainbow trout(45) or hybrid tilapia(48). On the otherhand, dietary L-carnitine reduced tissue lipid concentrationsin rohu(49), tilapia(50), channel catfish(43), European seabass(51) and Atlantic salmon(32). Opposite to the latter studies,dietary L-carnitine increased lipid concentrations in liver andmuscle of red sea bream(46).
In teleost fish, the FA composition and content of muscle andliver is mainly dependent of the profile of dietary FA source.This effect might, however, be modulated by selective FAoxidation and modification of absorbed FA(52). In the presentexperiment, increased fish oil incorporation in the dietsresulted in an increased FA intake but had no major effects onFA profile of diets. Moreover, the intake of long-chain PUFAwas quite high even with lower fat diets, so minimal endogenousmodification of absorbed PUFA can be expected. Thus, in thepresent study, the FA oxidation might become the mostimportant factor determining the FA composition of tissues.To our best knowledge, the selectivity mechanism regulating
FA oxidation in fish are poorly understood(52), and our datasuggest that increased FA intake may promote FA oxidationand both carnitine and exercise might influence the regulationof FA oxidation selectivity, as discussed later.
Supplementing high fish oil level did not change the totalFA content of muscle, but changed the FA profile withincreased PUFA coupled with decreased MUFA and SFA con-centration. The increased FA intake might led to an increaseFA oxidation, as observed in rainbow trout(53) and inmice(54), and because both SFA and MUFA are expected tobe oxidised preferentially to PUFA(52), these will result inan altered FA composition of muscle.
In liver, the enrichment on both n-6 and n-3 PUFA inducedby elevated fish oil level was also observed but was highest inanimals fed non-supplemented L-carnitine diets. L-carnitinemight facilitate the oxidation of n-3 PUFA, thus attenuatingits accumulation in the liver. This is consistent with earlierstudies on red sea bream, where is suggested that, L-carnitinesupplementation affected FA metabolism by shifting theoxidation from C14–C18 to C20–C22 FA(46,55).
Muscle of exercised fish had lower total FA content (mg/glipid) and lower total lipids than the rested animals. This mayindicate increased FA oxidation in muscles to couple withincreased energy demand in exercised fish. In rested animals,n-3 PUFA are probably less oxidised than the other FA, butthat selectivity mechanism regulating FA oxidation might beby-passed with increasing energy demand, such as inexercised fish. In that case, n-3 PUFA, SFA and MUFA areoxidised at similar rates.
Dietary L-carnitine levels did only influence cholesterol andlactate as plasma biochemical parameters. Exercise signifi-cantly elevated lactate and lactate dehydrogenase, whichmay indicate the activation of the anaerobic glycolysis to pro-vide energy during exercise(56 – 58). These findings are consist-ent with previous studies(59 – 64). The nitrogen excretion can bedivided in two different components: endogenous and exogen-ous (postprandial) excretion(65). The endogenous excretionreflects the ‘turn-over’ body protein and the exogenousexcretion, the result of the catabolism of dietary protein.
It is generally observed that the postprandial nitrogenexcretion rates represent approximately 35–40 % of the diges-tible nitrogen ingestion and may vary with the dietary proteinto lipid ratio, the quality of the ingredients and the feed pro-cessing technique(66,67). As demonstrated in previous studieswith salmonids, ammonia excretion represents about 90 % ofthe total excretion of the nitrogenous compounds(68 – 72). Thelowest values were observed in unfed fish, during whichurea excretion represented 20 % of the nitrogen excretion.
Table 8. Effects of dietary L-carnitine (15 or 1000 mg/kg) and lipid (100 or 180 g/kg) levels on respiratory gasexchange (mmol/kg per h) and respiratory and nitrogen quotients in exercised African catfish (Clarias gariepinus)
L-Carnitine 15 1000 ANOVA
Lipid 100 180 100 180 SEM L-C L C £ L
O2 consumed (O2) 21·3 20·3 22·0 21·0 0·6 – – –CO2 excretion (CO2) 13·1 14·7 14·3 13·2 0·6 – – –N-NHþ
4 excretion (N) 1·03 1·06 1·63 0·93 0·08 0·01 0·01 0·05RQ 0·62 0·72 0·65 0·63 0·01 0·03 – 0·03Nitrogen quotient (NQ) 0·07 0·1 0·12 0·08 0·02 – – –
SEM, pooled standard error of mean: standard deviation/pn; L-C, L-carnitine; L, lipid; –, NS.
Lipid and carnitine in exercised catfish 1147
British
Journal
ofNutrition

Fuel oxidation preferences are often realised in changes ofthe RQ rates(73). According to Kleiber(18), 1·0 is the upperlimit for aerobic catabolism and usually ranges between 0·65and 1·0. The lower value indicates lipid oxidation and thehigher value carbohydrate oxidation. In the present study,the RQ rates vary between 0·62 and 0·72, and the pattern isin agreement with the variation observed in our previousstudy with African catfish. Ozorio et al. (22) reported areduction in RQ in fish fed L-carnitine supplementation, par-ticularly when dietary lipid level was high. In the presentstudy, dietary L-carnitine supplementation significantlyreduced RQ and nitrogen (N-NHþ
4 ) excretion in fish fed180 g/kg. There were interaction effects between L-carnitineand lipid for RQ and nitrogen excretion, indicating that dietaryL-carnitine effects on lipid, and indirectly on protein catabo-lism, may be conditioned by the dietary lipid level.
We assessed an experimental set up with isonitrogenousdiets containing two lipid levels, two L-carnitine levels and aresting or a moderate swimming protocol (1·5 BL/s).Swimming activity causes fish to have less lipid reservesthan those of sedentary fish. Plasma cortisol level was alsolower in the resting fish when compared with exercised fish.Catfish is an air-breathing fish species and swimming doesprevent this species from this additional source of oxygensupply because vertical migration is prevented and the swimtunnel is a closed system. However, the higher cortisollevels in the swimming group can be an advantageouscondition because cortisol acts to mobilise fuel stores tomaintain metabolic homeostasis and thus exerts effects onmetabolism directly(74). In addition, Milligan et al. (75)
observed that trout are able to recover much faster whenthey are allowed to swim at low speeds after collapse.
Swimming performance may change as a result of nutri-tional status(76). The rate of cellular lipid oxidation is deter-mined by the energy requirements of the working musclesand by the availability of free L-carnitine delivery to musclemitochondria(17). L-Carnitine may result in an elevatedcapacity for lipid oxidation in muscle mitochondria. Duringexercise, lipids oxidised in locomotory muscles can comefrom the circulation or from intramuscular reserves. Circula-tory lipids and cholesterol are transported from the gut andfrom hepatic or adipose tissue stores(77) by lipoproteins(78).
The increase in concentrations of plasma lactate observed inthe present study, normally associated with increased glyco-lytic processes, was correlated with exercise and is consistentwith other studies(79 – 81).
Little information is available about the release and time-scale for excretion of lactic acid from the active tissues in cir-culation. In addition, lactic acid may not solely be consideredas an end product causing fatigue and acid–base disturbances,but also may be considered as a substrate for oxidative tissues,such as red and cardiac muscle. In principle, using lactate as asubstrate, hepatic gluconeogenesis (i.e. the Cori cycle) andin situ glyconeogenesis in white and red muscle may alsooccur(79). Swimming has the advantage that it activatesblood perfusion of most tissues, and thus allows rapid oxidisa-tion of the accumulated lactate that quickly replenishes theHCO2
3 pool(82). The re-synthesis of lactate to glycogen willalso help to restore metabolic acidosis. So, possibly slowswimming may be the natural way of recovery from a boutof exercise.
Acknowledgements
This research received no specific grant from any fundingagency in the public, commercial or not-for-profit sectors.We declare that there are no conflicts of interest regardingthe present paper. R. O. A. O., M. W. A. V., J. A. J. V. andE. A. H. designed the study. R. O. A. O. performed theanimal experiments, analysed and interpreted the data. R. O.A. O. and V. J. T. V. G. designed the swimming experiment.R. J. B. B. analysed and interpreted the FA data. J. A. J. V.and E. A. H. supervised the experiments and provided admin-istrative, technical and material support. R. O. A. O. wrote thedraft of the manuscript. All the authors critically reviewed themanuscript.
References
1. Chatzifotis S (1998) The effect of dietary L-carnitine on growth
and lipid composition of fish. PhD Dissertation, Tokyo Univer-
sity of Fisheries.
2. Heo KN, Odle J & Han IK (2000) Effects of dietary L-carnitine
and protein level on plasma carnitine, energy and carnitine bal-
ance, and carnitine biosynthesis of 20 kg pigs. Asian-Aust J
Anim Sci 13, 1568–1575.
3. Ozorio ROA, Verreth JAJ, Aragao CR, et al. (2003) Dietary car-
nitine supplements increased lipid metabolism and decreased
protein oxidation in African catfish (Clarias gariepinus) juven-
iles fed high fat levels. J Aquac Tropics 18, 225–238.
4. Harpaz S (2005) L-Carnitine and its attributed functions in fish
culture and nutrition – a review. Aquaculture 249, 3–21.
5. Rebouche CJ & Seim H (1998) Carnitine metabolism and its
regulation in microorganisms and mammals. Annu Rev Nutr
18, 36–61.
6. Gulcin I (2006) Antioxidant and antiradical activities of L-carni-
tine. Life Sci 78, 803–811.
7. Heo K, Odle J, Han IK, et al. (2000) Dietary L-carnitine
improves nitrogen utilization in growing pigs fed low energy,
fat-containing diets. J Nutr 130, 1809–1814.
8. Demmelmair H, Sauerwald T, Koletzko B, et al. (1997) New
insights into lipid and fatty acid metabolism via stable isotopes.
Eur J Pediatrics 156, S70–S74.
9. Gomes MD & Tirapegui J (2000) Relation of some nutritional
supplements and physical performance. Arch Latinoam Nutr
50, 317–329.
10. Janssens GPJ, Buyse J, Sweynaeve M, et al. (1998) The
reduction of heat production in exercising pigeons after L-carni-
tine supplementation. Poult Sci 77, 578–584.
11. Kraemer WJ & Volek JS (2000) L-Carnitine supplementation
for the athlete, a new perspective. Ann Nutr Metab 44, 88–89.
12. Sachan DS & Hongu N (2000) Increases in VO2max and meta-
bolic markers of fat oxidation by caffeine, carnitine, and choline
supplementation in rats. J Nutr Biochem 11, 521–526.
13. Souffleux G (1994) Benefit of using Rossovet carnitine for
horses in preparation for amateur carriage-racing. Pratique
Veterinaire Equine 26, 241–248.
14. Spriet L, Perry C & Talanian J (2008) Legal pre-event nutri-
tional supplements to assist energy metabolism. Essays Biochem
44, 27–44.
15. Panjwani U, Thakur L, Anand JP, et al. (2007) Effect of L-car-
nitine supplementation on endurance exercise in normobaric/
normoxic and hypobaric/hypoxic conditions. Wilderness
Environ Med 18, 169–176.
16. Tsakiris T, Angelogianni P, Tesseromatis C, et al. (2008) Effect
of L-carnitine administration on the modulated rat brain
protein concentration, acetylcholinesterase, NaþKþ-ATPase and
R. O. A. Ozorio et al.1148
British
Journal
ofNutrition

Mg2þ-ATPase activities induced by forced swimming. Br J Sports
Med 42, 367–372.
17. Ozorio R, Van Ginneken V, Van den Thillart G, et al. (2005)
Dietary L-carnitine maintains energy reserves and delays fatigue
of exercised African catfish fed high fat diets. Sci Agric 62,
208–213.
18. Kleiber M (1987) The Fire of Life. An Introduction to Animal
Energetics. Malabar, FL: Robert E. Krieger Publ. Co..
19. Brouwer E (1958) On simple formulae for calculating
the heat expenditure and the quantities of carbohydrate
and fat metabolized in ruminants, from data on gaseous
exchange and urine-N. In I Symposium on Energy Metab-
olism, pp. 182–194. Rome: European Association for
Animal Production.
20. Lauff RF & Wood CM (1997) Effects of training on respiratory
gas exchange, nitrogenous waste excretion, and fuel usage
during aerobic swimming in juvenile rainbow trout (Oncor-
hynchus mykiss). Can J Fish Aquat Sci 54, 566–571.
21. Kutty MN (1968) Respiratory quotients in goldfish and rainbow
trout. J Fish Res Bd Can 25, 1689–1728.
22. Ozorio ROA, van Eekeren THB, Huisman EA, et al. (2001)
Effects of dietary carnitine and protein energy: nonprotein
energy ratios on growth, ammonia excretion and respiratory
quotient in African catfish, Clarias gariepinus (Burchell) juven-
iles. Aquac Res 32, 406–414.
23. Ali MZ & Jauncey K (2004) Optimal dietary carbohydrate to
lipid ratio in African catfish Clarias gariepinus (Burchell
1822). Aquac Int 12, 169–180.
24. Van Ginneken VJT (2006) Simulated migration of European Eel
(Anguilla anguilla, Linnaeus 1758). PhD dissertation no. 3979,
Wageningen University, The Netherlands, pp. 309.
25. Christiansen RZ & Bremer J (1978) Acetylation of Tris(hydrox-
ymethyl)aminomethane (Tris) and Tris derivatives by carnitine
acetyltransferase. FEBS Lett 86, 99–102.
26. Ozorio ROA, Uktoseja JLA, Huisman EA, et al. (2001)
Changes in fatty acid concentrations in tissues of African cat-
fish, Clarias gariepinus Burchell, as a consequence of dietary
carnitine, fat and lysine supplementation. Br J Nutr 86,
623–636.
27. Ruane NM, Huisman EA & Komen J (2001) Plasma cortisol
and metabolite level profiles in two isogenic strains of
common carp during confinement. J Fish Biol 59, 1–12.
28. Torreele E, Vandersluiszen A & Verreth J (1993) The effect of
dietary L-carnitine on the growth-performance in fingerlings of
the African catfish (Clarias gariepinus) in relation to dietary-
lipid. Br J Nutr 69, 289–299.
29. Nelson HK, Lauber RP & Sheard NF (2001) Effect of various
levels of supplementation with sodium pivalate on tissue carni-
tine concentrations and urinary excretion of carnitine in the rat.
J Nutr Biochem 12, 242–250.
30. Ozorio ROA (2001) Dietary L-carnitine and energy and lipid
metabolism in African catfish (Clarias gariepinus) juveniles.
PhD dissertation no. 3092, Wageningen University, Holland.
31. Ozorio ROA (2009) Dietary L-carnitine supplementation to
cultivated fish: a mini-review. Curr Nutr Food Sci 5, 40–48.
32. Ji H, Bradley TM & Tremblay GC (1996) Atlantic salmon
(Salmo salar) fed L-carnitine exhibit altered intermediary
metabolism and reduced tissue lipid, but no change in growth
rate. J Nutr 126, 1937–1950.
33. Chatzifotis S, Takeuchi T, Watanabe T, et al. (1997) The effect
of dietary carnitine supplementation on growth of rainbow trout
fingerlings. Fish Sci 63, 321–322.
34. Bell FP, Vidmar TJ & Raymond TL (1992) L-Carnitine admin-
istration and withdrawal affect plasma and hepatic carnitine
concentrations, plasma lipid and lipoprotein composition, and
in vitro hepatic lipogenesis from labeled mevalonate and
oleate in normal rabbits. J Nutr 122, 959–966.
35. Baltzell JK, Bazer FW, Miguel SG, et al. (1987) The neonatal
piglet as a model for human neonatal carnitine metabolism.
J Nutr 117, 754–757.
36. Tsai AC, Romsos DR & Leveille GA (1974) Significance of
dietary carnitine for growth and carnitine turnover in rats.
J Nutr 104, 782–792.
37. Stadler DD, Catherine AC & Rebouche CJ (1993) Effect of
dietary macronutrient content on carnitine reabsorption. Am J
Clin Nutr 58, 868–872.
38. Berger R & Sachan DS (1991) Effects of supplementary levels
of L-carnitine on blood and urinary carnitines and on the
portal-systemic blood-ethanol concentrations in the rat. J Nutr
Biochem 2, 382–386.
39. Gaylord TG & Gatlin DM (2000) Dietary lipid level but
not L-carnitine affects growth performance of hybrid striped
bass (Morone chrysops £ M. saxatilis). Aquaculture 190,
237–246.
40. Greenwood RH, Titgemeyer EC, Stokka GL, et al. (2001)
Effects of L-carnitine on nitrogen retention and blood metab-
olites of growing steers and performance of finishing steers.
J Anim Sci 79, 254–260.
41. Hiatt WR, Regensteiner JG, Wolfel EE, et al. (1989) Carnitine
and acylcarnitine metabolism during exercise in humans –
dependence on skeletal-muscle metabolic state. J Clin Invest
84, 1167–1173.
42. Robinson EH, Wilson RP & Poe WE (1980) Re-evaluation of
the lysine requirement and lysine utilization by fingerling chan-
nel catfish. J Nutr 110, 2313–2316.
43. Burtle GJ & Liu Q (1994) Dietary carnitine and lysine affect
channel catfish lipid and protein composition. J World Aquac
Soc 25, 169–174.
44. Chatzifotis S & Takeuchi T (1997) Effect of supplemental car-
nitine on body weight loss, proximate and lipid compositions
and carnitine content of red sea bream (Pagrus major) during
starvation. Aquaculture 158, 129–140.
45. Rodehutscord M (1995) Effects of supplemental dietary L-carni-
tine on the growth and body composition of rainbow trout
(Oncorhynchus mykiss) fed high-fat diets. J Anim Physiol
Anim Nutr 73, 276–279.
46. Chatzifotis S, Takeuchi T & Seikai T (1995) The effect of diet-
ary L-carnitine on growth performance and lipid composition in
Red sea bream fingerlings. Fish Sci 61, 1004–1008.
47. Jobling M (2001) Nutrient partitioning and the influence of feed
composition on body composition. In Food Intake in Fish,
pp. 354–375 [D Houlihan, T Boujard and M Jobling, editors].
Oxford: Blackwell Science.
48. Becker K, Schreiber S, Angoni C, et al. (1999) Growth perform-
ance and feed utilization response of Oreochromis niloticus £
Oreochromis aureus hybrids to L-carnitine measured over a
full fattening cycle under commercial conditions. Aquaculture
174, 313–322.
49. Keshavanath P & Renuka P (1998) Effect of dietary L-carnitine
on growth and body composition of fingerling rohu, Labeo
rohita (Hamilton). Aquac Nutr 4, 83–87.
50. Jayaprakas V, Sambhu C & Sunil Kumar S (1996) Effect of
dietary L-carnitine on growth and reproductive performance of
male Oreochromis mossambicus (Peters). Fish Technol 33,
84–90.
51. Santulli A & D’Amelio V (1986) Effect of supplemental dietary
carnitine on the growth and lipid metabolism of hatchery-reared
sea bass, Dicentrarchus labrax L.. Aquaculture 59, 177–186.
52. Tocher DR (2003) Metabolism and functions of lipids and fatty
acids in Teleost Fish. Rev Fish Sci 11, 107–184.
53. Kolditz C, Borthaire M, Richard N, et al. (2008) Liver and
muscle metabolic changes induced by dietary energy content
and genetic selection in rainbow trout (Oncorhynchus mykiss).
Am J Physiol Regul Integr Comp Physiol 294, R1154–R1164.
Lipid and carnitine in exercised catfish 1149
British
Journal
ofNutrition
54. Turner N, Bruce CR, Beale SM, et al. (2007) Excess lipid avail-
ability increases mitochondrial fatty acid oxidative capacity in
muscle: evidence against a role for reduced fatty acid oxidation
in lipid-induced insulin resistance in rodents. Diabetes 56,
2085–2092.
55. Chatzifotis S, Takeuchi T & Seikai T (1996) The effect of diet-
ary carnitine supplementation on growth of red sea bream
(Pagrus major) fingerlings at two levels of dietary lysine. Aqua-
culture 147, 235–248.
56. Dobson GP, Parkhouse WS & Hochachka PW (1987)
Regulation of anaerobic atp-generating pathways in trout
fast-twitch skeletal-muscle. Am J Physiol 253, R186–R194.
57. Driedzic WR & Hochachka PW (1976) Control of energy-
metabolism in fish white muscle. Am J Physiol 230, 579–582.
58. Mommsen TP & Hochachka PW (1988) The purine nucleotide
cycle as 2 temporally separated metabolic units – a study on
trout muscle. Metab Clin Exp 37, 552–556.
59. Butler PJ, Metcalfe JD & Ginley SA (1986) Plasma catechol-
amine in the lesser spotted dogfish and rainbow trout at rest
and during different levels of exercise. J Exp Biol 123, 409–421.
60. Johnston IA & Goldspink G (1973) A study of the swimming
performance of crucian carp (Carassius carassius L.) in relation
to the effects of exercise and recovery on the biochemical
changes in myotomal muscles and liver. J Fish Biol 5, 249–260.
61. Driedzic WR & Kiceniuk JW (1976) Blood lactate levels in
free-swimming rainbow trout (Salmo gairdneri) before and
after strenuous exercise resulting in fatigue. J Fish Res Bd
Can 33, 173–176.
62. Wokoma A & Johnston IA (1981) Lactate production at high
sustainable cruising speeds in rainbow trout (Salmo gairdneri
Richardson). J Exp Biol 90, 361–364.
63. Duthie G (1982) The respiratory metabolism of temperature
adapted flatfish at rest and during swimming activity and the
use of anaerobic metabolism at moderate swimming speeds.
J Exp Biol 97, 359–373.
64. Boutilier RG, Heming TA & Iwama GK (1984) Fish physi-
ology. In Physicochemical Parameters for Use in Fish Respirat-
ory Physiology, pp. 403–430 [WS Hoar and DJ Randall,
editors]. New York: Academic Press.
65. Forsberg OI (1997) The impact of varying feeding regimes on
oxygen consumption and excretion of carbon dioxide and nitro-
gen in post-smolt Atlantic Salmon, Salmo salar L.. Aquac Res
28, 29–41.
66. Kaushik SJ & Cowey CB (1991) Ammoniogenesis and dietary
factors affecting nitrogen excretion. In Nutritional Strategies
and Aquaculture Waste, pp. 3–19 [CB Cowey and CY Cho, edi-
tors]. Guelph: University of Guelph.
67. Watanabe T (1991) Past and present approaches to aquaculture
waste managements in Japan. In Nutrient Strategies and
Aquaculture Waste. Proceedings of the First International
Symposium on Nutrient Strategies in Management of Aquacul-
ture Waste, pp. 137–154 [CB Cowey and CY Cho,
editors]. Ontario: University of Guelph.
68. Beamish FWH & Thomas E (1984) Effects of dietary protein
and lipid on nitrogen losses in rainbow trout (Salmo gairdneri).
Aquaculture 41, 359–371.
69. Brett JR & Zala CA (1975) Daily pattern of nitrogen excretion
and oxygen consumption of sockeye salmon Oncorhynchus
nerka under controlled conditions. J Fish Res Bd Can 32,
2479–2486.
70. Fivelstad S, Thomassen JM, Smith MJ, et al. (1990) Metabolite
production rates from Atlantic salmon (Salmo salar L.) and
Arctic char (Salvelinus alpinus L.) reared in single pass land-
based brackish water and sea-water systems. Aquac Eng 9,
1–21.
71. Medale F, Brauge C, Vallee F, et al. (1995) Effects of dietary
protein/energy ratio, ration size, dietary energy source and
water temperature on nitrogen excretion in rainbow trout.
Water Sci Technol 31, 185–194.
72. Wiggs AJ, Henderson EB, Saunders RL, et al. (1989) Activity,
respiration, and excretion of ammonia by Atlantic salmon
(Salmo salar) smolt and postmolt. Can J Fish Aquat Sci 46,
790–795.
73. Xu D, Dhillon AS, Drake PG, et al. (1996) The transition from
lipid to carbohydrate oxidation in response to re-feeding after
starvation. Nutr Res 16, 1545–1553.
74. Van der Boon J, Van den Thillart GEEJM & Addink ADF
(1991) The effects of cortisol administration on intermediary
metabolism in teleost fish. Comp Biochem Physiol A 100,
47–53.
75. Milligan CL, Hooke GB & Johnson C (2000) Sustained swim-
ming at low velocity following a bout of exhaustive exercise
enhances metabolic recovery in rainbow trout. J Exp Biol 203,
921–926.
76. Martinez M, Guderley H, Dutil J-D, et al. (2003) Condition,
prolonged swimming performance and muscle metabolic
capacities of cod Gadus morhua. J Exp Biol 206, 503–5111.
77. Weber J-M & Haman F (1996) Pathways for metabolic fuels
and oxygen in high performance fish. Comp Biochem Physiol
A 113, 33–38.
78. Salway JG (2006) Medical Biochemistry at A Glance, 2nd ed.
Oxford: Blackwell Publishing Ltd.
79. Van Ginneken V, Boot R, Murk T, et al. (2004) Blood plasma
substrates and muscle lactic-acid response after exhaustive exer-
cise in common carp and trout: indications for a limited lactate-
shuttle. Anim Biol 54, 119–130.
80. Van Ginneken VJT, Balm P, Sommandas V, et al. (2002) Acute
stress syndrome of the yellow European eel (Anguilla anguilla
Linnaeus) when exposed to a graded swimming-load. Neth
J Zool 52, 29–42.
81. Wood CM, Walsh PJ, Thomas S, et al. (1990) Control of red
blood cell metabolism in rainbow trout after exhaustive exer-
cise. J Exp Biol 154, 491–507.
82. Van Ginneken V, Coldenhoff K & Boot R (2008) Depletion of
high energy phosphates implicates post-exercise mortality in
carp and trout: an in vivo 31P-NMR study. Comp Biochem
Physiol A 149, 98–108.
83. Goelema JO, Spreeuwenberg MAM, Hof G, et al. (1998) Effect
of pressure toasting on the rumen degradability and intestinal
degradability of whole and broken peas, lupins and faba beans
and a mixture of these feedstuffs. Anim Feed Sci Technol 76,
35–50.
R. O. A. Ozorio et al.1150
British
Journal
ofNutrition