Effects of electrode wettabilities on liquid water behaviours in PEM fuel cell cathode
14
Available online at www.sciencedirect.com Journal of Power Sources 175 (2008) 106–119 Effects of electrode wettabilities on liquid water behaviours in PEM fuel cell cathode Kui Jiao, Biao Zhou ∗ Department of Mechanical, Automotive & Materials Engineering, University of Windsor, ON, Canada, N9B 3P4 Received 14 June 2007; received in revised form 11 September 2007; accepted 12 September 2007 Available online 21 September 2007 Abstract Liquid water transport is one of the key challenges for water management in a proton exchange membrane (PEM) fuel cell. Investigation of the air–water flow patterns inside fuel cell gas flow channels with gas diffusion layer (GDL) would provide valuable information that could be used in fuel cell design and optimization. This paper presents numerical investigations of air–water flow across an innovative GDL with catalyst layer and serpentine channel on PEM fuel cell cathode by use of a commercial Computational Fluid Dynamics (CFD) software package FLUENT. Different static contact angles (hydrophilic or hydrophobic) were applied to the electrode (GDL and catalyst layer). The results showed that different wettabilities of cathode electrode could affect liquid water flow patterns significantly, thus influencing on the performance of PEM fuel cells. The detailed flow patterns of liquid water were shown, several gas flow problems were observed, and some useful suggestions were given through investigating the flow patterns. © 2007 Elsevier B.V. All rights reserved. Keywords: Water management; Wettability; Static contact angle; Gas diffusion layer (GDL); CFD; FLUENT 1. Introduction Low operating temperature and zero/low emissions have made Proton Exchange Membrane (PEM) fuel cells become the most promising power source of the future [1]. However, to achieve commercialization, the performance of PEM fuel cells needs to be improved by proper engineering design and opti- mization. Due to the special chemical structure of the PEM, the membrane must be well hydrated to ensure that a suf- ficient amount of hydrogen ions could cross. On the other hand, due to the low operating temperature of PEM fuel cells (30–100 ◦ C) [1], excessive humidification could result in water vapour condensation that could subsequently block the gas flow channels resulting in a lower air flow rate on the cathode side, thus decreasing fuel cell performance. Water content is also an important factor that affects the ohmic resistance in the membrane [2]. Therefore, keeping an appropriate amount of water content in the fuel cell to avoid both membrane dehy- ∗ Corresponding author. Tel.: +1 519 253 3000x2630; fax: +1 519 973 7007. E-mail address: [email protected] (B. Zhou). dration and water vapour condensation has been a critical issue in improving fuel cell performance. In reality, however, it is almost impossible to manage water on both the anode and cathode sides without dehydration and condensation; this is simply because water vapour condensation in the gas flow channels of practical fuel cell applications is unavoidable [2]. Therefore, water management, to which many engineers and scientists have recently paid particular attention, has been a critical challenge for a high-performance fuel cell design and optimization. Wang [3] made a comprehensive review of water management in fuel cells, and Kraytsberg and Ein-Eli [4] also identified different kinds of water management related issues. In the last decade, water management related studies were performed numerically and experimentally for different pur- poses and in several ways. A CFD modeling of PEM fuel cells which simultaneously considered the electrochemical kinet- ics, current distributions, hydrodynamics, and multi-component transport was conducted by Um et al. [5]. A three-dimensional (3D) numerical simulation of a straight gas flow channel in a PEM fuel cell was performed by Dutta et al. [6] using a commer- cial CFD software FLUENT. Hontanon et al. [7] also employed 0378-7753/$ – see front matter © 2007 Elsevier B.V. All rights reserved. doi:10.1016/j.jpowsour.2007.09.048
-
Upload
independent -
Category
Documents
-
view
2 -
download
0
Transcript of Effects of electrode wettabilities on liquid water behaviours in PEM fuel cell cathode

A
tulDwdi©
K
1
mmanmtfih(vctamw
0d
Available online at www.sciencedirect.com
Journal of Power Sources 175 (2008) 106–119
Effects of electrode wettabilities on liquidwater behaviours in PEM fuel cell cathode
Kui Jiao, Biao Zhou ∗Department of Mechanical, Automotive & Materials Engineering,
University of Windsor, ON, Canada, N9B 3P4
Received 14 June 2007; received in revised form 11 September 2007; accepted 12 September 2007Available online 21 September 2007
bstract
Liquid water transport is one of the key challenges for water management in a proton exchange membrane (PEM) fuel cell. Investigation ofhe air–water flow patterns inside fuel cell gas flow channels with gas diffusion layer (GDL) would provide valuable information that could besed in fuel cell design and optimization. This paper presents numerical investigations of air–water flow across an innovative GDL with catalystayer and serpentine channel on PEM fuel cell cathode by use of a commercial Computational Fluid Dynamics (CFD) software package FLUENT.ifferent static contact angles (hydrophilic or hydrophobic) were applied to the electrode (GDL and catalyst layer). The results showed that different
ettabilities of cathode electrode could affect liquid water flow patterns significantly, thus influencing on the performance of PEM fuel cells. Theetailed flow patterns of liquid water were shown, several gas flow problems were observed, and some useful suggestions were given throughnvestigating the flow patterns.2007 Elsevier B.V. All rights reserved.
layer
diacscTscomai
p
eywords: Water management; Wettability; Static contact angle; Gas diffusion
. Introduction
Low operating temperature and zero/low emissions haveade Proton Exchange Membrane (PEM) fuel cells become theost promising power source of the future [1]. However, to
chieve commercialization, the performance of PEM fuel cellseeds to be improved by proper engineering design and opti-ization. Due to the special chemical structure of the PEM,
he membrane must be well hydrated to ensure that a suf-cient amount of hydrogen ions could cross. On the otherand, due to the low operating temperature of PEM fuel cells30–100 ◦C) [1], excessive humidification could result in waterapour condensation that could subsequently block the gas flowhannels resulting in a lower air flow rate on the cathode side,hus decreasing fuel cell performance. Water content is also
n important factor that affects the ohmic resistance in theembrane [2]. Therefore, keeping an appropriate amount ofater content in the fuel cell to avoid both membrane dehy-∗ Corresponding author. Tel.: +1 519 253 3000x2630; fax: +1 519 973 7007.E-mail address: [email protected] (B. Zhou).
pwit(Pc
378-7753/$ – see front matter © 2007 Elsevier B.V. All rights reserved.oi:10.1016/j.jpowsour.2007.09.048
(GDL); CFD; FLUENT
ration and water vapour condensation has been a critical issuen improving fuel cell performance. In reality, however, it islmost impossible to manage water on both the anode andathode sides without dehydration and condensation; this isimply because water vapour condensation in the gas flowhannels of practical fuel cell applications is unavoidable [2].herefore, water management, to which many engineers andcientists have recently paid particular attention, has been aritical challenge for a high-performance fuel cell design andptimization. Wang [3] made a comprehensive review of wateranagement in fuel cells, and Kraytsberg and Ein-Eli [4]
lso identified different kinds of water management relatedssues.
In the last decade, water management related studies wereerformed numerically and experimentally for different pur-oses and in several ways. A CFD modeling of PEM fuel cellshich simultaneously considered the electrochemical kinet-
cs, current distributions, hydrodynamics, and multi-component
ransport was conducted by Um et al. [5]. A three-dimensional3D) numerical simulation of a straight gas flow channel in aEM fuel cell was performed by Dutta et al. [6] using a commer-ial CFD software FLUENT. Hontanon et al. [7] also employed
ower
FAm[nwflKetawedP
Yssitctlt[h
K. Jiao, B. Zhou / Journal of P
LUENT to implement their 3D, stationary gas flow model.study exploring the steady-state gas transport phenomena inicro-scale parallel flow channels was conducted by Cha et al.
8] in which oxygen concentration along a single gas flow chan-el and other flow patterns that may affect fuel cell performanceere discussed. Similarly, gas concentration of a steady-stateow along fuel cell flow channels was obtained numerically byulikovsky [9]. However, in all the studies mentioned above, the
ffects of liquid water were neglected. Yi et al. [2] pointed outhat water vapour condensation was inevitable on both the anodend cathode sides of a PEM fuel cell, and they discussed a liquid
ater removal technique that used a water transport plate to leadxcess liquid water to the coolant flow channels by a pressureifference. Wang et al. [10] conducted a two-phase model onEM fuel cell cathode to address the liquid water concentrations.
itwa
Fig. 1. Computation domain ((a) genera
Sources 175 (2008) 106–119 107
ou and Liu [11] also considered liquid water concentration in atraight channel on the cathode side. Both the references [10,11]howed the importance for considering liquid water in numer-cal modeling of PEM fuel cells. He et al. [12] conducted awo-phase, two-dimensional numerical model for PEM fuel cellathode with interdigitated flow channels. A numerical simula-ion considering water management for PEM fuel cell catalystayer was performed by Wang et al. [13]. An analysis of pro-on and water transport was performed by Carnes and Djilali14] by using the binary friction membrane model. Effects ofumidification on cathode liquid water condensation were stud-
ed by Lee and Chu [15] by using their 3D numerical model. Awo-phase, two-dimensional, non-isothermal numerical modelas conducted by Meng [16] to investigate both condensationnd evaporation of water in PEM fuel cell. In addition, more
l view; (b) structure of the GDL).
108 K. Jiao, B. Zhou / Journal of Power Sources 175 (2008) 106–119
tulsem
nbuedcif
p[ceeflcf
mtfcb
fdcabfup[bagibepfpt
or
TT
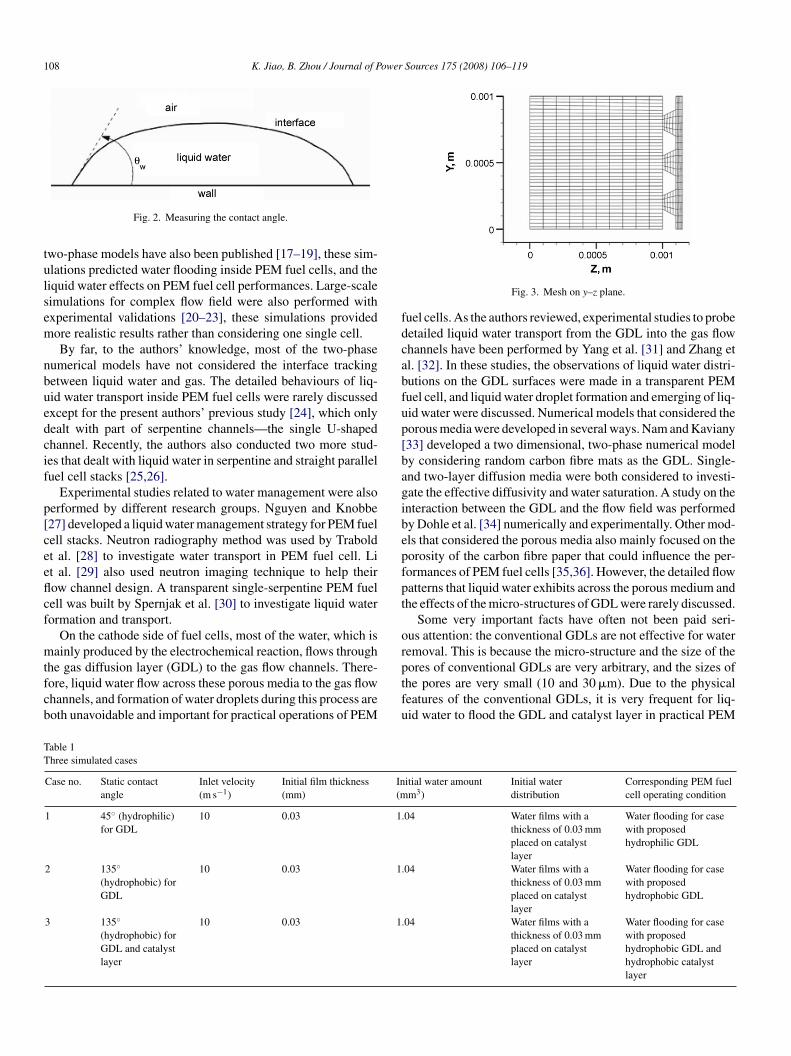
Fig. 2. Measuring the contact angle.
wo-phase models have also been published [17–19], these sim-lations predicted water flooding inside PEM fuel cells, and theiquid water effects on PEM fuel cell performances. Large-scaleimulations for complex flow field were also performed withxperimental validations [20–23], these simulations providedore realistic results rather than considering one single cell.By far, to the authors’ knowledge, most of the two-phase
umerical models have not considered the interface trackingetween liquid water and gas. The detailed behaviours of liq-id water transport inside PEM fuel cells were rarely discussedxcept for the present authors’ previous study [24], which onlyealt with part of serpentine channels—the single U-shapedhannel. Recently, the authors also conducted two more stud-es that dealt with liquid water in serpentine and straight paralleluel cell stacks [25,26].
Experimental studies related to water management were alsoerformed by different research groups. Nguyen and Knobbe27] developed a liquid water management strategy for PEM fuelell stacks. Neutron radiography method was used by Traboldt al. [28] to investigate water transport in PEM fuel cell. Lit al. [29] also used neutron imaging technique to help theirow channel design. A transparent single-serpentine PEM fuelell was built by Spernjak et al. [30] to investigate liquid waterormation and transport.
On the cathode side of fuel cells, most of the water, which isainly produced by the electrochemical reaction, flows through
he gas diffusion layer (GDL) to the gas flow channels. There-ore, liquid water flow across these porous media to the gas flowhannels, and formation of water droplets during this process areoth unavoidable and important for practical operations of PEM
ptfu
able 1hree simulated cases
Case no. Static contactangle
Inlet velocity(m s−1)
Initial film thickness(mm)
In(m
1 45◦ (hydrophilic)for GDL
10 0.03 1.
2 135◦(hydrophobic) forGDL
10 0.03 1.
3 135◦(hydrophobic) forGDL and catalystlayer
10 0.03 1.
Fig. 3. Mesh on y–z plane.
uel cells. As the authors reviewed, experimental studies to probeetailed liquid water transport from the GDL into the gas flowhannels have been performed by Yang et al. [31] and Zhang etl. [32]. In these studies, the observations of liquid water distri-utions on the GDL surfaces were made in a transparent PEMuel cell, and liquid water droplet formation and emerging of liq-id water were discussed. Numerical models that considered theorous media were developed in several ways. Nam and Kaviany33] developed a two dimensional, two-phase numerical modely considering random carbon fibre mats as the GDL. Single-nd two-layer diffusion media were both considered to investi-ate the effective diffusivity and water saturation. A study on thenteraction between the GDL and the flow field was performedy Dohle et al. [34] numerically and experimentally. Other mod-ls that considered the porous media also mainly focused on theorosity of the carbon fibre paper that could influence the per-ormances of PEM fuel cells [35,36]. However, the detailed flowatterns that liquid water exhibits across the porous medium andhe effects of the micro-structures of GDL were rarely discussed.
Some very important facts have often not been paid seri-us attention: the conventional GDLs are not effective for wateremoval. This is because the micro-structure and the size of the
ores of conventional GDLs are very arbitrary, and the sizes ofhe pores are very small (10 and 30 �m). Due to the physicaleatures of the conventional GDLs, it is very frequent for liq-id water to flood the GDL and catalyst layer in practical PEMitial water amountm3)
Initial waterdistribution
Corresponding PEM fuelcell operating condition
04 Water films with athickness of 0.03 mmplaced on catalystlayer
Water flooding for casewith proposedhydrophilic GDL
04 Water films with athickness of 0.03 mmplaced on catalystlayer
Water flooding for casewith proposedhydrophobic GDL
04 Water films with athickness of 0.03 mmplaced on catalystlayer
Water flooding for casewith proposedhydrophobic GDL andhydrophobic catalystlayer

K. Jiao, B. Zhou / Journal of Power
Fig. 4. Electrode surfaces and initial water condition ((a) surfaces of the GDLand catalyst layer; (b) initial water distribution).
ftw
cvtpiwwttcwaoic
acv
2
2m
Aa
Fig. 5. Liquid water distribution in 3D view for Case 1 ((a) t
Sources 175 (2008) 106–119 109
uel cells. The main reason causing frequent flooding is thathe arbitrary structure of conventional GDLs does not allow aell-organized liquid water flow.In the authors’ previous study [37], a unit serpentine gas flow
hannel with three different kinds of micro-structures of inno-ative GDLs were studied, and it was concluded that one of thehree GDLs performed the best water removing ability. In thisaper, the wettability of the best GDL in reference [37] was stud-ed; different static contact angles (hydrophobic, hydrophilic)ere assigned to the electrode (GDL and catalyst layer). In thisork, the details of phase change and electro-chemical reac-
ion were not considered. Based on the authors’ understanding,he effect of the electro-chemical reaction inside the PEM fuelell on liquid water behaviour is mainly to continuously supplyater. Based on this premise, various operating conditions forPEM fuel cell could be simulated without involving details
f electro-chemical reactions. In the present work, therefore, annitial liquid water distribution was employed to simplify theomplex process of real PEM fuel cell operating condition.
In the following, the computation domain, solution procedurend mesh independency are introduced. Then the results and dis-ussions are presented. Finally, conclusions are drawn and somealuable design and optimization related suggestions are given.
. Numerical model setup
.1. Computation domain with innovativeicro-flow-channels of GDL, and boundary conditions
Fig. 1 illustrates the schematics of the computation domain.t the top left side of Fig. 1b, the cross-section (the y–z plane)
long the center-plane of the GDL holes was shown. The com-
= 0.0002 s; (b) t = 0.01 s; (c) t = 0.015 s; (d) t = 0.02 s).

1 ower
psTtcah(fl
nmia(a0ttmh
clt(ntbo
acata
2
pFtvcttVwco
i
F
10 K. Jiao, B. Zhou / Journal of P
utation domain consists of the U-shaped channel—the unit of aerpentine PEM fuel cell flow channel and the cathode electrode.he gas flow channel has a cross-section of 1 mm × 1 mm along
he y- and z-directions. Each straight section of the gas flowhannel is 15 mm long. On the cathode electrode, small pathsre used to represent the holes on the GDL: trapezoids with theeight of 0.1 mm along the z-direction, and the minimum area0.1 mm × 0.1 mm along the x- and y- directions) facing the gasow channel.
As mentioned in the introduction, the conventional GDLs areot effective for water removal due to the random nature of itsicro-structure and small pore size (10–30 �m). Therefore, the
nnovative micro-structure of the GDL is studied, all the “pores”re well designed and structured, i.e., well-structured small holesmicro-flow-channels) connecting the gas flow channel and cat-lyst layer as shown in Fig. 1b. Furthermore there is a gap of.05 mm between the GDL and the membrane. The purpose ofhis study is to investigate how the liquid water flows throughhe GDL into the gas flow channel, to simplify the numerical
odel, the gap between the GDL and the membrane were set toave unity porosity.
The isothermal air–water transport process inside theomputation domain was modeled as a 3D two-phase viscousaminar flow. A no-slip boundary condition was applied tohe surrounding walls. A velocity inlet boundary conditionuniform air velocity distribution of 10 m s−1 with a direction
ormal to the inlet boundary) was applied at the air inlet ofhe upper section of the U-shaped channel. At the outlet, theoundary condition was assigned as outlet flow (the gradientsf all flow properties are zero). Gravity was taken as beingig. 6. Water distribution and velocity field on the plane at x = 0.00805 m in outlet se
Sources 175 (2008) 106–119
long the negative y-direction. To simulate water removalharacteristics of the GDL, different static contact angels weressigned to the electrode and an initial water distribution insidehe computation domain was carefully set up, and the detailsre given in the “results and discussions” section.
.2. Computational methodology
The numerical simulations of the 3D, unsteady, laminar, two-hase flow in the computation domain was performed usingLUENT [38]. An inspection of the numerical setup revealed
hat the Reynolds number in the model was less than 700, therebyerifying laminar flow assumption. No energy equations wereonsidered thus the conservation of mass and momentum werehe governing equations for the model. To track the air–waterwo-phase flow interface inside the computation domain, theolume-Of-Fluid (VOF) [38] method implemented in FLUENTas used. The VOF model is designed for two or more immis-
ible fluids, where the position of the interface between fluids isf interest.
Then the conservation laws of mass and momentum govern-ng the unsteady, laminar flow could be written as [38]:
Continuity equation:
∂ρ
∂t+ ∇ · (ρ�v) = 0 (1)
Momentum equation:
∂(ρ�v)
∂t+ ∇ · (ρ�v�v) = −∇p + ∇ · [μ(∇�v + ∇�vT )] + ρg + �F
(2)
ction for Case 1 ((a) t = 0.001 s; (b) t = 0.0015 s; (c) t = 0.002 s; (d) t = 0.02 s).

ower Sources 175 (2008) 106–119 111
w
t
α
i
μ
ct
F
weab
κ
wptawas
2
FEwectT0cibtin
3
Gt
Fig. 7. Water distribution and velocity field on the center-plane (y = 0.0005 m)in outlet section for Case 1 (×2 magnification along the z-direction for the elec-t(
Tse
K. Jiao, B. Zhou / Journal of P
here p is the static pressure and �F is the surface tension force.For volume fraction of liquid water (α2):
∂α2
∂t+ �v · ∇α2 = 0 (3)
The volume fraction of air (α1) could be obtained based onhe following relationship:
1 + α2 = 1 (4)
All the other properties (e.g., viscosity) could be computedn a volume-fraction weighted-average manner as:
= α2μ2 + (1 − α2)μ1 (5)
In the FLUENT simulation package, the surface tension isonsidered as a source term in the momentum equation. Forwo-phase flow, it can be expressed as:
vol = σ12ρκ∇α1
1/(2(ρ1 + ρ2))(6)
here Fvol is the source term of the surface tension in momentumquation, σ12 the surface tension coefficient, ρ the volume-veraged density, and κ is the surface curvature at the interfaceetween two phases. The surface curvature can be expressed as:
= ∇ · n̂ = ∇ · (n̂w cos θw + t̂w sin θw) (7)
here n̂ is the unit vector normal to the interface between twohases near the walls, n̂w the unit vector normal to the walls, t̂whe unit vector tangential to the walls, and θw is the static contactngle at the walls, as shown in Fig. 2. For the electrode surfacesith different wettabilities, different static contact angles were
ssigned, and different contact angles could result in differenturface tensions (Fvol), thus influencing on water transport.
.3. Validation of grid independency
There were 622,620 cells meshed in the computation domain.ig. 3 shows the mesh on y–z plane for the computation domain.ach cell in the straight channel sections had the same sizeith dimensions of 0.025 × 0.025 × 0.1. Trapeziform cells were
mployed to generate the corners of the serpentine gas flowhannels. The GDL holes were divided into four sections alonghe x- and y-directions, and five sections along the z-direction.he dimensions of the cells along the z-direction are 0.02 and.01 mm for the GDL and the catalyst layer, respectively. Thisomputation domain was first studied in reference [37]; gridndependency was tested by both doubling and halving the num-er of cells. The transport phenomena of liquid water betweenhe different mesh systems were almost the same. The differencen results for the different mesh systems was so small that it isegligible.
. Results and discussion
In order to investigate two-phase flow behaviour across theDL, three different cases corresponding to different static con-
act angles of GDL and catalyst layer were simulated as listed in
4asc
rode, ×3 minification along the z-direction for the flow channel) ((a) t = 0.01 s;b) t = 0.016 s; (c) t = 0.019 s; (d) t = 0.0192 s; (e) t = 0.0195 s; (f) t = 0.02 s).
able 1. As shown in Fig. 4a, Case 1 considered the GDL (theurrounding surfaces of the small holes and the surfaces on bothnds of the small holes) as hydrophilic (static contact angle of5◦), Case 2 considered the GDL as hydrophobic (static contact
ngle of 135◦), Case 3 considered the cathode electrode (all theurfaces of the GDL and the catalyst layer) as hydrophobic (staticontact angle of 135◦). A liquid water film was initially placed
112 K. Jiao, B. Zhou / Journal of Power Sources 175 (2008) 106–119
iew f
owosb
3o
hF0Rs
3
t
nrcItAdtftliata
F
Fig. 8. Liquid water distribution in 3D v
n the catalyst layer for all the three cases to investigate theater removal characteristics. Fig. 4b shows the arrangementf the initial water distribution, the “red colouring” repre-ents liquid water. Detailed results and discussions are givenelow.
.1. Case 1: water films with a thickness of 0.03 mm placedn catalyst layer with hydrophilic GDL
The first case was simulated to investigate the effects of theydrophilic GDL on liquid water flow behaviour. As shown inig. 4, and listed in Table 1, water films with a thickness of.03 mm were placed on catalyst layer with hydrophilic GDL.upture of water films, and water transport across the GDL were
tudied.
.1.1. Formation of liquid water “mesh”Fig. 5 shows the liquid water distribution in 3D view. At
= 0.0002 s (Fig. 5a), water film started rupturing from the cor-
ph“w
ig. 9. Water distribution and velocity field on the plane at x = 0.00805 m in outlet se
or Case 2 ((a) t = 0.005 s; (b) t = 0.02 s).
er to the straight sections. Such process is similar to the resultseported in reference [37], which has concluded that the pro-ess is due to the stronger secondary flow around the corner.t could also be noticed that, at t = 0.01 s (Fig. 5b), the ini-ially set liquid water film ruptured into liquid water “mesh”.s time passed, more parts of the “mesh” ruptured (Fig. 5c and). However, most of the liquid water “mesh” remained until= 0.02 s (Fig. 5d). The reason that such liquid water “mesh”ormed could be explained with help of Fig. 6, which showshe cross-section at x = 0.00805 m in the lower section (out-et) of the computation domain. At t = 0.001 s (Fig. 6a), thenitially attached flat water film was in wave-form, and then,t t = 0.0015 s (Fig. 6b), more air started flowing into the elec-rode and the water film was broken up. After a period of time,t t = 0.002 s (Fig. 6c), liquid water were broken up into four
arts—between the holes of the GDL, and the two sides of theoles. Therefore, as shown in Figs. 5 and 6, the liquid watermesh” had its void area directly facing the holes, and its liquidater surrounding the holes. Later on, these parts of water did notction for Case 2 ((a) t = 0.001 s; (b) t = 0.002 s; (c) t = 0.005 s; (d) t = 0.02 s).

K. Jiao, B. Zhou / Journal of Power Sources 175 (2008) 106–119 113
F tlet se
mwtiuwotTeusuflcwvf
3
sttolafwtht
bflotmtEhpifl
3o
ti0Rs
3
daa1
ig. 10. Water distribution and velocity field on the plane at x = 0.01405 m in ou
ove to anywhere else (Fig. 6d). This is because these parts ofater were sticking on both the surface of the catalyst layer and
he bottom surface of the GDL. However, it has been concludedn reference [37], this GDL has significant effect on breakingp liquid water between the holes. The reason that such effectas not observed in this case is due to the hydrophilic propertyf the GDL. As mentioned, these parts of water also stick onhe surface of the GDL, which provided strong wall adhesion.herefore, the liquid water became harder to be removed. How-ver, some parts of the liquid water “mesh” could still be brokenp, as shown in Fig. 5. Fig. 7a and b shows a clear view onuch process, it could be observed that some parts of the liq-id water between the holes were removed. Based on the waterow behaviours that described in this section, it could be con-luded that, hydrophilic GDL could provide more significantall adhesion effect on liquid water in catalyst layer, thus pre-enting liquid water flowing out, which is not good for PEMuel cell operation.
.1.2. Back flow of liquid waterEven liquid water “mesh” was formed in the catalyst layer,
ome liquid water still flowed out of the electrode. Fig. 7 showshe center plane (y = 0.0005 m) of the lower straight section. At= 0.019 s (Fig. 7c), some liquid water from upstream could bebserved. It should be noticed that, the coming water did noteave the surface of the GDL. This is because of the strong walldhesion of GDL surface. As water flowed along the GDL sur-ace, when it reached the holes of the GDL, due to the strong
all adhesion, some of the water flowed along the surface ofhe GDL into the holes, as shown in Fig. 7. When one of theoles was filled with water (Fig. 7e), other liquid water couldhen “jump” that hole to the next, and similar liquid water flow
“iafi
ction for Case 2 ((a) t = 0.004 s; (b) t = 0.0047 s; (c) t = 0.0049 s; (d) t = 0.005 s).
ehaviours could be observed in the next hole—some waterowed in, some water “jumped”. As shown in Fig. 7d–f, somef the water flowed across the GDL into the catalyst layer, andhen flowed out again across the next hole. As mentioned, the
ain reason that such flow phenomenon was observed is dueo the hydrophilic property of the GDL (strong wall adhesion).ven some of the water could be removed from the electrode;owever, water could not leave the surface of the GDL. Suchrocess increased the chance for the liquid water flowing backnto the electrode, and such back flow of liquid water is not goodor PEM fuel cell operation—it blocks the GDL and the catalystayer.
.2. Case 2: water films with a thickness of 0.03 mm placedn catalyst layer with hydrophobic GDL
The second case was simulated to investigate the effects ofhe hydrophobic GDL on liquid water flow behaviour. As shownn Fig. 4, and listed in Table 1, water films with a thickness of.03 mm were placed on catalyst layer with hydrophobic GDL.upture of water films, and water transport across the GDL were
tudied.
.2.1. Rupture of liquid water filmAs shown in Fig. 8, the liquid water film ruptured into
ifferent pieces. The void and flooding areas were clearly sep-rated. Liquid water occupied both the area under the holesnd between the holes of the GDL, this is dissimilar to Case, in which most water stayed between the holes and formed
mesh”. Figs. 9 and 10 show the water distribution and veloc-ty field on the y–z planes for both the flooding area and voidrea, respectively. For the flooding area (Fig. 9), the flat waterlm became in wave-form first (Fig. 9a), and then, more water
1 ower
flaaGmrbsiffvltptala
da
3
wnasGtlbAf
F×
14 K. Jiao, B. Zhou / Journal of P
owed onto this plane, then water filled the whole catalyst layernd touched the surface of the GDL (Fig. 9b). As time passed,t t = 0.005 s (Fig. 9c), some water already flowed through theDL into the gas flow channel. However, water almost stoppedoving after that, at t = 0.02 s (Fig. 9d), the water distribution
emained almost the same (by comparing to Fig. 9c). This isecause both the air flow along the channel and the wall adhe-ion stopped liquid water moving. For the void area (Fig. 10),t could be observed that the water film first became in wave-orm as well (Fig. 10a), and then was broken up by the air flowrom the holes of the GDL (Fig. 10b). Fig. 10a and b showedery similar water flow pattern as in Case 1, however, when theiquid water was split into small pieces, dissimilar to Case 1,he water were removed. This is because of the hydrophobicroperty of the GDL—when the small pieces of liquid water
ouched the surface of the GDL, the wall adhesion was weaknd could not hold the water. Therefore, these small pieces ofiquid water were flowed away and formed the flooding areas,s discussed with Fig. 9. Generally speaking, the whole processteWb
ig. 11. Water distribution and velocity field on the center-plane (y = 0.0005 m) in out3 minification along the z-direction for the flow channel) ((a) t = 0.002 s; (b) t = 0.00
Sources 175 (2008) 106–119
escribed with Figs. 9 and 10 produced those flooding and voidreas.
.2.2. Force balance across the GDLAs discussed in Case 1, there were small pieces of the liquid
ater staying between the holes of the GDL, but such phe-omenon was not observed in Case 2 due to the weak walldhesion of the GDL surface. However, the weak wall adhe-ion could be enhanced by increasing the contact area betweenDL surface and liquid water. Fig. 11 shows the water distribu-
ion and velocity field on the center-plane (y = 0.0005 m) in theower section, it could be observed that the initial water film wasroken up, and both the void and flooding areas were formed.s discussed in Section 3.2.1, after these flooding areas were
ormed, the water almost stopped moving. This is because as
he flooding area increased, the contact area between water andlectrode surface also increased, so the wall adhesion increased.hen the flooding area was large enough, the wall adhesionecame strong enough to stop liquid water moving. Unfortu-
let section for Case 2 (×2 magnification along the z-direction for the electrode,3 s; (c) t = 0.004 s; (d) t = 0.005 s; (e) t = 0.006 s; (f) t = 0.02 s).

K. Jiao, B. Zhou / Journal of Power Sources 175 (2008) 106–119 115
(Cont
nsrccclc
3oc
Fig. 11.
ately, based on the water flow phenomenon described in thisection, even the GDL was changed to be hydrophobic, the wateremoval was still not improved, a significantly amount of waterould still be observed in the catalyst layer. Therefore, it could beoncluded that, if only hydrophobic GDL is used, liquid water
ould be expelled to both sides (gas flow channel and catalystayer), the catalyst layer could be flooded and the water drainageould be even worse.tla
Fig. 12. Liquid water distribution in 3D view
inued ).
.3. Case 3: water films with a thickness of 0.03 mm placedn catalyst layer with hydrophobic electrode (GDL andatalyst layer)
The third case was simulated to investigate the effects of
he combination of hydrophobic GDL and hydrophobic cata-yst layer on liquid water flow behaviour. As shown in Fig. 4,nd listed in Table 1, water films with a thickness of 0.03 mmfor Case 3 ((a) t = 0.001 s; (b) t = 0.02 s).

116 K. Jiao, B. Zhou / Journal of Power Sources 175 (2008) 106–119
F tlet s
wt
3
Cdumswfwitdtlat“hdh
3
c“(om
tflactmtohsiflffli
3
cpottisoad
ig. 13. Water distribution and velocity field on the plane at x = 0.00805 m in ou
ere placed on catalyst layer. Rupture of water films, and waterransport across the GDL were studied.
.3.1. Formation of liquid water “string”Fig. 12 shows the liquid water distribution in 3D view for
ase 3. It could be observed that the water distribution wasifferent from the previous cases. At t = 0.001 s (Fig. 12a), liq-id water “strings” were formed along the center line of theain air flow. The water “strings” then started being removed, as
hown in Fig. 12b, at t = 0.02 s, some parts of the water “strings”ere already removed. The reason that the water “strings” were
ormed could be explained with help of Fig. 13, which shows theater distribution and velocity field on the plane at x = 0.00805 m
n the lower section. At t = 0.0003 s (Fig. 13a), air flowed intohe holes on both sides, and pushed liquid water to the mid-le, and due to the weak wall adhesion of all the surfaces ofhe electrode, water became easier to be removed. Therefore,iquid water followed the air stream and flowed from the topnd bottom into the hole in the middle. At t = 0.002 s (Fig. 13c),he movement of water became slower, this is because once thestrings” being formed, the air flowing into the top and bottomoles could also flow out from other top and bottom holes, thusecreasing the driving force of the liquid water in the middle,owever, as mentioned, water was still being removed.
.3.2. Liquid water flowing back into the electrodeFig. 14 shows the water distribution and velocity field on the
enter-plane of the lower section (y = 0.0005 m), the formation of
strings” could also be observed from this figure. At t = 0.0003 sFig. 14a), strong streams flowing out of the electrode could bebserved, and later on, more water flowed onto this plane (asentioned, from the top and bottom), at t = 0.0004 s (Fig. 14b),pwiw
ection for Case 3 ((a) t = 0.0003 s; (b) t = 0.0005 s; (c) t = 0.002 s; (d) t = 0.02 s).
he whole electrode was filled with water and the water was stillowing out. The stream became weaker at t = 0.0007 s (Fig. 14d),nd at that time, more water could be observed in the gas flowhannel. At t = 0.001 s (Fig. 14e), the streams flowing back intohe electrode could be observed, and some water that previouslyoved into the gas flow channel then moved back into the elec-
rode. As shown in Fig. 14f, at t = 0.002 s, less water could bebserved in the gas flow channel, and the streams across theoles could be no longer apparently observed. The reason thatome water flowed into the gas flow channel but then flowed backnto the electrode is that, from the beginning the driving force toow out the water was strong, however, after the “strings” wereormed, the driving force was lost because the air stream couldow out from other holes, and part of the water that just flowed
nto the gas flow channel could flow back into the electrode.
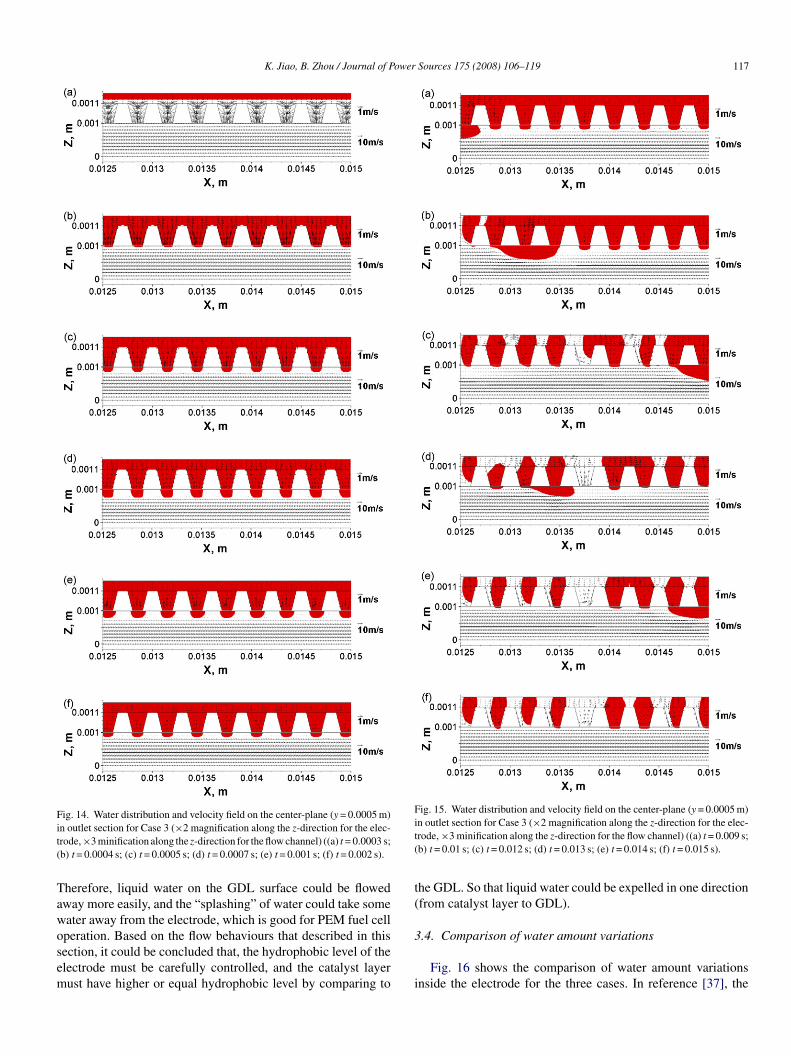
.3.3. “Splashing” of liquid waterFig. 15 shows the water distribution and velocity field on the
enter-plane of the lower section (y = 0.0005 m) for a later timeeriod. At t = 0.009 s, some water from the upstream could bebserved, the water flowed along the air stream and splashed ono the holes at the downstream. Some water inside the holes wasaken away by the liquid water “splashing” process. As shownn Fig. 15c (t = 0.012 s), when water flowed away from the hole,ignificant amount of water in the electrode was removed. Latern, another part of water from the upstream could be observed,nd more water was taken away by it, as shown in Fig. 15d–f. Asiscussed in Case 1, dissimilar to this case, due to the hydrophilic
roperty of the GDL, liquid water flowing from the upstreamould always stick on the surface of the GDL and even flow backnto the electrode. However, in this case, the wall adhesion iseaker due to the hydrophobic property of the whole electrode.
K. Jiao, B. Zhou / Journal of Power Sources 175 (2008) 106–119 117
Fig. 14. Water distribution and velocity field on the center-plane (y = 0.0005 m)it(
Tawosem
Fig. 15. Water distribution and velocity field on the center-plane (y = 0.0005 m)it(
t(
n outlet section for Case 3 (×2 magnification along the z-direction for the elec-rode,×3 minification along the z-direction for the flow channel) ((a) t = 0.0003 s;b) t = 0.0004 s; (c) t = 0.0005 s; (d) t = 0.0007 s; (e) t = 0.001 s; (f) t = 0.002 s).
herefore, liquid water on the GDL surface could be flowedway more easily, and the “splashing” of water could take someater away from the electrode, which is good for PEM fuel cell
peration. Based on the flow behaviours that described in thisection, it could be concluded that, the hydrophobic level of thelectrode must be carefully controlled, and the catalyst layerust have higher or equal hydrophobic level by comparing to3
i
n outlet section for Case 3 (×2 magnification along the z-direction for the elec-rode, ×3 minification along the z-direction for the flow channel) ((a) t = 0.009 s;b) t = 0.01 s; (c) t = 0.012 s; (d) t = 0.013 s; (e) t = 0.014 s; (f) t = 0.015 s).
he GDL. So that liquid water could be expelled in one directionfrom catalyst layer to GDL).
.4. Comparison of water amount variations
Fig. 16 shows the comparison of water amount variationsnside the electrode for the three cases. In reference [37], the

118 K. Jiao, B. Zhou / Journal of Power Sources 175 (2008) 106–119
F
sfihafimptptsiahhaiwctplavm
F
aaciobolliPea
4
ibcew
ig. 16. Water amount variation inside the electrode for the three cases.
ame case with a contact angle of 90◦ for all the electrode sur-aces was simulated, it showed that at t = 0.02 s, the water amountnside the electrode became 88%. For Case 1, surprisingly, aydrophilic GDL even improved the water removal ability (77%t t = 0.02 s). This is because such GDL helped break up the waterlm into small pieces, and the small pieces of water could beore easily removed. For Case 2, a hydrophobic GDL did not
rovide any improvements on water removal (90% at t = 0.02 s),his is because such GDL provided more chances to form largeieces of water, therefore, the increased contact area betweenhe electrode surface and water increased the wall adhesion totop liquid water moving. Case 3 showed significant advantagen water removal by comparing to the other two cases (54%t t = 0.02 s). The reason is that, the hydrophobic catalyst layerelped break up the liquid water film, and the hydrophobic GDLelped water flow out of the electrode. An increase of watermount could be observed following a sharp drop, the reasons discussed in Section 3.3.2. Fig. 17 shows the comparison ofater amount variation inside the catalyst layer for the three
ases. Case 3 still provided a much better result than the otherwo cases. However, Case 2 showed less water amount by com-aring to Case 1, as mentioned in section 3.2, this is because thearge pieces of liquid water in Case 2 occupied both the GDL
nd the electrode. Fig. 18 shows the comparison of water amountariation inside the GDL, without any surprise, Case 2 showedore water amount than Case 1. Base on the comparison of waterig. 17. Water amount variation inside the catalyst layer for the three cases.
bw
(
(
(
(
Fig. 18. Water amount variation inside the GDL for the three cases.
mount variation of the three cases, it could be concluded that, ifll the surfaces of the electrode are hydrophobic, water removalould be significantly improved, and only changing the wettabil-ty of the GDL might not provide any significant improvementn water removal. The hydrophobic level of the electrode muste carefully controlled, and the catalyst layer must have higherr equal hydrophobic level by comparing to the GDL. So thatiquid water could be expelled in one direction (from catalystayer to GDL). As mentioned in Section 4.3 of reference [1],t was also stated that: when people prepare the catalyst layer,TFE is often added also, because the hydrophobic PTFE willxpel the product water to other places, this also supports theuthor’s conclusion.
. Conclusions
In this paper, a cathode electrode with different wettabil-ties have been proposed and investigated. The liquid waterehaviours in the electrode together with serpentine gas flowhannel on cathode side of a PEM fuel cell were studied bymploying a 3D, unsteady, two-phase flow model in FLUENTith an initial water distribution. By investigating the flowehaviours of liquid water and air velocity fields, the followingater management issues and suggestions are given:
1) Hydrophilic GDL could retain liquid water on its surfaces,and liquid water “mesh” could be formed in catalyst layeralong the surfaces of the GDL. These hydrophilic sur-faces result in stronger wall adhesions, so it is difficult forwater to be removed, which is not good for PEM fuel celloperation.
2) Hydrophilic GDL surface could also attract liquid waterfrom gas flow channel into the electrode, which is not goodfor PEM fuel cell operation.
3) If only hydrophobic GDL is used, liquid water could beexpelled to both sides (gas flow channel and catalyst layer),
the catalyst layer could be flooded and the water drainagecould be even worse.4) Hydrophobic catalyst layer could help break up liquid waterfilms significantly. Liquid water “strings” could be formed,the water drainage could also be improved.

ower
(
(
(
A
tDo(S
R
[[[[
[[[[[[[[[
[[[[[[
[[[
[[[
K. Jiao, B. Zhou / Journal of P
5) If liquid water from the electrode moves too fast into the gasflow channel, part of the water could be “pushed” back intothe electrode due to the air flow.
6) Due to the weak wall adhesion of hydrophobic GDL sur-faces, liquid water from gas flow channel could take awaysome liquid water inside the GDL, and such “splashing” ofliquid water is good for water drainage.
7) The hydrophobic level of the electrode must be carefullycontrolled, and the catalyst layer must have higher or equalhydrophobic level by comparing to the GDL. So that liquidwater could be expelled in one direction (from catalyst layerto GDL).
cknowledgements
The authors are grateful for the support of this work byhe Auto21TM Networks of Centres of Excellence (Grant D07-FC), the Natural Sciences and Engineering Research Councilf Canada (NSERC), the Canada Foundation for InnovationCFI), the Ontario Innovation Trust (OIT), and the Graduatechool at the University of Windsor.
eferences
[1] J. Larminie, A. Dicks, Fuel Cell Systems Explained, second ed., John Wiley& Sons, New York, 2000.
[2] J.S. Yi, J.D. Yang, C. King, AIChE J. 50 (2004) 2594.[3] C.Y. Wang, Chem. Rev. 104 (2004) 4727.
[4] A. Kraytsberg, Y. Ein-Eli, J. Power Sources 160 (2006) 194.[5] S. Um, C.Y. Wang, K.S. Chen, J. Electrochem. Soc. 147 (2000) 4485.[6] S. Dutta, S. Shimpalee, J.W. Van Zee, J. Appl. Electrochem. 30 (2000) 135.[7] E. Hontanon, M.J. Escudero, C. Bautista, P.L. Garcia-Ybarra, L. Daza, J.Power Sources 86 (2000) 363.
[[[[
Sources 175 (2008) 106–119 119
[8] S.W. Cha, R. O’Hayre, Y. Saito, F.B. Prinz, J. Power Sources 134 (2004)57.
[9] A.A. Kulikovsky, Electrochem. Commun. 3 (2001) 460.10] Z.H. Wang, C.Y. Wang, K.S. Chen, J. Power Sources 94 (2001) 40.11] L. You, H. Liu, Int. J. Heat Mass Transfer 45 (2002) 2277.12] W. He, J.S. Yi, T.V. Nguyen, AIChE J. 46 (2000) 2053.13] L.B. Wang, N.I. Wakayama, T. Okada, Electrochem. Commun. 4 (2002)
584.14] B. Carnes, N. Djilali, Electrochem. Acta 52 (2006) 1038.15] C.I. Lee, H.S. Chu, J. Power Sources 161 (2006) 949.16] H. Meng, J. Power Sources 168 (2007) 218.17] U. Pasaogullari, C.Y. Wang, J. Electrochem. Soc. 152 (2005) A380.18] H. Meng, C.Y. Wang, J. Electrochem. Soc. 152 (2005) A1733.19] Y. Wang, C.Y. Wang, J. Electrochem. Soc. 153 (2006) A1193.20] H. Meng, C.Y. Wang, Chem. Eng. Sci. 59 (2004) 3331.21] H. Ju, C.Y. Wang, J. Electrochem. Soc. 151 (2004) A1954.22] H. Ju, C.Y. Wang, S. Cleghorn, U. Beuscher, J. Electrochem. Soc. 153
(2006) A249.23] Y. Wang, C.Y. Wang, J. Power Sources 153 (2006) 130.24] P. Quan, B. Zhou, A. Sobiesiak, Z. Liu, J. Power Sources 152 (2006) 131.25] K. Jiao, B. Zhou, P. Quan, J. Power Sources 154 (2006) 124.26] K. Jiao, B. Zhou, P. Quan, J. Power Sources 157 (2006) 226.27] T.V. Nguyen, M.W. Knobbe, J. Power Sources 114 (2003) 70.28] T.A. Trabold, J.P. Owejan, D.L. Jacobson, M. Arif, P.R. Huffman, Int. J.
Heat Mass Transfer 49 (2006) 4712.29] X. Li, I. Sabir, J. Park, J. Power Sources 163 (2007) 933.30] D. Spernjak, A.K. Prasad, S.G. Advani, J. Power Sources 170 (2007) 334.31] X.G. Yang, F.Y. Zhang, A. Lubawy, C.Y. Wang, Electrochem. Solid-State
Lett. 7 (2004) A408.32] F.Y. Zhang, X.G. Yang, C.Y. Wang, J. Electrochem. Soc. 153 (2006) A225.33] J.H. Nam, M. Kaviany, Int. J. Heat Mass Transfer 46 (2003) 4595.34] H. Dohle, R. Jung, N. Kimiaie, J. Mergel, M. Muller, J. Power Sources 124
(2003) 371.35] U. Pasaogullari, C. Wang, Electrochem. Acta 49 (2004) 4359.36] S. Freni, G. Maggio, E. Passalacqua, Mater. Chem. Phys. 48 (1997) 199.37] K. Jiao, B. Zhou, J. Power Sources 169 (2007) 296.38] Fluent 6.2 User’s Guide, Fluent Inc., 2005.