Changes in Active Behaviours, Physical Activity, Sedentary ...
Upload
independentCategory
view
0download
0
ARTICLE IN PRESS
Journal ofAdolescence
Journal of Adolescence 29 (2006) 33–52
0140-1971/$30
rights reserved
doi:10.1016/j.
�CorresponE-mail add
www.elsevier.com/locate/jado
Relationships among negative and positive behavioursin adolescence
Shawn Boles�, Anthony Biglan, Keith Smolkowski
Oregon Research Institute, 1715 Franklin Boulevard, Eugene, OR 97403-1983, USA
Abstract
The authors calculated binary indicators of seven positive and 23 negative behaviours for 22,898 8th and15,828 11th grade students who participated in the Oregon Healthy Teens Survey across two school years.Relationships among these variables, using both the Jaccard measure of co-occurrence and the relative riskfor each member of each variable pair, given exposure to the other, showed strong inter-relationshipswithin, but not between, the sets of behaviours. The likelihood of negative behaviours given negativebehaviours was much stronger than the likelihood of positive behaviours given positive behaviours. Positivebehaviours provided little protection against the likelihood of negative behaviors.r 2005 The Association for Professionals in Services for Adolescents. Published by Elsevier Ltd. All rightsreserved.
Introduction
This paper presents an analysis of the relationships among adolescent behaviours. The seminalwork of the Jessors (Jessor & Jessor, 1977) helped to establish that youth engaging in a givenproblem behaviour are likely to engage in other problem behaviours (Biglan et al., 2004).However, most studies have focused on the relationships among substance use and antisocialbehaviour (e.g., Ary et al., 1999; Dishion, Capaldi, Spracklen, & Li, 1995; Windle, 1990), orpsychological problems such as depression (White, Xie, Thompson, Loeber, & Stouthamer-
.00 r 2005 The Association for Professionals in Services for Adolescents. Published by Elsevier Ltd. All
.
adolescence.2005.01.007
ding author. Tel.: +1 541 484 2123; fax: +1 541 484 1108.
ress: [email protected] (S. Boles).

ARTICLE IN PRESS
S. Boles et al. / Journal of Adolescence 29 (2006) 33–5234
Loeber, 2001). We analysed the relationships among a larger set of problems (23 behaviours) thanhas typically been studied. Moreover, only a few studies have included behaviours consideredsocially desirable (Benson, 1998; Jessor, 1987a, b). In the present paper, we include a set of sevenitems representing behaviours generally considered desirable. We then examine relationshipsbetween this set of behaviours and the other sets of problem behaviours.Understanding the relationships among adolescent behaviours could contribute to strategies for
preventing, ameliorating, and understanding the development of both problem behaviour andmore socially desirable behaviour. To the extent that problem behaviours co-occur, it is importantto develop treatment and prevention interventions that address the entire range of problems andto evaluate those interventions in terms of their effect on all problems (Biglan et al., 2004).Moreover, precise understanding of the inter-relationship among adolescent behaviours supportsa key task for developmental research, namely, analysis of the factors that influence thesequencing and clustering of behaviours.Recently, interest in relationships among desirable behaviours and the relationships between
such behaviours and problem behaviours has increased. There has been concern that a restrictedfocus on problem behaviour may stigmatize youth and undermine efforts to promote support fortheir successful development (Benson, 1998). In this context, many advocate promotion ofpositive social behaviour (e.g., Catalano, Hawkins, Berglund, Pollard, & Arthur, 2002; NationalResearch Council & Institute of Medicine, 2002). The extent to which positive or socially desirablebehaviours are inter-related and negatively associated with problem behaviours is relevant to thisissue. If behaviours such as volunteer work and academic achievement are highly related, it maybe possible to promote them and achieve the general development of civically valuablebehaviours. If high levels of engagement in desirable behaviours relate negatively to problembehaviours, it may be possible to prevent problems by promoting these desirable behaviours.However, if positive and problem behaviours are generally unrelated, the promotion of positivebehaviours may have little benefit in preventing problematic adolescent behaviour.We assessed a set of social behaviours that appears advantageous to adolescents and those
around them. These are academic performance, religious involvement, participation in sports andvolunteer activities, and involvement in paid work and chores at home. For clarity, we label thesepositive behaviours ‘‘desirable.’’ The behaviours cover a range of facets of adolescent life,including school, home, community, work, and recreation. If these behaviours were highly inter-related, it would suggest the value of further studying the sequence of their development and theinfluences on such development. These behaviours are a small sample of those we might assess,such as reading, helping a friend with homework, or participating in a social club.It is important to acknowledge that the distinction between ‘‘positive’’ or desirable and
‘‘negative’’ behaviours is, in some cases, arbitrary. For example, although we assessed not wearingseatbelts, we could also have used a reversed coding scheme and labelled the variable, ‘‘wearingseatbelts.’’ Moreover, the benefit or harm of certain behaviours remains debatable. For example,while there is an obvious financial benefit to paid work, the literature indicates that many of theconsequences of employment for adolescents may be deleterious (Greenberger & Steinberg, 1986;Steinberg & Dornbusch, 1991; Staff & Uggen, 2003).In the present study, we found that paid work among 11th grade students was associated with
an elevated risk of substance use, sexual involvement, and truancy. We therefore treated the ‘paidwork’ item as negative and included it with other indicators of poor time use. Finally, in the same

ARTICLE IN PRESS
S. Boles et al. / Journal of Adolescence 29 (2006) 33–52 35
sense that health is more than the absence of illness (Encyclopædia Britannica, 2004), for somevariables (e.g., antisocial behaviour), absence does not imply the complementary state.There may be gender differences in the relationships among behaviours. For example, it is
possible that weapon carrying is more highly associated with other forms of antisocial behaviouramong boys than it is among girls. Differences in such patterns could provide clues regarding theprocesses involved in the development of behaviours and would indicate ways in which preventionand treatment interventions might need to be different, depending on gender.It also seems likely that there will be developmental differences in the co-occurrence of problem
behaviours. It is known that there is a higher prevalence of antisocial behaviour and substance usein mid-adolescence than there is in early adolescence (Biglan et al., 2004) and that later startingdelinquents are less likely to become career criminals (Patterson & Yoerger, 1997; Moffit & Caspi,2001). Therefore, it is possible there will be higher levels of co-occurrence among problems foryounger adolescents because engaging in problem behaviour at a younger age reflects membershipin a ‘‘hard core’’ group with multiple problems.Most analyses of the inter-relationships among harmful behaviours have employed correlational
procedures. Such analyses make it impossible to tell how likely a particular behaviour is, given thatthe young person is engaging in another behaviour. Nor do these analyses allow an estimation of theproportion of the population that engages in multiple problem behaviours. This is important since, ifmultiple harmful behaviours are concentrated in a small number of young people, it could beappropriate to target this group with the limited treatment and prevention resources available. To theextent that problems do not co-occur, it would be better to expend resources on interventions thatare more inclusive. For this reason, the present paper examines relationships among measures ofadolescent behaviour that were dichotomized to reflect the presence or absence of the behaviour or alevel of the behaviour that is deemed likely to be of significance for the well-being of the adolescent.In this paper, we first provide population-based estimates of the occurrence and co-occurrence
of desirable and problem behaviours among Oregon adolescents in grades 8 and 11. Then, weanalyse the relative risk of behaviours given other behaviours, with particular attention to gradeand gender differences. We examine relative risk among antisocial behaviours, among substanceuse behaviours, and among other sets of problem behaviours. Next, we examine relative risksamong socially desirable behaviours. Finally, we present relative risks between sets of problembehaviours and between sets of desirable behaviours.
Methods
Oregon Healthy Teens (OHT) is an annual population-based survey designed to monitoradolescent well-being in Oregon. The survey is a collaborative effort of Oregon Research Institute,the Oregon Department of Human Resources, the Oregon Department of Education, and theOregon Commission on Children and Families. The National Cancer Institute funded the projectto support the analysis of factors influencing youthful tobacco use. Here we present results fromthe first two years of the survey (2001, 2002).We identified the sampling frame as the entire set of 231 youth communities in Oregon, defining
a youth community as a public high school and the middle, junior, or elementary schools that feedinto it. In the first year, we drew a probability sample, proportional to enrolment size, of 115

ARTICLE IN PRESS
S. Boles et al. / Journal of Adolescence 29 (2006) 33–5236
youth communities and successfully recruited the schools in 79 (69%) of those communities toparticipate in the survey. In the second year, we recruited schools in 14 additional communitiesfrom the original sample. However, three schools dropped out, giving us 78% of the originalcommunity sample in the second year.We attempted to survey all 8th and 11th grade students in the participating communities
annually, using local Institutional Review Board-approved procedures. Approximately fourweeks before survey administration, parents of each student received notification letters at theirhomes, with instructions to notify the school if they wished their child not to participate. Researchstaff administered anonymous student questionnaires in classrooms during regular school periodsand instructed students that their participation was voluntary. There were 52,579 8th and 11thgrade students enrolled during the first two years of the survey. Parents of 5% of the enrolledstudents wished their child not to participate and an additional 2% of enrolled students chose notto participate. In addition, another 14% of the students listed on the class rosters were not presenton the day of the survey, bringing the student participation rate to 79%. Student participationrates did not vary systematically across years or communities.
The student questionnaire
The OHT questionnaire consists of a demographics section and six health area content modules.Alternate survey forms included the demographics section and three systematically rotated contentmodules. Students received one of these 20 alternate forms at random. This permitted collection ofdata on a wide range of aspects of adolescent well-being, as well as data about risk and protectivefactors. The combination of the modular design and administration protocol assured thatapproximately 50% of all students surveyed answered data for each item in any content module.Aspects of youth functioning addressed by survey items were identified based on evidence aboutthe most common and costly problems of youth (Biglan et al., 2004) and on research on indicatorsof positive youth development (Benson, 1990, 1998; National Research Council & Institute ofMedicine, 2002). Items came from the Youth Risk Behavior Survey (Kann et al., 2000), theCommunities That Care assessment (Arthur, Hawkins, Pollard, Catalano, & Baglioni, 2002), andquestionnaires developed at ORI in previous studies of tobacco use (Biglan, Ary, Smolkowski,Duncan, & Black, 2000) and other substance use (Metzler, Biglan, Ary, & Li, 1998).
Sample
The Oregon Healthy Teens student sample consisted of 41,538 students in 8th and 11th gradesfrom the first two assessment years (T1 and T2). Of those students, we eliminated 791 (1.9%) dueto invalid response patterns—either inconsistent or bogus response patterns. For the former, weremoved students with repeated inconsistent responses, such as when students reported no alcoholuse in the past 30 days but then said they drank alcohol on school property 20 or more days in thesame time frame. The number of inconsistencies required to remove a case varied by surveymodule, as some modules contained fewer unambiguous questions, but generally, we removedstudents with five to nine inconsistencies.We also removed students if they supplied bogus response patterns. These patterns consisted of
an unattainable number of problem behaviours, such as students who marked the maximum on

ARTICLE IN PRESS
S. Boles et al. / Journal of Adolescence 29 (2006) 33–52 37
all marijuana items. This bogus response would include smoking marijuana 20 or more times inthe past 24 hours and smoking marijuana 40 or more times on school property in the past 30 days.As with inconsistent responses, the number of bogus responses varied depending on survey form.Some forms allowed fewer questions we could code as bogus. In general, we removed studentswith 4 to 11 bogus responses from the sample.Finally, we removed 1896 students who failed to report their gender and 125 students for whom
all of the 30 variables of interest were missing. The final sample included 38,726 students: 17,122(44.2%) at T1 and 21,604 (55.8%) at T2; 22,898 (59.1%) in 8th grade and 15,828 (40.9%) in 11thgrade; 19,560 (50.5%) female and 19,166 (49.5%) male. Five percent were Native American, 4%Asian, 2% Hawaiian or Pacific Islanders, 3% African American, 10% Hispanic, and 83% wereWhite, non-Hispanic. Seventy-two percent of the students lived in two parent households. Eighty-eight percent of the students’ parents had completed high school, and 18% had completed college.Seventy-two percent of the participating students lived in an urbanized area. These sampledemographics are representative of the state as a whole.
Data preparation and analytic methods
Student responses to 30 of the items1 from OHT survey modules collected across the 2000–2001and 2001–2002 school years for 8th and 11th grade classes were recast as binary items based oninspection of the distribution of responses, professional judgment, and/or natural division points.2
Variables having to do with substance use, drunk driving, weapon carrying, gang involvement,setting fires, condom use, pregnancy, extreme dieting, bike helmet use, seatbelt use, and truancy,we coded to distinguish any involvement from no involvement in the behaviour. We codedexercise to distinguish those who exercised four or fewer days (in the past 7 days) from those whoexercised more. We dichotomized paid work based on having averaged three or more hours ofwork per week in the past month. Sports, volunteer participation, doing homework, andhousehold chores were split at five or fewer hours per month. Religious participation split atrarely or never vs. more-frequent participation. We dichotomized watching television todistinguish those who reported watching four or more hours a day of TV from everyone else.The grade variable distinguished students who reported their grades as much better than those oftheir peers from those who reported their grades as only slightly better or worse than their peers.We coded the weight variable to distinguish those reporting being ‘‘very overweight’’ from
everyone else. We dichotomized on the sex partner variable to distinguish those who had anyintercourse in the past three months from those who had not. We classed respondents as havingengaged in antisocial behaviour if they reported having engaged in three or more of the followingbehaviours in the past three months: suspended from school, stolen something worth more than$10, stolen motor vehicle, attacked someone, stopped by police, arrested, or used a weapon in afight. If they reported fewer than two of these behaviours, they received a zero.We organized the 30 negative behaviour items into eight groups for analysis and explication
purposes. These item sets are representative of the survey content modules and indicate areas ofyouth functioning thought to be important measures of adolescent health and well-being (Biglan
1Module items and response categories for OHT Survey are at http://www.ori.org/oht/studentquestion.html.2Criteria for dichotomization and full item definitions are at http://www.ori.org/oht/som.

ARTICLE IN PRESS
S. Boles et al. / Journal of Adolescence 29 (2006) 33–5238
et al., 2004). The seven sets of negative items were substance use (7 items), antisocial behaviour (4items), depression (2 items), high-risk sexual behaviour (3 items), eating disorders (2 items), safety(2 items), and poor time use (3 items). The seven desirable items constituted the eighth set.We report on two methods3 we used to explore the relationships among these items, analysis of
co-occurrence and calculation of the relative risk of each behaviour given each other behaviour.
Co-occurrenceThere are several methods for characterizing co-occurrence. One could examine the proportion
of all members of the population with both behaviours. However, for relatively rare events, thisapproach may give undue weight to the cases that exhibited neither behaviour (Kaufman &Rousseeuw, 1990). An alternative is the Jaccard method, which calculates the proportion of thosewho have one or the other problem to those who have both problems (Kaufman & Rousseeuw,1990). The relative prevalence of the two behaviours affects the results of this method. This is themetric used in this paper. We calculated co-occurrence for the complete set of 30 behaviours forthe 8th and 11th grades separately.
Relative riskWe calculated the relative risk for each variable given each other variable using the SAS FREQ
Procedure (Stokes, Davis, & Koch, 1995). In the case of 8th graders, we did not include drunkdriving and condom use because so few youth reported these behaviours.4 Each table entryindicates the risk of the problem shown in the column, given the problem shown in the row.Relative risk indices provide a better statistical test of co-occurrence than does the odds ratio,because a relative risk index indicates the relative likelihood that a person will have problem B,given that he has problem A. It is often not recognized that this index is not the same as therelative likelihood that a person will have problem A, given that she has problem B. The oddsratio is often interpreted as providing relative risk indices of one event given another in asymmetrical way. Fleiss (1981) points out that the odds ratio is an estimate of the relative risk.While both the odds ratio and the relative risk compare the likelihood of an event occurringbetween two distinct groups, the relative risk is easier to interpret (van Belle, 2002; Children’sMercy Hospital & Clinics, 2003).
Results
Prevalence
Table 1 provides the 8th and 11th grade prevalence estimates and number of valid responses forOHT survey items across 2 years, recast as binary indicators of either negative (n. prefix) ordesirable (positive; p. prefix) behaviours. The prevalence of negative behaviours, expressed as thepercentage of students who evidenced the behaviour, ranged from 2% for pregnancy to 28% for
3We also conducted exploratory agglomerative hierarchical clustering analyses for both the 8th and 11th grade data
sets. Results and discussion of these analyses are in supporting online materials, http://www.ori.org/oht/som.4The full table for these pairs, together with their 99% confidence bounds and Breslow-Day tests of homogeneity of
estimates for males and females, is located at http://www.ori.org/oht/som.

ARTICLE IN PRESS
Table 1
Prevalence of negative and positive behaviours in adolescence
Binary item Description 8th grade 11th grade
N Prevalence (%)** N Prevalence (%)**
Substance use
n.smoking30 Smoked tobacco in past 30 days?a 11,327 11 7976 20
n.smokeless30 Used smokeless tobacco in past 30 days?a 11,285 2 7973 6
n.alcohol30 At least one drink in past 30 days?a 11,065 24 7905 43
n.binge30 Drank more than 5 drinks in past 30 days?a 11,133 10 7908 25
n.marijuana30 Used marijuana in past 30 days?a 11,177 12 7930 22
n.harddrugs30 Used hard drugs in past 30 days?a 10,731 4 7790 4
n.drunkdrive Drove drunk in last 30 days?a N/A* N/A* 7604 9
Anti-social behaviour
n.antisocial Antisocial behaviour past 3 months?a 10,552 6 7556 4
n.weapon Carried a weapon past 30 days?a 10,397 18 7517 15
n.ingang Gang member?a 9891 3 7372 2
n.setfire Set fire in the past three months?a 10,359 17 7503 10
Sexual behaviour
n.sexpartner Sexual partners in the past three months?a 10,008 9 7432 29
n.condom Condom used last time of intercourse?b N/A* N/A* 7417 14
n.pregnancy Been pregnant or gotten someone pregnant?a 9813 2 7293 4
Depression
n.cesd Felt depressed, sad, low energy, past week?a 10,791 14 7621 15
n.suicide Attempted suicide past 12 months?a 10,467 8 7532 6
Eating disorder
n.weight Describes self as overweight?a 10,666 5 7695 4
n.diet Extreme dieting in past 30 days?a 10,367 13 7605 14
Safety
n.helmet Wore bike helmet in past 12 months?b 9928 28 7377 37
n.seatbelt Wore seatbelt when passenger in car?b 10,274 7 7496 4
Poor time use
n.truant Skipped school in last 4 weeks?a 10,514 22 7428 37
n.paidwork Paid work in past month?a 10,170 17 7537 43
n.tv Excessive TV watching per day?a 10,470 14 7618 8
Positive activity
p.exercise Participated in physical activity past 7 days?a 10,701 57 7693 42
p.volunteer Volunteered in past month?a 10,114 17 7512 26
p.sport Participated in sports in past month?a 10,051 31 7464 31
p.church Took part in religious activities past month?a 10,290 49 7336 46
p.chore Did chores in past month?a 10,078 32 7505 31
p.hmwork Did homework in past month?a 9991 40 7437 44
p.academic Good grades in school past 12 months?a 10,296 16 7373 19
*Not included for 8th grade.
**Rounded to nearest whole percent.aYes ¼ 1; No ¼ 0.bYes ¼ 0; No ¼ 1.
S. Boles et al. / Journal of Adolescence 29 (2006) 33–52 39

ARTICLE IN PRESS
S. Boles et al. / Journal of Adolescence 29 (2006) 33–5240
non-use of bike helmet in the 8th grade and from 2% for gang membership to 43% for alcohol usein 11th grade. The prevalence of positive behaviours ranged from 16% for academic success to57% for exercise in 8th grade and from 19% for good grades to 46% for church attendance in the11th grade.
Occurrence and co-occurrence
Fig. 1 presents information for 8th grade students about the self-reported prevalence of eachbehaviour as well as the rates of their co-occurrence using the Jaccard index of similarity. Wepresent prevalence rates on the diagonal and co-occurrence on the off diagonals, with five shadinglevels used to indicate quintile membership of each value.This figure provides co-occurrence information for each pair of behaviours. Starting at the
diagonal, one can note the prevalence of a behaviour and then read the off-diagonal row/columnto see its rate of co-occurrence with every other behaviour. For example, the 8th grade prevalenceof alcohol use is 0.24 and the Jaccard coefficient of co-occurrence for this behaviour with bingedrinking (value at the intersection of n.binge30 row and n.alcohol 30 column) is 0.40, indicatingthat 40% of those students who were alcohol drinkers or binge drinkers were both.Co-occurrence for 8th grade students across the two years ranged from 1% (e.g., getting good
grades and engaging in antisocial behaviour) to 44% (doing chores and doing homework). Theaverage co-occurrence between any two behaviours was 11% (interquartile range 5%, 15%). Fig.1 presents two clear patterns. First, positive behaviours co-occur with one another more than withnegative behaviours. The only clear exception is that alcohol use co-occurs more than 16% witheach of the positive behaviours except volunteering (10%) and academic performance (7%).Second, the negative behaviours involving substance use have very high co-occurrences with oneanother, with the exception of smokeless tobacco use.Fig. 2 shows co-occurrence for 11th grade respondents. Co-occurrences range from 1% (e.g.,
getting good grades and using hard drugs) to 57% (alcohol use and binge drinking). The averageco-occurrence value (11%) and interquartile range (5%, 15%) are similar to those for 8th grade.The patterns obtained for the 11th grade are also similar to those for 8th grade.Differences in co-occurrence rates for the two grades resulted from subtracting the 11th
grade values from the 8th grade values, using scores for all 30 variables in the 8th grade. Ofthe 435 (30*(29/2)) possible co-occurrence pairs, 207 are higher in the 11th grade (meandifference ¼ -5%) and 228 are higher in the 8th grade (mean difference ¼ 4%). Although themagnitudes of the differences are very similar, and a binomial test of these differences is notsignificant (p ¼ 0:33), the patterns of the differences are strikingly different for individualbehaviours. A binomial test of each of the 30 variables for differences between grades in thedirection of co-occurrence with all other variables, using a Bonferroni corrected a of 0.00167(0.05/30), identified 10 behaviours that differ significantly between grades. Nine of these 10 showhigher co-occurrence with other behaviours in the 8th than 11th grade: use of hard drugs,antisocial behaviour, weapon carrying, gang participation, fire setting, suicide attempts, weightconcerns, wearing a seatbelt, and TV watching. As might be expected, the 11th grade co-occurrence of driving while drunk with other behaviours is consistently higher than in 8th grade(28 of 29 pairs). No significant differences co-occur between the two grades for any of the sevendesirable behaviours.

ARTICLE IN PRESS
Fig. 1. Occurrence and co-occurrence of negative and positive behaviours—8th Grade.
S. Boles et al. / Journal of Adolescence 29 (2006) 33–52 41

ARTICLE IN PRESS
n.smoking30
n.smokeless30
n.alcohol30
n.binge30
n.marijuana30
n.harddrugs30
n.drunkdrive
n.antisocial
n.weapon
n.ingang
n.setfire
n.sexpartner
n.condom
n.pregnancy
n.cesd
n.suicide
n.weight
n.diet
n.helmet
n.seatbelt
n.truant
n.paidwork
n.tv
p.exercise
p.volunteer
p.sport
p.church
p.chore
p.hmwork
p.academic
p.ac
adem
ic
Goo
d gr
ades
in s
choo
l in
past
12
mon
ths
p.hm
wor
kD
id h
omew
ork
in p
ast m
onth
p.ch
ore
Did
cho
res
in p
ast m
onth
p.ch
urch
Too
k pa
rt in
rel
igio
us a
ctiv
ities
pas
t mon
th
p.sp
ort
Par
ticip
ated
in s
port
s in
pas
t mon
th
p.vo
lunt
eer
Vol
unte
ered
in p
astm
onth
p.ex
erci
seP
artic
ipat
ed in
phy
sica
l act
ivity
pas
t sev
en d
ays
n.tv
Exc
essi
ve T
V w
atch
ing
per
day
n.pa
idw
ork
Pai
d w
ork
in p
ast m
onth
n.tr
uant
Ski
pped
sch
ool i
n la
st fo
ur w
eeks
n.se
atbe
ltW
ore
seat
belt
whe
n pa
ssen
ger
in c
ar
n.he
lmet
Wor
e bi
ke h
elm
et in
past
12
mon
ths
n.di
etE
xtre
me
diet
ing
inpa
st 3
0 da
ysn.
wei
ght
Des
crib
es s
elf a
s ov
erw
eigh
tn.
suic
ide
Atte
mpt
ed s
uici
de in
pas
t 12
mon
ths
n.ce
sdF
elt d
epre
ssed
, sad
, low
ene
rgy
past
wee
k
n.pr
egna
ncy
Bee
n pr
egna
nt o
r go
tten
som
eone
pre
gnan
tn.
cond
om
Con
dom
use
d la
st ti
me
of in
terc
ours
e
n.se
xpar
tner
S
exua
l par
tner
s in
the
past
thre
e m
onth
s
n.se
tfire
Set
fire
in th
e pa
st th
ree
mon
ths
n.dr
unkd
rive
Dro
ve d
runk
in la
st 3
0 da
ys
n.in
gang
Inga
ngn.
wea
pon
Car
ried
a w
eapo
n in
the
past
30
days
n.an
tisoc
ial
Ant
isoc
ial b
ehav
ior
in th
e pa
st th
ree
mon
ths
n.ha
rddr
ugs3
0 U
sed
hard
dru
gs in
the
past
30
days
n.m
ariju
ana3
0 U
sed
mar
ijuan
a in
the
past
30
days
n.bi
nge3
0 D
rank
mor
e th
an fi
ve d
rinks
in p
ast 3
0 da
ys
n.al
coho
l30
A
t lea
st o
ne d
rink
of a
lcoh
ol in
pas
t 30
days
n.sm
okel
ess3
0
Use
d sm
okel
ess
toba
cco
in th
e pa
st 3
0 da
ys
n.sm
okin
g30
S
mok
ed to
bacc
o in
the
past
30
days
Fig. 2. Occurrence and co-occurrence of negative and positive behaviours—11th Grade.
S. Boles et al. / Journal of Adolescence 29 (2006) 33–5242

ARTICLE IN PRESS
S. Boles et al. / Journal of Adolescence 29 (2006) 33–52 43
Relative risk analyses
We first report the relative risks within each of three sets of conceptually similar behaviours(substance use, antisocial behaviours, and positive behaviours). Next, we present some of therelative risks within the other sets of behaviours (sexual behaviour, depression, eating disorder,safety, and poor time use). Finally, we report on grade differences, relationships among the 8 setsof behaviours themselves, and gender differences.
Substance use
Table 2 presents relative risk ratios among measures of substance use for 8th and 11th grade.The column means in this table indicate the average risk of the behaviour in the column givenother substance use behaviours; the row means indicate the average risk of other substance-usingbehaviours given the substance-use behaviour in that row. As expected, for the 8th grade, the useof cigarettes, alcohol, marijuana, and hard drugs, as well as binge drinking, are each more likely inthe presence of the use of another substance, with all of the risk ratios except alcohol use givensmokeless tobacco use (RR ¼ 3.71) exceeding four. The risk of hard drug use is especially highgiven marijuana or alcohol use. The average relative risk of hard drug use given other substanceuse behaviours (21.67) is substantially higher than the average risk of any other substance usebehaviour given the other behaviours. The average risk of other substance use is highest givenalcohol use (15.14) and next highest given marijuana use. For 11th grade, the pattern ofrelationships is essentially the same, but the risk ratios are consistently lower.
Antisocial behavioursTable 3 presents risk ratios among antisocial behaviours. Recall that the variable n.antisocial
was a composite on which respondents received a 1 if they reported three or more of the followingin the past three months: suspended from school, stolen something worth more than $10, stolen amotor vehicle, attacked someone, stopped by police, arrested, or used a weapon in a fight. If theyreported two or fewer of these behaviours, they received a zero.For both 8th and 11th grades, these behaviours are significantly inter-related. Gang
membership given antisocial behaviour has the highest ratio (RR ¼ 12.81). In both grades, thereis a significant risk of fire setting given antisocial behaviour.
Positive behaviours
Table 4 presents risk ratios among positive behaviours for 8th and 11th grade. It includes theaverage risk ratio for each column and each row. These behaviours are not as inter-related as arenegative behaviours. Among 8th grade students, the mean relative risk for positive behavioursgiven a specific behaviour (the row means) ranged from 1.34 to 1.90. For 11th grade, the averagerelative risks ranged from 1.28 to 1.73. Doing homework and chores were the most highly relatedbehaviours for 8th grade. Doing chores was more than three times more likely among those whoreported doing homework; this effect was stronger for males than females. In 11th grade,involvement in sports and involvement in exercise were mutually related, as were doing homeworkand chores. However, the risk ratios in both directions exceeded 2.0 in no other instances.

ARTICLE IN PRESS
Table 3
Eighth and 11th grade relative risk of antisocial behaviour items
n.antisocial n.weapon n.ingang n.setfire Row mean
8th grade
n.antisocial 3.54* 12.18* 3.29* 6.34
n.weapon 7.96* 7.06* 3.39* 6.14
n.ingang 8.72* 3.14* 2.53* 4.80
n.setfire 5.44* 3.00* 3.75* 4.06
Column mean 7.37 3.23 7.66 3.07 5.33
11th grade
n.antisocial 3.00* 9.65* 3.55* 5.4
n.weapon 5.47* 4.72* 3.54* 4.58
n.ingang 7.96* 2.65* 3.38* 4.66
n.setfire 4.82* 2.81* 5.12* 4.25
Column mean 6.08 2.82 6.5 3.49 4.72
Note: The table presents the risk of behaviours in each column given exposure to the behaviour in each row.
*po0.01.
Significant Breslow-Day test statistic (po0:001) indicating difference in risk for males and females are given in italics.
Table 2
Eighth and 11th grade relative risk of substance abuse items
n.smoking
30
n.smokeless
30
n.alcohol
30
n.binge
30
n.marijuana
30
n.harddrugs
30
Row
mean
8th grade
n.smoking30 14.84* 4.36* 9.03* 9.27* 17.90* 11.08
n.smokeless30 6.91* 3.71* 7.22* 5.45* 14.43* 7.54
n.alcohol30 10.24* 14.00* a 10.78* 25.56* 15.14
n.binge30 7.94* 13.08* 6.23* 8.46* 16.76* 10.49
n.marijuana30 10.45* 10.07* 4.73* 11.06* 33.71* 14.00
n.harddrugs30 7.83* 16.20* 4.12* 8.73* 8.64* 9.10
Column mean 8.67 13.64 4.63 9.01 8.52 21.67 11.13
n.smoke
30
n.smokeless
30
n.alcohol
30
n.binge
30
n.marijuana
30
n.harddrugs
30
n.drunkdrive Row
mean
11th grade
n.smoking30 5.84* 2.48* 3.70* 4.74* 9.46* 5.76* 5.33
n.smokeless30 3.70* 2.20* 3.21* 2.25* 4.27* 4.89* 3.42
n.alcohol30 5.96* 7.91* a 7.29* 12.32* a 8.37
n.binge30 4.51* 6.73* 4.12* 4.90* 8.49* 13.13* 6.98
n.marijuana30 5.37* 2.90* 2.76* 4.36* 15.75* 4.37* 5.92
n.harddrugs30 4.00* 3.69* 2.21* 3.23* 4.15* 4.14* 3.57
n.drunkdrive 3.65* 5.18* 2.76* 4.18* 2.89* 4.93* 3.93
Column mean 4.53 5.38 2.76 3.74 4.37 9.2 6.46 5.28
Note: The table presents the risk of behaviours in each column given exposure to the behaviour in each row.
*po0.01.aInherent dependence.
S. Boles et al. / Journal of Adolescence 29 (2006) 33–5244

ARTICLE IN PRESS
Table 4
Eighth and 11th grade relative risk of positive behaviour items
p.exercise p.volunteer p.sport p.church p.chore p.homework p.academic Row mean
8th grade
p.exercise 1.33* 2.77* 1.06 1.37* 1.21* 1.36* 1.52
p.volunteer 1.14* 1.58* 1.56* 1.93* 1.73* 1.76* 1.62
p.sport 1.61* 1.78* 1.17* 1.57* 1.67* 1.94* 1.62
p.church 1.05 2.31* 1.24* 1.04 1.10 1.28* 1.34
p.chore 1.21* 2.39* 1.59* 1.03 2.54* 1.06 1.64
p.homework 1.14* 2.42* 1.86* 1.09 3.24* 1.62* 1.9
p.academic 1.15* 1.70* 1.64* 1.15* 1.04 1.36* 1.34
Col. mean 1.22 1.99 1.78 1.18 1.70 1.60 1.50 1.57
11th grade
p.exercise 0.99 4.40* 1.17* 1.12* 1.18* 1.23 1.68
p.volunteer 0.99 1.14* 1.74* 1.51* 1.48* 1.57* 1.4
p.sport 2.60* 1.16* 1.28* 1.13* 1.37* 1.49* 1.5
p.church 1.16* 2.22* 1.37* 1.16* 1.19* 1.28* 1.4
p.chore 1.10* 1.55* 1.13* 1.12* 2.03* 0.98 1.32
p.homework 1.17* 1.75* 1.50* 1.19* 2.72* 2.03* 1.73
p.academic 1.14* 1.45* 1.38* 1.17* 0.99 1.52* 1.28
Col. mean 1.36 1.52 1.82 1.28 1.44 1.46 1.43 1.47
Note: The table presents the risk of behaviours in each column given exposure to the behaviour in each row.
*po0.01.
Significant Breslow-Day test statistic (po0.001) indicating difference in risk for males and females are given in italics.
S. Boles et al. / Journal of Adolescence 29 (2006) 33–52 45
Relative risks within other sets of problem behaviours
For the sake of brevity, we do not table the risk ratios within the other sets of behaviours. Asexpected, the risk of suicidal behaviour given depression was significant in both 8th grade(RR ¼ 7.03) and 11th grade (RR ¼ 6.12), as was the risk of depression given suicidal behaviour(RR ¼ 5.22, 8th grade; RR ¼ 4.16, 11th grade).There were significant relationships between weight and dieting in both 8th and 11th grades.
The risk of extreme dieting given self-reports of being overweight were significant for both 8th(RR ¼ 2.88) and 11th grade (RR ¼ 2.74). Similarly, the relative risk of being overweight givenextreme dieting was 3.76 in 8th grade and 3.86 in 11th grade.There were three items involving use of time—truancy, engagement in paid work, and watching
TV more than one hour/day. These variables were not highly related. In 8th grade, only TVwatching and truancy were significantly related (RR ¼ 1.54 for TV watching given truancy andRR ¼ 1.49 for truancy given TV watching). In 11th grade, TV watching and truancy wereunrelated, but paid work was related to TV watching and truancy. High levels of TV watchingwere significantly less likely given paid work (RR ¼ .71) and paid work was significantly lesslikely given high levels of TV watching (RR ¼ .80). Truancy was slightly, but significantly, morelikely given paid work (RR ¼ 1.34) and conversely (RR ¼ 1.29 for paid work given truancy).Finally, in 8th grade, the risk of no seatbelt use was considerably higher among those who
reported not using bike helmets (RR ¼ 6.61) and no helmet use was higher among non-seatbelt

ARTICLE IN PRESS
S. Boles et al. / Journal of Adolescence 29 (2006) 33–5246
users (RR ¼ 2.50). Relationships were similar, though not as high, in 11th grade (RR ¼ 4.34 forno seatbelt use given no bike helmet use; RR ¼ 1.47 for no helmet use given no seatbelt use).
Differences between grades
We conducted tests of the differences in relative risk between grades for the three sets ofbehaviours described above (substance use, antisocial behaviours, and positive behaviours) usinga paired Wilcoxon signed rank test (Hollander & Wolfe, 1973; Siegel, 1956). We applied the test tovectors constructed for each grade using the cell value at the intersection of each of the variableswith the other variables. Values at the same position in the vector for each grade comprised thepairs tested. Results of this test for each of the three sets of behaviours (Bonferroni corrected a of0.0167 (.05/3)) indicate a significant difference between grades for the substance abuse items(po0:00001) but not the antisocial items (p ¼ 0:17) or the positive behaviour items, although thelatter is close to significance (p ¼ 0:02).
Relationships among sets of behaviours
Table 5 presents average relative risk ratios among the sets of behaviours discussed above. Forexample, the number 5.52 in the first row, second column, for 8th grade is the average relative riskfor all antisocial behaviour measures given all substance use measures. Thus, the numbers indicatethe general tendency for members of one set of behaviours to relate to the other set.Among the negative behaviours, the risk of one problem given another is consistently greater in
the 8th grade than in the 11th grade. The risk ratios are higher in all but 2 of 42 cases and theaverage relative risk of negative behaviour given negative behaviour for the 8th grade was nearlytwice as great as that of the 11th grade (4.34/2.57). The difference is particularly noteworthy forrisky sexual behaviour. The average risk of risky sexual behaviour given substance use behaviouris 8.54 in 8th grade and 2.41 in 11th grade. The average risk of risky sexual behaviour givenantisocial behaviour is 7.80 in 8th grade, but only 2.94 in 11th grade. The risk of risky sexualbehaviour given depression is also higher in 8th grade (RR ¼ 5.79) than in 11th grade(RR ¼ 2.16).In general, there is a risk of any given negative behaviour given another negative behaviour. In
8th grade, substance use, antisocial behaviour, sexual behaviour, and depression are particularlyinter-related. In 11th grade, the highest average risk ratios involve antisocial behaviours; the riskof substance use given antisocial behaviour is greater than 3.00 and the risk of antisocialbehaviour given substance use, high-risk sexual behaviour, or depression problems are all greaterthan 3.00.Eating disorders are associated with higher levels of all other behaviours, with depression
particularly likely in the presence of eating disorders.Low levels of safety behaviours (bike helmet and seatbelt use) relate to other negative
behaviours. It is interesting that the risk of most negative behaviours given low levels of safetybehaviours is higher than the risk of poor safety behaviour given the other problems.Time use behaviours are not as highly related to other problems as to other behaviours,
although the risk of substance use, antisocial behaviour, and high-risk sexual behaviour are allgreater than 2.00 in 8th grade.Positive behaviours are not as highly related to negative behaviours as negative behaviours are
to each other. On average, engagement in positive behaviours is associated with lower levels of

ARTICLE IN PRESS
Table 5
Average relative risk of subsets of items
Substance
use
Antisocial
behaviour
Sexual
behaviour
Depression Eating
disorder
Safety Time use Positive
behaviour
8th grade
Substance use 5.52 8.54 3.66 2.29 3.06 1.95 0.79
Antisocial
behaviour
5.42 7.80 3.74 2.62 2.87 1.94 0.81
Sexual
behaviour
6.86 7.11 4.46 3.08 3.72 2.01 0.81
Depression 3.93 3.85 5.79 3.64 2.20 1.63 0.88
Eating
disorder
2.45 2.89 3.59 4.00 1.96 1.59 0.92
Safety 3.93 3.29 4.47 2.28 1.98 1.82 0.78
Time use 2.39 2.39 2.60 1.76 1.70 1.86 0.97
Positive
behaviour
0.75 0.76 0.74 0.85 0.89 0.75 0.97
11th grade
Substance use 3.66 2.41 2.21 1.70 2.37 1.40 0.78
Antisocial
behaviour
3.03 2.94 2.96 2.63 2.60 1.46 0.88
Sexual
behaviour
2.55 3.41 2.27 1.59 1.67 1.32 0.84
Depression 2.08 3.01 2.16 2.64 1.84 1.23 0.85
Eating
disorder
1.73 2.90 1.60 2.95 1.76 1.38 0.92
Safety 2.63 2.83 1.85 1.89 1.83 1.51 0.80
Time use 1.63 1.86 1.50 1.29 1.45 1.41 0.81
Positive
behaviour
0.74 0.84 0.81 0.81 0.89 0.80 0.78
S. Boles et al. / Journal of Adolescence 29 (2006) 33–52 47
substance use, antisocial behaviour, sexual behaviour, depression, eating disorders, and unsafebehaviours. For example, the average risk of antisocial behaviours given positive behaviours is0.76 in 8th grade, indicating that the average risk of an antisocial behaviour is about 24% lessgiven positive behaviours. In contrast, the negative behaviour with the lowest risk ratio forantisocial behaviour in 8th grade is 2.39 for time use (for comparison, the inverse of 0.76 is 1.32).A Wilcoxon paired signed rank test of the differences between the 8th and 11th grades for the
eight sets of behaviours is highly significant (po0:00001), confirming that the within set averagerelative risks are larger in the 8th than in the 11th grade.Although the risk ratios among individual behaviours are not shown in Table 5,5 several of
them seem worthy of mention. Suicide attempts were seven times more likely among 8th graderswho were depressed than those who were not. However, they were also seven times more likelyamong those experiencing or causing a pregnancy and were six times more likely if they reportedhard drug use or antisocial behaviour.
5Available at http://www.ori.org/oht/som.
ARTICLE IN PRESS
S. Boles et al. / Journal of Adolescence 29 (2006) 33–5248
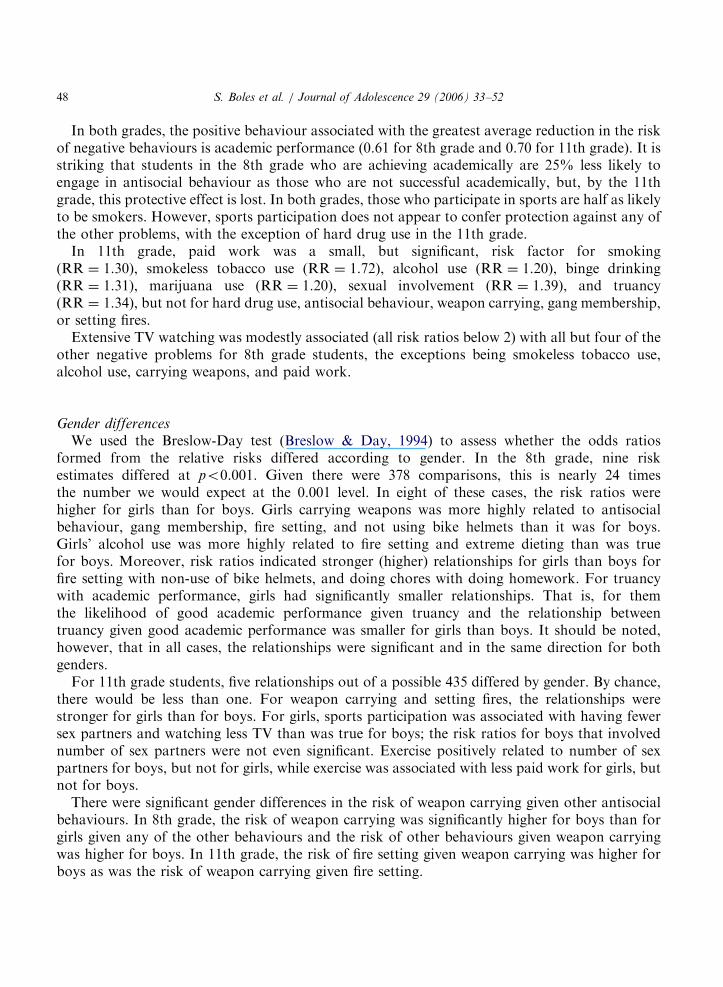
In both grades, the positive behaviour associated with the greatest average reduction in the riskof negative behaviours is academic performance (0.61 for 8th grade and 0.70 for 11th grade). It isstriking that students in the 8th grade who are achieving academically are 25% less likely toengage in antisocial behaviour as those who are not successful academically, but, by the 11thgrade, this protective effect is lost. In both grades, those who participate in sports are half as likelyto be smokers. However, sports participation does not appear to confer protection against any ofthe other problems, with the exception of hard drug use in the 11th grade.In 11th grade, paid work was a small, but significant, risk factor for smoking
(RR ¼ 1.30), smokeless tobacco use (RR ¼ 1.72), alcohol use (RR ¼ 1.20), binge drinking(RR ¼ 1.31), marijuana use (RR ¼ 1.20), sexual involvement (RR ¼ 1.39), and truancy(RR ¼ 1.34), but not for hard drug use, antisocial behaviour, weapon carrying, gang membership,or setting fires.Extensive TV watching was modestly associated (all risk ratios below 2) with all but four of the
other negative problems for 8th grade students, the exceptions being smokeless tobacco use,alcohol use, carrying weapons, and paid work.
Gender differencesWe used the Breslow-Day test (Breslow & Day, 1994) to assess whether the odds ratios
formed from the relative risks differed according to gender. In the 8th grade, nine riskestimates differed at po0.001. Given there were 378 comparisons, this is nearly 24 timesthe number we would expect at the 0.001 level. In eight of these cases, the risk ratios werehigher for girls than for boys. Girls carrying weapons was more highly related to antisocialbehaviour, gang membership, fire setting, and not using bike helmets than it was for boys.Girls’ alcohol use was more highly related to fire setting and extreme dieting than was truefor boys. Moreover, risk ratios indicated stronger (higher) relationships for girls than boys forfire setting with non-use of bike helmets, and doing chores with doing homework. For truancywith academic performance, girls had significantly smaller relationships. That is, for themthe likelihood of good academic performance given truancy and the relationship betweentruancy given good academic performance was smaller for girls than boys. It should be noted,however, that in all cases, the relationships were significant and in the same direction for bothgenders.For 11th grade students, five relationships out of a possible 435 differed by gender. By chance,
there would be less than one. For weapon carrying and setting fires, the relationships werestronger for girls than for boys. For girls, sports participation was associated with having fewersex partners and watching less TV than was true for boys; the risk ratios for boys that involvednumber of sex partners were not even significant. Exercise positively related to number of sexpartners for boys, but not for girls, while exercise was associated with less paid work for girls, butnot for boys.There were significant gender differences in the risk of weapon carrying given other antisocial
behaviours. In 8th grade, the risk of weapon carrying was significantly higher for boys than forgirls given any of the other behaviours and the risk of other behaviours given weapon carryingwas higher for boys. In 11th grade, the risk of fire setting given weapon carrying was higher forboys as was the risk of weapon carrying given fire setting.

ARTICLE IN PRESS
S. Boles et al. / Journal of Adolescence 29 (2006) 33–52 49
Discussion
The study provides population-based estimates of the co-occurrence of adolescent negative andpositive behaviours in 8th and 11th grade students in Oregon. The results are consistent withnumerous prior studies (Donovan & Jessor, 1985; Jessor, 1986; Jessor, 1987a, b; Biglan et al.,2004) in showing that substance use behaviours co-occur and are more likely among youthinvolved in antisocial behaviour. Fewer studies, however, have shown that substance use andantisocial behaviours co-occur with depression, truancy, and high-risk sexual behaviour. We areunaware of any studies showing that these behaviours co-occur significantly with obesity, extremedieting, and failure to use bike helmets and seatbelts.The results suggest that antisocial behaviour co-occurs with other behaviours more in 8th grade
than in 11th grade. This is probably due to the greater prevalence of certain forms of antisocialbehaviour in mid-adolescence. Moffitt and colleagues (Moffitt, Caspi, Harrington, & Milne, 2002)review evidence that early offenders are significantly more likely to continue to offend, whereasadolescents who begin antisocial behaviour later in adolescence are less likely to do so. Thepresent finding indicates that antisocial behaviour in early adolescence is also a greater risk factorfor most other problems than it is later in adolescence. This is further reason to target thisproblem in early adolescence.The findings provide some clarification of the significance of paid work in adolescence.
Generally, engaging in paid work is associated with positive behaviours in 8th grade, but for 11thgrade, it is either unrelated or—in the case of sports participation and doing homework—isassociated with significantly less of the behaviour. Where paid work is associated with problems,the associations are consistently positive in both grades, with one exception. That means thatthose who work more also report more problems, though only two of the relationships exceeded2.0. The exception was, in 11th grade, more paid work was associated with less TV watching.The results also provide new information about the associations among positive behaviours.
These behaviours are not nearly as inter-related as problem behaviours are and not as stronglyassociated with engaging in fewer problem behaviours as one might have hoped. Academicachievement is the positive behaviour most associated with a lower likelihood of problems, but theassociations are stronger in 8th than in 11th grade. In particular, achievement is not protective ofantisocial behaviour in 11th grade. Religious participation is protective for most aspects ofsubstance use and for antisocial behaviour in 8th grade and for depression and pregnancy in 11thgrade, although the sizes of the associations are not great. Volunteering is generally not protectivein 8th grade, but is protective for most substance use and antisocial behaviour in 11th grade.Sports participation and exercise are generally associated with little or no protection againstproblems.These results prompt us to ask whether there is a coherent theoretical explanation for why sets
of problem behaviours would be more inter-related than would positive behaviours. We suspectthat the situational influences on behaviours account for at least part of this difference. In supportof this explanation, we note that many substance use, antisocial, and high-risk sexual behavioursco-occur literally at the same time and place (Metzler, Noell, Biglan, Ary, & Smolkowski, 1994).Other problem behaviours (such as eating disorders, safety, and time use), that typically are notengaged in with peers, tend to show less relation to each other and to the substance use orantisocial behaviour sets. The positive behaviours we examined also generally occur in different

ARTICLE IN PRESS
S. Boles et al. / Journal of Adolescence 29 (2006) 33–5250
settings and at different times. Thus, their literal co-occurrence is less likely and that alone couldaccount for the generally lower level of inter-relationships both among positive behaviours andbetween positive and negative behaviours. Moreover, the occurrence of some problem behavioursappears to contribute to the development of others. For example, Fergusson, Banner, Vitaro,Horwood, and Swain-Campbell (2003) found that deviant peer affiliations were associated withhigher rates of depression because those affiliations contributed to externalizing behaviours thatin turn led to depression.Whatever the underlying explanation for these results, they suggest that efforts to promote
positive youth development (Benson, 1998; National Research Council & Institute of Medicine,2002) may have a limited impact in preventing youth problem behaviours. It is unquestionablyworthwhile for schools and communities to promote academic achievement, volunteering,exercise, and sports participation, but doing so may have only a small impact in lowering the riskof engagement in youth problem behaviours.Recognizing the co-occurrence of problem behaviours is important because of what it implies
for research and practice in prevention and treatment. Youth who enter treatment with a givenproblem are likely to have at least one other problem (Biglan et al., 2004). In providingpsychological treatment, practitioners need to assess young people for all of the problems thatthey might have and provide treatment that addresses the range of their problems. This issuegenerally falls under the rubric of ‘‘comorbidities’’ (Kessler & Zhao, 1999). It is possible thatyouth with multiple problems will be less responsive to treatment that addresses only one of theirproblems. Consider a youth who is depressed and engaging in antisocial behaviour. How likely isit that this youth’s depression will lessen if no one addresses the antisocial behaviour that puts himat risk for depressogenic situations?At a minimum, treatment research needs to examine how well treatments for specific problems
ameliorate other problems. There may be problems that, when treated, bring about improvementsin concomitant problems. Moreover, some treatment procedures may be more effective thanothers are in ameliorating multiple problems.With respect to prevention, interventions are necessary to address the entire range of problems.
Unfortunately, much prevention programming focuses narrowly on single problems. Forexample, research on school-based tobacco curricula has identified some resistance tocomprehensive life skills programs because components of them do not seem to address tobaccouse directly (Biglan & Dent, in preparation). Yet, increasingly, there is reason to believe that suchprograms prevent use of any substance, by helping young people to cope with social pressures andstressors that make involvement in substance use more likely. Rather than thinking aboutcurricula in terms of lessons that explicitly talk about each of the behaviours we wish to prevent,we may need to focus on having programs that alter the likelihood that youth will be influenced totry diverse problem behaviours.The phenomenon of multiple problem behaviours also has implications for research on
prevention. Given their impact on substance use and the apparent mechanisms of effect (e.g.,stress reduction, alteration of peer group processes), comprehensive life skills programs are likelyto help prevent high-risk sexual behaviour, antisocial behaviour, and depression. Yet, we areunaware of any evaluations of such programs that assessed their impact on these problems. Thenext generation of school-based prevention research will need to evaluate program effects on theentire range of youth problems—as well as aspects of desirable behaviour.

ARTICLE IN PRESS
S. Boles et al. / Journal of Adolescence 29 (2006) 33–52 51
Acknowledgment
The authors determined order of authorship by flip of a coin. NIH Grant CA86169 supportedwork on this paper. The authors thank Edward Lichtenstein for his very helpful feedback onprevious drafts of this paper, Yvonne Kuo and Christine Cody for editorial assistance, and SylviaGillings for additional help in preparation of the document.
References
Arthur, M. W., Hawkins, J. D., Pollard, J. A., Catalano, R. F., & Baglioni, A. J., Jr (2002). Measuring risk and
protective factors for substance use, delinquency, and other adolescent problem behaviors: the communities that
care youth survey. Evaluation Review, 26(6), 355–381.
Ary, D. V., Duncan, T. E., Biglan, A., Metzler, C. W., Noell, J. W., & Smolkowski, K. (1999). Development of
adolescent problem behavior. Journal of Abnormal Child Psychology, 27(2), 141–150.
Benson, P. L. (1990). Help-seeking for alcohol and drug problems: to whom do adolescents turn? Journal of Adolescent
Chemical Dependency, 1(1), 83–94.
Benson, P. L. (1998). Mobilizing communities to promote developmental assets: a promising strategy for the prevention
of high-risk behaviors. Family Science Review, 11(3), 220–238.
Biglan, A., Ary, D. V., Smolkowski, K., Duncan, T. E., & Black, C. (2000). A randomized control trial of a community
intervention to prevent adolescent tobacco use. Tobacco Control, 9, 24–32.
Biglan, A., Brennan, P., Foster, S., Holder, H., Miller, T., Cunningham, P., et al. (2004). Helping adolescents at risk:
prevention of multiple problem behaviors. New York: Guilford.
Biglan, A., & Dent, C. (In preparation). The teaching of tobacco prevention curricula in Oregon.
Breslow, N. E., & Day, N. L. (1994). Statistical methods in cancer research, volume II: The design and analysis of cohort
studies. New York: Oxford University Press.
Catalano, R. F., Hawkins, J. D., Berglund, L., Pollard, J. A., & Arthur, M. W. (2002). Prevention science and positive
youth development: Competitive or cooperative frameworks? Journal of Adolescent Health, 31(Suppl 6), 230–239.
Children’s Mercy Hospital & Clinics. STATS web page. Last accessed May 27, 2003 at: http://www.childrens-
mercy.org/stats/journal/oddsratio.asp.
Dishion, T. J., Capaldi, D., Spracklen, K. M., & Li, F. (1995). Peer ecology of male adolescent drug use. Special Issue:
Developmental processes in peer relations and psychopathology. Development & Psychopathology, 7(4), 803–824.
Donovan, J. E., & Jessor, R. (1985). Structure of problem behavior in adolescence and young adulthood. Journal of
Consulting and Clinical Psychology, 53(6), 890–904.
Encyclopædia Britannica. Retrieved October 13, 2004, from Encyclopædia Britannica Premium Service. http://
www.britannica.com/eb/article?tocId=63203.
Fergusson, D. M., Banner, B., Vitaro, F., Horwood, L. J., & Swain-Campbell, N. (2003). Deviant peer affiliations and
depression: Confounding or causation? Journal of Abnormal Child Psychology, 31(6), 605–618.
Fleiss, J. L. (1981). Statistical methods for rates and proportions. New York: Wiley.
Greenberger, E., & Steinberg, L. (1986). When teen-agers work. The psychological and social costs of adolescent
employment. New York: Basic Books.
Hollander, M., & Wolfe, D. A. (1973). Nonparametric statistical inference. New York: Wiley.
Jessor, R. (1986). Adolescent problem drinking: Psychosocial aspects and developmental outcomes. In R. K.
Silbereisen, K. Eyferth, & G. Rudinger (Eds.), Development as action in context: Problem behavior and normal youth
development (pp. 241–264). New York: Springer.
Jessor, R. (1987a). Problem-behavior theory, psychosocial development, and adolescent problem drinking. British
Journal of Addiction, 82(4), 331–342.
Jessor, R. (1987b). Risky driving and adolescent problem behavior: An extension of problem-behavior theory. Alcohol,
Drugs, and Driving, 3(3–4), 1–11.

ARTICLE IN PRESS
S. Boles et al. / Journal of Adolescence 29 (2006) 33–5252
Jessor, R., & Jessor, S. L. (1977). Problem behavior and psychosocial development: A longitudinal study of youth. New
York: Academic Press.
Kann, L., Kinchen, S. A., Williams, B. I., Ross, J. G., Lowry, R., Grunbaum, J. A., et al. (2000). Youth Risk Behavior
Surveillance—United States, 1999. Morbidity and Mortality Weekly Report, 49(SS-5), 1–94.
Kaufman, L., & Rousseeuw, P. J. (1990). Finding groups in data. New York: Wiley.
Kessler, R. C., & Zhao, S. (1999). The prevalence of mental illness. In A. V. Horwitz, & T. L. Scheid (Eds.), A handbook
for the study of mental health: social contexts, theories, and systems (pp. 58–78). New York: Cambridge University.
Metzler, C. W., Biglan, A., Ary, D. V., & Li, F. (1998). The stability and validity of early adolescents’ reports of
parenting constructs. Journal of Family Psychology, 12(4), 600–619.
Metzler, C. W., Noell, J. W., Biglan, A., Ary, D. V., & Smolkowski, K. (1994). The social context for risky sexual
behavior among adolescents. Journal of Behavioral Medicine, 17(4), 419–438.
Moffit, T. E., & Caspi, A. (2001). Childhood predictors differentiate life-course persistent and adolescent limited
antisocial pathways among males and females. Development and Psychopathology, 13(2), 355–375.
Moffitt, T. E., Caspi, A., Harrington, H., & Milne, B. J. (2002). Males on the life-course-persistent and adolescence-
limited antisocial pathways: Follow-up at age 26 years. Development and Psychopathology, 14(1), 179–207.
National Research Council and Institute of Medicine. (2002). Community programs to promote youth development.
Washington, DC: National Academy Press.
Patterson, G. R., & Yoerger, K. (1997). A developmental model for late-onset delinquency. Motivation and delinquency.
Lincoln, NE: University of Nebraska Press pp. 119–177.
Siegel, S. (1956). Nonparametric statistics for the behavioral sciences. New York: McGraw-Hill.
Staff, J., & Uggen, C. (2003). The fruits of good work: Early work experiences and adolescent deviance. Journal of
Research in Crime and Delinquency, 40(3), 263–290.
Steinberg, L., & Dornbusch, S. M. (1991). Negative correlates of part-time employment during adolescence:
Replication and elaboration. Developmental Psychology, 27(2), 304–313.
Stokes, M. E., Davis, C. S., & Koch, G. G. (1995). Categorical data analysis using the SAS System. Cary, NC: SAS
Institute, Inc.
van Belle, G. (2002). Statistical rules of thumb. New York: Wiley.
White, H. R., Xie, M., Thompson, W., Loeber, R., & Stouthamer-Loeber, M. (2001). Psychopathology as a predictor
of adolescent drug use trajectories. Psychology of Addictive Behaviors, 15(3), 210–218.
Windle, M. (1990). A longitudinal study of antisocial behaviors in early adolescence as predictors of late adolescent
substance use: gender and ethnic group differences. Journal of Abnormal Psychology, 99(1), 86–91.
Copyright © 2022 FDOKUMEN