Clustering behaviours among 13-year-old Portuguese adolescents
20
CLUSTERING BEHAVIOURS AMONG 13 YEAR-OLD PORTUGUESE ADOLESCENTS Sílvia Fraga 1,2 ; Milton Severo 1,2 ; Diogo Costa 1,2 ; Carla Lopes 1,2 ; Elisabete Ramos 1,2 1 Department of Hygiene and Epidemiology, University of Porto Medical School, Portugal 2 Institute of Public Health, University of Porto, Portugal Address correspondence to: Sílvia Fraga Institute of Public Health-University of Porto Rua das Taipas, 135-139 4050-600 Porto Telephone: +351 225513652; Fax: +351 225513653; E-mail: [email protected]
-
Upload
independent -
Category
Documents
-
view
0 -
download
0
Transcript of Clustering behaviours among 13-year-old Portuguese adolescents
CLUSTERING BEHAVIOURS AMONG 13 YEAR-OLD PORTUGUESE ADOLESCENTS
Sílvia Fraga 1,2
; Milton Severo 1,2
; Diogo Costa 1,2
; Carla Lopes 1,2
; Elisabete Ramos 1,2
1 Department of Hygiene and Epidemiology, University of Porto Medical School, Portugal
2 Institute of Public Health, University of Porto, Portugal
Address correspondence to:
Sílvia Fraga
Institute of Public Health-University of Porto
Rua das Taipas, 135-139
4050-600 Porto
Telephone: +351 225513652; Fax: +351 225513653;
E-mail: [email protected]

CLUSTERING BEHAVIOURS AMONG 13 YEAR-OLD PORTUGUESE ADOLESCENTS

ABSTRACT
Aim To identify clustering of behaviours in young adolescents; b) to analyse differences in food
intake according clusters.
Subject and Methods A cross-sectional study was carried out on adolescents’ behaviours comprising
2160 adolescents aged 13 years-old attending schools of Porto, Portugal. We used data of 875 girls
and 737 boys with complete information for all variables considered in the cluster definition
(tobacco and alcohol use, sport activities, fruit intake, daily sleep hours). The average method was
used to find the natural structure of clusters.
Results We identified three clusters: Cluster 1 characterized by never smokers and never drinkers
represented those with higher intake of fruits and lower intake of soft drinks; cluster 2 comprises
essentially tobacco and alcohol experimenters and was almost similar to cluster 1 regarding the
other characteristics. Cluster 3 represented mostly regular smokers and drinkers, and those with the
lowest daily sport activities, the lowest number of daily sleep hours, the lowest mean of fruits
consumption and the highest intake of sweets and soft drinks.
Conclusion Our findings show that even in early stages of adolescence there is a cluster of smoking,
alcohol use and food intake, providing further evidence of the clustering of unhealthy behaviours.
Keywords: health behaviours; adolescents; clustering behaviours; schools

INTRODUCTION
During the transition from childhood to adulthood, adolescents establish patterns of behaviour and
make lifestyle choices that affect both their current and future health (He et al. 2004).
The Centers for Disease Control and Prevention (Eaton et al. 2008) defined six categories of
adolescents’ unhealthy behaviours based on their contributing to the leading causes of morbidity
and mortality among youth. Unhealthy dietary behaviour and physical inactivity are recognized as
one of these six (Eaton et al. 2008).
The theory of critical behaviour proposed by Jessor (Jessor 1984) explains that problems of
behaviour and health do not occur in isolation, but within a more comprehensive set of behaviours,
highlighting an intersection area between these behaviours. This supports that engaging in an
unhealthy behaviour may increase the likelihood of engaging in other unhealthy behaviours (Jessor
1984; Burke et al. 1997; Talashek et al. 2003). In the case of unrelated behaviours, programs
targeting specific behaviours may be effective, but if adolescents’ behaviours are related (to other
sets of behaviours), prevention programs focusing on common determinants of unhealthy
behaviours may turn more effective and should privilege approaches that take into account different
behaviour-problems since they have similar patterns of development, not neglecting their specificity
(Guilamo-Ramos et al. 2005; Bartlett et al. 2007). Thus, to know how health behaviours are
interrelated is important in designing programs aiming to modify risk behaviours.
Among adults, it has been shown that clustering of adverse health behaviours is common and
increases the morbidity and mortality (Boden-Albala and Sacco 2000; Cardi et al. 2009). It was also
demonstrated that unhealthy behaviours tend to aggregate since early ages (Jessor 1984; Talashek et
al. 2003; Gorely et al. 2007; te Velde et al. 2007), but it is still unknown if dietary habits cluster
together with other known unhealthy behaviours in early adolescence, since it may be expected that
at this age dietary choices are still under a relative high parental control(Birch and Fisher 1998;
Savage et al. 2007).
Health behaviours of schoolchildren are a challenge for worldwide policy-makers, and
understanding the relationship between health behaviours in early ages may lead to the development
of more effective strategies for promoting health (Nelson et al. 2005; Gorely et al. 2007).
Although health promotion programs focusing on tobacco, alcohol and drugs make use of a
combined approach, few of them take into account healthy dietary choices as part of an integrated
approach.
Thus, this study aims a) to identify clustering of behaviours in young adolescents; b) and to analyse
differences in food intake according to the identified clusters.

METHODS
The Epidemiological Health Investigation of Teenagers in Porto (EPITeen) cohort intends to follow
adolescents from initial adolescence to adulthood stage, in order to study behaviours and chronic
diseases like cardiovascular diseases in a life course approach. During the 2003/2004 school year,
participants were selected as part of the assembling procedure of the EPITeen cohort (Ramos and
Barros 2007), which intends to follow adolescents born in 1990 and registered at every public and
private schools of Porto, a large urban centre in the north-west of Portugal. To identify eligible
students, every appropriated school in Porto (26 public and 24 private) were contacted. All public
and 19 private schools agreed to participate, allowing the contact with parents and adolescents. In
those schools we identified 2787 students (2126 public and 661 private). Forty-four (1.6%)
adolescents could not be reached (missing classes frequently) and 2160 (77.5%) agreed to
participate. A similar participation proportion in public (77.7%) and private (76.7%) schools
(p=0.603) was observed.
The Ethical Committee of the University Hospital of São João, Porto, approved the study. Parents
and children received written information explaining the purpose and the design of the study.
Additionally, the study steps were described in each school during special meetings arranged
according to parents’ convenience. Written informed consent was obtained both from parents and
children.
The baseline evaluation required extensive data collection, comprising two self-administered
questionnaires (one completed at home, another at school).
The home questionnaire was completed by adolescents with their parents’ help and comprised
information on demographic, social, and behavioural characteristics. The home questionnaire also
evaluated dietary intake using a semi-quantitative food frequency questionnaire (FFQ) validated for
the Portuguese adult population (Lopes 2000 (in Portuguese); Lopes et al. 2007), and adapted for
adolescents adding some food items more frequently used at this age. Respondents were asked to
report how often they usually eat each particular food over the prior 12-month period as the number
of times per day, week, or month. FFQ has 92 food items and for this specific work we used the
information of the following groups: sweets and pastry (other biscuits beyond simple, croissants,
pastry, donut, cakes, chocolates, chocolate snacks, dairy desserts, ice creams, marmalade, compote,
jelly, honey, sugar and candy), soft drinks (soda and carbonated juices), vegetables (cabbages,
spinach, broccoli, onion, carrot, lettuce, peppers, tomato, cucumbers), fruits (all fresh fruits,
including tropical fruit) and soup (vegetable soup). In addition to FFQ the specific question “how
many fruit portions do you eat a week?” was asked as part of the global questionnaire. Information

from this question assessing the number of fruit portions was used in the cluster definition since it
had fewer missing information than the FFQ. For those with both information (fruits of FFQ and
fruits in the single question) the correlation between them was 0.518.
Wakening-up and bedtime hours were recorded to compute daily sleeping hours.
We asked separately about time spent per week watching TV, playing computer and reading per
week. Then we computed the total time spent on sedentary activities.
The school questionnaire was answered at school only by the adolescent. It collected information
about sports practice, tobacco and alcohol use.
To evaluate the frequency of sport activities we considered only those activities taking at least 20
minutes a week and not included in school curriculum. To assess this information we used an five-
option question (never, ≤ 1 time per month, 1 time per month to 1 time per week, 2 to 6 times per
week, every day). Adolescents were classified regarding their use of alcohol and tobacco as never
users, if they had never drunk alcoholic drinks and if they have never smoked; experimenters, if
they reported only experimented those substances and used them less than one time per month; and
drinkers if they drunk one drink at least one time per month or smokers if they smoke either
occasionally or regularly.
To define clusters we used 1612 participants (875 girls and 737 boys) with complete information
for all variables that were considered in the cluster definition (tobacco and alcohol use, sport
activities, fruit intake per week and daily sleep hours). Compared to the excluded participants, the
1612 enrolled had a higher proportion of females, adolescents with higher parental educational
level, and those reporting more frequency of sports activity (p-value < 0.001). No statistically
significant differences were found according to tobacco and alcohol use (table 1). After to perform
the analysis of clusters’ definition, we have to consider one participant as outlier because he did not
match with the characteristics of any of the clusters defined.
(Please, insert table 1 here)
Statistical Analysis
Quantitative continuous variables were presented as median (1st quartile-3
rd quartile) and they were
compared using Kruskal-Wallis test. Nominal and ordinal variables were described using
proportions and compared by Chi-squared test.

Hierarchical cluster methods were used to find the natural structure of data. We compared Ward’s,
complete and average methods, and since the average method showed the highest prediction it was
considered the final solution. Considering that the variables used to define clusters were a mixture
of nominal, ordinal and interval variables, the dissimilarity between individuals was measured with
the Gower coefficient (Kaufman and Rousseeuw 1990) . Information on tobacco and alcohol use,
sport activities, fruit intake per week and daily sleep hours were used to predict the classification of
each method and define the clusters. The Rousseeuw's Silhouette internal cluster quality index was
used to estimate the number of clusters (Kaufman and Rousseeuw 1990). Classification trees, using
Gini index (Breiman et al. 1984), were used to determine which variables were the most important
to define the clusters.
Generalized linear models with log link function were used to estimate the frequency of
consumption of sweets and pastry, vegetables, soft drinks and soup by cluster, adjusted for total
energy intake and parents’ education by cluster. To perform this analysis log transformation was
applied to the dependent variable.
The software “R 2.8.0 version” was used to analyse data (R Development Core Team 2008).

RESULTS
Regarding tobacco and alcohol use, sport activities, fruit intake and daily sleep hours, tobacco and
alcohol were the most important in the cluster definition as observable in the classification tree
(figure 1).
(Please, insert here figure 1)
We should note that of 86 adolescents in the drinker category, 20 reported alcohol use at least one
time per week. And regarding the 44 smokers, 25 adolescents reported daily tobacco smoking.
Our cluster analysis allowed us to identify 3 clusters: cluster 1 (n=735) was characterized by a high
proportion of never smokers (89.0%) and never drinkers (100.0%). Cluster 2 (n=832) presented the
experimenters of tobacco (27.9%) and alcohol (90.5%). Cluster 3 (n=44) represents all smokers
(100%) and some drinkers (15.9%).
Results showed that cluster 1 also presented those adolescents with other healthiest behaviours,
such as a high median of daily sleep hours (median= 9.0 hours (1stQ -3
rdQ=8.5-9.5)) and lower
median of time spend at sedentary activities (median= 10.0 hours (1stQ -3
rdQ=9.6-10.5)). These
results are similar in the cluster 2. Moreover, cluster 3 represented those with a lower median (1stQ -
3rd
Q) of fruits consumption (5 fruits (2-10)) and lower number of daily sleeping hours (8.8 hours
(8.3-9.5)) (table 2). However no significant differences were found according frequency of sports
practice.
Regarding sedentary activities according to the three clusters there is a direct dose-effect relation
(P-value for trend=0.045), and cluster 3 showed a high median (1stQ -3
rdQ) of sedentary activities
(11.2 hours (9.4-12.9)) (table 2).
Also significant differences in gender, type of school and parents’ education were found between
clusters (table 2). Cluster 1 had a higher proportion of males and cluster 3 had a higher proportion
of females. Cluster 2 had the highest proportion of adolescents from private schools and a higher
proportion (table 2).
(Please, insert table 2 here)
Concerning data from the FFQ, after adjustment for total energy intake and parents’ education,
cluster 3 showed a high mean of daily intake of soft drinks. Although without statistically
significance, this cluster also presented the highest intake of sweets and pastry (table 3).

(Please, insert table 3 here)

DISCUSSION
Few studies have focused in the way unhealthy behaviours cluster together on early adolescence.
Our results show tobacco and alcohol as the most powerful in clustering unhealthy behaviours even
in these young adolescents, which is in line with other studies that described tobacco and alcohol
use as the “gateway” to other risk behaviours common during adolescence (Burke et al. 1997; Ma et
al. 2000).
Our study shows that not only tobacco and alcohol are related, but also adolescents who smoke and
drink (cluster 3) were characterized by longer periods spent in sedentary activities, lower
consumption of fruit and a higher consumption of soft drinks. This results are particularly important
since it is known that parents have a crucial role in the dietary behaviour of their children (Savage et
al. 2007), however in early adolescence, peer pressure begins to usurp parental authority and
unhealthy diets may be initiated (Gidding et al. 2006), reinforcing the need for early interventions.
The majority of studies show that males are more prone to engage in unhealthy behaviours (Burke
et al. 1997; Ma et al. 2000; Wu et al. 2006). However, recent research showed no differences among
genders in health behaviours (Lawlor et al. 2005) or even that the situation begins to reverse
regarding some unhealthy behaviours (Miller et al. 2007). Thus it is interesting to note that in
cluster 3, which represents the unhealthiest pattern, the proportion of females is higher. This
information reinforces the need for a constant updating of knowledge about the changes in the
population that is targeted for intervention.
It is also interesting to observe that the healthier cluster (Cluster 1) does not have the highest
proportion of adolescents from an upper social class (highest parental education) which supports
that, indeed an increased knowledge (of parents) does not mean, by itself, proneness to the adoption
of healthy behaviours. Nevertheless, our results on food intake were adjusted to parents’ education
and differences according clusters remained. However in our study, the prevalence of tobacco and
alcohol use was very low, but the cluster analysis allowed discrimination of these features as a
different group. And this cluster showed differences also for the other behaviours analysed, which
reinforces the evidence that in this age, even a lower use of tobacco and alcohol represents an
important sign to potential behavioural risk.
Food intake is difficult to measure, particularly in young ages. However, it has already been
described that adolescents of 13 years old are able to answer alone to the FFQ (Rockett et al. 1997;
Papadopoulou et al. 2007). To improve the quality of answers, we decided to get this information
from both adolescents and parents. This option may have influenced some responses. However we
expected that if any effect was presented it tend to minimize differences between clusters because it

is expected that those with healthier intake report their actual intake but those with unhealthier
intake tend to underestimate unhealthy consumption and to overestimate healthier food.
Despite the significant results obtained, we recognize that one important limitation of our study lies
in the exclusion of 548 individuals who had no complete information for our analysis. Differences
were observed in gender, type of school and sport activities. Girls and participants with a higher
socioeconomic level tend to better fill questionnaires which may explain these differences. Since
students of private schools belong to a higher social class and reported more frequently to be
involved in extra-curricular sport activities, this could explain why we have a large proportion of
physical active adolescents. But it is important to note that no statistically significant differences
were found according to tobacco and alcohol use, which are the most powerful predictors. However
the number of girls and adolescents whose parents have higher education is overestimated in our
sample. Nevertheless, we do not expect a different clustering pattern of behaviours for those
participants lost or excluded from analysis. Although reducing analytic power, interpretation of
results would most likely be similar.
Despite these limitations, the study has the advantage of having a homogeneous group of
adolescents regarding their age (all with 13-year-old). Other studies tend to aggregate adolescents
with different ages in the same category. In this stage of the life cycle, marked by transition and
constant change, some behaviour vary within short periods of time, particularly the types of
behaviours under analysis. Thus, the age homogeneity of our sample could make this cross-
sectional picture more accurate. Another important advantage lies in the use of school as a sampling
source, since school attendance is compulsory at this age in Portugal.

CONCLUSION
Our findings show that even in early stages of adolescence there is a cluster of smoking, alcohol use
and food intake, providing further evidence of the clustering of unhealthy behaviours. Our results
reinforce the need for prevention programs to begin earlier in life. Prevention programs may benefit
in effectiveness if these characteristics are considered.
ACKNOWLEDGEMENTS
We gratefully acknowledge grants from Fundação para a Ciência e Tecnologia (POCTI/SAU-
ESP/62399/2004). Sílvia Fraga (SFRH/BD/44408/2008) and Diogo Costa (SFRH/BD/66388/2009)
have a PhD grant from Fundação para a Ciência e Tecnologia.
The authors declare that they have no conflict of interest.

REFERENCES
Bartlett R, Holditch-Davis D, Belyea M (2007) Problem behaviours in adolescents. Pediatr Nurs 33:
13-8
Birch LL, Fisher JO (1998) Development of Eating Behaviors Among Children and Adolescents.
Pediatrics 101: 539-49
Boden-Albala B, Sacco RL (2000) Lifestyle factors and stroke risk: exercise, alcohol, diet, obesity,
smoking, drug use, and stress. Curr Atheroscler Rep 2: 160-6
Breiman L, Friedman J, Stone CJ, Olshen RA (1984) Classification and regression trees. Belmont,
Wadsworth
Burke V, Milligan RA, Beilin LJ, Dunbar D, Spencer M, Balde E Gracey MP (1997) Clustering of
health-related behaviors among 18-year-old Australians. Prev Med 26: 724-33
Cardi M, Munk N, Zanjani F, Kruger T, Schaie KW Willis SL (2009) Health behavior risk factors
across age as predictors of cardiovascular disease diagnosis. J Aging Health 21: 759-75
Eaton DK, Kann L, Kinchen S, Shanklin S, Ross J, Hawkins J, Harris WA, Lowry R, McManus T,
Chyen D, Lim C, Brener ND, Wechsler H (CDC) (2008) Youth risk behavior surveillance--
United States, 2007. MMWR Surveill Summ 57: 1-131
Gidding SS, Dennison BA, Birch LL, Daniels SR, Gillman MW, Lichtenstein AH, Rattay KT,
Steinberger J, Stettler N, Van Horn L Association AH (2006) Dietary recommendations for
children and adolescents: a guide for practitioners. Pediatrics 117: 544-59
Gorely T, Marshall SJ, Biddle SJH, Cameron N (2007) Patterns of sedentary behaviour and
physical activity among adolescents in the United Kingdom: Project STIL. J Behav Med 30:
521-31
Guilamo-Ramos V, Litardo H, Jaccard J (2005) Prevention programs for reducing adolescent
problem behaviors: Implications of the co-ocurrence of problem behaviors in adolescence. J
Adol Health 36: 82-6
He K, Kramer E, Houser RF, Chomitz VR, Hacker KA (2004) Defining and understanding healthy
lifestyles choices for adolescents. J Adolesc Health 35: 26-33
Jessor RA (1984). Adolescent development and behavioral health. Behavioural Health: A
Handbook of Health Enhancement and Disease Prevention. J Matarazzo,S Weiss,J Herd,N
Miller and J Weiss. New York, J Wiley: 69-90
Kaufman L, Rousseeuw PJ (1990) Finding groups in data: An introduction to cluster analysis.
Wiley, New York

Lawlor DA, O'Callaghan MJ, Mamun AA, Williams GM, Bor W, Najman JM (2005)
Socioeconomic Position, Cognitive Function, and Clustering of Cardiovascular Risk
Factors in Adolescence: Findings From the Mater University Study of Pregnancy and Its
Outcomes. Psychosomatic Medicine 67: 862-8
Lopes C (2000). Reproducibility and validity of semi-quantitative food frequency questionnaire. In
Diet and Miocardial Infarction: A community-based Case-Control Study. Medical School.
Porto, University of Porto: (PhD thesis in Portuguese).
Lopes C, Aro A, Azevedo A, Ramos E, Barros H (2007) Intake and adipose tissue composition of
fatty acids and risk of myocardial infarction in a male Portuguese community sample. J Am
Diet Assoc 107: 276-86
Ma J, Betts NM, Hampl JS (2000) Clustering of lifestyle behaviors: the relationship cigarette
smoking, alcohol consumtpion, and dietary intake. Am J Health Promot 15: 107-17
Miller JW, Naimi TS, Brewer RD, Jones SE (2007) Binge Drinking and Associated Health Risk
Behaviours Among High School Students. Pediatrics 119: 76-85
Nelson M, Gordon-Larsen P, Adair L Popkin BM (2005) Adolescent physical activity and
sedentary behavior: Patterning and long-term maintenance. Am J Prev Med 28: 259-66
Papadopoulou SK, Barboukis V, Dalkiranis A, Hassapidou M, Petridou A, Mougios V (2007)
Validation of a questionnaire assessing food frequency and nutritional intake in
Greek adolescents. Int J Food Sci Nutr 59: 148-54
R Development Core Team (2008). R: A language and environment for statistical computing. R
Foundation for Satistical Computing. Vienna,Austria.
Ramos E, Barros H (2007) Family and school determinants of overweight in 13-year-old
Portuguese adolescents. Acta Paediatrica 96: 281-86
Rockett HRH, Breitenbach M, Frazier AL, Witschi J, Wolf AM, Field AE, Colditz GA (1997)
Validation of a Youth/Adolescent Food Frequency Questionnaire. Prev Med 26: 808-16
Savage JS, Fisher JO, Birch LL (2007) Parental Influence on Eating Behavior: Conception to
Adolescence. J Law Med Ethics 35: 22-34
Talashek ML, Norr KF, Dancy BL (2003) Building teen power for sexual health. Journal of
Transcultural Nursing 14: 207-16
te Velde SJ, De Bourdeaudhuij I, Thorsdottir I, Rasmussen M, Hagstromer M, Klepp K-I, Brug J
(2007) Patterns in sedentary and exercise behaviors and associations with overweight in 9–
14-year-old boys and girls - a cross-sectional study. BMC Public Health 7: 16
Wu TY, Rose SE, Bancroft RN (2006) Gender differences in health risk behaviors and physical
activity among middle school students. J Sch Nurs 22: 25-31
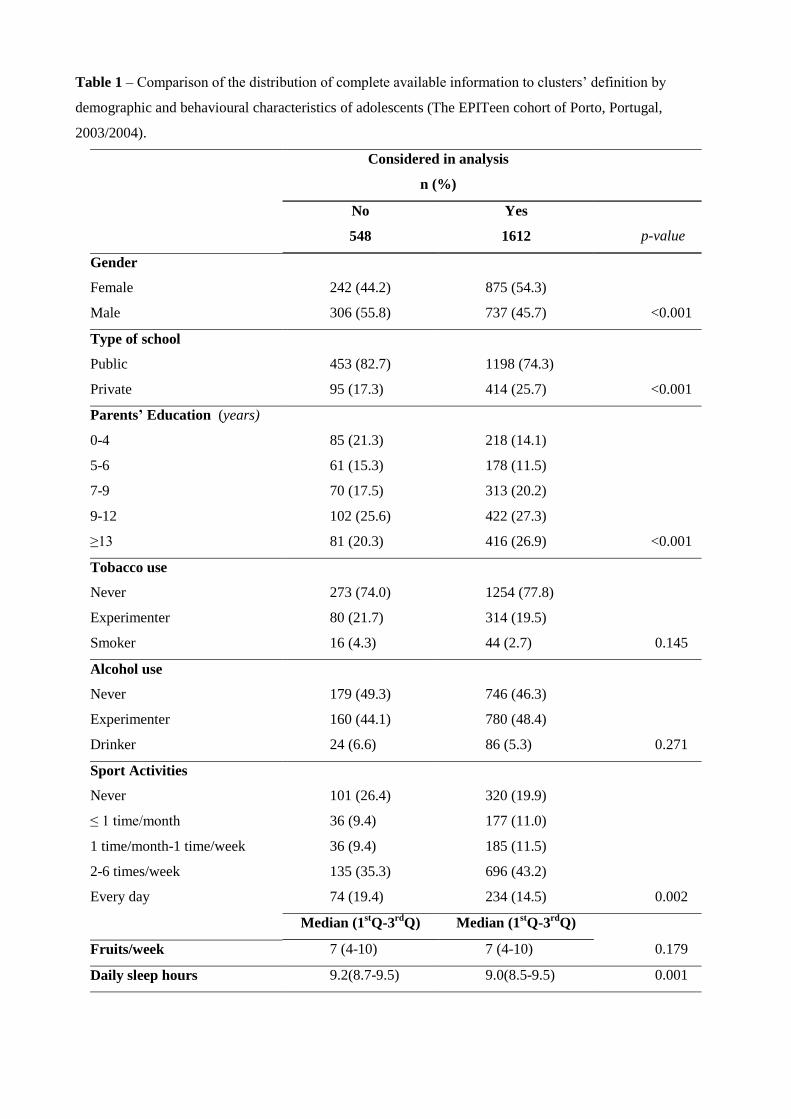
Table 1 – Comparison of the distribution of complete available information to clusters’ definition by
demographic and behavioural characteristics of adolescents (The EPITeen cohort of Porto, Portugal,
2003/2004).
Considered in analysis
n (%)
No
548
Yes
1612
p-value
Gender
Female 242 (44.2) 875 (54.3)
Male 306 (55.8) 737 (45.7) <0.001
Type of school
Public 453 (82.7) 1198 (74.3)
Private 95 (17.3) 414 (25.7) <0.001
Parents’ Education (years)
0-4 85 (21.3) 218 (14.1)
5-6 61 (15.3) 178 (11.5)
7-9 70 (17.5) 313 (20.2)
9-12 102 (25.6) 422 (27.3)
≥13 81 (20.3) 416 (26.9) <0.001
Tobacco use
Never 273 (74.0) 1254 (77.8)
Experimenter 80 (21.7) 314 (19.5)
Smoker 16 (4.3) 44 (2.7) 0.145
Alcohol use
Never 179 (49.3) 746 (46.3)
Experimenter 160 (44.1) 780 (48.4)
Drinker 24 (6.6) 86 (5.3) 0.271
Sport Activities
Never 101 (26.4) 320 (19.9)
≤ 1 time/month 36 (9.4) 177 (11.0)
1 time/month-1 time/week 36 (9.4) 185 (11.5)
2-6 times/week 135 (35.3) 696 (43.2)
Every day 74 (19.4) 234 (14.5) 0.002
Median (1stQ-3
rdQ) Median (1
stQ-3
rdQ)
Fruits/week 7 (4-10) 7 (4-10) 0.179
Daily sleep hours 9.2(8.7-9.5) 9.0(8.5-9.5) 0.001
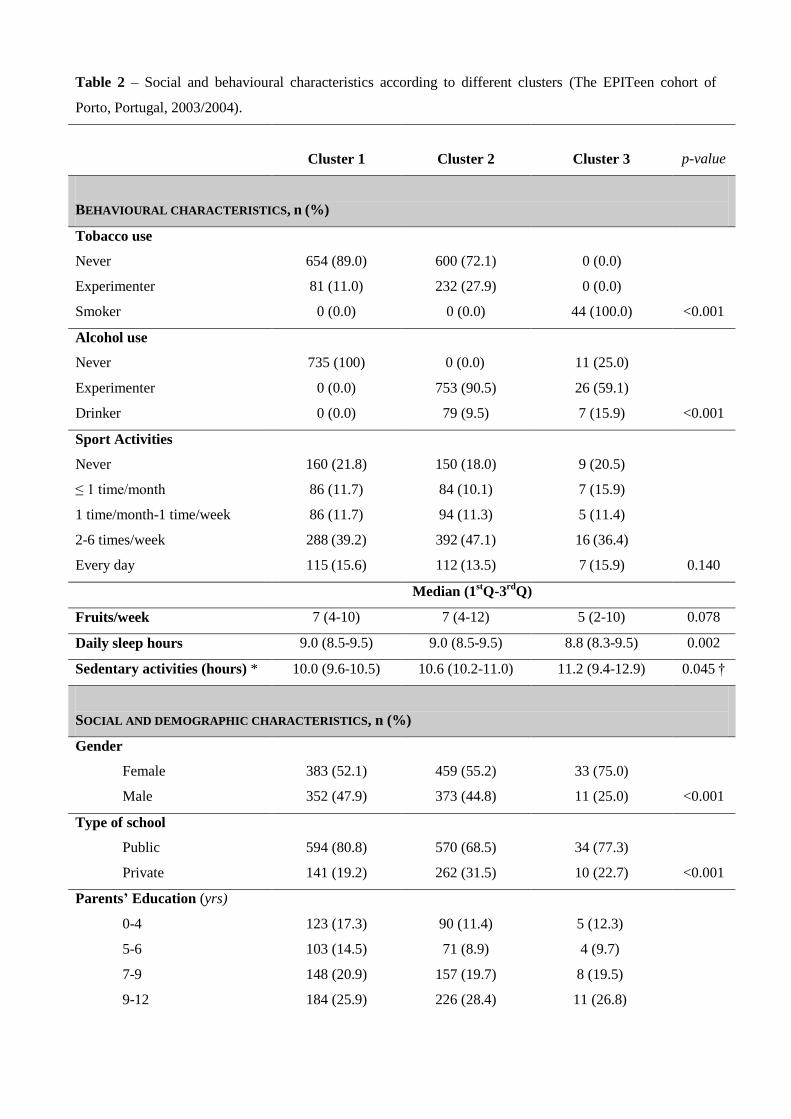
Table 2 – Social and behavioural characteristics according to different clusters (The EPITeen cohort of
Porto, Portugal, 2003/2004).
Cluster 1
Cluster 2
Cluster 3
p-value
BEHAVIOURAL CHARACTERISTICS, n (%)
Tobacco use
Never 654 (89.0) 600 (72.1) 0 (0.0)
Experimenter 81 (11.0) 232 (27.9) 0 (0.0)
Smoker 0 (0.0) 0 (0.0) 44 (100.0) <0.001
Alcohol use
Never 735 (100) 0 (0.0) 11 (25.0)
Experimenter 0 (0.0) 753 (90.5) 26 (59.1)
Drinker 0 (0.0) 79 (9.5) 7 (15.9) <0.001
Sport Activities
Never 160 (21.8) 150 (18.0) 9 (20.5)
≤ 1 time/month 86 (11.7) 84 (10.1) 7 (15.9)
1 time/month-1 time/week 86 (11.7) 94 (11.3) 5 (11.4)
2-6 times/week 288 (39.2) 392 (47.1) 16 (36.4)
Every day 115 (15.6) 112 (13.5) 7 (15.9) 0.140
Median (1stQ-3
rdQ)
Fruits/week 7 (4-10) 7 (4-12) 5 (2-10) 0.078
Daily sleep hours 9.0 (8.5-9.5) 9.0 (8.5-9.5) 8.8 (8.3-9.5) 0.002
Sedentary activities (hours) * 10.0 (9.6-10.5) 10.6 (10.2-11.0) 11.2 (9.4-12.9) 0.045 †
SOCIAL AND DEMOGRAPHIC CHARACTERISTICS, n (%)
Gender
Female 383 (52.1) 459 (55.2) 33 (75.0)
Male 352 (47.9) 373 (44.8) 11 (25.0) <0.001
Type of school
Public 594 (80.8) 570 (68.5) 34 (77.3)
Private 141 (19.2) 262 (31.5) 10 (22.7) <0.001
Parents’ Education (yrs)
0-4 123 (17.3) 90 (11.4) 5 (12.3)
5-6 103 (14.5) 71 (8.9) 4 (9.7)
7-9 148 (20.9) 157 (19.7) 8 (19.5)
9-12 184 (25.9) 226 (28.4) 11 (26.8)

≥13 151 (21.4) 252 (31.6) 13 (31.7) <0.001
* Total hours watching TV, playing computer and reading
† p-trend=0.045
.

Table 3 –Frequency of food intake measured by FFQ according to different clusters (The EPITeen cohort of
Porto, Portugal, 2003/2004).
Cluster 1 Cluster 2 Cluster 3
Frequency of daily intake Mean (95% CI) Mean (95% CI) Mean (95% CI)
CRUDE
Sweets and pastry 2.08 (1.94-2.22) 1.98 (1.84-2.12) 2.08 (1.53-2.63)
Soft drinks 1.07 (0.97-1.17) 1.20 (1.10-1.30) 1.37 (0.96-1.77)
Fruits 2.56 (2.41-2.70) 2.56 (2.42-2.70) 2.18 (1.59-2.76)
Vegetables 2.11 (1.95-2.27) 2.32 (2.16-2.48) 2.05 (1.40-2.70)
Soup 0.82 (0.77-0.87) 0.90 (0.85-0.95)* 0.85 (0.64-1.06)
ADJUSTED †
Sweets and pastry 1.96 (1.86-2.06) 1.87 (1.77-1.97) 2.08 (1.64-2.51)
Soft drinks 0.95 (0.87-1.03) 1.16 (1.08-1.23)* 1.31 (0.96-1.66)*
Fruits 2.52 (2.38-2.65) 2.52 (2.39-2.65) 2.23 (1.69-2.77)
Vegetables 2.06 (1.91-2.21) 2.25 (2.11-2.39) 2.09 (1.48-2.70)
Soup 0.81 (0.76-0.86) 0.90 (0.85-0.95)* 0.86 (0.66-1.06)
ADJUSTED‡
Sweets and pastry 1.95 (1.84-2.06) 1.91 (1.86-2.01) 2.10 (1.66-2.53)
Soft drinks 0.92 (0.84-1.01) 1.18 (1.09-1.26) * 1.29 (0.95-1.63) *
Fruits 2.53 (2.40-2.67) 2.47 (2.33-2.59) 2.21 (1.69-2.74)
Vegetables 2.06 (1.91-2.22) 2.18 (2.03-2.33) 2.06 (1.47-2.65)
Soup 0.81 (0.75-0.85) 0.85 (0.80-0.90) 0.86 (0.62-0.99)
* p<0.001
† Adjusted for total energy intake (the log transformation was applied to the dependent variable)
‡ Adjusted for total energy intake and parents’ education.
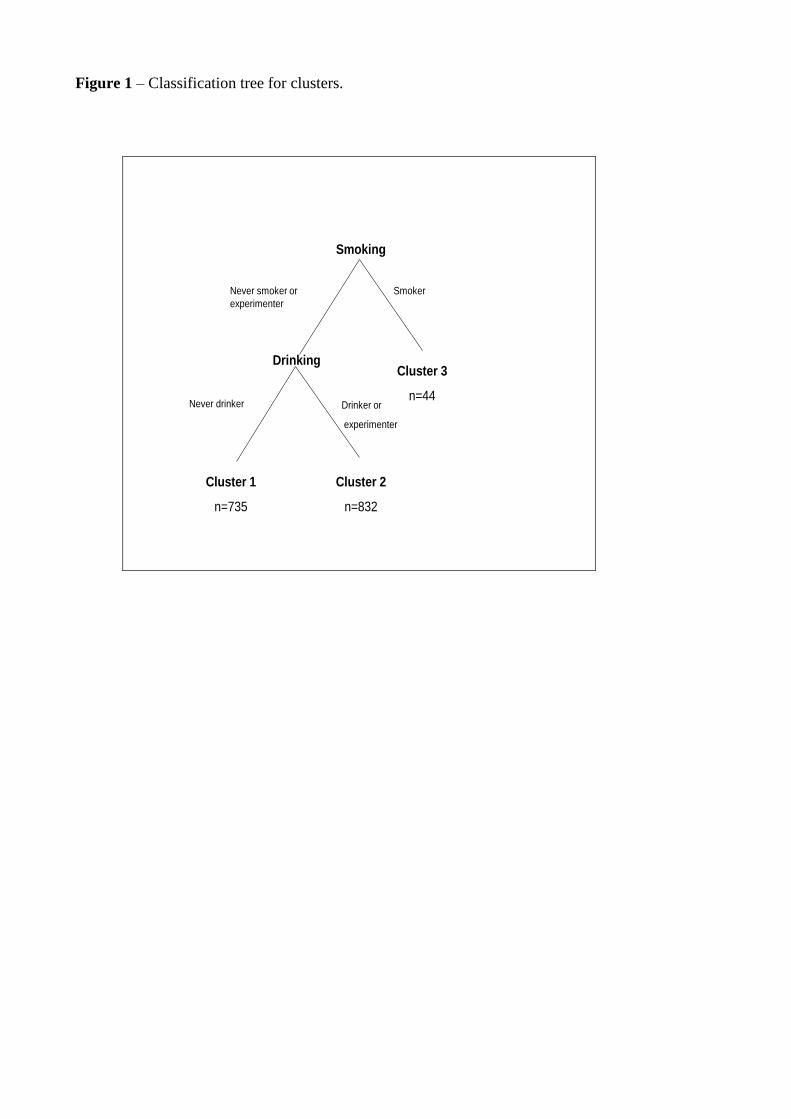
Figure 1 – Classification tree for clusters.
Smoking
Cluster 3
n=44
Drinking
Cluster 1
n=735
Cluster 2
n=832
SmokerNever smoker or
experimenter
Drinker or
experimenter
Never drinker