TENDER Construction of Additional Classrooms, Toilet Blocks ...
Upload
khangminh22Category
view
0download
0
ReportApril 2018
Authors Oxford Policy Management
Dr. Ruhi Saith, Shruti Viswanathan,
Sneha Lamba, Sarthak Joshi, Nikita Purty
Ideas42
Dr. Saugato Datta, John Harris
Improving H.A.B.I.T: Households’ Attitudes and Behaviours to Increase Toilet Use
TW14.005
Improving H.A.B.I.T: Households’ Attitudes and Behaviours to Increase Toilet use
A randomised control trial to test the impact of simple behavioural interventions on toilet use in rural Bihar Authors:
Oxford Policy Management: Dr. Ruhi Saith, Shruti Viswanathan, Sneha Lamba, Sarthak Joshi,
Nikita Purty
Ideas42: Dr. Saugato Datta, John Harris
April 2018
i
Outline of the main report
Outline of the main report ............................................................................................................ i
List of tables and figures ............................................................................................................. iii
List of abbreviations .................................................................................................................. iv
Acknowledgements ................................................................................................................... vi
Executive summary ................................................................................................................... vii
1. Introduction ......................................................................................................................... 1
1.1. Context and rationale for evaluation ............................................................................. 1
1.2. Objectives of the evaluation ......................................................................................... 4
1.3. Scope of the evaluation ................................................................................................ 5
2. Evaluation questions and hypotheses ................................................................................. 6
3. Identified outcomes and key indicators ................................................................................ 7
4. Research design ................................................................................................................. 8
4.1. Evaluation design and timeline ..................................................................................... 8
4.1.1. Evaluation design ..................................................................................................... 8
4.1.2. Timeline .................................................................................................................. 10
4.1.3. Power calculations .................................................................................................. 10
4.2. Sampling .................................................................................................................... 11
4.2.1. Selecting villages .................................................................................................... 12
4.2.2. Selecting wards ...................................................................................................... 13
4.2.3. Selecting households .............................................................................................. 15
4.2.4. Selecting individuals ............................................................................................... 15
4.2.5. Sampling weights .................................................................................................... 16
4.3. Data collection ............................................................................................................ 17
4.4. Implementation ........................................................................................................... 19
5. Data analysis ..................................................................................................................... 20
5.1. Techniques for qualitative data analysis ..................................................................... 20
5.2. Techniques for quantitative data analysis ................................................................... 21
5.3. How to read tables ..................................................................................................... 22
6. Registration of pre-analysis plan ....................................................................................... 23
7. Internal validity of the evaluation design ............................................................................ 23
7.1. Balance across treatment and control study arms ...................................................... 23
7.2. Other competing interventions .................................................................................... 27
7.3. Self-selection bias ...................................................................................................... 27
7.4. Risk of spillover .......................................................................................................... 28
7.5. Behavioural responses to the evaluation .................................................................... 28
7.6. Implications for ex-post power calculations and ex-post randomisation ...................... 30

ii
8. Findings ............................................................................................................................ 31
8.1. Description of the quantitative sample ........................................................................ 31
8.2. Description of the qualitative sample ............................. Error! Bookmark not defined.
8.3. Comparison of survey sample with national population .............................................. 34
8.4. Cross-tabulations, correlation, and/or regression analysis using quantitative data ..... 36
8.5. Findings from qualitative sample .................................. Error! Bookmark not defined.
8.6. Other implications ...................................................................................................... 41
9. Ethics ................................................................................................................................ 44
10. Major challenges and lessons learned ........................................................................... 44
11. Conclusion ..................................................................................................................... 46
Bibliography ............................................................................................................................. 48
Appendix A: Theory of Change ................................................................................................. 49
Appendix B: Map of treatment and control areas ...................................................................... 50
Appendix C: Regressions Predicting Toilet Use ....................................................................... 50
Appendix D: Learning Journal .................................................................................................. 52

iii
List of tables and figures
Table 1: Key final and intermediate outcome indicators .............................................................. 8
Table 2 :Power calculations ...................................................................................................... 11
Table 3: Study areas ................................................................................................................ 13
Table 4: Sampling frame for selecting treatment and control wards .......................................... 14
Table 5: Household listing summary ......................................................................................... 14
Table 6: Final sample size by district ........................................................................................ 15
Table 7: Average weighted baseline household, individual, and community characteristics
(Balance tests) ......................................................................................................................... 24
Table 8: Average unweighted baseline household, individual and community characteristics
(Balance tests) ......................................................................................................................... 25
Table 9: Comparing a priori and ex-post power calculations ..................................................... 30
Table 10: Weighted summary statistics of baseline quantitative sample—household, individual,
and community characteristics ................................................................................................. 33
Table 11: Comparison of baseline statistics with national and state-level statistics ................... 35
Table 12: Proportion of individuals who defecate in the open by age and sex .......................... 38
Figure 1: Evaluation timeline .................................................................................................... 10
Figure 2: Programme districts and blocks ................................................................................. 12
Figure 3: Open defecation across age by sex among individual adults in our sample ............... 37
Figure 4: Open defecation across education by sex among individual adults in our sample ..... 37
Figure 5: Toilet use at the household level by religion, caste, poverty, and spending ............... 39
Figure 6: Toilet Use at the Household Level By Religion, Caste, Poverty, Spending ................ 39
Figure 7: Perceptions about time taken for pit to fill .................................................................. 40
Figure 8: Perceptions about time taken for pit decomposition ................................................... 41
Figure 9: Perceptions about time taken for pit decomposition ................................................... 41

iv
List of abbreviations
3ie International Initiative for Impact Evaluation
BPL Below Poverty Line
BRLPS Bihar Rural Livelihoods Promotion Society
CAPI Computer Assisted Personal Interviewing
DHS Demographic Health Survey
DID Difference in Differences
DLHS District-Level Health Survey
H.A.B.I.T Households’ Attitudes and Behaviours to Increase Toilet Use
ICC Intra-cluster Correlation
IEC Information, Education and Communication
IRB Institutional Review Board
ITT Intent-to-Treat
ITC Inter-Temporal Correlation
MDE Minimum Detectable Effect
NFHS National Family Health Survey
NREGA National Rural Employment Guarantee Act
NSSO National Sample Survey Organisation
OBC Other Backward Caste
OLS Ordinary Least Squares
OPM Oxford Policy Management
PAP Pre-Analysis Plan
PPS Probability Proportional to Size
RCT Randomised Control Trial
R.I.C.E. Research Institute of Compassionate Economics
SBM Swaccha Bharat Movement (Mission)
SC Scheduled Caste
SHG Self-Help Group
SQUAT Sanitation Quality, Use, Access, and Trends
ST Scheduled Tribe

v
TOT Treatment on the treated
WASH Water, Sanitation, and Hygiene
WVI World Vision India
vi
Acknowledgements
This report has benefited immeasurably from the inputs of many. We are enormously grateful to
the partnership and support of the International Initiative for Impact Evaluation, which made this
study possible. Particular thanks to Neeta Goel, Shaon Lahiri and Anmol Narain for their infinite
patience and counsel. We would like to thank the research institute for compassionate
economics (r.i.c.e.), specifically, Sangita Vyas, for their technical overview.
We are grateful to our implementation partner, World Vision India, whose insights on operations
and ground logistics were invaluable in conceptualising and designing this study. This study would
not have been possible without inputs from Sherin Daniels, Roufi Williams, and Mahesh Nathan
at World Vision India. Special thanks to Suman Gidwani from ideas42 who has been an integral
part of the study design.
We would like to thank Dr Prabal Vikram Singh and Dr Nayan Kumar for their painstaking efforts
in leading the field investigations. We would also like to thank the investigators and other
members of the field team who collected the data, and the supervisors who monitored the data
collection and analysis. A special thanks to the communities, households, and individuals who
took part in this survey and study.
Dr Garima Bhalla and Dr Baby Kurian provided invaluable technical oversight and quality
assurance to this report. We are thankful to Pragya Katariya for her editorial contribution and to
Rishi Kaushik for helping design the report. We would also like to acknowledge the contributions
of Meenu Bhalla, Asha Gosain, Sibhashish Mishra, and Brighty Dawson for managing the
administrative and financial aspects of this study.
All opinions expressed, and any mistakes in the report, remain the responsibility of the authors.

vii
Executive summary
Despite the large-scale sanitation subsidy programmes implemented over the last two decades,
rates of open defecation in India remain high even compared to other countries with similar socio-
economic characteristics. Bihar has a high rate of open defecation, with 70% of people in rural
Bihar defecating in the open (Swacchta Status Report, 2015). Furthermore, previous studies have
reported that within households that possess a latrine, at least 44% households have one member
that defecates in the open. Given Bihar’s status as the country’s second-most populous state,
these figures suggest, firstly, that progress on eliminating open defecation in Bihar will be
important for the national mission, and secondly, that a large part of the progress in Bihar (as
elsewhere) will involve bridging the gap between toilet ownership and toilet use. Developing
scalable, cost-effective interventions to bridge this gap by increasing rates of latrine usage in rural
Bihar, therefore, emerges as a key input into the success of India’s drive to eliminate open
defecation, and is likely to be influential in informing both state and national government strategy
on sanitation.
Between November 2016 and May 2017, the study team conducted formative research to identify
key behavioural barriers to toilet use. We found that the main reasons for toilet non-use were
socialisation during open defecation, dissatisfaction with the toilet design, and fear of pit filling. In
this background, Oxford Policy Management (India), along with ideas42 and World Vision, India,
designed and developed a simple behavioural intervention aimed at increasing the intent to, and
habit of, toilet use amongst toilet-owning households in rural Bihar. This intervention aims to test
the effectiveness of a simple set of behavioural interventions intended to tackle common
misconceptions around toilet use and introduce behavioural ‘tricks’ to encourage its practice. The
intervention recognises the importance of social norms in influencing toilet use and tackling
perceptions related to pit latrines. By tackling behavioural norms at the community and household
level, this intervention attempts to impact individuals’ attitudes and behaviour at two critical levels.
To measure the impact of this intervention on behaviour and attitudes, an experimental
randomised control trial was designed to assign treatment and control wards for the intervention.
This intervention will be implemented in six blocks across six districts in Bihar. Only blocks in
which World Vision India had pre-existing operations have been selected. The primary sampling
unit will be wards which have been randomly assigned as treatment and control wards. Within
each ward, all ‘eligible’ households will be part of the treatment. Eligibility criteria include the
presence of a functional twin-pit latrine in the household. Intervention activities will be
implemented in a total 2328 households within 49 treatment villages.
A difference-in-difference methodology will be used to capture the impact of the intervention. A
quantitative baseline survey was conducted between February and March 2018 in the treatment
and control areas. In addition, a qualitative evaluation will take place at the endline and a process
evaluation will take place mid-way through the intervention to test the fidelity of the
implementation. Together, these assessments will seek to provide a comprehensive picture of
not just the effectiveness of the intervention, but also the reasons for change (or lack thereof),
and the key pain points from an implementation perspective. Having an implementation partner
as a core member of the design team has been crucial in accounting for feasibility, scalability,
and sustainability.
The baseline survey finds that the experiment seems to be well-balanced on outcome variables
in our study. However, we found some imbalance in terms of the demographic characteristics of

viii
the population. The treatment arm had a higher percentage of Hindu households and lower
percentage of female-headed households. Imbalance in the randomisation means that a simple
comparison of outcomes between the treatment and control groups at endline may be subject to
confounding. We will need to include baseline covariates that show an imbalance and will not be
affected by the intervention as controls in the model specification, which will be used to assess
impact at endline.
The baseline survey finds that a large proportion of men and women with access to toilets
continue to defecate in the open. This is in line with the theory of change for the programme. We
find that a majority of households do not possess any information on the pit filling and emptying
options. Those that do have information on pit filling, tend to equally under- and overestimate the
rate of pit filling. While the theory of change hypothesises that households tend to overestimate
rates of pit filling, this finding suggests that misinformation around pit filling occurs in both
directions. Additionally, these areas provide avenues of enquiry in the qualitative study.
Overall, the findings from the baseline align with the key assumptions and change pathways
outlined in the programme theory of change. Treatment and control arms have some imbalance
on demographic characteristics and these will need to be controlled for in the endline analysis.

1
1. Introduction
1.1. Context and rationale for evaluation
Why is sanitation important?
Safe sanitation is key to promoting better public health. Poor sanitation has always been
associated with childhood diarrhoea, mortality, and stunting1. Safe sanitation reduces instances
of pathogens entering the environment, thus, reducing risk of disease.2 Studies show that safe
sanitation can help reduce diarrhoeal diseases, thus improving health outcomes.3 A recent paper
has found open defecation, and exposure to open defecation, as a possible determinant of
stunting amongst children in India.4 A report estimated that lack of access to sanitation cost the
global economy US$222.9 billion in 2015.5 This figure captures the costs associated with mortality
and treating sanitation-related diseases, lack of productivity, and the value of time foregone due
to lack of easy access to a toilet. A 2013 study found an effect on early cognitive development
from exposure to open defecation.6 The importance of proper sanitation is also recognised in the
Sustainable Development Goals where goal 6 reads, ’Ensure availability and sustainable
management of water and sanitation for all‘7.
Thus, health research and policy making has firmly established the importance of safe sanitation
in achieving health, economic, and human development progress.
Sanitation in India
India’s sanitation problem has long puzzled health researchers and economists. Despite a burst
of economic growth post-1991 and significant poverty reduction, the state of sanitation remains
abysmal. A 2015 national survey indicates that over 50% of the population in rural India continue
to defecate openly.8 In comparison, rural open defecation rates in Bangladesh hover around 5%
and in rural China, around 2%.9 Even countries in sub-Saharan Africa, with lower economic
measures than India, have been successful in eliminating open defecation at a faster pace.
Currently, over 60% of all open defecation globally is attributed to India.10
The sanitation problem has been recognised by various national and state governments in the
country. Large-scale national programmes such as ‘Nirmal Bharat Abhiyan’ and ‘Total Sanitation
Campaign’ have been promoted to tackle rampant open defecation. However, most of these
programmes, in implementation, have been hardware-driven and supply-focused, with
interventions focussing on the construction of latrines, without adequately addressing the needed
behaviour change and financing for sustainability. This has resulted in serious slippage in terms
1 (Spears, et al., 2013) 2 Water treatment and handwashing are practices that help prevent the impact of pathogens that do reach the environment. Guiteras et al. (2015), Disgust, Shame and Soapy Water: Test of Novel Interventions to Promote Safe Water and Hygiene. 3 (Waddington, et al., 2009) 4 (Spears, et al., 2013) 5 Lixil and Oxford Economics, The True Cost of Poor Sanitation, 2016. 6 (Spears & Lamba, 2015) 7 SDG 6 target to achieve access to adequate and equitable sanitation and hygiene for all and end open defecation, paying special attention to the needs of women and girls and those in vulnerable situations. 8 Swacchta Status Report; as sourced from http://indiaenvironmentportal.org.in/files/file/Swachhta_%20Status_Report2016.pdf 9 (UNICEF, 2012) 10 (UNICEF, 2012)
2
of usage and ’missing toilets’. Issues of maintenance, use, sustainability, and awareness
generation remained largely left unaddressed in these campaigns.
In 2014, a crucial policy development ushered in the opportunity to rethink these programmes.
The Prime Minister of India launched the flagship ‘Swacch Bharat Movement (SBM)’. One of the
aims of this programme is to make India open defecation free (ODF) by 2019. This programme
recognises the importance of promoting safe sanitation in the country, diverting considerable
resources and attention to this aim. In addition, the programme also gives importance to changing
attitudes and behaviours around hygiene and sanitation. Importantly, a corpus of money has been
set aside for Information, Education, and Communication (IEC) campaigns. This provides an
opportunity to engage with concerns around toilet use in the country and design multi-faceted
solutions to the sanitation puzzle in India.
Access = Use?
Interestingly, open defecation practices cannot be explained by lack of access to toilets alone.
High rates of non-use are observed even amongst households that have access to a functional
latrine. National surveys have acknowledged that toilet ownership cannot be equated with toilet
use; with respondents citing the following reasons for non-use: ‘no super-structure’, ‘not clean/
insufficient water’, ‘malfunctioning of the latrine’, and ‘personal preference’.11 To some extent, this
trend can also be observed internationally. Open defecation (OD) can often be a common,
acceptable practice in a community, often learned from childhood. A global review of open
defecation behaviours found respondents from various countries describing it as ‘traditional,
natural, and part of one’s daily routine’.12 However, the persistence of social norms in promoting
open defecation is much stronger in India with toilet use and ownership figures showing a much
larger mismatch. Additionally, global figures indicate a positive co-relation between wealth and
toilet use, i.e., households that become wealthier are more likely to build and use toilets. This
trend does not, however, hold in India with only a marginal difference seen in toilet use across
wealthier households in rural India. 13 Despite large leaps being made in making available
improved sources of water to rural households, proportional increases are not seen in toilet
access and use.
Indian social scientists have long established the link between deep-rooted caste bias and
sanitation practices in India. Within the Hindu caste order, the lowest castes or Dalits have
traditionally been tasked with unpleasant tasks such as cleaning human faeces. In this oppressive
order, Dalits are expected to clean the households of higher castes and the ‘impurity’ associated
with these tasks is also used as a reason to continually treat them as lower castes.14 Anyone
performing these tasks is labelled as ‘impure’ and expelled outside the caste order. Recognising
this unfair and inhumane practice of forcing certain Dalits to clean human faeces, the government
of India passed a legislation to ban manual scavenging in the country.15 Despite this law, the 2011
census reported the presence of 794,000 manual scavengers in the country, pointing to the
persistence of this practice16.
11 Swacchta Status Report; as sourced from http://indiaenvironmentportal.org.in/files/file/Swachhta_%20Status_Report2016.pdf 12 (O’Connell, 2014) 13 (Coffey, et al., 2017) 14 (Vālmīki, n.d.) 15 The Prohibition of Employment as Manual Scavengers and their Rehabilitation Act 2013 16 Census of India (2011)
3
The Sanitation Quality, Use, Access, and Trends (SQUAT) survey17 persuasively argues that
persistent low demand for latrine use is partly ‘attributable to beliefs, values, and norms about
purity and pollution of private spaces and of bodies.’ These engrained beliefs help explain
household resistance to using affordable pit latrines and aversion to pit emptying, which has
traditionally been looked upon as a task for the lowest castes. Similarly, a recent study argues
that higher caste groups reinforce their sense of superiority by not using and cleaning toilets—a
task they believe belongs to the lowest castes.18
The Bihar Story
While open defecation figures across India are high, they are particularly alarming in northern and
western India. Bihar is ranked amongst the poor states in the country, with low scores on literacy
and health. Poverty rates remain stubbornly high with over 30% of the population falling in the
lowest economic quartile in the country.19 Child malnutrition remains high; 55% of children under
three years of age are underweight, 50% are stunted, and 33% are wasted.20
Bihar performs poorly along various sanitation and health measures with repeated surveys
ranking it as low-performing. The Census of India (2011)21 reported that over 75% of the state’s
population did not have access to latrines. The 2015 Swacchta Status Report found a modest
improvement, reporting 72.8% of rural households as not having access to a latrine facility.22 The
latest figures from the SBM website, once again, have Bihar with the lowest toilet coverage, with
only 48.4% of households possessing a toilet.23 Interestingly, 93.4% of the households in rural
Bihar were found to have sufficient water for all household activities.24
The public health consequences of this lack of access to sanitation are alarming. A 2015 study of
school-going children in Bihar found that 68% of the children surveyed were infected with one or
more soil-transmitted helminth species, i.e., worms. The key cause of this was the practice of
open defecation (95% of the children surveyed reported this practice) and unsafe hand washing
practices (61% of the children reported cleaning hands with soil).25 Clearly, this has huge public
health costs and can adversely affect child mortality within the state.26
Findings from the formative research
Between November 2016 and May 2017, the study team conducted formative research to identify
key behavioural barriers to toilet use. The research was carried out in Nalanda district of Bihar.27
Most persons interviewed expressed interest in owning and using a toilet but were dissatisfied
with the current design of the twin-pit toilet. These toilets were used mostly by younger women in
the household, with others referring to it as an “Emergency Toilet” to be used at night time and in
cases of ill-health only. We found that the main reasons for toilet non-use were socialisation during
open defecation, dissatisfaction with the toilet design, and fear of pit filling.
17 (Coffey, et al., 2017) 18 (Modi, 2014) 19 Census of India (2011) 20 National Family Health Survey-4 (2015) 21 Census of India (2011) 22 Swacchta Status Report; as sourced from http://indiaenvironmentportal.org.in/files/file/Swachhta_%20Status_Report2016.pdf 23 http://sbm.gov.in/sbmdashboard/Default.aspx 24 Swacchta Status Report; as sourced from http://indiaenvironmentportal.org.in/files/file/Swachhta_%20Status_Report2016.pdf 25 (Greenland, et al., 2015) 26 For e.g. given the high prevalence of soil helminths in the state, the above study recommends a mass de-worming programme across all schools to improve educational attainment and health of school-aged children. 27 More details on this study can be found in the formative study report.
4
Our formative research focused on barriers that may be amenable to behavioural interventions.
Deeper analysis unearthed the following behavioural barriers to intention formation: insufficient
information around pit-emptying options, a strong aversion to self-emptying, and overestimation
of pit-filling rates. In combination, these created a strong belief that the latrine is a limited resource.
Apart from barriers to intention formation, barriers that prevent good intentions from becoming
habits are also important. We found that the barriers to toilet use habit formation include deeply
embedded cultural rituals surrounding open defecation and lack of immediate, visible rewards for
latrine use. Recognition of the health benefits of toilet use was low amongst all respondents. Thus,
the findings of the formative research align with existing literature on sanitation behaviour patterns,
highlighting the complex social, caste, and gender norms that determine possession, and use of
a toilet.
Rationale and importance of this study
The above sections highlight the importance of safe sanitation to public health, the cultural factors
controlling toilet ownership and use in rural north India, and the need to tackle these complex
behaviours in Bihar. This study aims to test simple behavioural ‘nudges’ that can change
incentives on toilet use, tackling both the intent to use and the habit of using toilets.
The study design keeps in mind the importance of social norms in determining these behaviours,
thus targeting both community and household notions around sanitation. The evidence from this
study could be useful in designing an effective communication strategy to promote and sustain
toilet use.
A key conclusion of the formative phase of the study was that interventions to increase latrine use
in rural Bihar need to address the structural and cultural barriers to pit emptying. This must
operate in tandem with existing policy to 1) avoid mentioning external means of pit emptying; and
2) insist that households empty their own pits.
1.2. Objectives of the evaluation
The key objective of the evaluation is to test the impact of a behavioural intervention28 in changing
attitudes and behaviours around toilet use in rural Bihar. This study will focus on the toilet use
component of sanitation as the key outcome indicator. Physical factors influencing toilet use such
as the quality of toilet construction and the surrounding environment will not be considered in this
evaluation.
The baseline study has three overarching aims. First, this report outlines key characteristics of
the study populations to test for balance across populations in the treatment and control arms of
the study. Second, the findings from the baseline survey collect data for intermediate and final
outcome indicators to allow assessment of change in these indicators at the endline. The key
outcome indicators of the baseline study are: toilet use (final outcome); safe disposal of child
faeces (final outcome); information on pit filling (intermediate outcome); knowledge on the correct
rates of pit filling (intermediate outcome); and aversion to pit emptying (intermediate outcome).
The importance of each of these outcomes is outlined in the theory of change (Appendix A).
Third, the report findings provide insights into toilet behaviours and attitudes in selected
households, allowing us to validate the theory of change and key assumptions made in the
28 The intervention leverages a set of community meetings and follow-up household visits and utilises an inter-related and internally coherent set of activities and tools to create and activate intentions to use latrines. Specifically, the intervention will: a) correct mental models about pit filling; b) address reasons for latrine aversion; c) address aversion to pit emptying; and d) create commitment to use the toilet.

5
research and intervention design. We find that the baseline results highlight a couple of
assumptions that need to be monitored closely: gendered differences in use of toilets and
information around pit-filling rates. While these findings require us to monitor our theory of change
closely, they do not raise warrant changes in the intervention design. The implications of these
findings are discussed in detail in Section 8.4.
1.3. Scope of the evaluation
1.3.1. Geographical area of the study
This study is set entirely in the state of Bihar in India. The state is land-locked, bordered by the
states of West Bengal, Uttar Pradesh, and Jharkhand; and by Nepal in the north. Bihar is the
third most populous state in the country with a population of over 100 million people. It is
overwhelmingly rural with 89% of the population living in rural areas. Bihar is also the most
densely populated state in the country with an average of 1100 persons per square kilometre.
The intervention is being implemented in six districts within the state: Jamui, Khagaria,
Madhepura, Nalanda, Nawada, and Saharsa. A map of treatment and control areas is provided
in the Appendix B.
1.3.2. Participants
Our implementing partner, World Vision India (WVI) operates in some 96 villages across six
districts of Bihar. Of these, 43 were randomly assigned as control villages and 43 were randomly
assigned treatment villages. An extra six villages were added to the treatment to conduct process
evaluation in these six villages. According to our baseline survey, there were a total of 4656
eligible households across selected treatment and control areas (2328 in each study arm). More
details on the sampling process and assigned villages, wards, and households can be found in
Section 4.2.
1.3.3. Eligibility criteria
Villages within WVI’s area of operation were randomly assigned as treatment and control villages.
Within each treatment village, treatment wards were assigned. The intervention will be
implemented only within the treatment wards. Within the selected wards, any household with a
functional twin-pit latrine was deemed eligible for the study. To qualify as a functional latrine, the
following four criteria must be satisfied: 1) pan is not cracked/ broken; 2) pan is not blocked; 3)
latrine has a completed pit (can be defined as a covered pit); and 4) link between the pan and pit
is not broken. The eligibility of households for the study was ascertained during an exhaustive
listing exercise conducted before the baseline survey.
1.3.4. Political economy considerations
Given the sensitive nature of the intervention, political risks and opportunities must be constantly
evaluated, especially considering the SBM. First, the increased focus on sanitation and use
behaviours propelled by SBM makes this an opportune moment for sanitation and health research.
The desire and funding for such interventions are greatly increased. At the same time, the
intervention may create misaligned incentives with government officials who are under pressure
to declare villages, blocks, and districts ODF. Constant communication with local officials and
support from the central ministry will be important in navigating this relationship. Additionally, we
must be careful to document any negative impacts from the study. We would not want to
encourage solutions that further entrench caste-based discrimination norms around pit emptying.
The design and implementation teams have been aware of this risk and will continue to monitor
it through the course of this project. More about learnings and risks is encapsulated in Section 10.
6
2. Evaluation questions and hypotheses
Toilet use is the final outcome across the interventions designed. Our intervention is particularly
targeted towards increasing toilet use among male members in households with functional twin-
pit latrines that are not used by any or all household members (i.e. one or more or all members
in the household continue to practice open defecation). This intervention is tailored to target intra-
household toilet use as it would be important to capture use across household members. We
have included an additional hypothesis that tests the impact of the intervention on the safe
disposal of child faeces (H2c). While our study is not powered to test this hypothesis, we will
explore this indicator as an outcome to test for translation of the habit of latrine use among adults
to children.
We have listed the primary hypotheses, intermediate hypotheses, and corresponding evaluation
questions for this study below:
• H1a: Primary Hypothesis 1a: Household-level: The intervention will increase toilet
use amongst treated households. Is the behavioural intervention successful at
increasing toilet use among eligible households?
• H1b: Primary Hypothesis 1b: Household members- Individual level: The
intervention will increase the number of members within treated households who
regularly use toilets. Is the behavioural intervention successful at increasing toilet use
among household members within eligible households?
• H2a: Primary Hypothesis 2a: Individual-level: The intervention will increase toilet
use amongst adult male members (above age of five) within treated households: Is
the behavioural intervention successful at increasing latrine use among male members in
eligible households?
• H2b: Primary Hypothesis 2b: Individual-level: The intervention will increase toilet
use amongst adult female members (above age of five) within treated households:
Is the behavioural intervention successful at increasing latrine use among female
members in eligible households?
• H2c: Primary Hypothesis 2c: Individual-level: The intervention will increase safe
disposal of child faeces for children below the age of five within treated households:
Is the behavioural intervention successful at increasing safe disposal of faeces for children
below the age of five in eligible households?29
• IH1a: Intermediate Hypothesis 1a: This intervention will increase information on the
correct rates of pit filling amongst treated households: Is the behavioural intervention
successful at providing information of the correct rates of pit filling to household members
in eligible households?
29 Hypothesis 2c has been added recently and was not present in the original pre-analysis plan. Initially, we did not include this as our intervention does not directly target safe disposal of child faeces. Since then, we have revised our think and feel this might be an important hypothesis to as it could indicate habit formation. The sample size for this hypothesis would be restricted to households with children below the age of 5 which affects the power of the estimates obtained.

7
• IH1b: Intermediate Hypothesis 1b: The intervention will increase knowledge on the
correct rates of pit filling amongst treated households: Is the behavioural intervention
successful at correcting the faulty mental models on the rate of pit filling among household
members in eligible households?
• IH2: Intermediate Hypothesis 2: This intervention will reduce aversion to pit
emptying amongst treated households: Is the behavioural intervention successful at
reducing the aversion to self-pit emptying among household members in eligible
households?
• IH3: Intermediate Hypothesis 3: This intervention will reduce anxiety associated
with maintenance and repair of toilets amongst treated households: Is there reduced
anxiety associated with maintenance and repair of toilets amongst households that
receive the treatment?
• IH4: Intermediate Hypothesis 4: This intervention will increase habit of toilet use
amongst treated households through the mechanisms of a pledge and lockbox. Is
there increased habit of toilet use amongst members in the treated households due to the
use of a pledge and lockbox?
3. Identified outcomes and key indicators
Measurement of toilet use
We asked individual household members about their sanitation practices in the (i) ‘last occasion’,
(ii) ‘last three occasions’, and (iii) ‘usually’ as part of the household roster. Sanitation practices
were self-reported for household members who were present at the time of the survey and
reported by the primary female respondents for those household members who were not present
at the time of the survey. Our indicator for toilet use for the individual adult takes the value for
adults who reported open defecating in at least one of the three sanitation-use questions. At the
household-level, we consider the household to be an ‘openly defecating’ household if at least one
household member reports defecating in the open in any one of the three toilet-use questions.
Measurement of safe disposal of child faeces
Faeces are disposed safely if the child defecates in the latrine or the faeces are disposed by
putting/rinsing them in the latrine. Our indicator for safe disposal of child faeces takes the value
1 for those children whose faeces are disposed of safely, as reported by the primary female
respondent.
Perceptions on pit filling and pit decomposition
We asked our respondents to estimate how long it would take for hypothetical pits with dimensions
(i) 3 feet in diameter and 5 feet in depth (Pit 1 – Volume = 35 cubic feet) and (ii) 3 feet in diameter
and 10 feet in depth (Pit 2 – Volume = 71 cubic feet) to fill-up for a five-member household.
Hypothetical pit dimensions are based on the recommended pit sizes by the Government of India
for five daily users. We also asked respondents to estimate how long it would take for pit contents
to decompose completely to understand their prior knowledge around pit decomposition rates.
For comparison against the responses, we estimated the ‘correct’ time range in years for the
hypothetical pits based on daily per person accumulation rate and the volume of the pit.
Households were then categorised into groups depending on whether they correctly estimated,
underestimated, or overestimated pit filling and decomposition rates.

8
Table 1 lists the key final and intermediate outcome indicators used in this baseline report:
Table 1: Key final and intermediate outcome indicators
Outcome & Description Indicators Level Source
Toilet Use
(FINAL OUTCOME)
% of households where at
least one person defecates
in the open
Household
HABIT Baseline
Household Survey (March
2018) % of individuals who
defecate in the open Individual
Safe disposal of child
faeces
(FINAL OUTCOME)
% of children under the
age of five years whose
(last) stools are disposed of
safely.
Individual
HABIT Baseline
Household Survey (March
2018)
Information on pit filling
(INTERMEDIATE
OUTCOME)
% of respondents who
have received information
on pit filling prior to the
intervention
Household
HABIT Baseline
Household Survey (March
2018)
Knowledge on the correct
rates of pit filling
(INTERMEDIATE
OUTCOME)
% of respondents who can
correctly estimate the year
time it takes a hypothetical
pit used by a family of five
members to fill up (asked
for pits of 35 cubic feet
and 71 cubic feet in
volume)
Household
HABIT Baseline
Household Survey (March
2018)
Aversion to pit emptying
(INTERMEDIATE
OUTCOME)
% of households where the
household head correctly
estimates the time required
for faecal matter to
decompose
Household
HABIT Baseline
Household Survey (March
2018)
4. Research design
4.1. Evaluation design and timeline
4.1.1. Evaluation design
The purpose of impact evaluations is to determine whether a project has had the desired impact
on targeted participants and to assess whether those effects are attributable to the project.
Results from these evaluations are seen as ‘proof’ that a project works (or does not work) when
decisions are made regarding project scale-up or extension. Impact evaluations are ‘summative’
by design, i.e., they tell implementers, donors, and policymakers whether or not a project has had
impact after it has run its course. Therefore, the impact evaluation of project improving HABIT is
intended to generate evidence on whether such an implementation model would be successful in
reducing rates of open defecation among households that own a functional twin-pit latrine.
9
A rigorous analysis of impact requires a valid “counterfactual”. A counterfactual condition
describes what would have happened to the treatment group (i.e. the group that received the
intervention) in the absence of the programme. However, as we cannot observe post-intervention
outcomes in a world where the programme has not been implemented, it is necessary to construct
a ‘comparison group’. A comparison group constitutes a group that does not participate in the
programme but resembles the programme’s participants as closely as possible. When the
comparison group is well-constructed, it provides a good measure of the counterfactual. The
observed differences in outcomes across the treated group and this comparison group can,
therefore, be interpreted as the casual impact of the intervention.
We use Randomised Control Trial (RCT) as the study design to evaluate the impact of the
project-improving HABIT. The RCT is widely considered to be the most rigorous impact
evaluation design as it provides the most convincing estimate of the counterfactual. In the
presence of systematic differences between treatment and control groups, it would be
impossible to determine if the observed differences in key impact indicators across treatment
and control populations are due to the intervention or due to pre-existing systematic differences.
Random assignment of treatment minimises the risk of this selection bias, making treatment
and control groups balanced on both known and unknown characteristics at the start of the
evaluation. Any differences detected with statistical significance between treatment and control
groups at the end of the evaluation can therefore, be attributed to the intervention. We use this
approach to measure the impact of a combination of community-level and household-level
interventions planned under project improving HABIT on toilet use amongst a random sample of
eligible households in treatment areas.
The behaviour change intervention primarily attempts to improve toilet usage by providing
information aimed at correcting faulty mental models related to latrine use. Given the low barriers
to sharing information across households, there is a substantial risk of spillovers within a
geographical area. This could compromise the internal validity of our design. To minimise this risk
of spillover effects, we propose a clustered RCT design. In a clustered RCT, the cluster (the ward,
in our case) is referred to as the unit of randomisation because clusters or groups of individuals
as opposed to single individuals or households are randomly allocated to either the treatment or
the control group. Besides minimising the risk of contamination, targeting the intervention (and
the randomisation) at the ward level also offers the opportunity to capture the overall impact of
the package of intervention, including substantial positive externalities. For example, breaking up
groups that go to defecate in the open together, or seeing other treatment households use their
latrines more often may provide an extra push to other treated households to do the same.
Self-selection bias is a key aspect to be considered while designing any empirical strategy.
Although all households that own a functional twin-pit latrine are eligible to receive our intervention,
uptake of the intervention is voluntary30. It is quite likely that households that choose to participate
in the study will be more motivated, more enterprising, or in other ways intrinsically different from
non-participant households, and therefore, would have achieved higher outcomes regardless of
whether or not the intervention was implemented. Thus, if we simply compare outcomes for
participant households versus non-participant households, we may overestimate the causal
impact of the programme.
To circumvent this problem, our approach is to estimate the overall effect of introducing our
intervention in a cluster, regardless of the treatment status of individual households that are
sampled in the household survey. This constitutes the intent-to-treat (ITT) estimate. By using
30 For example, households may or may not attend community meetings, or allow the facilitator to complete the household-level intervention.
10
the treatment assignment variable instead of the actual beneficiary status as the key dependent
variable, the ITT estimate successfully overcomes the issue of self-selection bias. Within the ITT
framework, all indicators and corresponding impact estimates are, therefore, calculated for all
eligible households living in treatment areas, and not only for the subset of eligible households
who actually receive the household and community-level interventions. The precise regression
specification we employ to calculate the ITT estimate is described in Section 5.1.
We will infer Treatment on the treated (TOT) impact estimates by applying the take-up rate of the
treatment package on the ITT effect. Take-up rates (for both community and household-level
interventions) will be determined using programme monitoring data, and endline household
survey data31. Heterogeneous treatment effects will also be analysed.
4.1.2. Timeline
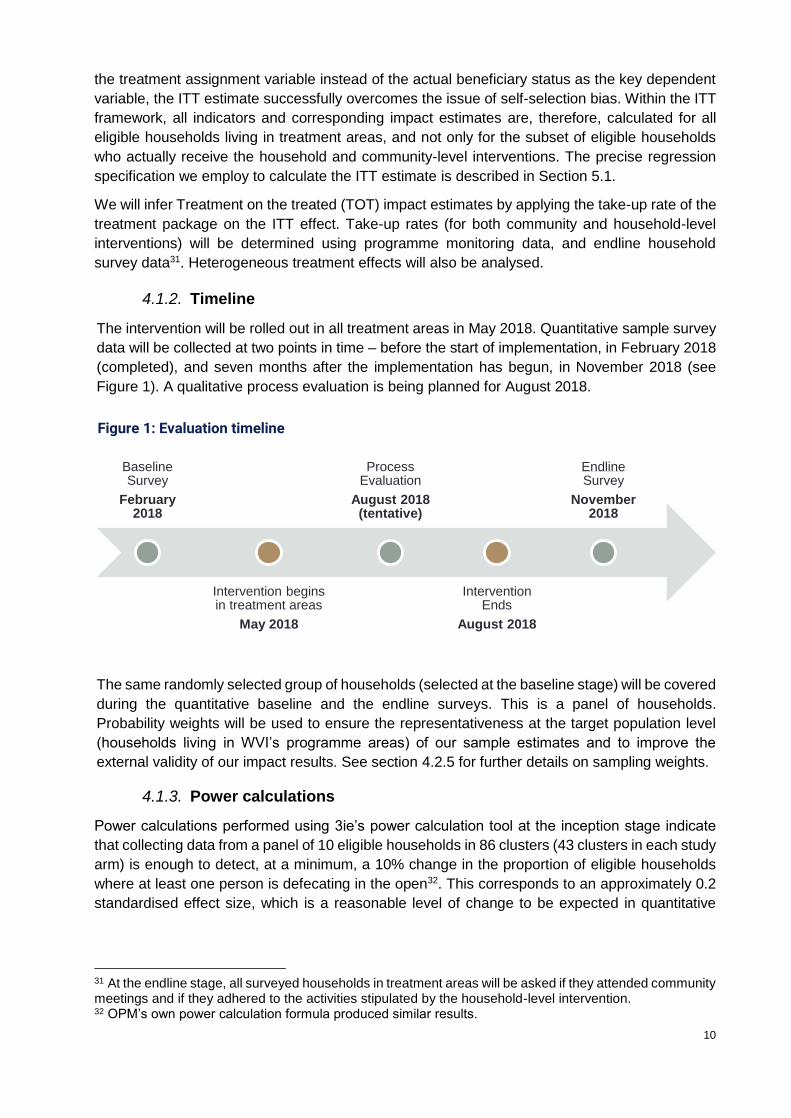
The intervention will be rolled out in all treatment areas in May 2018. Quantitative sample survey
data will be collected at two points in time – before the start of implementation, in February 2018
(completed), and seven months after the implementation has begun, in November 2018 (see
Figure 1). A qualitative process evaluation is being planned for August 2018.
The same randomly selected group of households (selected at the baseline stage) will be covered
during the quantitative baseline and the endline surveys. This is a panel of households.
Probability weights will be used to ensure the representativeness at the target population level
(households living in WVI’s programme areas) of our sample estimates and to improve the
external validity of our impact results. See section 4.2.5 for further details on sampling weights.
4.1.3. Power calculations
Power calculations performed using 3ie’s power calculation tool at the inception stage indicate
that collecting data from a panel of 10 eligible households in 86 clusters (43 clusters in each study
arm) is enough to detect, at a minimum, a 10% change in the proportion of eligible households
where at least one person is defecating in the open32. This corresponds to an approximately 0.2
standardised effect size, which is a reasonable level of change to be expected in quantitative
31 At the endline stage, all surveyed households in treatment areas will be asked if they attended community meetings and if they adhered to the activities stipulated by the household-level intervention. 32 OPM’s own power calculation formula produced similar results.
Baseline Survey
February 2018
Intervention begins in treatment areas
May 2018
Process Evaluation
August 2018 (tentative)
Intervention Ends
August 2018
EndlineSurvey
November 2018
Figure 1: Evaluation timeline

11
impact evaluations. Table 2 presents the values of relevant technical parameters used in
estimating power for the present survey,
Table 2: Power calculations
Parameter Value Sources/Assumptions
Baseline level of proportion of
eligible households where at least
one person is defecating in the open
0.41 SQUAT survey data for Bihar
Significance level (alpha) 0.05 Standard
Desired power of the test (beta) 0.8 Standard
Mean number of households in
each cluster 10 Practical considerations
Intra-cluster correlation coefficient 0.1 SQUAT survey data for Bihar
Inter-temporal correlation
coefficient 0.7
Lies within the standard range
assumed for a panel of households
Number of clusters in each arm 43
Calculated based on a priori power
calculation (using 3ie’s power
calculation tool)
MDE 0.1 Assumed target
In order to account for attrition, we aimed to cover 90 clusters (45 clusters in each treatment arm)
and 12 eligible households (instead of 10) in each survey cluster during the baseline survey. Our
target sample size was, therefore, 1080 households (90*12).
We expect the take-up rates to be high for the proposed intervention, especially since it will be delivered by locally stationed, long-term WVI staff. Given that the study design relies on panel data collection, sample attrition (because of migration, refusal etc.), could lead to biased results if certain types of households drop out more than others. Large-scale attrition may decrease the power of the evaluation design, making it harder to detect impact. However, the relatively short time-frame of the study gives us reason to believe that the present evaluation is unlikely to suffer from large sample attrition.
4.2. Sampling
A three-stage sampling procedure was employed to arrive at a representative sample of
households to be interviewed for the baseline survey:
1. Selecting villages: treatment and control villages were selected using simple random
sampling from the list of all villages where WVI has a presence. Treatment and control villages
were selected by setting a seed and generating random numbers following a uniform
distribution on Stata.
2. Selecting wards: treatment (and control) wards were selected using Probability Proportional
to Size (PPS) sampling from the list of all wards in the randomly selected treatment (and
control) villages. Amongst selected wards, small wards were combined with nearby (non-
selected) wards to ensure that each survey cluster had roughly 30 eligible households.
3. Selecting households: eligible households in the selected wards were identified through a
comprehensive household listing exercise, and a sample of 12 households (and a
replacement sample of 5 households) were selected using simple random sampling and

12
interviewed from each cluster. First, 12 households were selected using the random number
generator on Stata. These were dropped and another replacement sample of 5 households
were selected by specifying a seed and using the random number generator on Stata.
The subsections that follow describe each of these steps in greater detail.
4.2.1. Selecting villages
The eligible population for our study consists of households that have functional33 twin-pit latrines
within the areas within which our implementation partner (WVI) operates. Figure 2 describes the
six districts within which these areas are located – WVI covers one block in each of the six districts.
WVI operates in a subsample of villages and wards within these six blocks. Out of the 97 villages
where WVI is active, 92 villages have at least some households that are eligible to receive our
intervention. From the list of 92 villages, 49 treatment and 43 control villages are selected using
simple random sampling. Baseline and endline data will be collected from 43 treatment and 43
control villages. Qualitative data collected from six out of the 49 treatment villages will be used to
inform the process evaluation component of this study34. Quantitative survey data will not be
collected in these ‘process evaluation villages’ so as to not bias survey results at the endline stage.
Table 3 presents a summary of the number of villages selected in each study arm by district.
33 The criteria for a functional latrine are: 1) pan is not cracked/ broken; 2) pan is not blocked; 3) latrine has a completed pit (can be defined as a covered pit); and 4) link between pan and pit is not broken. 34 This is being planned for August 2018.
Figure 2: Programme districts and blocks
13
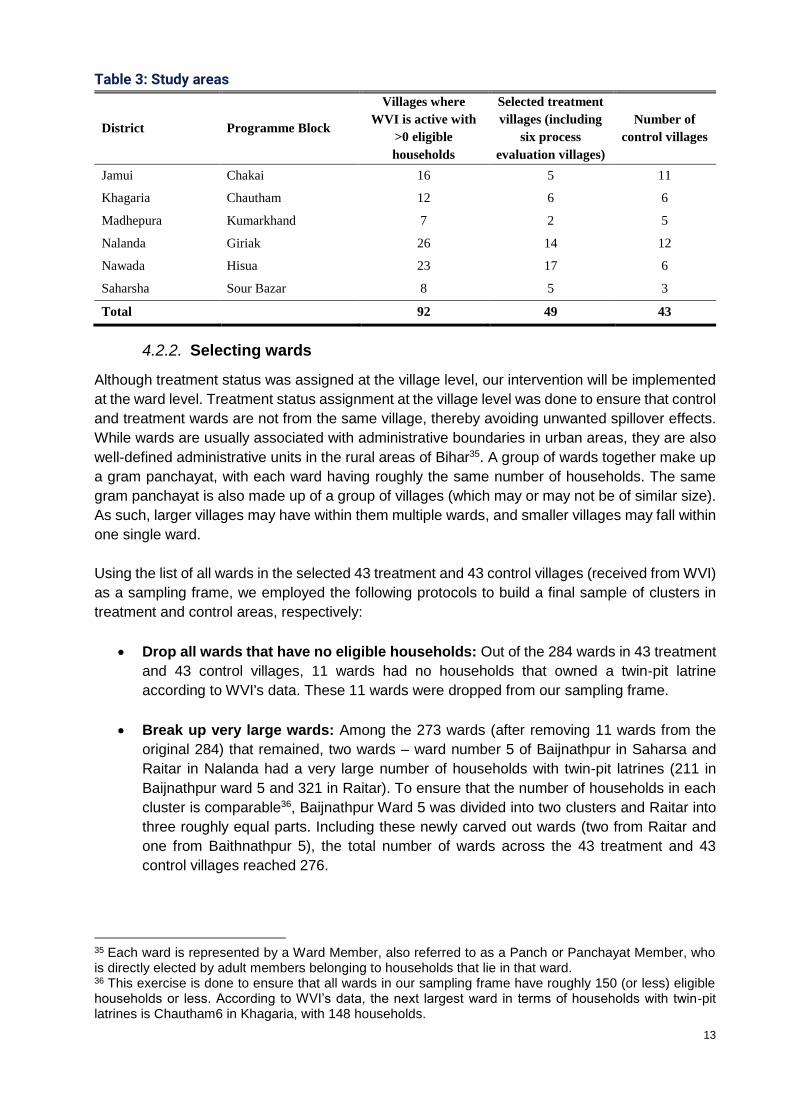
Table 3: Study areas
District Programme Block
Villages where
WVI is active with
>0 eligible
households
Selected treatment
villages (including
six process
evaluation villages)
Number of
control villages
Jamui Chakai 16 5 11
Khagaria Chautham 12 6 6
Madhepura Kumarkhand 7 2 5
Nalanda Giriak 26 14 12
Nawada Hisua 23 17 6
Saharsha Sour Bazar 8 5 3
Total 92 49 43
4.2.2. Selecting wards
Although treatment status was assigned at the village level, our intervention will be implemented
at the ward level. Treatment status assignment at the village level was done to ensure that control
and treatment wards are not from the same village, thereby avoiding unwanted spillover effects.
While wards are usually associated with administrative boundaries in urban areas, they are also
well-defined administrative units in the rural areas of Bihar35. A group of wards together make up
a gram panchayat, with each ward having roughly the same number of households. The same
gram panchayat is also made up of a group of villages (which may or may not be of similar size).
As such, larger villages may have within them multiple wards, and smaller villages may fall within
one single ward.
Using the list of all wards in the selected 43 treatment and 43 control villages (received from WVI)
as a sampling frame, we employed the following protocols to build a final sample of clusters in
treatment and control areas, respectively:
• Drop all wards that have no eligible households: Out of the 284 wards in 43 treatment
and 43 control villages, 11 wards had no households that owned a twin-pit latrine
according to WVI's data. These 11 wards were dropped from our sampling frame.
• Break up very large wards: Among the 273 wards (after removing 11 wards from the
original 284) that remained, two wards – ward number 5 of Baijnathpur in Saharsa and
Raitar in Nalanda had a very large number of households with twin-pit latrines (211 in
Baijnathpur ward 5 and 321 in Raitar). To ensure that the number of households in each
cluster is comparable36, Baijnathpur Ward 5 was divided into two clusters and Raitar into
three roughly equal parts. Including these newly carved out wards (two from Raitar and
one from Baithnathpur 5), the total number of wards across the 43 treatment and 43
control villages reached 276.
35 Each ward is represented by a Ward Member, also referred to as a Panch or Panchayat Member, who is directly elected by adult members belonging to households that lie in that ward. 36 This exercise is done to ensure that all wards in our sampling frame have roughly 150 (or less) eligible households or less. According to WVI’s data, the next largest ward in terms of households with twin-pit latrines is Chautham6 in Khagaria, with 148 households.
14
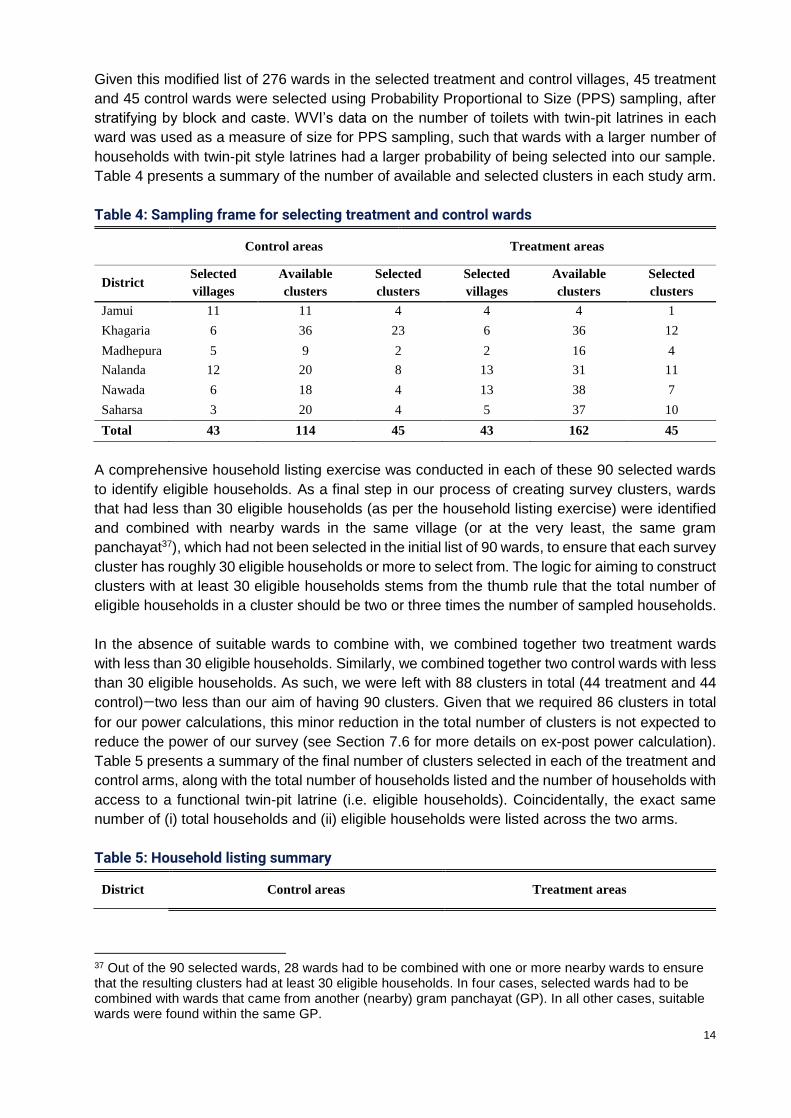
Given this modified list of 276 wards in the selected treatment and control villages, 45 treatment
and 45 control wards were selected using Probability Proportional to Size (PPS) sampling, after
stratifying by block and caste. WVI’s data on the number of toilets with twin-pit latrines in each
ward was used as a measure of size for PPS sampling, such that wards with a larger number of
households with twin-pit style latrines had a larger probability of being selected into our sample.
Table 4 presents a summary of the number of available and selected clusters in each study arm.
Table 4: Sampling frame for selecting treatment and control wards
Control areas Treatment areas
District Selected
villages
Available
clusters
Selected
clusters
Selected
villages
Available
clusters
Selected
clusters
Jamui 11 11 4 4 4 1
Khagaria 6 36 23 6 36 12
Madhepura 5 9 2 2 16 4
Nalanda 12 20 8 13 31 11
Nawada 6 18 4 13 38 7
Saharsa 3 20 4 5 37 10
Total 43 114 45 43 162 45
A comprehensive household listing exercise was conducted in each of these 90 selected wards
to identify eligible households. As a final step in our process of creating survey clusters, wards
that had less than 30 eligible households (as per the household listing exercise) were identified
and combined with nearby wards in the same village (or at the very least, the same gram
panchayat37), which had not been selected in the initial list of 90 wards, to ensure that each survey
cluster has roughly 30 eligible households or more to select from. The logic for aiming to construct
clusters with at least 30 eligible households stems from the thumb rule that the total number of
eligible households in a cluster should be two or three times the number of sampled households.
In the absence of suitable wards to combine with, we combined together two treatment wards
with less than 30 eligible households. Similarly, we combined together two control wards with less
than 30 eligible households. As such, we were left with 88 clusters in total (44 treatment and 44
control)—two less than our aim of having 90 clusters. Given that we required 86 clusters in total
for our power calculations, this minor reduction in the total number of clusters is not expected to
reduce the power of our survey (see Section 7.6 for more details on ex-post power calculation).
Table 5 presents a summary of the final number of clusters selected in each of the treatment and
control arms, along with the total number of households listed and the number of households with
access to a functional twin-pit latrine (i.e. eligible households). Coincidentally, the exact same
number of (i) total households and (ii) eligible households were listed across the two arms.
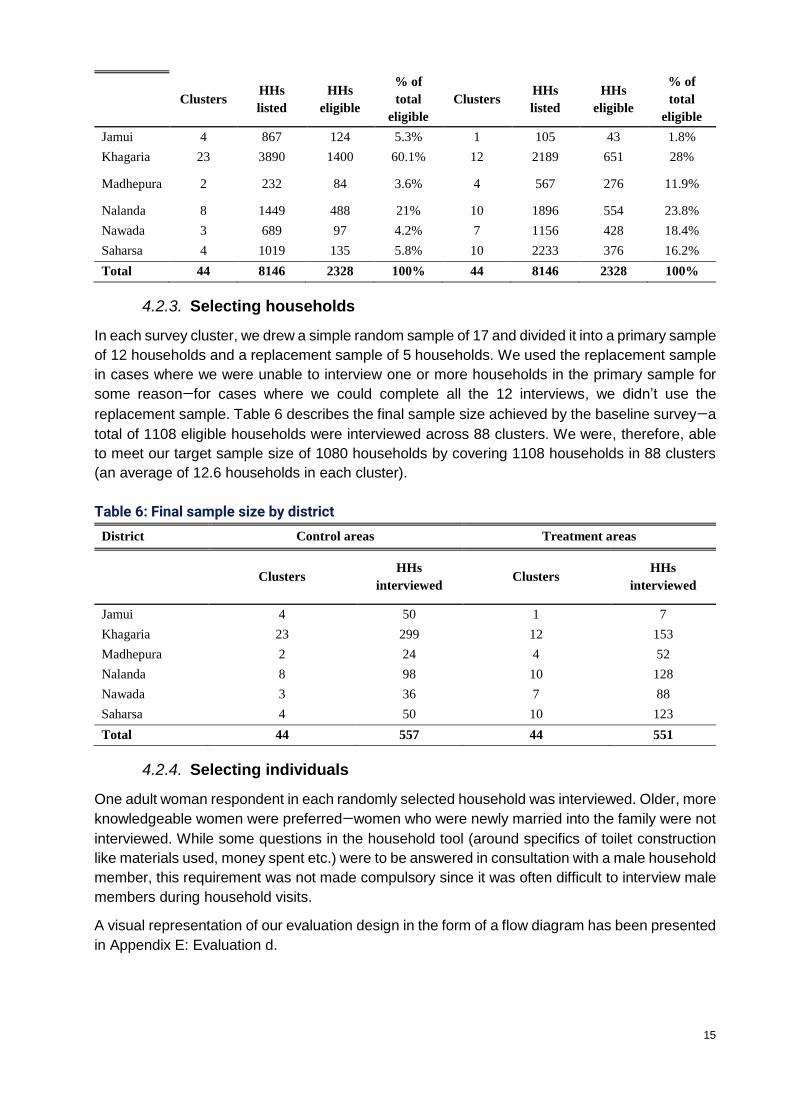
Table 5: Household listing summary
District Control areas Treatment areas
37 Out of the 90 selected wards, 28 wards had to be combined with one or more nearby wards to ensure that the resulting clusters had at least 30 eligible households. In four cases, selected wards had to be combined with wards that came from another (nearby) gram panchayat (GP). In all other cases, suitable wards were found within the same GP.
15
Clusters HHs
listed
HHs
eligible
% of
total
eligible
Clusters HHs
listed
HHs
eligible
% of
total
eligible
Jamui 4 867 124 5.3% 1 105 43 1.8%
Khagaria 23 3890 1400 60.1% 12 2189 651 28%
Madhepura 2 232 84 3.6% 4 567 276 11.9%
Nalanda 8 1449 488 21% 10 1896 554 23.8%
Nawada 3 689 97 4.2% 7 1156 428 18.4%
Saharsa 4 1019 135 5.8% 10 2233 376 16.2%
Total 44 8146 2328 100% 44 8146 2328 100%
4.2.3. Selecting households
In each survey cluster, we drew a simple random sample of 17 and divided it into a primary sample
of 12 households and a replacement sample of 5 households. We used the replacement sample
in cases where we were unable to interview one or more households in the primary sample for
some reason—for cases where we could complete all the 12 interviews, we didn’t use the
replacement sample. Table 6 describes the final sample size achieved by the baseline survey—a
total of 1108 eligible households were interviewed across 88 clusters. We were, therefore, able
to meet our target sample size of 1080 households by covering 1108 households in 88 clusters
(an average of 12.6 households in each cluster).
Table 6: Final sample size by district
District Control areas Treatment areas
Clusters HHs
interviewed Clusters
HHs
interviewed
Jamui 4 50 1 7
Khagaria 23 299 12 153
Madhepura 2 24 4 52
Nalanda 8 98 10 128
Nawada 3 36 7 88
Saharsa 4 50 10 123
Total 44 557 44 551
4.2.4. Selecting individuals
One adult woman respondent in each randomly selected household was interviewed. Older, more
knowledgeable women were preferred—women who were newly married into the family were not
interviewed. While some questions in the household tool (around specifics of toilet construction
like materials used, money spent etc.) were to be answered in consultation with a male household
member, this requirement was not made compulsory since it was often difficult to interview male
members during household visits.
A visual representation of our evaluation design in the form of a flow diagram has been presented
in Appendix E: Evaluation d.
16
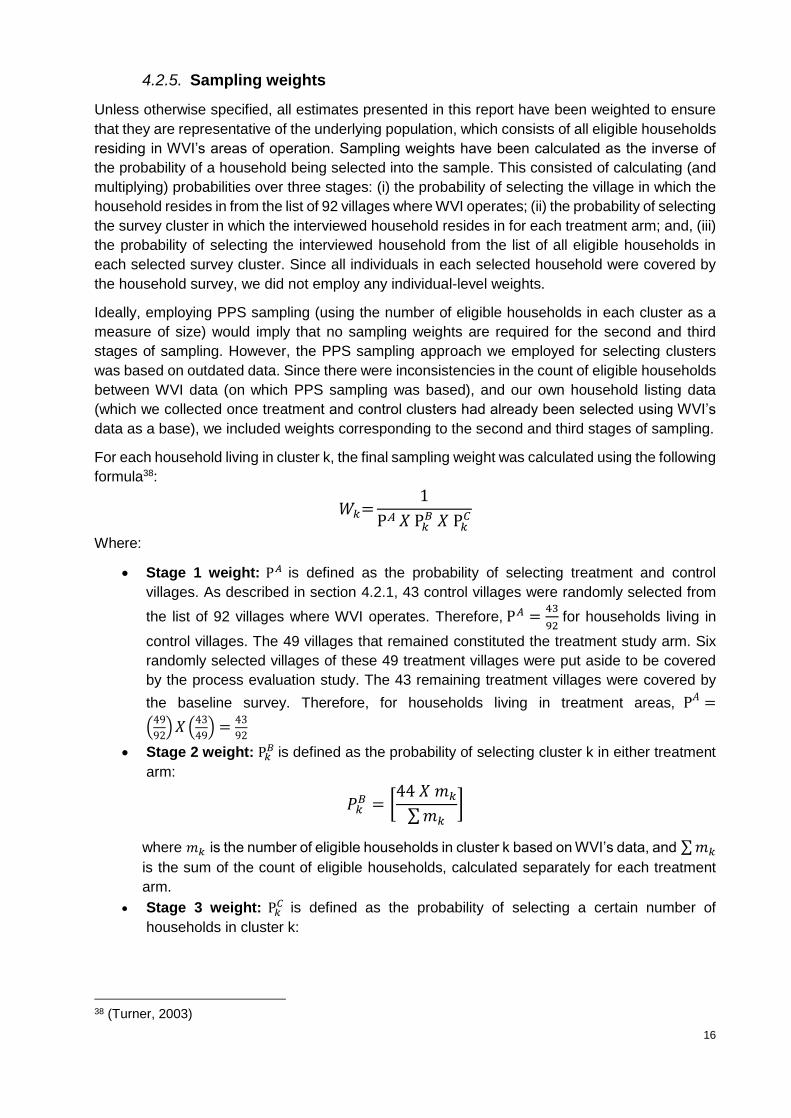
4.2.5. Sampling weights
Unless otherwise specified, all estimates presented in this report have been weighted to ensure
that they are representative of the underlying population, which consists of all eligible households
residing in WVI’s areas of operation. Sampling weights have been calculated as the inverse of
the probability of a household being selected into the sample. This consisted of calculating (and
multiplying) probabilities over three stages: (i) the probability of selecting the village in which the
household resides in from the list of 92 villages where WVI operates; (ii) the probability of selecting
the survey cluster in which the interviewed household resides in for each treatment arm; and, (iii)
the probability of selecting the interviewed household from the list of all eligible households in
each selected survey cluster. Since all individuals in each selected household were covered by
the household survey, we did not employ any individual-level weights.
Ideally, employing PPS sampling (using the number of eligible households in each cluster as a
measure of size) would imply that no sampling weights are required for the second and third
stages of sampling. However, the PPS sampling approach we employed for selecting clusters
was based on outdated data. Since there were inconsistencies in the count of eligible households
between WVI data (on which PPS sampling was based), and our own household listing data
(which we collected once treatment and control clusters had already been selected using WVI’s
data as a base), we included weights corresponding to the second and third stages of sampling.
For each household living in cluster k, the final sampling weight was calculated using the following
formula38:
𝑊𝑘=1
PA 𝑋 P𝑘𝐵 𝑋 P𝑘
𝐶
Where:
• Stage 1 weight: P𝐴 is defined as the probability of selecting treatment and control
villages. As described in section 4.2.1, 43 control villages were randomly selected from
the list of 92 villages where WVI operates. Therefore, P𝐴 =43
92 for households living in
control villages. The 49 villages that remained constituted the treatment study arm. Six
randomly selected villages of these 49 treatment villages were put aside to be covered
by the process evaluation study. The 43 remaining treatment villages were covered by
the baseline survey. Therefore, for households living in treatment areas, P𝐴 =
(49
92) 𝑋 (
43
49) =
43
92
• Stage 2 weight: P𝑘𝐵 is defined as the probability of selecting cluster k in either treatment
arm:
𝑃𝑘𝐵 = [
44 𝑋 𝑚𝑘
∑ 𝑚𝑘
]
where 𝑚𝑘 is the number of eligible households in cluster k based on WVI’s data, and ∑ 𝑚𝑘
is the sum of the count of eligible households, calculated separately for each treatment
arm.
• Stage 3 weight: P𝑘𝐶 is defined as the probability of selecting a certain number of
households in cluster k:
38 (Turner, 2003)

17
𝑃𝑘𝐶 = [
ℎ𝑘
𝑚𝑘′ ]
where 𝑚𝑘′ is the number of eligible households in cluster k based on our household listing
exercise, and ℎ𝑘 is the number of eligible households that were finally interviewed in
cluster k (after being randomly sampled from 𝑚𝑘′ ).
The final cluster-level weight 𝑊𝑘 has been normalised39 to ensure that the total number of
observations for weighted and unweights estimates are the same.
4.3. Data collection
4.3.1. Quantitative survey
Data collection protocol
The data collection exercise was done using Computer Assisted Personal Interviewing (CAPI) on
Tablets. The survey was designed on World Bank’s survey designer software, named Survey
Solutions40. The data collection was conducted to the highest ethical standards, to maintain
confidentiality of the respondents and ensure that they were well-informed, and that their
participation in the survey was voluntary. The respondents were treated with sensitivity and care
and are assured of anonymity at all times.
Quantitative instruments, key objectives, and respondents
As specified in our pre-analysis plan, for the quantitative data collection, we used two instruments,
one at the household level and the other at the community level. The household instrument
captured both household-level and individual-level data in accordance with the indicators. The
community instrument, on the other hand, captured data on community characteristics.
A. Household instrument
The key objectives of the household survey tool were to capture the key indicators related to
knowledge, attitude (perceptions and intentions), and practices (habits and toilet-use patterns)
around toilet use; and to gain general information about their demographics; water availability,
and toilet attributes for all sampled households. Measuring toilet use at the individual level is
especially important given that one of the key aims of the study is to measure the intervention’s
impact on latrine use separately for men and women within the household. We subdivided the
household survey instrument into eight modules, listed below, for a more comprehensive
classification of data:
1. Household roster: to capture general information about the members of the household;
age, marital status, educational qualification, gender composition, employment status etc.
2. Health and disability roster: to capture data on the health/disability status of each
household member to know if they may/may not have issue using the toilet for
health/disability reasons
3. Toilet use: to capture the toilet usage patterns and open defecation behaviours of each
household member
39 Normalisation was done by dividing 𝑊𝑘 by the mean value of 𝑊𝑘. This was done for each treatment arm separately. 40 http://support.mysurvey.solutions/
18
4. Household demographics: to know the socio-economic status of the household
including caste, religion, income status etc.
5. Water availability, access, and usage: to know about water accessibility and sufficiency,
and distance of the water sources to fetch water for domestic purposes
6. Toilet attributes: to capture the dynamics around toilet construction; the cost,
inputs/materials, government/NGO incentives (if any), maintenance/beautification costs
etc.
7. Knowledge and perceptions: to capture household’s intent to use, and perceptions
about toilet usage, pit filling, and emptying
8. Observation checklist: to capture the surveyors’ observations of the toilet in the
household to verify usage, instead of solely relying on self-reporting
Key respondents: Our primary respondents at the household level were the primary
caregivers of the household, and for a few sections of the module, we also interviewed the
household heads (presumably, predominantly male). For the toilet use roster, we interviewed the
respective household members, and in their absence, the primary caregiver. We interviewed
primary caregivers on sanitation practices and behaviour of other household members, water
availability and use, and other demographic information on the household roster. Whereas we
interviewed the household heads on subjects, such as toilet infrastructure, prior investments in
the toilet, subsidies, incentives received from the government or non-government sources, their
own sanitation behaviour, and knowledge and perceptions on pit filling and pit emptying.
B. Community instrument
The key objective of collecting community data was to identify and control for variables which
were distinct among the control and treatment groups. The community instrument was divided
into five modules:
1. Community characteristics: socio-economic characteristics of the village; caste,
religion, source of livelihood etc.
2. Access to services: to capture the community member’s access to basic services in the
vicinity like school, health centers, grocery shops, banks etc.
3. ODF status: to know if the village had already been declared ODF by the government or
was aspiring to be ODF.
4. Intervention history: to know if there had ever been a sanitation intervention in the
village and if yes, what was its impact on the village sanitation practices as a whole
5. Supply side considerations: to know the availability of toilet material suppliers in the
village
Key respondents: These community surveys were administered in common public places in
each village included in our sample. The respondents included the head of the gram panchayat
and other prominent community members like ward members, school teachers, Aanganwadi
workers etc., who could provide valid information about the village and community
characteristics.
4.3.2. Measures taken to ensure the validity and reliability of each tool used
We have constructed each instrument (household and community) developed for the baseline by
referring to modules from similar water and sanitation hygiene (WASH) and health-based studies,
with the WASH component including both in-house RCT-based WASH projects, as well as other
national-level surveys including Demographic Health Survey (DHS), National Family Health
Survey (NFHS), District-Level Health Survey (DLHS), National Sample Survey (NSSO), SQUAT
19
survey etc. Apart from these, for the main toilet-use questions, we adhered to the 3ie
recommended r.i.c.e. module for ensuring consistency of the toilet use indicators across studies.
The final survey instrument developed by the technical staff was thoroughly reviewed by our
WASH specialists, partner organisations, and field survey experts to ensure that all relevant
indicators for the study are captured.
The tools were further strengthened during the three days of pre-testing in the field. The pre-
testing was conducted in rural Bihar, in the households with similar characteristics as the pre-
requisite of the sampled households (i.e. functional twin pit latrines). The pre-testing helped us
identify the loopholes and inconsistencies in the instruments (refer to Section 10 for details).
Accordingly, we revised the questions and restructured the modules to obtain unbiased and
consistent responses from the respondents.
4.4. Implementation
4.4.1. Survey team
Data collection for baseline was conducted in two phases: (i) listing and (ii) main survey
(Household and Community). We formed two separate groups of survey teams, one for
household and the other for community. Almost all the field staff recruited for the data collection
held at least a bachelor’s degree and had to their credit 4-5 years’ experience in conducting similar
kinds of surveys.
For listing: The survey team consisted of 16 teams each functioning under a male head and
comprising two male enumerators.
For main survey: A total of eight survey teams participated in the main survey, each comprising
of one male supervisor and three female enumerators. The household surveys were conducted
by the female enumerators since the main respondent for the household survey was the primary
caregiver. The community surveys were conducted by the supervisors themselves. The overall
team support and coordination was undertaken by a male survey coordinator.
4.4.2. Training sessions with survey teams
The training sessions of the survey team for the main survey took place in mid-February, and
were spread over six days, including two days for in-house mock interview sessions and on-field
practice. The training was led by an OPM India’s Survey Training and Quality Assurance specialist,
along with oversight by the technical staff (those involved in tool development) and a Data
Management expert. During the training sessions, the field staff were briefed on research ethics
and sensitised to the best practices for asking questions such that no latent bias found its way in
their interactions and interpretations. The six-days training was structured to ensure that the field
staff:
• had thorough understanding of the survey instruments;
• were comfortable with the survey tablets they had to use for data collection;
• had enough time to clear their doubts related to the survey and the tools; and
• had access to full-time supervision during the mock interview sessions and field practices.
Refresher training: There was a 10-days gap between the treatment and control group data
collection due to Holi festival holidays that fell during this period. Therefore, we conducted a
refresher training session for the field staff in Patna before they started with the control group data
collection process.
20
4.4.3. Quality control mechanisms in the field
• The supervisors of each team were responsible for providing first-level monitoring
oversight and assistance. They were in direct contact with the survey coordinator and
also provided active support to field enumerators in locating the sampled households
and ensuring that interviews were conducted with appropriate/target respondents.
• A survey coordinator oversaw all the eight teams and provided them an additional
layer of assistance for quality assurance.
• The Data Manager checked all data entries at the end of each survey day, aided by the
in-built consistency checks written into the data capture software.
• Based on our set protocols for data cleaning and management, our dedicated team of
data analysts based in OPM Delhi office checked raw data from the field on a regular
basis (logic checks, field investigator checks, etc.). In order to conduct data verification
alongside the survey, we used pre-written programmes in STATA.
• Back-end server was used to transfer data to the data processing team so that it could
verify data for inconsistent, impossible, or unlikely data points.
• Time was allocated for re-visiting interviewees to address queries related to the data.
• Daily debriefs with the team enabled consistency in the data collected each day.
5. Data analysis
5.1. Techniques for qualitative data analysis
The qualitative data collection for the impact evaluation will take place only at the endline and will
be guided by the findings from the quantitative baseline, quantitative endline, and the process
evaluation. Thus, the research approach will adopt a sequential explanatory design, which means
that collection and analysis of quantitative data will be followed by collection and analysis of
qualitative data. The main purpose will be to use qualitative results to explain and interpret the
findings of the quantitative study. Methods to be used for qualitative analysis will be determined
closer to the time of qualitative data collection. However, it is important to note that considerations
related to the qualitative analysis have already been taken into account while developing the
theory of change and the Evaluation Matrix. A sequential design does not mean that the
triangulation and cross-fertilization of quantitative and qualitative approaches are limited to
analysis. Below is an indicative list of issues that the qualitative study will attempt to explore:
• Toilet attributes: what does the toilet contain? How do toilet attributes affect people’s
use/perception of toilet use? What else would the respondents like as part of the toilet?
What is missing from the toilet that prevents them from using it?
• Test perceptions related to toilet use: specifically, perceptions that latrine is for women's
safety and honour, and it should be used in emergency only. Both these perceptions
emerged strongly in the formative study.
• Knowledge of correct rates of pit filling.
• Attitude to pit emptying: especially its caste purity implications; also, explore the
prevalence of pit-emptying practices in the area.
• Changes in habit formation related to toilet use, if any; and
• Any difference related to gender/caste/age in answers to the issues listed above.

21
This list is merely indicative and not exhaustive as the qualitative study will not take place until
the endline, and will be guided in large part by the initial field assessments and findings of the
quantitative study.
5.2. Techniques for quantitative data analysis
As mentioned in Section 4.1.1, we will be estimating the ITT effects at endline to calculate the
causal impact of the programme. We will also be estimating the impact of the intervention both at
the household and individual level. However, in this study, we highlight the household-level
specifications as listed below:
We will be estimating the following regression equation via Ordinary Least Squares (OLS):
𝑌ℎ𝑐 = 𝛼 + 𝛽𝑇𝑟𝑒𝑎𝑡ℎ𝑐 + 𝛿𝑋′ℎ𝑐 + 𝑢𝑐 + 𝑒ℎ𝑐
Where:
• 𝑌ℎ𝑐 is the outcome of interest for household h in cluster c;
• 𝑇𝑟𝑒𝑎𝑡𝑐 is a dummy variable taking value 1 for the treatment cluster and 0 for the control
group;
• 𝛽 is the coefficient of the treatment dummy and our coefficient of interest;
• 𝑋′ℎ𝑐 refer to vector of cluster and household-level characteristics;
• 𝑢𝑐 is the cluster-fixed effect; and
• 𝑒ℎ𝑐 are cluster-robust standard errors.
Additionally, we will be using the baseline and endline data to build a panel of households and
individuals. This will provide us the added advantage of being able to control for time-invariant
characteristics and estimate a Difference-in-Differences (DID) regression to measure the
impact of the programme. We will, therefore, run the following regression specification:
𝑌ℎ𝑐𝑡 = 𝛽0 + 𝛽1𝑇𝑟𝑒𝑎𝑡𝑐 + 𝛽2𝑃𝑜𝑠𝑡𝑡 + 𝛽3(𝑃𝑜𝑠𝑡𝑡 ∗ 𝑇𝑟𝑒𝑎𝑡𝑐) + 𝛿1𝑋′ℎ
+ 𝑒ℎ𝑐𝑡
Where:
• 𝑌ℎ𝑐𝑡 is the outcome of interest for household h in cluster c at time t;
• 𝑃𝑜𝑠𝑡𝑡 takes the value 1 for endline and captures changes in the outcome variable in the
absence of the intervention; and
• 𝑃𝑜𝑠𝑡𝑡 ∗ 𝑇𝑟𝑒𝑎𝑡𝑐 takes the value 1 for the treatment cluster at endline, and 𝛽3 measures the
impact of the programme.
The DID estimator gives us the difference in average outcome in the treatment group before and
after the treatment minus the difference in average outcome in the control group before and after
the treatment. This approach is better than using OLS estimation because it allows us to control
for differences between control and treatment households that are time-invariant and cannot be
observed.
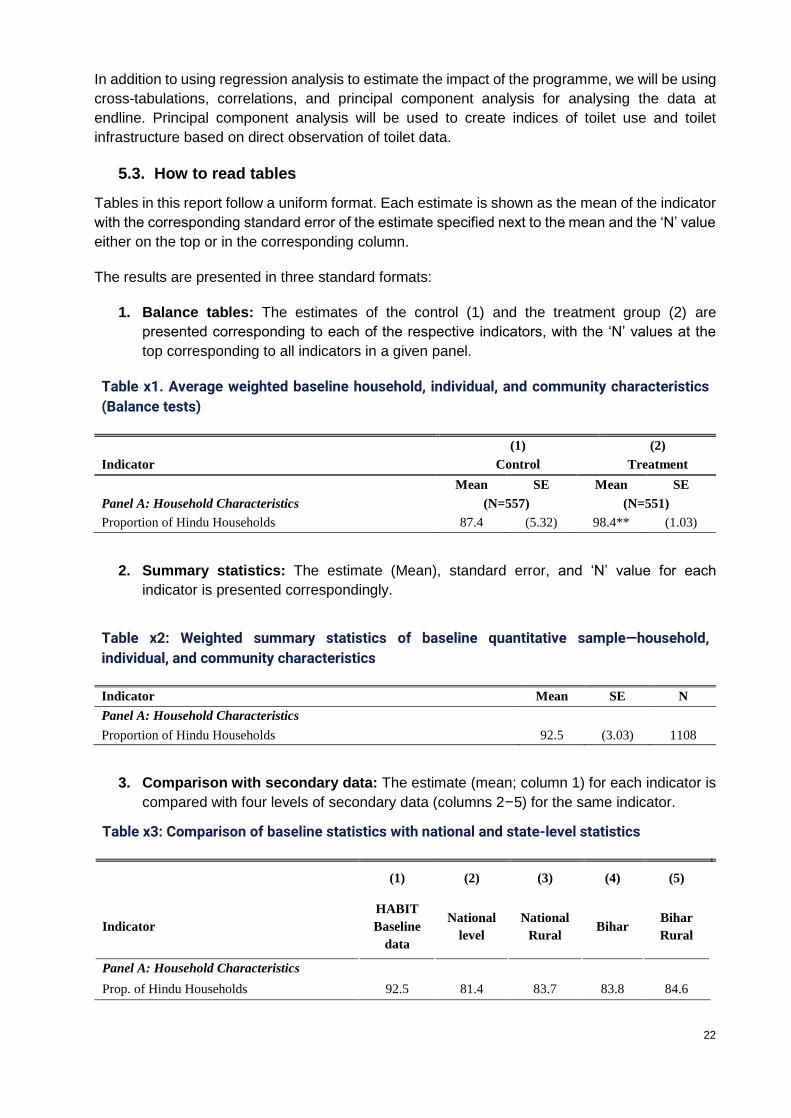
22
In addition to using regression analysis to estimate the impact of the programme, we will be using
cross-tabulations, correlations, and principal component analysis for analysing the data at
endline. Principal component analysis will be used to create indices of toilet use and toilet
infrastructure based on direct observation of toilet data.
5.3. How to read tables
Tables in this report follow a uniform format. Each estimate is shown as the mean of the indicator
with the corresponding standard error of the estimate specified next to the mean and the ‘N’ value
either on the top or in the corresponding column.
The results are presented in three standard formats:
1. Balance tables: The estimates of the control (1) and the treatment group (2) are
presented corresponding to each of the respective indicators, with the ‘N’ values at the
top corresponding to all indicators in a given panel.
Table x1. Average weighted baseline household, individual, and community characteristics
(Balance tests)
(1) (2)
Indicator Control Treatment
Mean SE Mean SE
Panel A: Household Characteristics (N=557) (N=551)
Proportion of Hindu Households 87.4 (5.32) 98.4** (1.03)
2. Summary statistics: The estimate (Mean), standard error, and ‘N’ value for each
indicator is presented correspondingly.
Table x2: Weighted summary statistics of baseline quantitative sample—household,
individual, and community characteristics
Indicator Mean SE N
Panel A: Household Characteristics
Proportion of Hindu Households 92.5 (3.03) 1108
3. Comparison with secondary data: The estimate (mean; column 1) for each indicator is
compared with four levels of secondary data (columns 2–5) for the same indicator.
Table x3: Comparison of baseline statistics with national and state-level statistics
(1) (2) (3) (4) (5)
Indicator
HABIT
Baseline
data
National
level
National
Rural Bihar
Bihar
Rural
Panel A: Household Characteristics
Prop. of Hindu Households 92.5 81.4 83.7 83.8 84.6
23
6. Registration of pre-analysis plan
http://ridie.3ieimpact.org/index.php?r=search/detailView&id=624
7. Internal validity of the evaluation design
7.1. Balance across treatment and control study arms
We present the results of conducting balance tests in Table 7 and Table 8. Here, both weighted
and unweighted baseline pre-treatment characteristics at the household, individual, and
community level are presented to test the balance of the randomisation experiment. Weighted
estimates are provided to ensure that the sample is representative of the target population, i.e.,
households residing in WVIs areas of operation. Sampling weights have been calculated as the
inverse of the probability of a household being selected into the sample. The calculation of
sampling weights is discussed in detail in Section 4.2.5.
We have separated sample characteristics into four groups depending on whether they are
household, individual adult, individual child, or community characteristics. In Table 7 and Table 8,
the top panel (Panel A) shows balance on household characteristics, Panels B and C show
balance on individual adult and individual child characteristics, respectively, while the bottom
panel (Panel D) compares control and treatment wards. We have imputed for missing values in
the variables for which balance tests were carried out41.
We ran balance tests on 86 variables and found that the treatment and control groups were
balanced on 74 characteristics and not balanced on 12 characteristics for both the weighted
(Table 7) and unweighted estimates (Table 8). We utilised t-tests comparing the means of
treatment and control groups. Table 7 and Table 8 only display a subset of the variables for which
we ran balance tests.
Overall, the experiment seems well-balanced on outcome variables in our study. There were no
significant differences between our treatment and comparison households and individuals in
terms of outcome variables related to open defecation and safe disposal of faeces. In Table 7,
we find that households are well-balanced in terms of the proportion of households where at least
one person defecates in the open. Similarly, individual adults and children in treatment and control
arms are well-balanced in terms of the proportion of adults42 who defecate in the open and the
proportion of children for whom faeces is safely disposed43.
In Panel A of Table 7, we find some imbalance in terms of higher percentage of Hindu households
and lower percentage of female-headed households in the treatment arm. We find that while the
treatment arm had 98.4% of Hindu households, the control arm had only 87.4% of Hindu
households. On the other hand, in the treatment arm, female-headed households comprised 13.2%
of all households, while female-headed control households equalled 22.4%. Treatment
households are also larger in terms of the household size and the number of children in the
household. We find that individual adult characteristics in Panel B are well-balanced with no
41 Missing observations were imputed with the mean value of the variable at the ward level. For instance, we found that caste was missing in five observations in our sample. We used the mean proportion of households belonging to each caste to impute for caste in this case. 42 We asked individual household members about their sanitation practices in the ‘last occasion’, the ‘last three occasions’, and ‘usually’. Our indicator for toilet use takes the value one for household members who reported open defecating in at least one of three sanitation-use questions. 43 Faeces are disposed safely if the child defecated in the latrine or the faeces were disposed of by putting/rinsing them in the latrine.

24
significant differences between treatment and comparison group means. On the other hand, in
Panel C, we find that children in treatment areas are significantly less likely to suffer from
diarrhoea. We find that 20.5% of children in treatment areas suffered from diarrhoea in the last
two weeks as opposed to a much higher 37.9% of children in control areas who suffered from
diarrhoea. In terms of the community characteristics presented in Panel D, we find that a higher
percentage of treatment communities have had a WASH-triggering activity in the past. The
estimates presented show that 75.9% of treatment wards and 46.7% of control wards have had
WASH activities in the past. We also find that treatment wards have a much lower proportion of
communities with access to a Primary Health Centre within 5 kms.
We also carried out F-tests of joint orthogonality that test whether groups of variables in the
Panels A, B, C, and D are jointly unrelated to the treatment status. This entailed running the
following specification:
𝑇𝑟𝑒𝑎𝑡𝑚𝑒𝑛𝑡 = 𝛽0 + 𝛽1 𝑋1 + 𝛽2 𝑋2 + 𝛽3𝑋3 + 𝛽4 𝑋4 . . +𝛽𝑛 𝑋𝑛 + 휀
Where, 𝑇𝑟𝑒𝑎𝑡𝑚𝑒𝑛𝑡 is the treatment status and 𝑋1 𝑡𝑜 𝑋𝑛 are the variables in each of the panels
below.
For each of the panels, we find that we can reject the null hypothesis of joint orthogonality or:
𝛽1 = 𝛽2 = ⋯ 𝛽𝑛 = 0
This means that when taken together, groups of variables in each of the four panels can explain
the treatment status. More simply, this means that the variables 𝑋1 𝑡𝑜 𝑋𝑛 are related to the
treatment status and there is an imbalance between treatment and control groups.
Imbalance in the randomisation means that a simple comparison of outcomes between the
treatment and control groups at endline will not provide an unbiased measure of the impact. We
will be including baseline covariates that show an imbalance and will not be affected by the
intervention as controls in the model specification, which will be used to assess the impact at
endline.
The indicators presented in Tables 7 and 8 pertain to only eligible households with functional twin
pit latrines. We also ran balance tests for variables that capture toilet attributes for all the
households listed in the treatment and control wards. We have presented these in Appendix F.
We find that the proportion of households with access to their own latrines, proportion of eligible
households among all households listed, proportion of households with twin pit latrines are
significantly different across treatment and control wards.
Table 7: Average weighted baseline household, individual, and community characteristics
(Balance tests)
(1) (2)
Indicator Control Treatment
Mean SE Mean SE
Panel A: Household Characteristics (N=557) (N=551)
Proportion of Hindu Households 87.4 (5.32) 98.4** (1.03)
Proportion of Muslim Households 12.1 (5.32) 1.4* (1.02)
Proportion of Scheduled Caste Households 20.4 (6.39) 23.6 (5.71)
Proportion of Scheduled Tribe Households 3 (1.49) 1.5 (0.78)
Proportion of Other Backward Caste Households 71.4 (6.08) 67.4 (6.84)
Proportion of Households with a BPL Ration Card 46.4 (4.76) 45.0 (3.47)

25
Proportion of Households with a NREGA Card 23.4 (3.87) 27.6 (6.65)
Proportion of Households with Access to Piped Water 5.8 (1.64) 3.0 (1.25)
Proportion of Households whose Latrine is Inside 24.4 (3.15) 28.6 (3.29)
Proportion of Female-Headed Households 22.4 (2.96) 13.2** (2.83)
Average Household Size 5.5 (0.14) 5.9* (0.15)
Average Number of Children Aged 5 or Below 0.7 (0.07) 0.9* (0.08)
Average Number of Young Aged 6 to 17 1.8 (0.09) 1.8 (0.09)
Average Number of Adults Aged 18 to 59 2.5 (0.10) 2.7 (0.09)
Average Number of Elderly Aged 60 or More 0.4 (0.03) 0.5 (0.05)
Prop of Households where At Least One Person Practices OD 53.8 (4.27) 51.0 (5.53)
Prop of households spent their own money for latrine
construction
62.5 (8.54) 69.6 (5.78)
Average amount of money spent for latrine construction 15433.2 (1306.91) 14327.5 (1404.12)
Prop of households recd. money for latrine from govt. 41.7 (4.35) 38.7 (7.45)
Panel B: Individual Adult Characteristics (N=2589) (N=2688)
Age in Years 28.2 (0.46) 28.7 (0.52)
Average no. of years of education of adults 4.7 (0.21) 4.7 (0.21)
Proportion of adult males 48.6 (1.33) 50.0 (0.66)
Proportion of disabled persons 2.3 (0.32) 1.7 (0.35)
Proportion of adults who were sick in the last 30 days 31.8 (2.49) 28.6 (1.58)
Proportion of adults who had diarrhoea in the last 2 weeks 15.7 (1.86) 13.6 (2.55)
Proportion of adults who practice OD 37.9 (4.77) 29.3 (5.88)
Panel C: Individual Child Characteristics (N=434) (N=456)
Age in Years 2.7 (0.09) 2.6 (0.11)
Proportion of male children 51.2 (3.89) 48.9 (1.61)
Proportion of children that were sick in the last 30 days 46.9 (3.46) 39.6 (2.79)
Proportion of children that had diarrhoea in the last two
weeks 37.9 (4.29) 20.5*** (2.74)
Proportion of children for whom faeces is safely disposed 31.9 (4.52) 39.6 (6.94)
Panel D: Community Characteristics (N=30) (N=29)
Proportion of villages certified ODF 66.7 (14.21) 62.5 (12.50)
Proportion of villages with WASH activities held in past 46.7 (9.26) 75.9** (8.09)
Proportion of villages where distance of primary school is
within five kms 100 (0) 100.0 (0)
Proportion of villages where distance of health subcentre is
within five kms 70 (8.51) 72.4 (8.45)
Proportion of villages where distance of PHC is within five
kms 60 (9.10) 31.0** (8.74)
Proportion of villages where mason constructed toilets in past 100 (0) 96.6 (3.45)
Source: HABIT Baseline Survey (March 2018).
Notes: * p<0.1, ** p<0.05,*** p<0.01.
p-values obtained by clustering at ward level. Standardised baseline weights utilised.
Table 8: Average unweighted baseline household, individual and community characteristics
(Balance tests)
(1) (2)
Indicator Control Treatment

26
Mean SE Mean SE
Panel A: Household Characteristics (N=557) (N=551)
Proportion of Hindu Households 89.9 (3.23) 97.1** (1.48)
Proportion of Muslim Households 9.5 (3.17) 2.5** (1.47)
Proportion of Scheduled Caste Households 18.9 (4.04) 26.1 (3.98)
Proportion of Scheduled Tribe Households 2.9 (1.57) 1.5 (0.70)
Proportion of Other Backward Caste Households 73.1 (4.24) 62.6* (4.46)
Proportion of Households with a BPL Ration Card 48.6 (2.74) 45.4 (2.70)
Proportion of Households with a NREGA Card 17.8 (2.50) 28.7** (3.66)
Proportion of Households with Access to Piped Water 5.9 (1.90) 4.9 (1.97)
Proportion of households whose Latrine is Inside 29.3 (2.30) 30.5 (3.05)
Proportion of Female-Headed Households 21.2 (2.66) 15.4 (2.30)
Average Household Size 5.4 (0.09) 5.7* (0.14)
Average number of children aged five or below 0.8 (0.04) 0.8 (0.05)
Average number of young aged six to 17 1.8 (0.07) 1.7 (0.07)
Average number of adults aged 18 to 59 2.5 (0.07) 2.7** (0.08)
Average number of elderly aged 60 or more 0.4 (0.03) 0.5 (0.04)
Prop of households where at least one person practices
OD 49.6 (3.62) 50.5 (4.34)
Prop of households spent their own money for latrine
construction
66.5 (5.44) 65.9 (4.69)
Average amount of money spent for latrine construction 15353.9 (1029.12) 14792.8 (1167.06)
Prop of households recd. money for latrine from govt. 46.3 (4.28) 34.3** (3.99)
Panel B: Individual Adult Characteristics (N=2589) (N=2688)
Age in Years 28.4 (0.47) 29.3 (0.45)
Proportion of adult males 48.9 (0.84) 49.9 (0.67)
Average no. of years of education of adults 4.7 (0.16) 4.9 (0.19)
Proportion of disabled persons 2.3 (0.38) 1.9 (0.32)
Proportion of adults who were sick in the last 30 days 30.3 (1.87) 28.9 (1.22)
Proportion of adults who had diarrhoea in the last two
weeks 13.8 (1.80) 15.5 (1.96)
Proportion of adults who practice OD 31.5 (3.24) 30.3 (3.57)
Panel C: Individual Child Characteristics (N=434) (N=456)
Age in Years 2.7 (0.07) 2.6 (0.08)
Proportion of male children 50 (2.53) 48.7 (1.88)
Proportion of children that were sick in the last 30 days 40.5 (2.97) 39.3 (2.77)
Proportion of children that had diarrhoea in the last 2
weeks 42 (4.30) 24.0*** (3.41)
Proportion of children for whom faeces is safely
disposed 35.5 (3.51) 35.7 (3.05)
Panel D: Community Characteristics (N=30) (N=29)
Proportion of villages certified ODF 66.7 (14.21) 62.5 (12.5)
Proportion of villages with WASH activities held in past 46.7 (9.26) 75.9** (8.09)
Proportion of villages where distance of primary school
is within five kms 100 (0) 100.0 (0)
Proportion of villages where distance of health
subcentre is within five kms 70 (8.51) 72.4 (8.45)
Proportion of villages where distance of PHC is within
five kms 60 (9.10) 31.0** (8.74)

27
Proportion of villages where mason constructed toilets
in past 100
(0) 96.6
(3.45)
Source: HABIT Baseline Survey (March 2018).
Notes: * p<0.1, ** p<0.05,*** p<0.01.
p-values obtained by clustering at ward level. Standardised baseline weights utilised.
7.2. Other competing interventions
Any evaluation of a sanitation intervention in India must be viewed against the backdrop of SBM,
and in some ways, as supplemental to the larger national push to eliminate open defecation by
2019. The SBM is the largest, most visible push towards improving sanitation in the country with
INR 90 billion being set aside for SBM activities in the last Union Budget (2016-17). The
importance of this programme has been communicated to all government officers, and officials at
the block, district, state and national level are making a concerted push to promote sanitation in
the country. New toilets are being constructed at a rapid pace. At a recent rally in Bihar, the Prime
Minister stated that 850000 toilets had been constructed in the state in a week.44 Thus, there is
clearly a massive drive towards toilet construction and reducing open defecation, resulting in rapid
changes in on-ground toilet numbers. Thus, the effects of this programme will need to be analysed
in the context of this national mission.
In addition, the state government of Bihar has implemented JEEViKA, a rural livelihoods project
through the creation and promotion of self-help groups (SHGs). The JEEViKA programme is
being implemented by the Bihar Rural Livelihoods Promotion Society (BRLPS) and the State
Rural Livelihoods Mission, and is partly funded by the World Bank. JEEViKA uses women SHGs
to promote rural livelihoods, with a view to enhance the social and economic empowerment of
the poorest and the most marginalised women in the rural communities. The BRLPS recently
included health and nutrition interventions as a theme within its overall project. It has also included
a targeted sanitation module to promote handwashing behaviours and toilet use amongst SHG
members. This is a state-wide programme and is expected to have an equal impact across all
study areas. Our community tool captures the presence of SHGs within the village.
No other non-governmental organisations are currently operating in the study areas. Intervention
staff will be monitoring any changes on this front and implications of any changes in this scenario
will be discussed by the broader research and design team. To independently verify this
information, the community tool in the quantitative survey collects information on the presence of
other NGOs in the area. The qualitative evaluation will also explore the presence of other
interventions and their impact on the current study.
7.3. Self-selection bias
Self-selection bias occurs when participants in an intervention can decide for themselves whether
they want to participate in a study. This leads to a biased sample as those who choose to
participate have different characteristics than those who do not choose to participate. Our
intervention comprises of a package of community meetings at the tola level and a schedule of
home visits for eligible households within the tola. While households cannot self-select into the
home visits, which will be carried out by WVI for all eligible households, households may self-
select into community meetings. This means that households who choose to participate in the
community meetings maybe systematically different from those who choose not to participate in
44 https://www.ndtv.com/india-news/tejashwi-yadav-does-the-math-as-pm-says-8-5-lakh-toilets-built-in-bihar-in-a-week-1835705
28
them. For instance, households who choose to participate maybe more motivated to end open
defecation practices within their community.
We will be estimating both ITT and TOT. The TOT will be estimated by scaling the ITT with the
proportion of households who took up the intervention, i.e., the take-up rate of the intervention.
The take-up rate of the intervention will be based on participation in community meetings.
Households will be asked if they participated in community meetings at the endline survey. We
will use this to calculate participation in meetings. The ITT will not be biased owing to self-
selection in a way that TOT may be biased owing to self-selection into community meetings.
7.4. Risk of spillover
Since treatment is assigned randomly at the village level as a first step before selecting treatment
and control clusters (wards), it is impossible for a treatment and control cluster to be in the same
village. While it is still possible for a control cluster to share a boundary with a treatment cluster
(from the neighbouring village), the probability of this happening is very low. As such, we expect
little risk of spillover from the treatment to the control group in our evaluation due to geographical
proximity.
Since WVI staff operate in both treatment and control areas, the risk of spillover effects arising
from programme-level factors remains. For example, a WVI staff member may be put in-charge
of implementing the intervention in a given treatment area, whilst he/she continues to conduct
his/her regular duties45 in a nearby control area. In such a scenario, there is some risk of
contamination of control areas. We held detailed discussions about avoiding such scenarios while
training the WVI staff, and do not expect such programme-level spillovers to be common in
practice.
7.5. Behavioural responses to the evaluation
Modifications in respondent behaviour in response to the evaluation
Hawthorne effects or Observer effects occur where individuals modify an aspect of their behaviour
in response to the awareness that they are being observed. This is unlikely to affect treatment
and control households in our experiment. Our survey includes direct observation of toilets to
indirectly measure use at the household level through the presence of slippers, buckets, water
containers, and other commodities that potentially signal use. Given the entrenched cultural
habits associated with open defection, we believe that it is unlikely that households and
individuals would change the appearance of their toilets due to the fact that they were being
observed. Additionally, we believe that households are unlikely to have the opportunity to modify
the appearance of their toilets due to lack of prior knowledge that their toilets will be observed
and which aspects of the toilet will be observed directly.
Toilet use at the individual level is measured through self-reported behaviour. Here, owing to the
recent large-scale information and behavioural change communication campaigns carried out by
the Swachh Bharat Mission-Gramin, we believe that estimates of self-reported toilet use are likely
to be upward biased. There is no reason to believe that this self-reporting will be biased
differentially between control and treatment groups (see balance table to understand how these
outcome variables are similar across groups). Therefore, impact estimates at endline can be
attributed to the intervention.
45 WVI staff work in the areas of child nutrition, education, drinking water, and sanitation in the communities where they work in

29
The John Henry effect will occur in our case if households in the control group perceive
themselves to be at a disadvantage compared to households in the treatment group, and work
harder to overcome the difference or deficiency. This is unlikely to occur in our experimental
setting as the randomisation has been carried out at the village level and the treatment is carried
out at the ward level, with the treatment ward randomly chosen among all wards in the treatment
village. Households in the control group will, therefore, not have access to the intervention or
information around it. Moreover, the package of activities planned at the community and HH level
is not subsidy-based, making it unlikely for households in control areas to react to the exclusion.
Resentful demoralisation effects are unlikely to occur for the same reasons.
The pre-testing of the quantitative instrument also led to concerns on social desirability of certain
responses on toilet use biasing our estimate. The learnings on this and steps taken to minimise
the effects of socially desirable responses, and to increase confidence in the validity of
measurements have been documented in detail in Section 8.4.5.
Non-response
We had only two instances when the primary female respondents in our sample could not
complete the interview owing to childcare and other responsibilities. At the pre-testing stage, we
found that we were likely to encounter non-response among male respondents who were away
at work during the interview. As a result, our final survey instrument was divided into two parts,
one for the primary female respondent (which covered household demographics, health and
disability, toilet use, and water availability and use) and the second for the primary male
respondent (which covered latrine construction, latrine attributes, and knowledge, perceptions
around pit filling and pit emptying). We accounted for cases where the primary male respondent
was not available by allowing this section to be answered by the next best-informed person to
ensure that all questions were answered.
We took the following steps at baseline to contain non-response and will follow the same protocol
at endline:
• Our control and treatment households consisted of only resident households to limit
attrition due to migration.
• We interviewed primary caregivers and other household members even if the male
household head was unavailable during the baseline survey46. This ensured that the
sanitation practices of all household members were adequately captured. Toilet-use
questions were either self-reported or reported by the primary female respondent when
the self-reporting was not possible. We will be following the same convention in the endline.
• We included questions on migration, occupation, and sources of livelihood in our survey
to be able to control these and compare attritors (those who drop out of our sample at
endline) with non-attritors along these characteristics at endline.
• Monitoring mechanisms tracking the intervention and the monitoring data at the household
level will also enable us to track any attrition of households from the intervention and the
endline survey. Monitoring data will be collected during the intervention and will track
whether households received the full or partial schedule of home visits and whether
certain households dropped out from home visits. This will provide us with an early
estimation of the rate of attrition we are likely to encounter at the endline.
46 Duflo et al. (2007) suggest including names of neighbours and relatives that can be interviewed if the respondent cannot be found as possible ways of preventing attrition.

30
7.6. Implications for ex-post power calculations and ex-post randomisation
We utilised a household-level outcome indicator—the proportion of eligible households where at
least one person was defecating in the open—for the power analysis. While we relied on SQUAT
survey47 data for Bihar (2014) to calculate values for (i) baseline level and (ii) the intra-cluster
correlation coefficient for our initial power calculations, ex-post power calculations were
performed using updated parameter values based on our own baseline data. These updated
calculations (“Ex-post”) are presented, along with our initial calculations (“A priori”) in Table 9.
Table 9: Comparing a priori and ex-post power calculations
Parameter A priori Ex-post
Value Sources/Assumptions Value Sources/Assumptions
Baseline level of
proportion of eligible
households where at least
one person is defecating
in the open
0.41 SQUAT survey data for
Bihar 0.524
Improving HABIT
baseline survey
Significance level
(alpha) 0.05 Standard 0.05 Standard
Desired power of the test
(beta) 0.8 Standard 0.8 Standard
Mean number of
households in each
cluster
10 Practical considerations 12.5 Number achieved during
the baseline survey
Intra-cluster correlation
coefficient 0.1
SQUAT survey data for
Bihar 0.2
Improving HABIT
baseline survey
Inter-temporal
correlation coefficient 0.7
Lies within the standard
range assumed for a panel
of households
0.7
Lies within the standard
range assumed for a panel
of households
Number of clusters in
each arm 43
Calculated based on a
priori power calculations
(using OPM’s power
calculation tool)
44 Number achieved during
the baseline survey
MDE 0.1 Assumed target 0.118
Calculated based on ex-
post power calculations
(using OPM’s power
calculation tool)
Given the actual sample size achieved by our baseline survey, and updated values of (i) baseline
level and (ii) the intra-cluster correlation coefficient, ex-post power calculations reveal that our
study will be able to achieve a Minimum Detectable Effect (MDE) in the use of latrine of at least
11.8 percentage points. This is the minimum attributable decline in the proportion of eligible
households, where at least one person is defecating in the open, where our estimation model will
be able to detect with statistical confidence.
Since this updated MDE of 11.8 percentage points is larger than our initial target of 10 percentage
points, there is some chance that our survey could be marginally underpowered (compared to our
initial estimation). However, since the difference between the two MDEs is very small (1.8
percentage points), we do not think that this is an immediate cause of concern. Moreover, we
47 http://riceinstitute.org/data/squat/
31
have assumed a conservative value of 0.748 for the Inter-Temporal Correlation (ITC) coefficient
(we will learn about the true value of the ITC only at the endline stage). Since MDE is inversely
related to the ITC coefficient, and we expect it to be around 0.8 at the endline stage, we are
confident that our study design will be able to achieve an MDE very close to our initial target of
10 percentage points49.
8. Findings
8.1. Description of the quantitative sample
The quantitative sample from baseline data collection is summarised in Table 10. The indicators
are categorised into four main panels: A, B, C, and D. The top panel (Panel A) shows the summary
statistics of household characteristics, Panels B and C summarise the individual adult and
individual child characteristics, while the bottom panel (Panel D) describes the community
characteristics.
Within household characteristics (Panel A), we have included the socio-economic characteristics
of the sampled households, i.e., the religion and caste composition, poverty status (BPL and
NREGA cardholders), age composition within the sampled households, average household size,
and open defecation prevalence within the households. Individual characteristics indicators have
been further classified into Adult and Child characteristics (Panels B and C, respectively), where
indicators for adult characteristics involve proportion of adult males in the sample, proportion of
disable persons, sickness in the last 30 days, diarrhoeal occurrences in the last two weeks, and
open defecation practice amongst the adults. Finally, the indicators for community characteristics
include characteristics of the village as a whole in terms of access to services, community
mobilisation activities in the past, ODF status of the village etc.
In our sample, the proportion of Hindu households is the largest at 92.5%, followed by Muslim
households at 7.2%. The proportion of Other Backward Classes (OBCs) is the highest at almost
70%, followed by the Scheduled Caste (SC) population at around 22%, and only 2.3% household
belong to the Scheduled Tribe (ST). Around 46% households have a Below Poverty Line (BPL)
ration card and 25% have a Mahatma Gandhi National Rural Employment Guarantee Act
(NREGA) job card. Around 18% of the households are female-headed and the average family
size is 5.7. Only 4.5% households have access to piped water facility. As far as presence of toilet
and usage is concerned, our sample shows that around 26% of the households have a toilet
which is inside the house and in about 53% of the households, there is at least one person who
defecates in the open.
The average age of adults who are part of the sample is 28.4 years and that of the children is 2.7
years. The proportion of males and females (both adult and children) is nearly equal. The average
number of years of education amongst the adults in our sample is around 4.7 years. Proportion
of adults who have had diarrhoea in the last two weeks from the day of the survey is about 15%
whereas for children, this figure is nearly double at 28.8%. Proportion of adults who practice open
defecation is nearly 34%. As for children, the proportion of children whose faeces is safely
disposed is 35.9%. Some 16% of all responses to questions related to OD were self-reported by
the individual in question. The remaining 84% were reported by the main female respondent.
48 For a panel survey, the value of the ITC coefficient can be anywhere between 0.7 and 0.9. 49 For example, if we find that the ITC coefficient is equal to 0.8 at the endline stage (ceteris paribus), the MDE will reduce to 9.7 percentage points.

32
For the community-level indicators, the village sample shows that 64.3% of the villages have been
certified ODF and in about 61% of the villages, WASH mobilisation activities have been held in
the past.
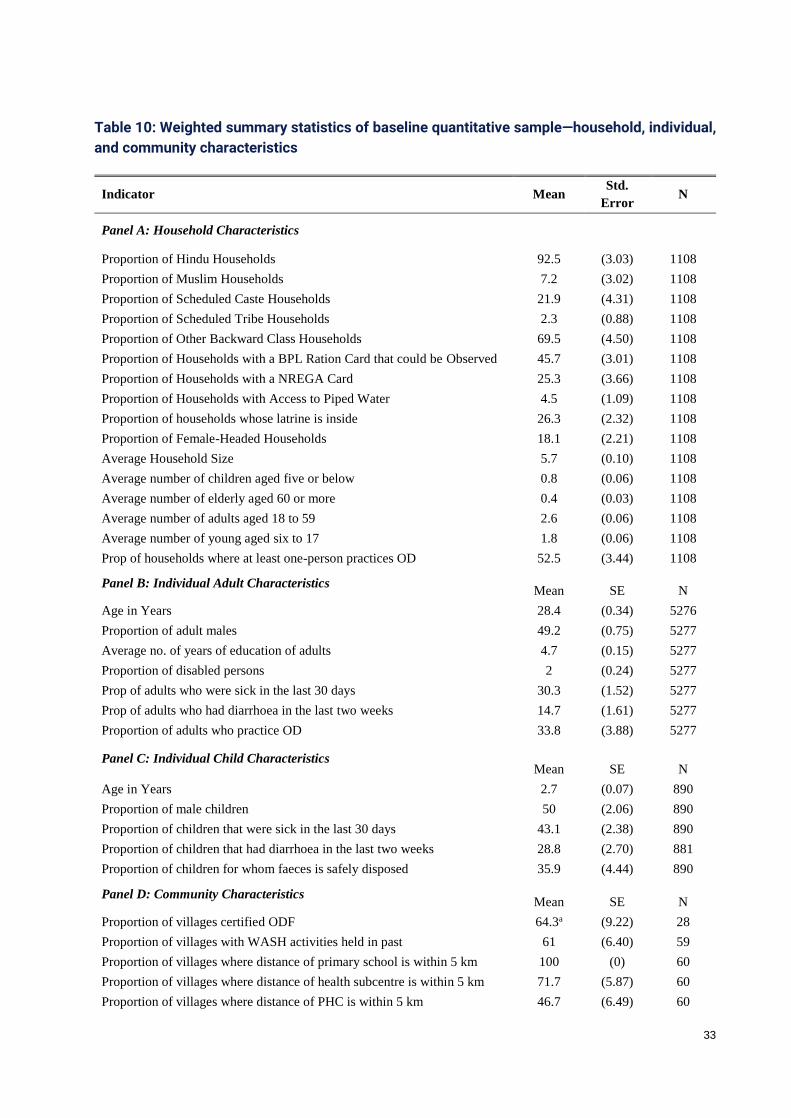
33
Table 10: Weighted summary statistics of baseline quantitative sample—household, individual,
and community characteristics
Indicator Mean Std.
Error N
Panel A: Household Characteristics
Proportion of Hindu Households 92.5 (3.03) 1108
Proportion of Muslim Households 7.2 (3.02) 1108
Proportion of Scheduled Caste Households 21.9 (4.31) 1108
Proportion of Scheduled Tribe Households 2.3 (0.88) 1108
Proportion of Other Backward Class Households 69.5 (4.50) 1108
Proportion of Households with a BPL Ration Card that could be Observed 45.7 (3.01) 1108
Proportion of Households with a NREGA Card 25.3 (3.66) 1108
Proportion of Households with Access to Piped Water 4.5 (1.09) 1108
Proportion of households whose latrine is inside 26.3 (2.32) 1108
Proportion of Female-Headed Households 18.1 (2.21) 1108
Average Household Size 5.7 (0.10) 1108
Average number of children aged five or below 0.8 (0.06) 1108
Average number of elderly aged 60 or more 0.4 (0.03) 1108
Average number of adults aged 18 to 59 2.6 (0.06) 1108
Average number of young aged six to 17 1.8 (0.06) 1108
Prop of households where at least one-person practices OD 52.5 (3.44) 1108
Panel B: Individual Adult Characteristics Mean SE N
Age in Years 28.4 (0.34) 5276
Proportion of adult males 49.2 (0.75) 5277
Average no. of years of education of adults 4.7 (0.15) 5277
Proportion of disabled persons 2 (0.24) 5277
Prop of adults who were sick in the last 30 days 30.3 (1.52) 5277
Prop of adults who had diarrhoea in the last two weeks 14.7 (1.61) 5277
Proportion of adults who practice OD 33.8 (3.88) 5277
Panel C: Individual Child Characteristics Mean SE N
Age in Years 2.7 (0.07) 890
Proportion of male children 50 (2.06) 890
Proportion of children that were sick in the last 30 days 43.1 (2.38) 890
Proportion of children that had diarrhoea in the last two weeks 28.8 (2.70) 881
Proportion of children for whom faeces is safely disposed 35.9 (4.44) 890
Panel D: Community Characteristics Mean SE N
Proportion of villages certified ODF 64.3a (9.22) 28
Proportion of villages with WASH activities held in past 61 (6.40) 59
Proportion of villages where distance of primary school is within 5 km 100 (0) 60
Proportion of villages where distance of health subcentre is within 5 km 71.7 (5.87) 60
Proportion of villages where distance of PHC is within 5 km 46.7 (6.49) 60

34
Proportion of villages with Pakka road 71.2 (5.95) 59
Proportion of villages where mason constructed toilets in past 98.3 (1.69) 59
Source: HABIT Baseline Survey (March 2018).
Notes: aAmong all other community characteristics indicators, Proportion of villages certified ODF had 32
missing values in 60 villages.
8.2. Comparison of survey sample with national population
For comparison of baseline quantitative data with national data from secondary sources, we have
selected few main indicators from the list of indicators from Panels A, B, C, and D, discussed
above. Table 11 shows the comparison of baseline data with different secondary data sources
including Census 2011, National Family Health Survey 2015-16, 69th round of NSSO survey,
Socio Economic Caste Census, SQUAT survey etc. We have also subdivided the national data
into four parts namely, National level (All India including both rural and urban), National-Rural
(only rural India), Bihar (State-wide including both rural and urban), and Bihar-Rural (only rural
parts of Bihar) level data. This is to ensure a more granular comparison from national level to as
close to the baseline sample level data, i.e., Bihar-Rural. However, not all national data is
available at such granular distinctions. Some cells in the table have, therefore, been left empty.
Proportion of Muslim households in our sample is 7.2%, which is about 10% lower than the state-
level figures of Bihar, as reported by the NFHS 2015-16 data. However, the proportion of OBC
population in our sample (69.5%) is more than 10% of the state-level figures. Proportion of BPL
cardholders, as reported by the baseline survey, is 21.9%, as opposed to Bihar’s figure of 33%
reported by secondary data. Outcome indicators, such as ‘proportion of households where at
least one person defecates in the open’ and ‘proportion of children who suffered from diarrhoea
in the past two weeks’, show large variations in comparison to both national as well state-level
data. In our sample, 52.5% proportion of households have at least one member who practices
open defecation, which is about 10% higher than the SQUAT survey data for Bihar (43%). A point
to note here is that our sample only shows the rural Bihar figures. However, the SQUAT survey
takes into account the overall state data. Similarly, our sample shows that the proportion of
children that had diarrhoea in the last two weeks is 29.5%, whereas the NFHS 2015-16 data for
the same indicator is 10.7%. This might be because of the difference in the sampled areas of
NFHS (which includes all 38 districts of Bihar) and we only have data from six districts in our
sample.

35
Table 11: Comparison of baseline statistics with national and state-level statistics
(1) (2) (3) (4) (5)
Indicator
HABIT
Baseline
dataa
National
level
National
Rural Bihar
Bihar
Rural
Panel A: Household Characteristics
Prop. of Hindu Households 92.5 81.4c 83.7c 83.8c 84.6c
Prop. of Muslim Households 7.2 12.5c 10.6c 16.1c 15.3c
Prop. of Scheduled Caste Households 21.9 20.6c 22.6c 20.5c 21.6c
Prop. of Scheduled Tribe Households 2.3 9.2c 12c 3.4c 3.8c
Prop. of Other Backward Caste Households 69.5 42.2c 42.2c 57.5c 57c
Prop. of HHs with a BPL Ration Card 21.9 48.14e -- 33.0e --
Prop. of HHs with Access to Piped Water 4.5 36.6f 16.9f 4.1c 2.5c
Prop. of Female-Headed Households 18.1 14.6c 14.9c 24.4c 25.3c
Average Household Size 5.7 4.6c 4.7c 5.2c 5.3c
Proportion of households where at least one person
practices OD 52.5 -- -- -- 43.8g
Panel B: Individual Adult Characteristics
Average no. of years of education of adults 4.7 5.65*c 4.45*c 2.75*c --
Proportion of disabled persons 2.0 1.54d -- 1.7d --
Panel C: Individual Child Characteristics
Proportion of children who had diarrhoea in last 2 weeks 28.8 9.2c 9.6c 10.4c 10.7c
Proportion of children for whom faeces is safely
disposed 35.9 16.0b -- -- --
Source: a HABIT Baseline Survey (March 2018). b National Family Health Survey (NFHS) 2005-06; stated figure for the indicator—households reported that the
faeces of their youngest child under age three were safely disposed.
(https://www.wsp.org/sites/wsp.org/files/publications/WSP-India-CFD-Profile.pdf) c National Family Health Survey (NFHS-4) 2015-16 with total sample size of approximately 572,000 households
in 157 districts spread across India. In Bihar, NFHS collected information from 36,772 households across 38
districts. (http://rchiips.org/NFHS/NFHS-4Report.shtml)
*Figures 5.65 (national) and 2.75 (Bihar) for the Panel B indicator- Average no. of years of education of adults,
have been calculated by taking mean of the median educational attainment of males and females (incl. children
aged between 6-18 years). d Socio Economic and Caste Census 2011. (http://secc.gov.in/reportlistContent) e Ministry of Consumer Affairs, Food and Public Distribution, Govt. of India, 2013. Government record of all the
BPL Household at the national and state level. f National Sample Survey, 69th Round (2012) with total number of households covered was 53,393 in rural India
(across 4,475 sampled villages) and 42,155 in urban India (across 3,522 sampled urban blocks)
(http://mospi.nic.in/sites/default/files/publication_reports/nss_rep_556_14aug14.pdf)
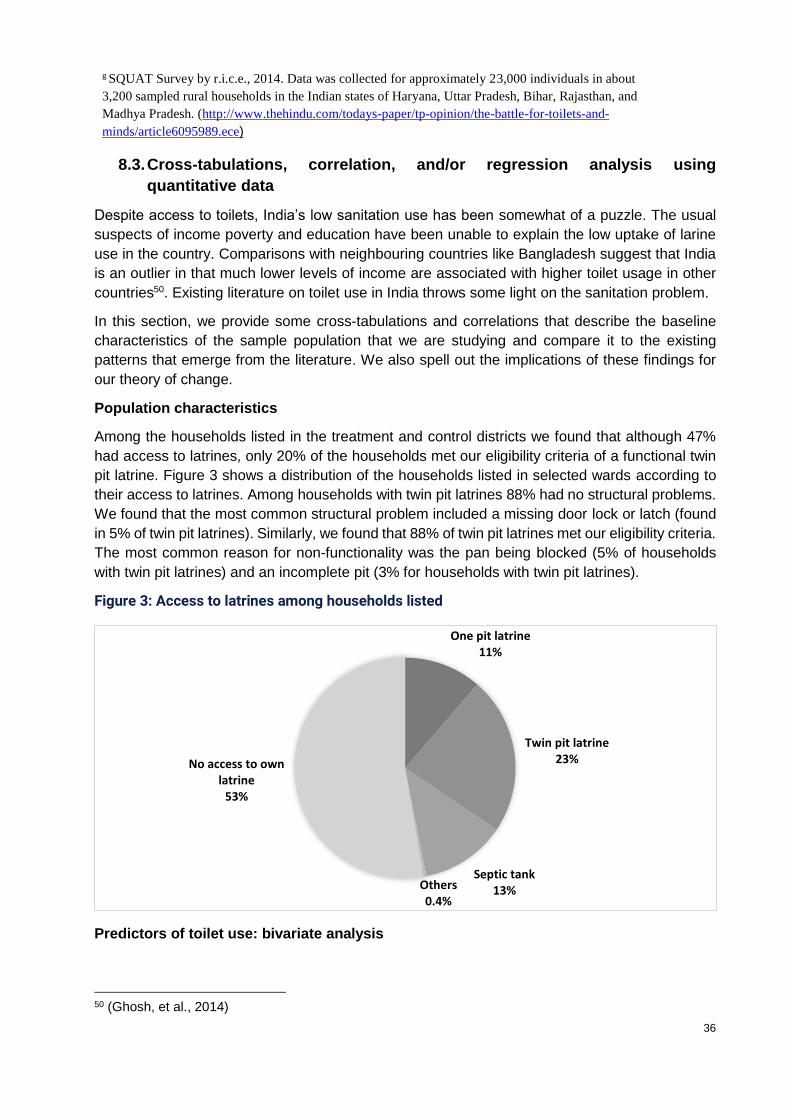
36
g SQUAT Survey by r.i.c.e., 2014. Data was collected for approximately 23,000 individuals in about
3,200 sampled rural households in the Indian states of Haryana, Uttar Pradesh, Bihar, Rajasthan, and
Madhya Pradesh. (http://www.thehindu.com/todays-paper/tp-opinion/the-battle-for-toilets-and-
minds/article6095989.ece)
8.3. Cross-tabulations, correlation, and/or regression analysis using
quantitative data
Despite access to toilets, India’s low sanitation use has been somewhat of a puzzle. The usual
suspects of income poverty and education have been unable to explain the low uptake of larine
use in the country. Comparisons with neighbouring countries like Bangladesh suggest that India
is an outlier in that much lower levels of income are associated with higher toilet usage in other
countries50. Existing literature on toilet use in India throws some light on the sanitation problem.
In this section, we provide some cross-tabulations and correlations that describe the baseline
characteristics of the sample population that we are studying and compare it to the existing
patterns that emerge from the literature. We also spell out the implications of these findings for
our theory of change.
Population characteristics
Among the households listed in the treatment and control districts we found that although 47%
had access to latrines, only 20% of the households met our eligibility criteria of a functional twin
pit latrine. Figure 3 shows a distribution of the households listed in selected wards according to
their access to latrines. Among households with twin pit latrines 88% had no structural problems.
We found that the most common structural problem included a missing door lock or latch (found
in 5% of twin pit latrines). Similarly, we found that 88% of twin pit latrines met our eligibility criteria.
The most common reason for non-functionality was the pan being blocked (5% of households
with twin pit latrines) and an incomplete pit (3% for households with twin pit latrines).
Figure 3: Access to latrines among households listed
Predictors of toilet use: bivariate analysis
50 (Ghosh, et al., 2014)
One pit latrine11%
Twin pit latrine23%
Septic tank13%Others
0.4%
No access to own latrine
53%
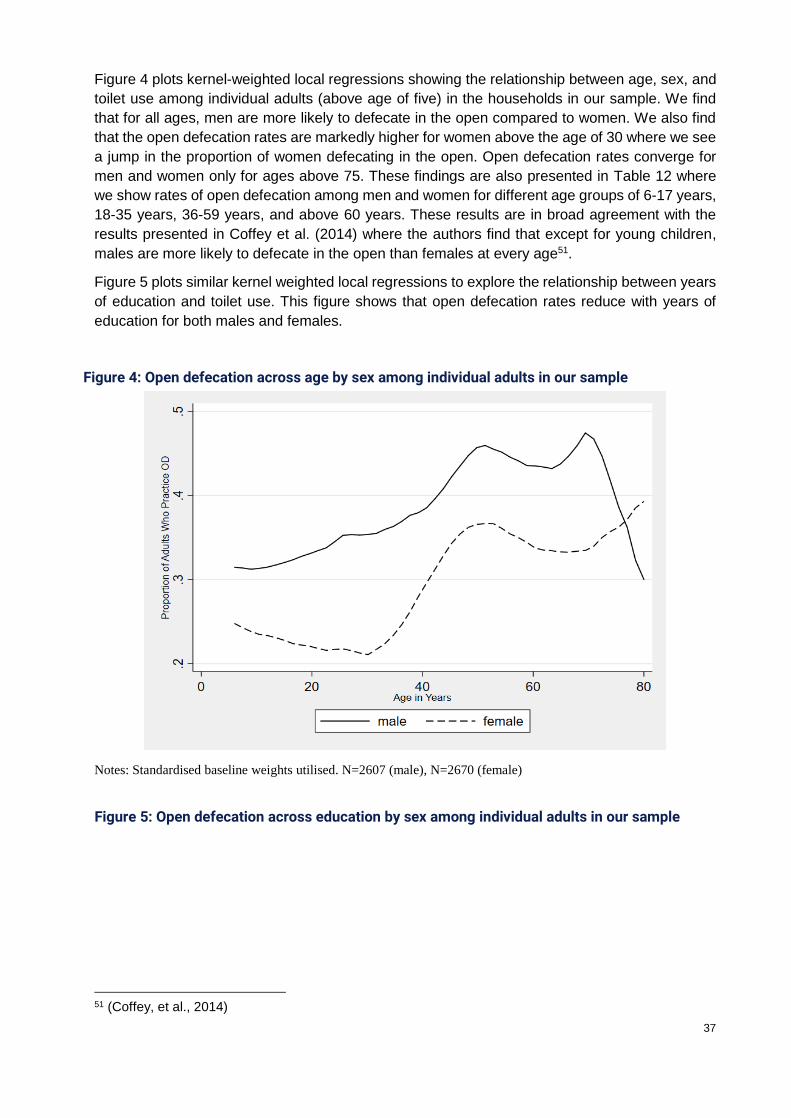
37
Figure 4 plots kernel-weighted local regressions showing the relationship between age, sex, and
toilet use among individual adults (above age of five) in the households in our sample. We find
that for all ages, men are more likely to defecate in the open compared to women. We also find
that the open defecation rates are markedly higher for women above the age of 30 where we see
a jump in the proportion of women defecating in the open. Open defecation rates converge for
men and women only for ages above 75. These findings are also presented in Table 12 where
we show rates of open defecation among men and women for different age groups of 6-17 years,
18-35 years, 36-59 years, and above 60 years. These results are in broad agreement with the
results presented in Coffey et al. (2014) where the authors find that except for young children,
males are more likely to defecate in the open than females at every age51.
Figure 5 plots similar kernel weighted local regressions to explore the relationship between years
of education and toilet use. This figure shows that open defecation rates reduce with years of
education for both males and females.
Notes: Standardised baseline weights utilised. N=2607 (male), N=2670 (female)
51 (Coffey, et al., 2014)
Figure 5: Open defecation across education by sex among individual adults in our sample
Figure 4: Open defecation across age by sex among individual adults in our sample

38
Notes: Standardised baseline weights utilised. N=2607 (male), N=2670 (female)
Table 12 points to another important finding. We see that almost 30% of females defecate in the
open at least sometimes, with even higher rates of open defecation among older women (38.1%
of females between the ages of 36-59 defecate in the open). This finding has important
implications for our initial theory of change which predominantly focusses on higher defecation
among males. This finding calls for an expansion in the target group of our intervention from only
male members to include females above the ages of 35. It also emphasises the importance of
testing the impact of the intervention not only on toilet use among male household members but
also among female household members.
Table 12: Proportion of individuals who defecate in the open by age and sex
Age Group Male Female
Mean SE N Mean SE N
All Ages 38.8 (3.76) 2607 29 (4.15) 2670
6-17 year olds 34.4 (4.02) 990 27.5 (4.40) 932
18-35 year olds 39.4 (4.27) 791 22.7 (4.47) 885
36-59 year olds 45.3 (3.96) 567 38.1 (4.81) 618
60 and above year olds 40.2 (6.10) 259 36.8 (5.30) 234
Notes: Standardized baseline weights utilized.
Simple comparison of the average proportion of households where at least one person openly
defecates in Figure 6 suggests that rates of open defecation are higher among Muslim
households in our sample (although not significantly). Our results don’t tie-up with Geruso and
Spears (2014) who found that Hindus are 40% more likely than Muslims to defecate in the open,
and that this difference can account for 18% of child mortality gap between Hindus and Muslims.52
52 (Geruso & Spears, 2014)
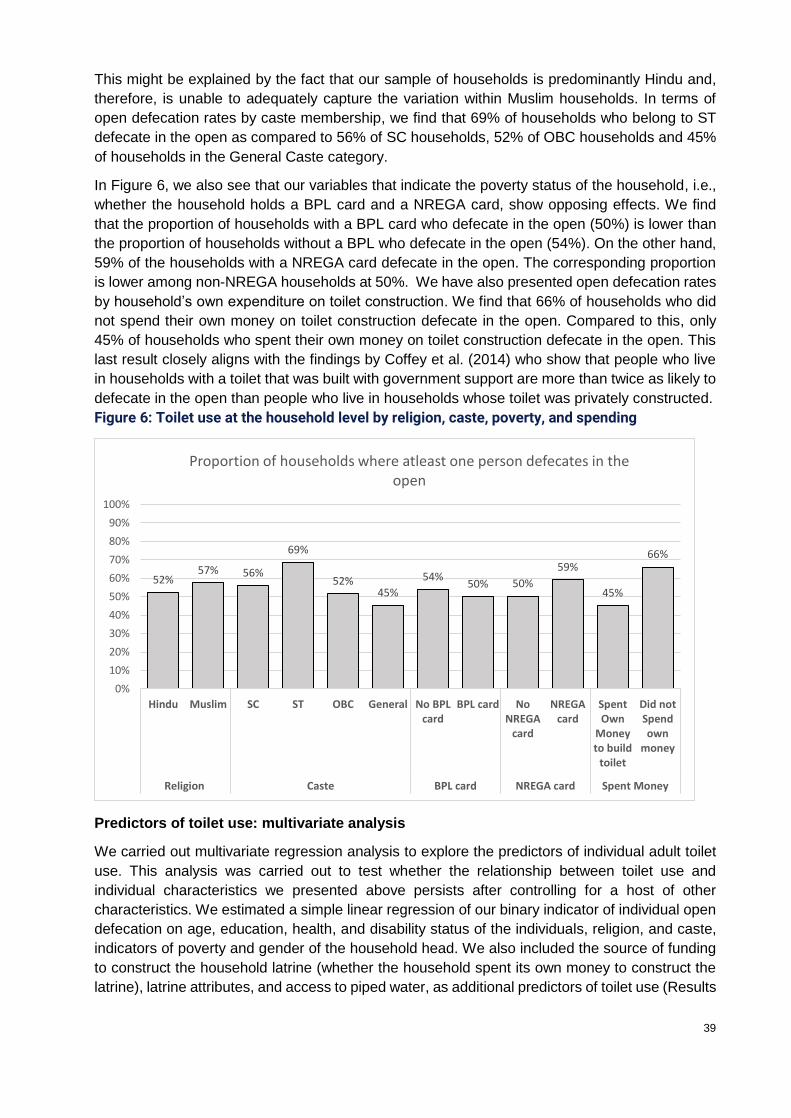
39
This might be explained by the fact that our sample of households is predominantly Hindu and,
therefore, is unable to adequately capture the variation within Muslim households. In terms of
open defecation rates by caste membership, we find that 69% of households who belong to ST
defecate in the open as compared to 56% of SC households, 52% of OBC households and 45%
of households in the General Caste category.
In Figure 6, we also see that our variables that indicate the poverty status of the household, i.e.,
whether the household holds a BPL card and a NREGA card, show opposing effects. We find
that the proportion of households with a BPL card who defecate in the open (50%) is lower than
the proportion of households without a BPL who defecate in the open (54%). On the other hand,
59% of the households with a NREGA card defecate in the open. The corresponding proportion
is lower among non-NREGA households at 50%. We have also presented open defecation rates
by household’s own expenditure on toilet construction. We find that 66% of households who did
not spend their own money on toilet construction defecate in the open. Compared to this, only
45% of households who spent their own money on toilet construction defecate in the open. This
last result closely aligns with the findings by Coffey et al. (2014) who show that people who live
in households with a toilet that was built with government support are more than twice as likely to
defecate in the open than people who live in households whose toilet was privately constructed.
Predictors of toilet use: multivariate analysis
We carried out multivariate regression analysis to explore the predictors of individual adult toilet
use. This analysis was carried out to test whether the relationship between toilet use and
individual characteristics we presented above persists after controlling for a host of other
characteristics. We estimated a simple linear regression of our binary indicator of individual open
defecation on age, education, health, and disability status of the individuals, religion, and caste,
indicators of poverty and gender of the household head. We also included the source of funding
to construct the household latrine (whether the household spent its own money to construct the
latrine), latrine attributes, and access to piped water, as additional predictors of toilet use (Results
52%57% 56%
69%
52%45%
54%50% 50%
59%
45%
66%
0%
10%
20%
30%
40%
50%
60%
70%
80%
90%
100%
Hindu Muslim SC ST OBC General No BPLcard
BPL card NoNREGA
card
NREGAcard
SpentOwn
Moneyto build
toilet
Did notSpendown
money
Religion Caste BPL card NREGA card Spent Money
Proportion of households where atleast one person defecates in the open
Figure 6: Toilet use at the household level by religion, caste, poverty, and spending
Figure 7: Toilet Use at the Household Level By Religion, Caste, Poverty, Spending

40
shown in Appendix C: Regressions Predicting Toilet Use). We have estimated this linear
probability model both with and without ward-level fixed effects.
We find that age, sex, and years of education are significant predictors of toilet use even after
controlling for other variables. The association between religion and toilet use, as well as caste
and toilet use are not significant in our model. Among our indicators for poverty, we find that
holding a NREGA card predicts toilet use even after controlling for ward-fixed effects. While the
dummy spending of one’s own money for toilet construction appears to be predicting toilet use
without fixed effects at the ward level, this association is no longer significant once we add ward-
level fixed effects to our regressions.
Knowledge and perceptions around pit filling and pit emptying
Baseline estimates on the knowledge and perceptions of households around pit filling and pit
emptying have implications for our theory of change, which hypothesizes that faulty mental
models around the rate of pit filling and anxiety over pit emptying limit male members’ toilet use.
We find that most households had not received any prior information around pit filling and
emptying. While 28% of households reported that they had received information on when their pit
was likely to fill up, 40% reported that they had received information on what to do when their pit
filled up.
In Figure 8, we find that only 41% of households correctly estimate the pit-filling rate for Pit 1, 33%
underestimate the rate (i.e., think it takes fewer years than it does), and 20% percent overestimate
(i.e., think it takes more years than it does) the rate. Similarly, only 29% households correctly
estimate the pit-filling rate for Pit 2, 42% percent underestimate the rate, and 20% overestimate
the rate. Nine percent of our sample could not answer the question for Pit 2. We also find that 41%
of households overestimate the time it takes for pit contents to decompose (see Figure 9).
Our baseline estimates around knowledge and perceptions around pit filling and decomposition
suggest that the misinformation around pit-filling rates varies on both ends of overestimating and
underestimating these rates. These findings emphasize the need to question our initial
assumptions that households would underestimate this rate and were, therefore, anxious about
pit filling. Our intervention is designed to correct any misinformation and, therefore, we don’t
expect any changes in it considering these findings.
Figure 8: Perceptions about time taken for pit to fill
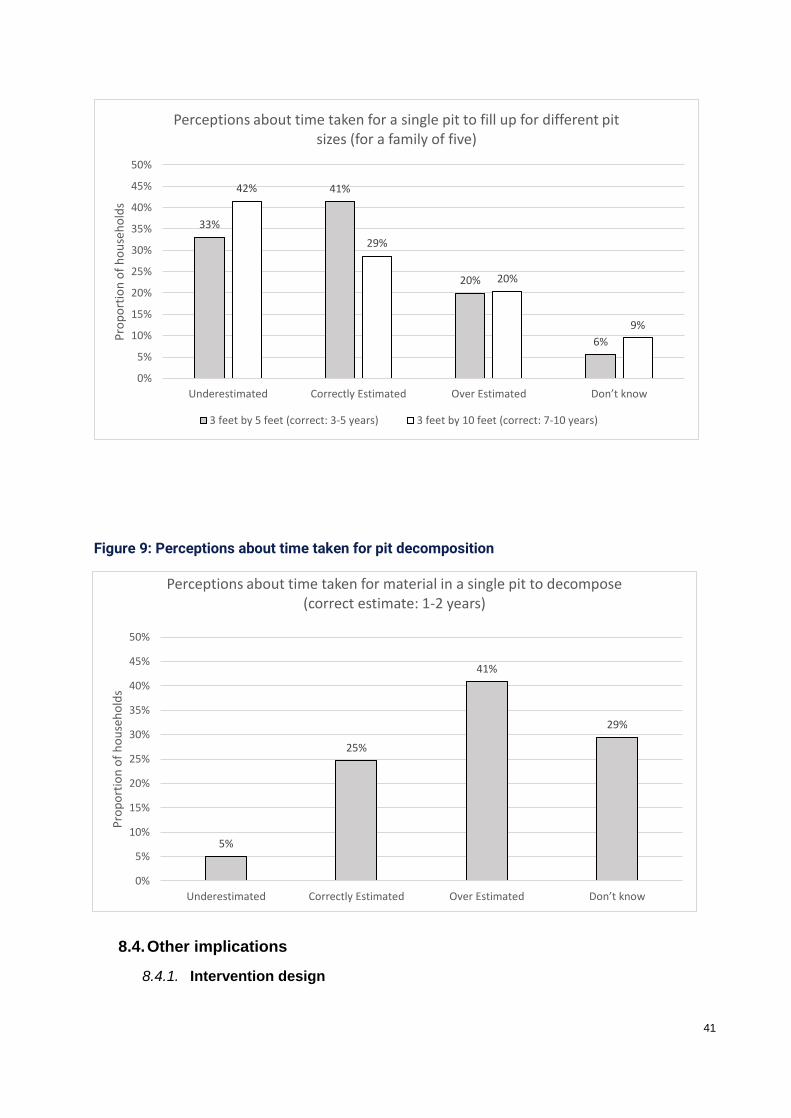
41
8.4. Other implications
8.4.1. Intervention design
5%
25%
41%
29%
0%
5%
10%
15%
20%
25%
30%
35%
40%
45%
50%
Underestimated Correctly Estimated Over Estimated Don’t know
Pro
po
rtio
n o
f h
ou
seh
old
s
Perceptions about time taken for material in a single pit to decompose (correct estimate: 1-2 years)
Figure 9: Perceptions about time taken for pit decomposition
Figure 10: Perceptions about time taken for pit decomposition
33%
41%
20%
6%
42%
29%
20%
9%
0%
5%
10%
15%
20%
25%
30%
35%
40%
45%
50%
Underestimated Correctly Estimated Over Estimated Don’t know
Pro
po
rtio
n o
f h
ou
seh
old
sPerceptions about time taken for a single pit to fill up for different pit
sizes (for a family of five)
3 feet by 5 feet (correct: 3-5 years) 3 feet by 10 feet (correct: 7-10 years)

42
Baseline results do challenge some assumptions made in the design and formative phase of this
study, as related to gender and pit-filling time.
Related to gender: Formative research, along with an exhaustive literature review, indicates that
there was a pronounced difference between male and female rates of toilet use. This was
documented in the formative study report and the initial intervention design looked at male toilet
use patterns separately. The baseline findings indicate that the percentage of men practising OD
is higher than the percentage of women practising OD at all ages, and this difference is significant.
However, the overall rates of women who continue to defecate outside despite having access to
a functional toilet remains high. This indicates that the behaviour change intervention is important
for both genders.
The intervention design in its current form does not make a distinction based on gender, thus no
design changes need to be made based on this finding. However, the gender differences in
behaviours and attitudes to toilet use will need to be closely monitored during the endline and in
the qualitative study.
Related to pit-filling time: The research design posited that non-use of toilets was partially
explained by ‘underestimation’ of the time taken for the pit to fill, i.e., households saw toilets as a
scarcer resource than they actually are which, in turn, dis-incentivised frequent use of the toilets.
Baseline findings find significant misconceptions around time taken for the pits to fill, with only
42% of households correctly estimating the time taken to fill a 35 cubic feet pit, and a mere 28%
being able to correctly estimate how long it would take 71 cubic feet pit to fill up. Households were
almost as likely to overestimate pit-filling rates as they were to underestimate it. Thus, the
assumption of incorrect estimation of pit-filling rates holds, though this misinformation varies on
both fronts. Reasons for non-use of toilets need to be understood as a complex mix of various
factors. In some households, reasons other than fear of quick pit-filling might explain non-use of
toilets. The intervention design focusses on conveying correct information around pit-filling rates
to alleviate anxieties about pit filling and incentivise regular toilet use. The impact of this
intermediate outcome on toilet use will need to be examined in detail during the endline. Baseline
findings do not, however, require any change to the intervention design.
While both these findings do not require immediate revision of the study design, the associated
intermediated outcomes and their impact on toilet use will need a special focus during the endline.
8.4.2. Research objectives, questions, and hypotheses
There are no implications to be reported in this section.
8.4.3. Impact evaluation design
While there is balance (between treatment and control areas) on almost all outcome-level
indicators, there are some significant differences in background characteristics across the two
study arms. There is a higher percentage of Hindu households and lower percentage of female-
headed households in the treatment arm. Treatment households are also larger in terms of the
number of members and children in the households. In terms of the community characteristics,
we find that a higher percentage of treatment communities have had a WASH-triggering activity
in the past. Additionally, treatment areas have a much lower proportion of communities with
access to a Primary Health Centre within five kilometres. Imbalance in the randomisation means
that a simple comparison of means at endline will not provide an unbiased measure of the impact.
We will be including covariates, which show an imbalance, as controls in the impact estimates

43
produced at endline. We will need to account for these differences in the DID regression
specification at the endline stage.
Sample size calculations for the baseline survey were based on assumed values of certain
technical parameters (baseline value, ICC, ITC etc.). Having observed the real values of these
parameters, new ex-post sample size calculations indicate that our study may be slightly
underpowered. The implications of this have been discussed in Section 7.6.
8.4.4. Quantitative survey instruments
We don’t think any major changes are required to the survey instruments based on the baseline
data analysis. Our interactions with another study team did revise our thinking on the question
regarding reasons for open defecation. Since many members of the household work in the field,
they may not have access to a toilet there, leading to the practice of open defecation. Our baseline
question asking for reasons for open defecation does mention convenience as a reason but does
not specifically ask about lack of availability of toilets in the fields as a reason for this. While we
realised this only after the baseline survey was underway, we propose to add an option to reflect
this reason for open defaecation in the endline survey.
8.4.5. Lessons learned about the measurement of toilet use
The pilot exercise for the baseline instruments yielded insights into responses around toilet use.
During the pilot, we found that everyone always reported using their latrines. The only time they
reported defecating in the open was if the latrine was occupied. Some possible reasons that the
research team (after consultation with technical experts) could attribute to this were: i) SBM and
the governments’ push towards toilet use, incentivising all respondents to report socially desirable
behaviour; ii) the selection of households based on toilet characteristics upfront, which was visible
to all participating households, might have tipped-off respondents on the nature of the study; and
iii) the power dynamics created by the fact that the pre-testing was conducted by members of the
OPM research team (as opposed to survey enumerators). During another sanitation study being
conducted by OPM, we noticed that there was a greater variation in toilet use responses when
the questions were asked by the survey team.
Based on this understanding, we made the following changes to the instrument to be used for the
baseline data collection: (i) the toilet use questions were asked immediately after the health and
disability roster and before we asked detailed questions on the toilet, which could bias answers;
(ii) the consent form no longer focused on health, hygiene, and sanitation but also mentioned
broader topics about life and livelihood in villages; and (iii) we asked about children’s defecation
practices before moving on to adults.
These steps helped alleviate the earlier problems we were seeing in responses to questions on
toilet use. The pilot and monitoring of results from a concurrent OPM study were helpful in refining
our thinking on measurement of toilet use.
8.4.6. Extent and focus of qualitative work
While the qualitative study is slated for the endline (end 2018), several avenues of inquiry have
already begun to present themselves. In addition to the indicative list of themes mentioned in
Section 5.1, the qualitative study will focus on two findings from the formative study and literature
review: a) explore the gendered differences in toilet use: magnitude, reasons and perceptions
around need for toilet use amongst men and women; b) knowledge about, and anxieties around
pit filling: the qualitative study will try to understand the extent of misinformation around pit filling
and the impact that this may have or has had on toilet use patterns in the household. Since the

44
quantitative baseline findings have indicated that these two theories need to be tested further,
this will be explored further during qualitative fieldwork.
9. Ethics
Ethical consent for carrying out the data collection for this study was sought from the Sigma
Institutional Review Board (IRB). Following the requirements of the IRB, permission letters to
carry out the study were obtained from the respective Block Development Officers, and Medical
Officers In-Charge or Child Development Project Officers.
Consent procedures were in line with those laid out by the IRB. Consent forms informed survey
respondents of the expected time of participation, and the benefits, risks, and discomforts
associated with the participation. The respondents were informed that the participation in the
survey was completely voluntary and that they had the freedom to withdraw at any time. After a
full-informed consent was read to the respondents, oral consent to proceed with the interviews
was obtained and documented by the enumerator.
Enumerators were trained to pay attention to cultural sensitivities, as well as, privacy and
confidentiality of the respondents. Adequate ethical training was given to all enumerators and the
OPM staff. Considering that interviews could bring up topics of caste hierarchies, and purity and
pollution, enumerators were trained to keep in mind cultural notions and norms. Enumerators can
also influence the responses, so they were trained to remain neutral and also make the
respondents comfortable.
Data confidentiality of electronic data will be maintained. Personal identifiers will be removed from
data collected. Physical data will be securely stored. Data will be computer-entered using
password protection. Only research staff will have access to collected data. An amendment to the
consent was sought from the IRB to share identified data with the Measurement Team constituted
by the 3ie to carry out surveys in the households identified in our house-listing data.
10. Major challenges and lessons learned
During this study, we have been maintaining a learning journal to allow us to keep track of issues
that arise and document how they are addressed. The combined learning journal, documenting
lessons on study design, implementation, and evaluation study thus far, is presented in the
Appendix. The key challenges and lessons learnt are captured below.
We faced two major challenges in the study. Firstly, engagement with multiple partners was
necessary and important at every stage, from behavioural intervention design to evaluation and
implementation. The expertise offered by each partner is important in designing a rigorous,
scalable, and logistically feasible study design, and requires repeated iterations and, therefore,
time. This had an impact in adhering to timelines. Aligning the administrative and financial
processes of all partner organisations and the donor was time-consuming and resulted in delaying
some study timelines.
Secondly, the pervasive presence of the SBM on the ground had considerable implications on
the design and impact of this study. This also affected sampling decisions. It is challenging to
work with a dynamic programme such as SBM while staying true to technical rigour. The analysis
must account for the bias created by SBM on the results. We are closely monitoring numbers and
will discuss the impact of the SBM in the endline analysis. In addition, the SBM has created
incentives to declare districts/villages as ODF. If a study area is already viewed as ODF by the
government, officials may be resistant to the implementation of a programme that promotes toilet
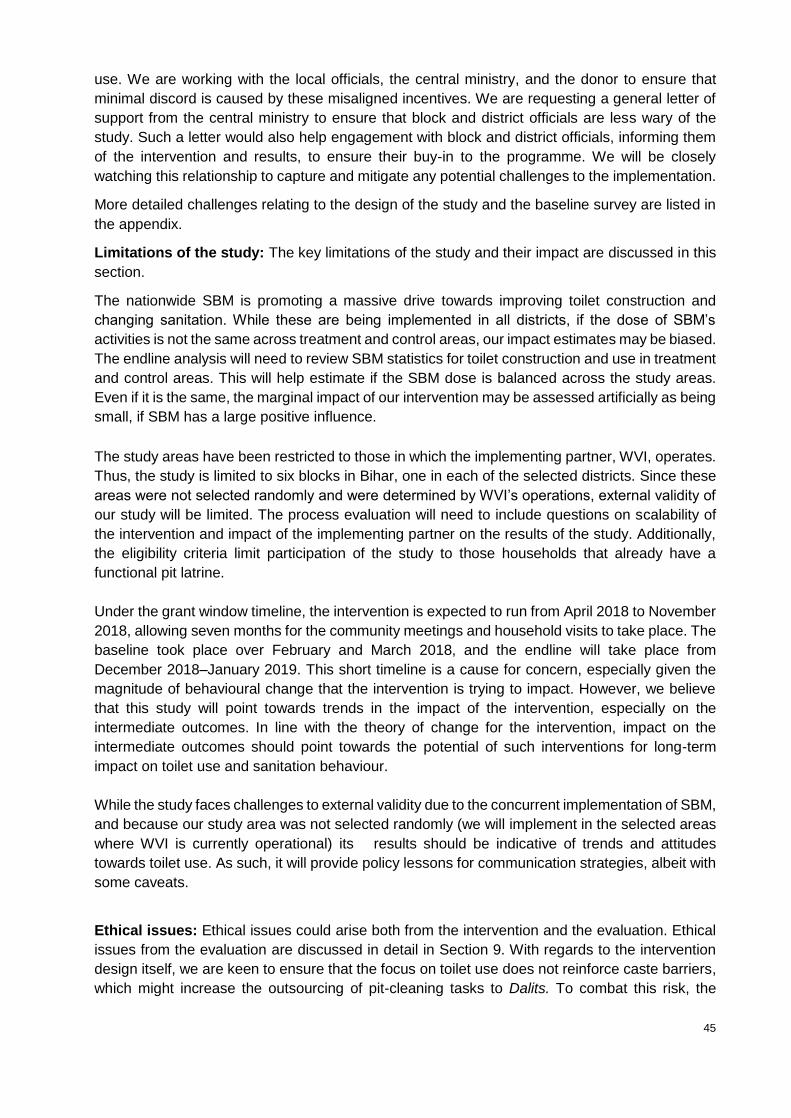
45
use. We are working with the local officials, the central ministry, and the donor to ensure that
minimal discord is caused by these misaligned incentives. We are requesting a general letter of
support from the central ministry to ensure that block and district officials are less wary of the
study. Such a letter would also help engagement with block and district officials, informing them
of the intervention and results, to ensure their buy-in to the programme. We will be closely
watching this relationship to capture and mitigate any potential challenges to the implementation.
More detailed challenges relating to the design of the study and the baseline survey are listed in
the appendix.
Limitations of the study: The key limitations of the study and their impact are discussed in this
section.
The nationwide SBM is promoting a massive drive towards improving toilet construction and
changing sanitation. While these are being implemented in all districts, if the dose of SBM’s
activities is not the same across treatment and control areas, our impact estimates may be biased.
The endline analysis will need to review SBM statistics for toilet construction and use in treatment
and control areas. This will help estimate if the SBM dose is balanced across the study areas.
Even if it is the same, the marginal impact of our intervention may be assessed artificially as being
small, if SBM has a large positive influence.
The study areas have been restricted to those in which the implementing partner, WVI, operates.
Thus, the study is limited to six blocks in Bihar, one in each of the selected districts. Since these
areas were not selected randomly and were determined by WVI’s operations, external validity of
our study will be limited. The process evaluation will need to include questions on scalability of
the intervention and impact of the implementing partner on the results of the study. Additionally,
the eligibility criteria limit participation of the study to those households that already have a
functional pit latrine.
Under the grant window timeline, the intervention is expected to run from April 2018 to November
2018, allowing seven months for the community meetings and household visits to take place. The
baseline took place over February and March 2018, and the endline will take place from
December 2018–January 2019. This short timeline is a cause for concern, especially given the
magnitude of behavioural change that the intervention is trying to impact. However, we believe
that this study will point towards trends in the impact of the intervention, especially on the
intermediate outcomes. In line with the theory of change for the intervention, impact on the
intermediate outcomes should point towards the potential of such interventions for long-term
impact on toilet use and sanitation behaviour.
While the study faces challenges to external validity due to the concurrent implementation of SBM,
and because our study area was not selected randomly (we will implement in the selected areas
where WVI is currently operational) its results should be indicative of trends and attitudes
towards toilet use. As such, it will provide policy lessons for communication strategies, albeit with
some caveats.
Ethical issues: Ethical issues could arise both from the intervention and the evaluation. Ethical
issues from the evaluation are discussed in detail in Section 9. With regards to the intervention
design itself, we are keen to ensure that the focus on toilet use does not reinforce caste barriers,
which might increase the outsourcing of pit-cleaning tasks to Dalits. To combat this risk, the

46
intervention focusses on reducing aversion to self-emptying and highlighting the ease with which
this can be achieved. At the community meetings, the ease of handling decomposted material
and the hygienic nature of the same will be emphasised. Despite these risk-mitigating measures,
it is possible that entrenched caste-based notions of purity and pit cleaning will lead to outsourcing
of pit emptying. Unless the SBM works towards creating options for pit emptying, this will continue
to be a cause for concern.
During the recently completed training of WVI facilitators who will be implementing the behaviour
change interventions, the importance of highlighting self-emptying was highlighted. The
implementation preparations are ongoing and the first community meeting will be held soon.
11. Conclusion
The persistent non-use of toilets, despite access to functional latrines, is a uniquely Indian
problem. This report has laid out the importance of improving sanitation behaviour in achieving
health outcomes, outlined the existing situation in rural Bihar, and posited on the reasons for non-
use of toilets, based on literature review and findings from the formative study. This study tests
the efficacy of simple behavioural nudges, aimed at moving habit and intent of toilet use amongst
households in rural Bihar that already have a functioning toilet. The baseline survey was carried
out to assess the baseline characteristics of the study population and validate the assumptions
and change pathways outlined in the theory of change.
Balance tests reveal that randomization of treatment has been largely successful in balancing the
background characteristics of households living in the two study arms. This is evidence by the
fact that he distribution of means of 74 out of 86 variables show no significant difference across
households living in treatment and control areas. In particular, households across the two study
arms are well balanced in terms of our main outcome variable, namely, the proportion of
households where at least one individual defecates in the open. Still, households in treatment
areas are more likely to be Hindu, to have a female head of household, and to have more children
in the household. Children in treatment areas were also less likely to suffer from diarrhoea in the
two weeks preceding the survey.
Such imbalances, despite randomisation of treatment, mean that a simple comparison of
outcomes between the treatment and control groups at endline may not provide an unbiased
measure of the impact. We will include baseline covariates that show an imbalance and will not
be affected by the intervention as controls in the model specification which will be used to assess
impact at endline.
The baseline survey finds that for all ages, men are more likely to defecate in the open compared
to women. We also find that the open defecation rates are markedly higher for women above the
age of 30 where we see a jump in the proportion of women defecating in the open. Open
defecation rates converge for men and women only for ages above 75. This finding is in line with
previous literature, and our theory of change on gendered divergence in the use of toilets.
However, the absolute rate of open defecation amongst women who have access to toilets
remains high. This shows that habit and intent formation interventions are equally relevant for
men and women within the study population.
The theory of change hypothesizes that faulty mental models around the rate of pit filling and
anxiety over pit emptying limit toilet use amongst household members.
We find that most households had not received any prior information around pit filling and
emptying. While 28% of households reported that they had received information on when their pit

47
was likely to fill up, around 60% percent of households reported that they had not received
information on what to do when their pit filled up. Thus, many households do not possess any
information on pit filling and emptying. Despite apparent lack of information, however, households
do not consistently under-estimate pit filling rates. Knowledge and perceptions around pit filling
and decomposition of faecal matter reveal that the misinformation around pit filling rates varies
on both ends of overestimating and underestimating these rates. In such a scenario, the
component of our intervention that aims to correct misinformation around rates of pit filling is likely
to be less effective in practice.
In conclusion, the baseline findings validate the theory of change and associated assumptions.
This is also aligned with findings from other studies on sanitation behaviours in India. There is
imbalance along some demographic characteristics in the study areas, and these will need to be
controlled for in the endline analysis. Additionally, these areas of imbalance will provide avenues
of enquiry in the qualitative study. There is balance across outcome variables in both treatment
and study areas.
This baseline report has given a comprehensive overview of the study design, key research
objectives, evaluation hypothesis, characteristics of the study populations, and implications of the
same for the study design.

48
Bibliography
Coffey, D. et al., 2014. Revealed preference for open defecation. Economic & Political Weekly,
Volume 49(38), p. 43.
Coffey, D. et al., 2017. Understanding open defecation in rural India: Untouchability, pollution,
and latrine pits. Economic & Political Weekly, Volume 52(1), pp. 59-66.
Geruso, M. & Spears, D., 2014. Sanitation and health externalities: Resolving the Muslim
mortality paradox. University of Texas at Austin Working Paper.
Ghosh, A., Gupta, A. & Spears, D., 2014. Are Children in West Bengal Shorter Than Children in
Bangladesh?. Economic & Political Weekly, Volume 48.
Greenland, K. et al., 2015. The epidemiology of soil-transmitted helminths in Bihar State, India.
PLoS neglected tropical diseases, Volume 9(5).
Modi, N., 2014. No Swachh Bharat without Annihilation of Caste. Economic & Political Weekly,
Volume 49(45), p. 11.
O’Connell, 2014. What Influences Open Defecation and Latrine Ownership in Rural
Households? : Findings from a Global Review, s.l.: s.n.
Spears, D., Ghosh, A. & Cumming, O., 2013. OpenDefecation and childhood stunting in India:
an ecological analysis of new data from 112 districts. PLoS One, 8(9).
Spears, D. & Lamba, S., 2015. Effects of early-life exposure to sanitation on childhood cognitive
skills: Evidence from India’s Total Sanitation Campaign.. Journal of Human Resources.
Turner, A. G., 2003. Sampling strategies : Handbook on designing of housheold sample
surveys, Geneva: United Nations Statistics Division.
UNICEF, 2012. Progress on drinking water and sanitation: 2012 update, New York: UNICEF.
Vālmīki, O., n.d. Joothan: A Dalit's Life. 2003: Columbia University Press.
Waddington, H., Snilstveit, B., White, H. & Fewtrell, L., 2009. Water, sanitation and hygiene
interventions to combat childhood diarrhoea in developing countries., New Delhi: International
Initiative for Impact Evaluation.

49
Appendix A: Theory of Change
Please note that this silo-ed version of the ToC is for visual representation purposes only. We
understand that the actual ToC will not be in silos.
Key assumptions
- KA 1: Facilitators are trained properly and deliver the programme with fidelity
- KA 2: Attendance at community meetings
- KA 3: Presence of HOUSEHOLD members during HOUSEHOLD visits
- KA 4: Increase in the intention to use (given correction of mental models) is not hampered
by other barriers to intention
- KA 5: HOUSEHOLD are committed enough to put money regularly in the lockbox and the
amount is sufficient to serve the purpose of allaying anxiety
- KA 6: HOUSEHOLD put into practice the discussion on addressing some of the barriers
to use, allowing for the developing of the habit amongst those who have the intention
- KA 7: Increase in the translation from increased intention to habitual use is not hampered
by other barriers to use

50
Appendix B: Map of treatment and control areas
Appendix C: Regressions Predicting Toilet Use
We estimate a linear regression of our indicator of individual open defecation on age groups as
categorical variables, education levels, health and disability status of individuals (whether an
individual is continuously ill or has a disability), religion, caste; our indicators of poverty (whether
the household had NREGA card and a BPL card); and whether a household is female-headed.
We also include the source of funding to construct the household latrine (whether the household
spent its own money to construct the latrine), latrine attributes, and access to piped water as
additional predictors of latrine use. The results of this simple linear probability model are
presented in Appendix Table 1. We present estimates for two models: Columns (1) and (2) in the
Table present coefficients and t-statistics for the model without ward-level fixed effects. Columns
(3) and (4) present coefficients and t-statistics for the model with ward-level fixed effects.

51
Determinants of individual adult toilet use (Dependent variable: Practicing OD (=1), No OD (=0))
(1) (2)
Without Ward FE With Ward FE
Male 0.137*** (7.22) 0.131*** (7.22)
Young 18-35 years 0.0244 (1.08) 0.0238 (1.21)
Middle 36-59 years 0.0945*** (3.51) 0.0896*** (3.58)
Elderly Above 60 years 0.0398 (0.78) 0.0415 (0.87)
Some Pre-school -0.106* (-2.43) -0.0703 (-1.79)
Some Primary Schooling -0.0321 (-0.96) -0.0168 (-0.55)
Some Secondary Schooling -0.110** (-2.68) -0.102* (-2.50)
Some Higher Secondary Schooling -0.171*** (-4.22) -0.146*** (-3.63)
College and Above -0.180** (-3.40) -0.174*** (-3.74)
Disabled 0.0314 (0.43) 0.0354 (0.48)
Continuously Ill -0.00129 (-0.03) 0.00200 (0.05)
Muslim 0.0971 (1.30) 0.0452 (0.93)
Scheduled Caste 0.0439 (0.54) 0.0871 (0.82)
Scheduled Tribe 0.146 (0.96) 0.0363 (0.28)
Other Backward Caste 0.0318 (0.50) 0.119 (1.37)
Has NREGA card 0.0951* (2.45) 0.0720* (2.26)
Has BPL card -0.0881* (-2.58) -0.0587 (-1.82)
Female-Headed Household 0.139* (2.63) 0.0892* (2.08)
Spent own money for toilet construction -0.208*** (-4.74) -0.0373 (-1.06)
Has access to piped water -0.163** (-2.72) -0.120 (-1.87)
Received monetary support from govt. for toilet -0.0776 (-1.88) -0.0429 (-0.95)
Toilet is located inside -0.0804** (-2.66) -0.0389 (-1.38)
Toilet has a door that can be locked inside -0.0693 (-1.52) -0.0429 (-1.10)
Observations 5277 5277
Notes: Standardised baseline weights are applied. Standard errors are clustered at the ward level.
t statistics in parentheses * p<0.1, ** p<0.05,*** p<0.01.

52
Appendix D: Learning Journal
Project
Activities
Progress Challenges and Solutions Lessons Learnt
Intervention
Design
Complete Repeated iterations and
discussions necessary to finalise
intervention design can delay
expected timelines.
Ideally, we would have
like to test the intervention
design more. However,
the shortened timelines of
the project have made this
difficult. It would be
important to align
expectations with the
timeline of the project.
Sampling
Frame
Ongoing Increased pace of SBM on
ground is impacting sampling
decisions. It is challenging to work
with a dynamic programme such
as SBM while staying true to
technical rigour.
Unclear on what we can
do to control this given the
nature and pace of the
programme. We are
closely monitoring
numbers and will discuss
the impact of the SBM in
the analysis.
Design of
Data
Collection
Tools
Draft Tools
Complete
Difficult to accommodate multiple
rounds of review and review
expectations with the extremely
tight timelines of the project.
Members of the team also went
for a pre-testing visit which had
inputs on the nature and testing of
questionnaires.
Repeated reviews and
comments could be
accommodated in a
longer-term project.
However, given the need
to implement and evaluate
the design with a fixed
external deadline, this has
become extremely
difficult.
Important lesson to align
expectations and
accommodate process
timelines given the
shortened timelines of the
project. Processes and
reviews that are ideal in a
long-term project may not
be feasible.
The notes from the pre-
testing visit have been
attached. Some of the
points have been

53
discussed with 3ie and
r.i.c.e. separately.
IRB
Approval
Application
and
presentation
submitted,
awaiting final
approval
Not Applicable The IRB process itself is
standard and there are no
lessons to report from
that.
However, we have only
been able to submit
provisional tools to the
IRB on account of delay in
comments and review of
the tools. This has been
extremely challenging
given the timelines of the
project.
Household
listing and
survey
Complete Household listing was proving to
be very time-intensive. Given the
pressure to complete this quickly
and start the baseline survey, we
decided on the following changes:
a) Recording of GPS co-
ordinates of every household
(which we were collecting to
develop maps delineating
treatment and control areas)
was replaced by co-ordinates
for every 5th or 10th
household.
b) Listing was undertaken in just
the selected wards in the
selected villages (earlier we
had decided to undertake
listing in all wards in the village
to allow a better
understanding of the village
context and dynamics)
Distinguishing between the
different types of toilets was not
easy (twin-soak pit; twin-pit, non-
soak cement pots/shankar; single
pit, septic tank, etc.) affecting two
aspects.
a) The listing enumerators,
based on housed questions,
had sometimes mistakenly
It is important to be
flexible and reduce the
scope of data being
collected if the time line is
less.
Identification and
classification of the
different types of toilets
are not obvious; and
adequate emphasis
needs to be laid on this
subject during training
(including adequate field
sessions).
Listing enumerators need
to be trained more
rigorously and the

54
classified households
(impacting the identification of
our eligible group—twin-soak
pits).
b) Extensive training of the
survey enumerators (using
pictures and field visits) was
required.
questions asked of
households need to be
elaborated, if the toilet
classification is to be done
just based on the
questionnaire.
Data
cleaning and
analysis
Complete During cleaning of the data
collected, we realised that the
most common option under
‘other’ for reasons why the toilet
was not used, was given as—‘lack
of access when at work in the
fields’.
To reduce the length of the
questionnaire, we used the
presence of NREGA cards or BPL
cards as a proxy for assessing the
economic status. This does not,
however, seem to provide
adequate information, and so
using a ’wealth index’ may be a
better option.
We have decided to
include this as a separate
option under reasons why
the toilet was not used in
the ‘endline’
questionnaire.
This is an issue of
importance when
designing any ODF
strategy as well.
The NSSO/NFHS
methodology using a
‘wealth index’, although
lengthy, is more robust.
We will collect this data at
endline.
Stakeholder
Engagement
Complete We tried inviting block and district
officials for our implementation
training but had a very poor
response.
We are exploring the possibility of
getting a letter of support from the
Ministry of Drinking Water and
Sanitation.
Some letter or other
evidence of support from
government is essential to
motivate involvement of
government stakeholders
at district and bock levels.
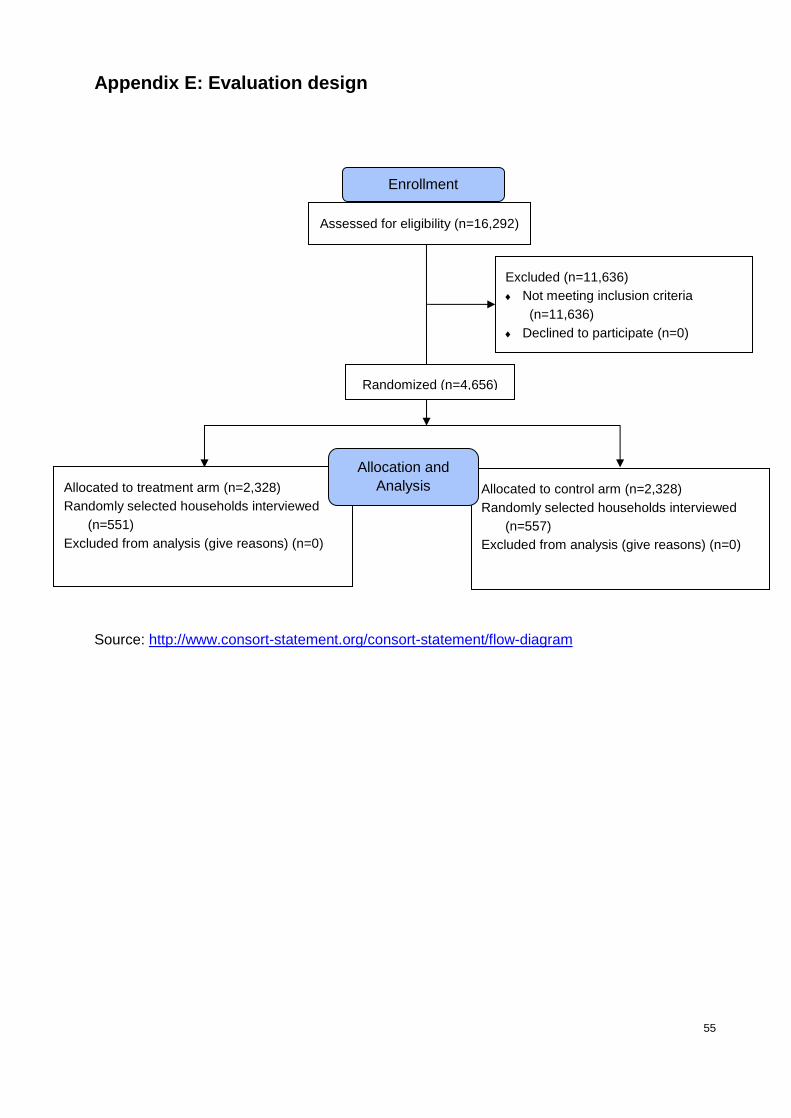
55
Appendix E: Evaluation design
Source: http://www.consort-statement.org/consort-statement/flow-diagram
Assessed for eligibility (n=16,292)
Excluded (n=11,636)
Not meeting inclusion criteria
(n=11,636)
Declined to participate (n=0)
Other reasons (n= )
Allocated to treatment arm (n=2,328)
Randomly selected households interviewed
(n=551)
Excluded from analysis (give reasons) (n=0)
Allocated to control arm (n=2,328)
Randomly selected households interviewed
(n=557)
Excluded from analysis (give reasons) (n=0)
Allocation and
Analysis
Randomized (n=4,656)
Enrollment

56
Appendix F: Balance Tests on all households listed
Appendix Table. Average Unweighted Baseline Household Characteristics (Balance Tests)
(1) (2)
Indicator Control (N=8149) Treatment (N=17223)
Mean Std. Error Mean Std. Error
Household Characteristics
Proportion of households with access to a latrine - Own 56.3 (0.55) 43.2*** (0.38)
Proportion of eligible households 29.2 (0.50) 16.5*** (0.28)
Proportion of toilet owners with a twin-pit latrine 56.5 (0.73) 44.2*** (0.58)
Notes:
* p<0.1, ** p<0.05,*** p<0.01.
p-values obtained by clustering at ward level. Standardized baseline weights utilized.

About Oxford Policy Management
Oxford Policy Management is committed to helping low- and middle- income countries
achieve growth and reduce poverty and disadvantage through public policy reform.
We seek to bring about lasting positive change using analytical and practical policy
expertise. Through our global network of offices, we work in partnership with national
decision makers to research, design, implement, and evaluate impactful public policy.
We work in all areas of social and economic policy and governance, including health,
finance, education, climate change, and public sector management. We draw on our
local and international sector experts to provide the very best evidence-based support.
Find out more
For further information
email: [email protected]
Or visit: www.opml.co.uk
OPMglobal
Oxford Policy Management Limited
Branch Office, India
Registered in India: F03731
4/6 Siri Fort Institutional Area
New Delhi 110049, India
Tel: +91 (0)11 4808 1111
Copyright © 2022 FDOKUMEN