Effects of different soil types on ammonia volatilisation from surface applied urea granules
11
Selvarajah, N., Sherlock, R.R. and Smith, N.P., Cameron, K.C. 1989. Effect of different soils on ammonia volatilisation losses from surface applied urea granules. In Nitrogen in New Zealand Agriculture and Horticulture (Eds R.E. White and L.D. Currie), Occasional Report No.3, Fertilizer and Lime Research Centre, Massey University, Palmerston North, New Zealand. pp 145-156. EFFECT or DIFFERENT SOILS ON AMMONIA VOLATILIZATION LOSSES FROM SURFACE APPLIED UREA GRANULES N.Selvarajah, R.R.Sherlock, N.P.Smith and K.C.Cameron, Department of Soil Science, Lincoln College, Canterbury, New Zealand. 1. Introduction General recognition of the seriousness of ammonia volatilization from surface applied urea has led to extensive research into the process involved (Terman, 1979; Freney et al., 1981; Haynes and Sherlock, 1986). The reported effects of various soil properties on the rate and amount of volatilization loss have however, to some extent, been contradictory. Urease activity, cation exchange capacity, soil pH and hydrogen ion buffering capacity, amongst others, have all been identified as the main soil properties which affect the loss (Freney et al., 1981). High CEC is reported to reduce the NH3 loss by adsorbing NH4 + ions onto the exchange complex and so reduce the concentration of ammonia in solution (Fenn and Kissel, 1976). High initial soil pH has been reported by many workers to lead to high NH, losses due to its influence on the NH3/NH4 + equilibria (Ernst and Massey, 1960; Ferguson et al., 1984). High urease activity increases the rate of urea hydrolysis and thus increases the solution concentration of NH3. Reynolds and Wolf (1987) recently reported that the H* ion buffering capacity of the soil was strongly related to NH j volatilization loss and attributed this to the ability of a well buffered soil to resist an increase in pH following the hydrolysis of urea. Most of these findings have however been generated from laboratory studies and this has often been criticised. Indeed, Terman (1979) emphasised that the major need in further research on NH3-N losses seems to be for field experiments in which more loss-contributing factors are quantified. The main objectives of this study were therefore: (i) to compare NH3 volatilization losses from urea broadcast onto a range of different soils under the same environmental conditions in the field; and (ii) to examine the relationships between selected soil characteristics and NH3 volatilization losses. 2. Materials and methods 2.1 Soils Undisturbed blocks of topsoil (450 cm 2 x 7 cm) were collected from five different soil types in the North Island of New Zealand: Kaharoa sand (podzolic soil) from Te Puke, Kokotau silt loam (yellow grey loam) from Wairarapa, Kairanga silt loam (recent alluvium) from
-
Upload
independent -
Category
Documents
-
view
3 -
download
0
Transcript of Effects of different soil types on ammonia volatilisation from surface applied urea granules

Selvarajah, N., Sherlock, R.R. and Smith, N.P., Cameron, K.C. 1989. Effect of different soils on ammonia volatilisation losses from surface applied urea granules. In Nitrogen in New Zealand Agriculture and Horticulture (Eds R.E. White and L.D. Currie), Occasional Report No.3, Fertilizer and Lime Research Centre, Massey University, Palmerston North, New Zealand. pp 145-156.
EFFECT or DIFFERENT SOILS ON AMMONIA VOLATILIZATION LOSSES
FROM SURFACE APPLIED UREA GRANULES
N.Selvarajah, R.R.Sherlock, N.P.Smith and K.C.Cameron, Department of Soil Science,
Lincoln College, Canterbury, New Zealand.
1. Introduction
General recognition of the seriousness of ammonia volatilization from surface applied urea has led to extensive research into the process involved (Terman, 1979; Freney et al., 1981; Haynes and Sherlock, 1986).
The reported effects of various soil properties on the rate and amount of volatilization loss have however, to some extent, been contradictory. Urease activity, cation exchange capacity, soil pH and hydrogen ion buffering capacity, amongst others, have all been identified as the main soil properties which affect the loss (Freney et al., 1981).
High CEC is reported to reduce the NH3 loss by adsorbing NH4+ ions onto the exchange
complex and so reduce the concentration of ammonia in solution (Fenn and Kissel, 1976).
High initial soil pH has been reported by many workers to lead to high NH, losses due to its influence on the NH3/NH4
+ equilibria (Ernst and Massey, 1960; Ferguson et al., 1984). High urease activity increases the rate of urea hydrolysis and thus increases the solution concentration of NH3. Reynolds and Wolf (1987) recently reported that the H* ion buffering capacity of the soil was strongly related to NH j volatilization loss and attributed this to the ability of a well buffered soil to resist an increase in pH following the hydrolysis of urea.
Most of these findings have however been generated from laboratory studies and this has often been criticised. Indeed, Terman (1979) emphasised that the major need in further research on NH3-N losses seems to be for field experiments in which more loss-contributing factors are quantified.
The main objectives of this study were therefore: (i) to compare NH3 volatilization losses from urea broadcast onto a range of different soils under the same environmental conditions in the field; and (ii) to examine the relationships between selected soil characteristics and NH3 volatilization losses.
2. Materials and methods
2.1 Soils
Undisturbed blocks of topsoil (450 cm2 x 7 cm) were collected from five different soil types in the North Island of New Zealand: Kaharoa sand (podzolic soil) from Te Puke, Kokotau silt loam (yellow grey loam) from Wairarapa, Kairanga silt loam (recent alluvium) from

Selvarajah, N., Sherlock, R.R. and Smith, N.P., Cameron, K.C. 1989. Effect of different soils on ammonia volatilisation losses from surface applied urea granules. In Nitrogen in New Zealand Agriculture and Horticulture (Eds R.E. White and L.D. Currie), Occasional Report No.3, Fertilizer and Lime Research Centre, Massey University, Palmerston North, New Zealand. pp 145-156.
Manawatu, Takapau heavy silt loam (yellow brown loam) from Hawkes Bay and Patumahoe clay loam (brown granular loam) from Pukekohe. The soil at the experimental site at Lincoln College was a Templeton silt loam (recent soil).
2.2 Soil characterisation
Before the start of the experiment subsamples (0-2 cm depth) were collected from the edge of each block of soil. These samples were air dried and passed through a 2 mm sieve. Organic carbon (OC) and total nitrogen (TN) were determined by dry combustion gas chromatography on a carbon-nitrogen analyser fitted with a thermal conductivity detector (Europa Scientific.). Urease activity was measured by the procedure of Tabatabai (1982). "Mineralisable-N" was assessed by boiling with 2M KCl (Gianello and Brenner, 1986) and by an anaerobic incubation procedure (Keeney and Brenner, 1966). Cation exchange capacity (CEC) was determined according to the procedure of Polemio and Rhoades (1977). Hydrogen ion buffering capacity was assessed by adding 10 ml of 0, 0.01, 0.02, 0.03, 0.04 and 0.05 H NaOH to 4 g of soil and measuring the pH after six days. Particle size analysis was conducted according to the procedures given by Gradwell (1972).
2.3 Soil preparation and fertilizer application
Once brought to the experimental site at Lincoln College, each block of soil was buried at ground level along with similar sized blocks from the experimental area (Templeton silt loam). The vegetation was cut and removed from each soil block and an enclosure gas sampling system was then assembled over it. Details of the system are described elsewhere (Black et al., 1985) but basically involved pushing a section of PVC pipe (23.5 cm i.d. x 10 cm) into the soil to leave a 3 cm high headspace enclosed by a transparent Perspex lid. The day before the experiment was due to start (4 Oct, 1988) each soil was irrigated with approximately 120 mm of water.
Five enclosures (replicates) of each soil type was broadcast with granulated urea (2-3 mm dia.) at the rate of 100 kg N ha1 (0.93 g urea per enclosure). Four of these enclosures were used for NH3 gas sampling and the remaining one for microsite soil pH measurement. The location of each urea granule in the last enclosure was marked with a small flag to enable accurate soil sampling for pH.
Six other enclosures (one from each soil type) were used to measure urea hydrolysis rates in the field. Two weeks before the experiment began fifteen 5 cm sections of aluminium tube (4.75 cm i.d.) were pressed into the soil within each enclosure. At the commencement of the experiment urea granules were broadcast at the rate of 100 kg N ha1 (about 0.062 g of accurately weighed urea per tube) onto the soil within the tubes. Four additional enclosures containing Templeton soil did not receive urea and were used as controls to monitor background NH3 emissions. All the enclosures were scaled with clear Perspex covers and aspirated at the rate of 21 l min-1 (which allowed approximately 16 volume changes per minute at the chamber height of 3 cm). The gas aspirated from the control and treatment enclosures was sent through a gas collection system.
Selvarajah, N., Sherlock, R.R. and Smith, N.P., Cameron, K.C. 1989. Effect of different soils on ammonia volatilisation losses from surface applied urea granules. In Nitrogen in New Zealand Agriculture and Horticulture (Eds R.E. White and L.D. Currie), Occasional Report No.3, Fertilizer and Lime Research Centre, Massey University, Palmerston North, New Zealand. pp 145-156.
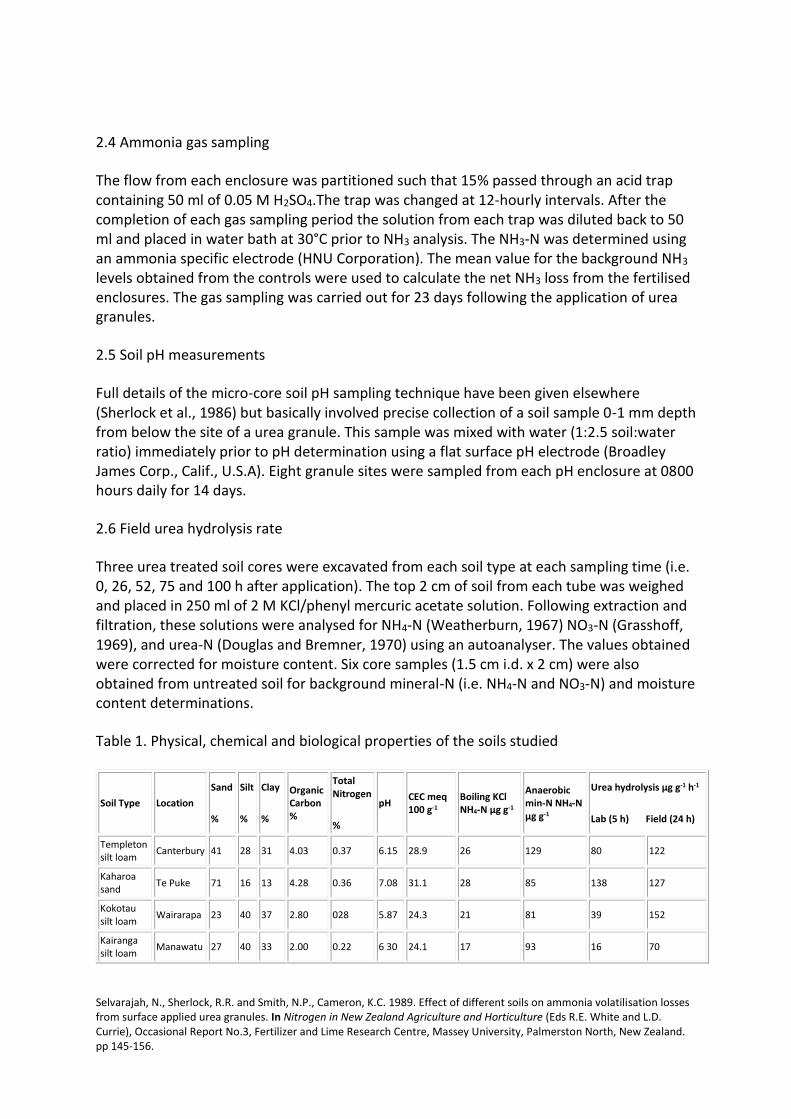
2.4 Ammonia gas sampling
The flow from each enclosure was partitioned such that 15% passed through an acid trap containing 50 ml of 0.05 M H2SO4.The trap was changed at 12-hourly intervals. After the completion of each gas sampling period the solution from each trap was diluted back to 50 ml and placed in water bath at 30°C prior to NH3 analysis. The NH3-N was determined using an ammonia specific electrode (HNU Corporation). The mean value for the background NH3 levels obtained from the controls were used to calculate the net NH3 loss from the fertilised enclosures. The gas sampling was carried out for 23 days following the application of urea granules.
2.5 Soil pH measurements
Full details of the micro-core soil pH sampling technique have been given elsewhere (Sherlock et al., 1986) but basically involved precise collection of a soil sample 0-1 mm depth from below the site of a urea granule. This sample was mixed with water (1:2.5 soil:water ratio) immediately prior to pH determination using a flat surface pH electrode (Broadley James Corp., Calif., U.S.A). Eight granule sites were sampled from each pH enclosure at 0800 hours daily for 14 days.
2.6 Field urea hydrolysis rate
Three urea treated soil cores were excavated from each soil type at each sampling time (i.e. 0, 26, 52, 75 and 100 h after application). The top 2 cm of soil from each tube was weighed and placed in 250 ml of 2 M KCl/phenyl mercuric acetate solution. Following extraction and filtration, these solutions were analysed for NH4-N (Weatherburn, 1967) NO3-N (Grasshoff, 1969), and urea-N (Douglas and Bremner, 1970) using an autoanalyser. The values obtained were corrected for moisture content. Six core samples (1.5 cm i.d. x 2 cm) were also obtained from untreated soil for background mineral-N (i.e. NH4-N and NO3-N) and moisture content determinations.
Table 1. Physical, chemical and biological properties of the soils studied
Soil Type Location
Sand
%
Silt
%
Clay
%
Organic Carbon %
Total Nitrogen
%
pH CEC meq 100 g-1
Boiling KCl NH4-N µg g-1
Anaerobic min-N NH4-N µg g-1
Urea hydrolysis µg g-1 h-1
Lab (5 h) Field (24 h)
Templeton silt loam Canterbury 41 28 31 4.03 0.37 6.15 28.9 26 129 80 122
Kaharoa sand Te Puke 71 16 13 4.28 0.36 7.08 31.1 28 85 138 127
Kokotau silt loam Wairarapa 23 40 37 2.80 028 5.87 24.3 21 81 39 152
Kairanga silt loam Manawatu 27 40 33 2.00 0.22 6 30 24.1 17 93 16 70

Selvarajah, N., Sherlock, R.R. and Smith, N.P., Cameron, K.C. 1989. Effect of different soils on ammonia volatilisation losses from surface applied urea granules. In Nitrogen in New Zealand Agriculture and Horticulture (Eds R.E. White and L.D. Currie), Occasional Report No.3, Fertilizer and Lime Research Centre, Massey University, Palmerston North, New Zealand. pp 145-156.
Takapau heavy silt loam
Hawkes Bay 34 57 9 7.31 0.69 5.79 42.2 45 186 108 71
Patumahoe clay loam Pukekohe 22 39 39 4.47 0.42 5 37 28.7 29 81 45 62
Table 2. Cumulative NH3 loss (%) of applied N for 23 days following the application of urea granules
Soil type Days following the application of urea granules
1 2 3 4 5 6 7 8 11 15 23
Templeton silt loam 8.3 28.0 33.7 36 4 38 2 39 5 40.3 40.8 41.9 43.1 44.3 Kaharoa sand 4.6 25 8 36.6 40.7 43.5 45.2 46 5 47.3 49.1 50.1 53.0 Kokotau silt loam 3.2 15.5 22.3 25.4 27.7 29.1 30.0 30.6 31.8 32.8 33.9 Kairanga silt loam 1.6 9.9 18.8 23.7 27.3 29.3 30.7 31.6 33 4 34.6 35.7 Takapau heavy silt loam 1.2 8 0 13.4 16.3 18.9 20.7 22.0 22.8 24.9 26.8 29.1 Patumahoe clay loam 0.1 0.7 1.5 2.2 3.1 3 8 4.4 4.8 6.0 7.2 8 5
2.7 Soil temperature
Thermister probes (model 107, Campbell Scientific, Inc.) were inserted at approximately 2 mm soil depth in selected enclosures and soil temperatures recorded continuously on a 21X micrologger (Campbell Scientific Inc.).
3. Results and discussion
3.1 Soil characteristics
The six soils showed a wide range of physical, chemical and biological properties (Table 1). The Takapau heavy silt loam from Hawkes Bay had the highest OC (7.31%), TN (0.69%), CEC (42.2 meq 100 g1) and aerobically mineralisable N (186 NH4-N µg g-1). The Patumahoe clay loam soil from Pukekohe had the lowest pH (5.37) and the Kaharoa sand from Te Puke had the highest soil pH (7.08). The Kaharoa soil also had the highest sand content (71%) and highest urease activity.
3.2 Ammonia volatilization losses
Cumulative amounts of NH3 volatilization loss from each soil are presented in Table 2. The Kaharoa sand lost 53.0% of the surface applied N whilst the Patumahoe clay loam only lost 8.5%. Both the Kokotau and Kairanga silt loams lost similar amounts of NH3 (33.9 and 35.7%, respectively). The Templeton soil lost 44.3%, which is higher than in all previous studies conducted on this soil (Sherlock et al., 1986; Black et al., 1987). This higher loss may be due, in part, to the higher soil temperatures and shorter plant heights in this present study.

Selvarajah, N., Sherlock, R.R. and Smith, N.P., Cameron, K.C. 1989. Effect of different soils on ammonia volatilisation losses from surface applied urea granules. In Nitrogen in New Zealand Agriculture and Horticulture (Eds R.E. White and L.D. Currie), Occasional Report No.3, Fertilizer and Lime Research Centre, Massey University, Palmerston North, New Zealand. pp 145-156.
The NH3 loss patterns (Figure 1) show that apart from the Patumahoe soil, the peak loss rates occurred between 36 and 72 hours following urea application. And for all the soils except the Patumahoe, the majority of the volatilization loss occurred within 100 hours of fertiliser application. The overall pattern of NH3 loss for most soils is similar to that reported in previous studies on the Templeton soil (e.g. Black et al., 1985; Black et al., 1987).
3.3 Changes in soil pH
Changes in soil pH following urea application are shown in Figure 2. Except for the Patumahoe soil, all the soils reached a pH equal to or greater than 8.5 within 24 hours. The Patumahoe soil, however, remained well below pH 8.5 over the entire experimental period.
In general it appears that the rate of NH3 loss (Figure 1) is related to the change in soil pH (Figure 2). This type of relationship is well established (Rachhpal-Singh and Nye, 1984) and soil pH has been used to calculate NH3 volatilization losses for individual soil types (Sherlock et al., 1986). However, from the range of volatilization losses measured to occur at the same pH in the different soils used in this study, soil pH alone may not be a universal predictor of volatilization loss.

Selvarajah, N., Sherlock, R.R. and Smith, N.P., Cameron, K.C. 1989. Effect of different soils on ammonia volatilisation losses from surface applied urea granules. In Nitrogen in New Zealand Agriculture and Horticulture (Eds R.E. White and L.D. Currie), Occasional Report No.3, Fertilizer and Lime Research Centre, Massey University, Palmerston North, New Zealand. pp 145-156.
3.4 Net changes in urea-N, NH4-N, N03-N and soil moisture around the granule site
Figures 3 and 4 show the rate at which the applied urea was hydrolysed and the subsequent build-up of NH4-N in the soil. All the soils except the Patumahoe clay loam, hydrolysed about 60-85% of the applied urea within 52 hours (Figure 3). During the following 48 hours until the final sampling at 100 hours, further hydrolysis in all treatments was very slow. For all the soils studied, N03-N values did not change significantly over the sampling period. It is suspected that the conditions which prevailed over the sampling period (100 hours), such as very high localised concentrations of NH3 and NH4-N, rapid soil drying and high soil surface temperatures, restricted nitrification.
The soil drying rate was very pronounced during the first day of the experimental period. The Kaharoa, Takapau and Patumahoe soils rapidly lost 0.15 g g-1 d-1 soil moisture, whilst Templeton, Kairanga and Kokotau silt loams lost 0.09, 0.05 and 0.06 g g-1 d-1 respectively. It is apparent that the rapid moisture loss affected the urea hydrolysis rate in the Patumahoe and Takapau soils after 26 and 52 hours respectively {Figure 3). The Kaharoa sand, however, retained twice as much moisture (0.13 g g-1 from 52 to 100 hours) as the above soils, despite the initial rapid moisture loss. Thus, the urea hydrolysis rate in the Kaharoa soil was not considered to have been affected by a high initial loss of moisture.

Selvarajah, N., Sherlock, R.R. and Smith, N.P., Cameron, K.C. 1989. Effect of different soils on ammonia volatilisation losses from surface applied urea granules. In Nitrogen in New Zealand Agriculture and Horticulture (Eds R.E. White and L.D. Currie), Occasional Report No.3, Fertilizer and Lime Research Centre, Massey University, Palmerston North, New Zealand. pp 145-156.
In a laboratory trial, Reynolds and Wolf (1987) found that drying before urea hydrolysis was complete resulted in reduced NH3 volatilization while drying after hydrolysis was complete resulted in NH3 losses similar to those from non-drying soils. Similar work done by Ferguson and Kissel (1986) showed that rapid soil drying inhibited urea hydrolysis. Our visual observations indicated that urea granules disappeared most rapidly in the Patumahoe soil and the surface soil appeared dry within 24 hours. Rapid moisture loss clearly limited urea hydrolysis and hence the potential for NH3 loss from the Takapau and Patumahoe soils during the early stages of the experiment. It may be more appropriate, therefore, to compare the cumulative losses sustained by each soil as a proportion of the applied urea-N which actually hydrolysed. During the period for which soil mineral-N data were obtained (100 hours), the Patumahoe soil volatilized only 8.1% of the urea-N which hydrolysed; the Takapau volatilized 27.2% and the other soils sustained losses of 27.2-46.8%.
As mentioned previously, the exceptionally high air and soil temperatures experienced during this experiment led to much greater losses than in all the previous work at this site (Black et al., 1985). Temperature affects NH3 losses by directly influencing the NH3/NH4
+ soil solution equilibrium (Sherlock and Goh, 1983) and in more subtle ways. Ernst and Massey (1960) suspected that during the rapid soil drying period mass flow of soil solution may result in surface transportation of hydrolysed NH4-N and subsequent loss of NH3 through evaporation and volatilization. Despite such adverse conditions, the Patumahoe soil retained over 90% of the ammoniacal-N generated during this period of rapid drying.

Selvarajah, N., Sherlock, R.R. and Smith, N.P., Cameron, K.C. 1989. Effect of different soils on ammonia volatilisation losses from surface applied urea granules. In Nitrogen in New Zealand Agriculture and Horticulture (Eds R.E. White and L.D. Currie), Occasional Report No.3, Fertilizer and Lime Research Centre, Massey University, Palmerston North, New Zealand. pp 145-156.
3.5 Hydrogen ion buffering capacity
A buffering capacity study conducted by Ferguson et al., (1984) indicated that the amount of H+ buffering capacity between a soil's initial pH and a pH around 7.5 was related to the potential loss of NH3 from surface applied urea. Our study used a pH of 7 instead of 7.5 as reported by Ferguson et al., (1984).The H+ buffering capacity values obtained for the Templeton, Kaharoa, Kokotau, Kairanga, Takapau and Patumahoe soils were 21, 0, 25, 20, 50 and 77 mmols [OH] kg-1 soil respectively (Figure 5).

Selvarajah, N., Sherlock, R.R. and Smith, N.P., Cameron, K.C. 1989. Effect of different soils on ammonia volatilisation losses from surface applied urea granules. In Nitrogen in New Zealand Agriculture and Horticulture (Eds R.E. White and L.D. Currie), Occasional Report No.3, Fertilizer and Lime Research Centre, Massey University, Palmerston North, New Zealand. pp 145-156.
3.6 Relationship between total NH3 losses and soil characteristics
Correlation coefficient tests conducted between the total amount of NH3 loss for the 23 day period and individual soil characteristics showed only that the initial soil pH (r=0.90) and H+ buffering capacity values (r=-0.97) were significantly related. It has already been demonstrated that the initial soil pH values appear to have a linear relationship with the loss of NH3 from surface applied urea (Ernst and Massey, 1960). Our study showed that the soil with the highest initial pH (7.08) lost the highest amount of NH3 whilst the soil with a lowest initial pH value 5.37 volatilized the lowest amount of NH3 (Tables 1 and 2). Reynolds and Wolf (1987), however, reported that soils with low initial pH values can sustain high NH3 losses if they have a low H+ buffering capacity.
The strong negative relationship obtained between the total amount of NH3 loss and H+ buffering capacity is much higher than Reynolds and Wolf's (1987) reported r value (-0.80) obtained for seven soils studied under laboratory conditions. Since the relationship is established using the field NH3 volatilization loss values in the present investigation, our r value is believed to be more reliable than that estimated in the laboratory. Interestingly, when a correlation coefficient test was performed between the pH values obtained at different OH- concentrations (Figure 5) and total amount of NH3 loss, pH values obtained at 25 mmols [OH-] kg-1 soil gave a similar but positive relationship (r=0.97).
Recently, an experiment conducted by Izaurralde et al., (1987) to estimate the NH3 retention in soils showed that the titratable acidity to pH 9 measured with NH4OH was a

Selvarajah, N., Sherlock, R.R. and Smith, N.P., Cameron, K.C. 1989. Effect of different soils on ammonia volatilisation losses from surface applied urea granules. In Nitrogen in New Zealand Agriculture and Horticulture (Eds R.E. White and L.D. Currie), Occasional Report No.3, Fertilizer and Lime Research Centre, Massey University, Palmerston North, New Zealand. pp 145-156.
much better predictor than the soil CEC of the NH3 retained. They explained that the CEC of a soil was a poor predictor because many cation exchange sites do not participate in a soil's capacity to adsorb NH3. Thus the NH3 retention capacity of a soil together with a measure of buffering capacity may prove to be valuable tools to calculate potential losses of NH3 in the field. Work in this area is continuing.
4. Conclusions
The study showed that under the environmental conditions at which our experiment was performed, soils with low initial pH and high H+ buffering capacity volatilized relatively smaller quantities of NH3 from broadcast urea. Although incomplete urea hydrolysis due to rapid soil drying seemed to have caused the reduction in NH3 loss in the Patumahoe soil, a high proportion of hydrolysed urea -N retained in this soil suggests that buffering capacity may have predominantly influenced such low loss. Most of the soil properties which have been reported to influence the NH3 volatilization losses such as CEC, urease activity, clay content, OC and TN may be considered as minor factors under the adverse environmental conditions during which our experiment was conducted.
References
Black, A.S., Sherlock, R.R., Cameron, K.C., Smith, N.P., and Goh, K.M. 1985. Comparison of three field methods for measuring ammonia volatilization from urea granules broadcast onto pasture. J. Soil Sci., 36, 271-280.
Black, A.S., Sherlock, R.R., and Smith, N.P. 1987. Effect of urea granule size on ammonia volatilization from surface-applied urea. Fert. Res., 11, 87-96.
Douglas, L.A., and Bremner, J.M. 1970. Extraction of colorimetric determination of urea in soils. Soil Sci. Soc. Am. Proc., 34, 859-862.
Ernst, J.W., and Massey, H.F. 1960. The effects of several factors on volatilization of ammonia formed from urea in the soil. Soil Sci. Soc. Am. Proc., 24, 87-90.
Fenn, L.B., and Kissel, D.E. 1976. The influence of cation exchange capacity and depth of incorporation on ammonia volatilization from ammonium compounds applied to calcarious soils. Soil Sci. Soc. Am. J., 40, 394-398.
Ferguson, R.B., Kissel, D.E., Koelliker, J.K., and Bassel, W. 1984. Ammonia volatilization from surface applied urea: Effect of hydrogen ion buffering capacity. Soil Sci. Soc. Am. J., 48, 578-582.
Ferguson, R.B., and Kissel, D.E. 1986. Effects of soil drying on ammonia volatilization from surface-applied urea. Soil Sci. Soc. Am. J., 50, 485-490.
Freney, J.R., Simpson, J.R., and Denmead, O.T. 1981. Ammonia volatilization. In Terrestrial Nitrogen Cycles (F.E. Clark and t. Rosswal1, eds.). Ecol. Bull.(Stockholm), 33, 291-302.
Selvarajah, N., Sherlock, R.R. and Smith, N.P., Cameron, K.C. 1989. Effect of different soils on ammonia volatilisation losses from surface applied urea granules. In Nitrogen in New Zealand Agriculture and Horticulture (Eds R.E. White and L.D. Currie), Occasional Report No.3, Fertilizer and Lime Research Centre, Massey University, Palmerston North, New Zealand. pp 145-156.
Gionello, C., and Bremner, J.M. 1986. Comparison of methods assessing potentially available organic N in soil. Commun. Soil Sci. Plant Anal., 17, 215-236.
Gradwell, M.W. 1972. Mehtods for Physical Analysis of Soil. N.Z. Soil Bureau Scientific Report, 10C, DSIR, Wellington.
Grasshoff, K. 1969. A simultaneous multiple channel system for nutrient analysis in sea water with analog and digital data record. Adv. Automated Anal., Technicon International Congress, 2, 133-145.
Haynes, R.J., and Sherlock, R.R. 1986. Gaseous losses of nitrogen. In Mineral Nitrogen in the Plant-Soil System. R.J. Haynes, K.C. Cameron, K.M. Goh and R.R. Sherlock, pp 242-302. Academic Press, Orlando.
Izaurralde, R.C., Kissel, D.E., and Cabrera, M.L. 1987. Titratable acidity to estimate ammonia retention. Soil Sci. Soc. Am. J., 51, 1050-1054.
Keeney, D.R., and Bremner, J.M. 1966. Comparison and evaluation of laboratory methods of obtaining an index of soil nitrogen avilability. Agron. J., 58, 498-503.
Polemio, M., and Rhoades, J.D.1977.Determining cation exchange capacity: A new procedure for calcarious and gypsiferous soils. Soil Sci. Soc. Am. J., 41, 524-528.
Rachhpa1-Singh and Nye, P.H. 1984. Diffusion of urea, ammonium and soil alkalinity from surface applied urea. J. Soil Sci., 35, 529-538.
Reynolds, C.M., and Wolf, D.C. 1987. Effect of soil moisture and air relative humidity on ammonia volatilization from surface applied urea. Soil Sci., 143, 144-152.
Sherlock, R.R., and Goh, K.M. 1983. A simple mathematical model simulating ammonia volatilization losses in the field. Proc. Agron. Soc. N.Z., 13, 23-27.
Sherlock, R.R., Black, A.S., and Smith, N.P. 1986. The relationship of micro-environment soil pH to ammonia volatilization from broadcast urea granules. Proceedings of Symposium on Nitrogen Cycling in Agricultural Soils of Temperate Australia.
Tabatabai, M.A. 1982. Soil enzymes. In Methods of Soil Analysis (A.L. Page, R.H. Miller, and D.R. Keeney (eds.). Agronomy, 9, 903-948.
Terman, G.L. 1979. Volatilization losses of nitrogen as ammonia from surface applied fertilizers, organic amendments, and crop residues. Adv. Agron., 31, 189-223.
Weatherburn, M.W. 1967. Phenol hypochlorite reaction for determination of ammonia. Anal. Chem., 39, 971-974.