Coupling of engine exhaust and fuel cell exhaust with vapour ...
Upload
independentCategory
view
2download
0
Aerosol Science 36 (2005) 1251–1276www.elsevier.com/locate/jaerosci
Effects of current engine strategies on the exhaust aerosol particlesize distribution from a Heavy-Duty Diesel Engine
J.M. Desantes∗, V. Bermúdez, J.M. García, E. Fuentes
CMT Department of Thermal Machines and Engines, Valencia Polytechnic University, Camino de Vera, s/n,46022 Valencia, Spain
Received 27 October 2004; received in revised form 24 January 2005; accepted 24 January 2005
Abstract
The influence of injection pressure (IP), start of injection (SOI) and exhaust gas recirculation (EGR) on theaerosol exhaust particle size distribution emitted by a state-of-the-art Heavy Duty Diesel engine was experimentallyinvestigated.
Increasing IP was found to reduce the accumulation mode particle number and favour the formation of nucleimode particles. The application of EGR produced the suppression of the nucleation mode and an increase in theaccumulation mode particle number. Advanced SOI reduced slightly the accumulation mode without variation ofthe count median diameter (CMD). The impact of the engine parameters on the size classes of the distributions andthe sensitivity to progressive variations of the factors were examined.
A correlation study showed that there is a relationship between the particle number and the CMD of the sizedistributions obtained at equal engine operating conditions, independently of the engine strategy applied.� 2005 Elsevier Ltd. All rights reserved.
Keywords:Diesel exhaust aerosol; Particle size distribution; Nanoparticles; Soot
1. Background
The abundance of investigations on engine particulate emission characteristics is symptomatic of theincreasing interest in this topic by the scientific community, as a consequence of the recent epidemiologicaland toxicological investigations suggesting a relationship between particulate matter exposure and adverse
∗ Corresponding author. Tel.: +34 963 877 650; fax: +34 963 877 659.E-mail address:[email protected](J.M. Desantes).
0021-8502/$ - see front matter� 2005 Elsevier Ltd. All rights reserved.doi:10.1016/j.jaerosci.2005.01.002
1252 J.M. Desantes et al. / Aerosol Science 36 (2005) 1251–1276
health effects (Pope et al., 1995; Katsouyanni, Zmirou, & Spix, 1996; McAughey, 1997; Spix et al., 1998;Kim, Jaques, Chang, & Sioutas, 2001; Li et al., 2002; Li, Hao, Phalen, Hinds, & Nel, 2003).
Current knowledge on the harmful effects of exposure to Diesel particles is not advanced enough toclarify the danger that implies the inhalation of particles of different size and composition. Some researchworks have been conducted in order to determine the relative toxicity of coarse, fine and ultrafine particles(Li et al., 2003) by collecting highly concentrated ambient particles of various sizes to study their chemicalcomposition and biological potency (Kim et al., 2001; Li et al., 2002). According to these authors, thedifferent biological potency of unequal size particles is justified by the location where the particles aredeposited on the cells due to their sizes. In addition, these researchers consider that both particle size andchemical composition are important in terms of biological effects.Li et al. (2002)showed that the sizeand the chemical constituents of particles seem to be related. For instance, ultrafine particles were foundto contain significantly more organic carbon and PAHs than coarse or fine particles. Various researcherssupport that particle size is closely associated with lung injury since the finer the particle, the higherthe inflammation produced (Oberdörster, Ferin, & Lehnert, 1994a; Oberdörster, Gelein, Ferin, & Weiss,1994b; Oberdörster & Utell, 2002).
Currently, the regulations for automotive particle emissions are based solely on the gravimetric deter-mination of the specific particle mass emission, while the established air quality standards are based onthe determination of the particle mass per unit volume. Neither of these limitations make any allusion torestrictions in terms of the size or number concentration of the particles emitted. A new measurement sys-tem including particle size limitation is being evaluated in the European Particle Measurement Program(PMP), to replace and/or complement the existing gravimetric method in the current legislation.
1.1. Diesel aerosol
The Diesel aerosol is mainly composed of highly agglomerated solid carbonaceous material and ash,volatile organic and sulphur compounds (Kittelson, 1998a).As a result of the fuel pyrolisis during the com-bustion process, solid carbonaceous material is formed as primary soot particles of sizes from 20 to 50 nmfrom unburned hydrocarbons in locally fuel rich regions inside the engine cylinder (Heywood, 1988). Theprimary particles collide with each other, so that soot aggregates are formed from primary–primary par-ticle collisions and they grow by cluster–primary particle and cluster–cluster collisions. Simultaneously,a fraction of the carbon matter is oxidized by oxidant compounds existing in the flame, mainly O2 andOH radicals. The resulting carbonaceous compounds from this formation-oxidation balance constitutethe solid carbon agglomerates which are found in the exhaust aerosol as the carbonaceous core of theparticles.
The organic soluble fraction of the particles (SOF) is formed from the gaseous hydrocarbons comingfrom the atomized and evaporated lube oil and fuel that have not been oxidized inside the engine. Duringdilution and cooling of the exhaust flow, some of the gaseous hydrocarbons and sulphates undergo gas-to-particle conversion processes such as nucleation, to form new particles, and adsorption/condensationonto the surface of the existing carbonaceous particles. According to this, the controlling factors of allthe dynamic processes related to dilution affect the final physical and chemical properties of the exhaustaerosol.
Fig. 1shows the typical particle size distribution of Diesel aerosols (Kittelson, 1998a). The distributionis trimodal and log-normal in form. The so-called nuclei mode is mainly made up of organic matterand sulphur compounds. It consists of volatile particles that have been formed by nucleation, and may

J.M. Desantes et al. / Aerosol Science 36 (2005) 1251–1276 1253
Nor
mal
ized
Siz
e D
istr
ibut
ion
dC/d
log
(Dp)
Particle Diameter (µm)0.01 0.1 1 10
Mass weighting
Number weighting
Accumulation mode: carbonaceous particles
and adsorbed hydrocarbon/sulphate
matter
Nuclei mode: nucleated hydrocarbon/
sulphate particles
Alveolar deposition fraction
Coarse mode: reentrained
carbonaceous particles
Fig. 1. Typical Diesel aerosol size distribution (adapted fromKittelson et al., 1998b).
also contain some solid carbon and metal compounds. The nuclei mode is made up of particles withdiameter ranging from 0.005 to 0.05�m and contains the largest number of particles of the exhaust aerosol(more than 90%) but a small amount of its mass (1–20%). The accumulation mode is mainly associatedwith carbonaceous agglomerates and the volatile matter adsorbed on their surface. The diameter of theaccumulation mode particles ranges from 0.05 to 1.0�m with low number of particles in comparison withthe nuclei mode but with most of the total particulate mass. A third coarse mode exists which consistsof particles deposited on the engine cylinder and exhaust system walls and later reentrained. The coarsemode contains particles larger than 1�m in diameter and it comprises 5–20% of the total particle mass.
1.2. In-cylinder emission control strategies
It is well known that Diesel gaseous and particle mass emissions have been reduced progressively overthe last twenty years in response to the restrictive emission legislation and due to the application of newtechnologies.
In-cylinder emission control strategies, such as modifications of injection pressure and injection timingand the application of exhaust gas recirculation, have been used by researchers in order to reduce exhaustemissions and to comply with the legislation standards.
Exhaust gas recirculation (EGR) consists in the recirculation of part of the exhaust gases into the intakemanifold of the engine with the purpose of reducing NOx emissions. When temperatures above 1300◦Care reached in the engine cylinder, oxygen and nitrogen of the air react to form nitrogen oxides. EGRintroduces a portion of the exhaust gas back into the intake manifold, so that it mixes with the fuel andintake air. The added mass of inert products in the cylinder increases the heat capacity of the mixture andthus the combustion process takes place at lower peak temperatures. In addition, a reduction in the oxygenconcentration at the flame region reduces the flame temperature. These lower temperatures prevent thereaction between O2 and N2 to form nitrogen oxides (Ladommatos, Balian, Horrocks, & Cooper, 1996a).On the other hand, the application of EGR favours the formation of soot particles. Due to the reductionin oxygen concentration in the engine cylinder as a result of the recirculation of combustion products

1254 J.M. Desantes et al. / Aerosol Science 36 (2005) 1251–1276
and to the lower peak temperatures, the oxidation of the soot particles is reduced. As a consequence, theamount of soot particles found in the exhaust is increased when EGR is applied (Ladommatos, Balian,Horrocks, & Cooper, 1996b).
Due to the fact that the combustion is closely coupled to the injection process, injection timing andinjection pressure are relevant for DI diesel combustion and emissions formation. Fuel injection controlgreatly increases engine efficiency by injecting precise amounts of fuel in well-atomized form just asit is needed. When injection pressure is increased, the flame lift-off, i.e., the distance from the injectornozzle to the starting combustion region, grows. This in turn increases the amount of air entrained intothe spray before the fuel reaches flame zones and, as a result, the fuel is better mixed with the surroundingair. Higher fuel-air mixing rates lead to leaner conditions upstream of the reaction zone and higher heat-release rates and peak temperatures are reached as a result of the combustion process (Pickett & Siebers,2004). The leaner fuel conditions reduce the amount of unburned hydrocarbons from the fuel, and thus alower amount of soot is produced. In addition, the soot is better oxidized at these conditions due to thehigher peak temperatures, which favour the soot oxidation process.
Generally speaking, advancing injection timing lowers soot emissions and increases NOx emissions.This is due to the higher peak temperatures and longer residence time before expansion cooling freezesboth NOx formation and soot oxidation. However, the trends of particulate emissions with the changeof the injection timing vary significantly between different types and designs of Diesel engine(Heywood, 1988).
Along with the fuel injection strategies described above, multiple or split injection is becoming veryimportant in the reduction of emissions in modern engines. Splitting the injection sequence into two eventsis used to shorten ignition delay and the quantity of premixed burn. Nowadays split injection is beinginvestigated as a means to help control emissions in conjunction with high injection pressures (Nehmer& Reitz, 1994).
Despite the fact that gaseous emissions and particle mass from Diesel engines have been reducedprogressively by the adequate application of engine modifications, there is increasing concern regardingwhether current engine modifications applied to improve combustion and reduce emissions are increasingthe number and/or reducing the size of the emitted particles. This concern arises from experimental studiesin which an increase of the particle number has been observed in new diesel engines (Bagley, Baumgard,Gratz, Johnson, & Leddy, 1996; Baumgard & Johnson, 1996). As a result, several investigations on theeffect of some engine strategies on particle size distributions have been published (Baumgard & Johnson,1996; Kreso, Johnson, Gratz, Bagley, & Leddy, 1998; Pagán, 1999; Bertola et al., 2001).
Various hypotheses have been formulated to explain the increased particle numbers that were observedin certain studies carried out with new diesel engines. It is believed that increased number emissionsresult as a twofold consequence of high concentration of volatile nanoparticle precursors (HC, SO2−
4 )and decreased mass of accumulation mode particles. Fuel sulphur content is thought to be a causefor the production of nuclei mode precursors. On that basis several reports on the influence of fuelspecification on the number, mass and size of particles emitted by diesel engines have been published(Andersson, Wedekind, Hall, Stradling, & Wilson, 2001; Wedekind et al., 2000, Ristovski & Morawska,2002; Kittelson & Watts, 2002). In these works, a highest nanoparticle emission was measured withthe highest sulphur content fuels. Although the sulphur content has been shown to be a relevant factoraffecting the nucleation process, the modifications in the accumulation mode particle number produced bythe application of modern engine strategies may be also influencing the formation of nuclei mode particles.The accumulation mode particles are considered to act as “sponges” for condensation or adsorption of

J.M. Desantes et al. / Aerosol Science 36 (2005) 1251–1276 1255
volatile materials (Kittelson, Watts, & Arnold, 1998b). If the number of accumulation mode particles isreduced extremely, there would not be enough surface available for volatiles adsorption, and the highconcentration of gaseous volatiles would lead to the formation of a nuclei mode.
This paper reports a comprehensive characterization of the effect of injection strategies and exhaustgas recirculation on the size distribution of the exhaust aerosol emitted by a state-of-the art Heavy DutyDiesel engine at various steady-state engine operation conditions. Along with the analysis of the effect ofthe parameters on the particle size distributions, the sensitivities to engine modifications of the differentparticle size classes composing the size measurement region were evaluated.
The results obtained here strongly supports the hypothesis that a low accumulation mode, producedas a result of certain engine operating conditions and from the application of some engine strategies(e.g. high injection pressures), can promote the formation of a nuclei mode. Conversely, the applica-tion of strategies which strongly increase the accumulation mode particle number (e.g. EGR) suppressthe formation of the nuclei mode. Furthermore, a correlation study between the particle size distri-bution characteristics showed that a stratified relationship exists between the accumulation mode par-ticle number and the CMD of the distributions for each engine operating conditions, independentlyof the engine strategy applied. Correlations between particle number and particle mass measurementsshowed that the same particle mass can be associated with particle emissions of different character-istics of size and number. This finding indicates that the current criterion in legislation procedure,which is based on a gravimetric method, may not be an adequate metric for characterizingparticle emissions.
2. Experimental
2.1. Engine, fuel and measurement systems
The engine used in this study was a 6-cylinder state-of-the-art Heavy-Duty Diesel engine. The enginespecifications are shown inTable 1. A low sulphur #2 Diesel fuel was used for the experiments. Specifica-tions of fuel and lubricating oil are given inTables 2and3. The engine was run on an AVL-ELIN enginedynamometer type APA 4Z4/EU, and the engine data were recorded and stored with an AVL-PUMAacquisition system.
The amount of fuel consumption was determined by a fuel gravimetric system with an AVL 733SDynamic Fuel Meter. The measurement device consists of a measuring vessel filled with fuel
Table 1Diesel Heavy-Duty engine specifications
Model RVI-MIDR62356 (EURO 3)Type Turbocharged DI, 4-cycleCylinder arrangement 6 cylinders, in lineBore and Stroke 123 mm× 156 mmDisplacement 11.12 LMaximum power 400 HPInjection system Common-Rail
1256 J.M. Desantes et al. / Aerosol Science 36 (2005) 1251–1276
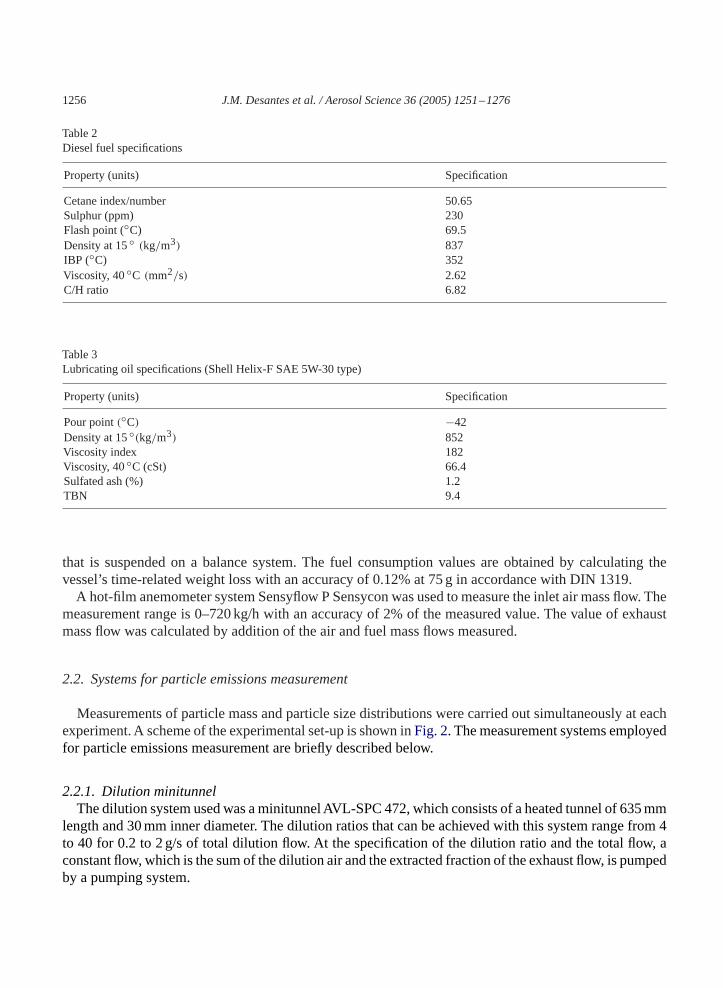
Table 2Diesel fuel specifications
Property (units) Specification
Cetane index/number 50.65Sulphur (ppm) 230Flash point (◦C) 69.5Density at 15◦ (kg/m3) 837IBP (◦C) 352Viscosity, 40◦C (mm2/s) 2.62C/H ratio 6.82
Table 3Lubricating oil specifications (Shell Helix-F SAE 5W-30 type)
Property (units) Specification
Pour point(◦C) −42Density at 15◦(kg/m3) 852Viscosity index 182Viscosity, 40◦C (cSt) 66.4Sulfated ash (%) 1.2TBN 9.4
that is suspended on a balance system. The fuel consumption values are obtained by calculating thevessel’s time-related weight loss with an accuracy of 0.12% at 75 g in accordance with DIN 1319.
A hot-film anemometer system Sensyflow P Sensycon was used to measure the inlet air mass flow. Themeasurement range is 0–720 kg/h with an accuracy of 2% of the measured value. The value of exhaustmass flow was calculated by addition of the air and fuel mass flows measured.
2.2. Systems for particle emissions measurement
Measurements of particle mass and particle size distributions were carried out simultaneously at eachexperiment. A scheme of the experimental set-up is shown inFig. 2. The measurement systems employedfor particle emissions measurement are briefly described below.
2.2.1. Dilution minitunnelThe dilution system used was a minitunnelAVL-SPC 472, which consists of a heated tunnel of 635 mm
length and 30 mm inner diameter. The dilution ratios that can be achieved with this system range from 4to 40 for 0.2 to 2 g/s of total dilution flow. At the specification of the dilution ratio and the total flow, aconstant flow, which is the sum of the dilution air and the extracted fraction of the exhaust flow, is pumpedby a pumping system.

J.M. Desantes et al. / Aerosol Science 36 (2005) 1251–1276 1257
Computer fordata adquistion
Electrostatic Classifier
CPC
to SMPS
Filter holder
By-pass filter
MFM
Pump
Diluted sample output
Shop Air Inlet
Air FilterAir cooler
Dilution mini tunnel
MFCSample probe
Valve
Exhaust pipe
Heated and insulatedsample line and mini tunnel Thermocouple
Fig. 2. Experimental set-up for particle mass and size distribution measurement.
2.2.2. Particle sizing instrumentThe Scanning Mobility Particle Sizer (SMPS) is a widely used instrument for measuring the size distri-
bution of sub-micron particles in a gas. The operating principle of the SMPS is based on the extraction ofan original polydisperse aerosol in different monodisperse fractions by separating the particles accordingto their size by their electrical mobility inside an electrical field. The extracted monodisperse particlefractions are counted in a condensation particle counter which provides the number of particles per airvolume unit for each particle size. A TSI SMPS-3936 and a CPC-3010 models were used in the presentstudy.
In order to extract a diluted sample for the particle size measurement, the SMPS was connecteddownstream of the dilution system. The sampling point where the sample probe of the SMPS is connectedis considered to be an influencing factor on particle size measurements since the degree of mixing betweendilution air and exhaust sample at the sampling point will determine particle dynamics and, as a result,particle size measurements (Suresh & Johnson, 2001). The filter holder piece next to the dilution tunnel,which is normally used for the gravimetric analysis, was chosen as a location to connect the 6 mm innerdiameter, perforated type tube sample probe to ensure a uniform mixture of the dilution air and theextracted sample flow. The SMPS system was positioned so that the required sampling line was as shortas possible (1.2 m) to reduce sampling tube losses. The flexible sampling line was the same type ofmaterial as the connections of the SMPS instrument, PTFE conduct with an inner diameter of 10 mm.
3. Test design and measurement methodology
The experimental plan was designed to study independently the effect of several engine parametersat different steady-state engine operating conditions. Four engine steady-state operation modes definedby the European Stationary Cycle (Directive, 1999) for Heavy-Duty Diesel engines certification wereselected for the experimental study. These operation conditions are defined by their speed and load. The
1258 J.M. Desantes et al. / Aerosol Science 36 (2005) 1251–1276
Table 4Experimental plan for the parametric study
Operation mode Speed (r.p.m.) Load (%) Start of injection (◦) Injection pressure (bar) EGR (%)
A100 1200 100 −11 600 0−9 750 5−7 900 10
B50 1500 50 −11 600 0−9 750 6−7 900 12
B75 1500 75 −11 750 0−9 900 5−7 1050 10
C75 1800 75 −6 700 0−4 850 7−2 1000 14
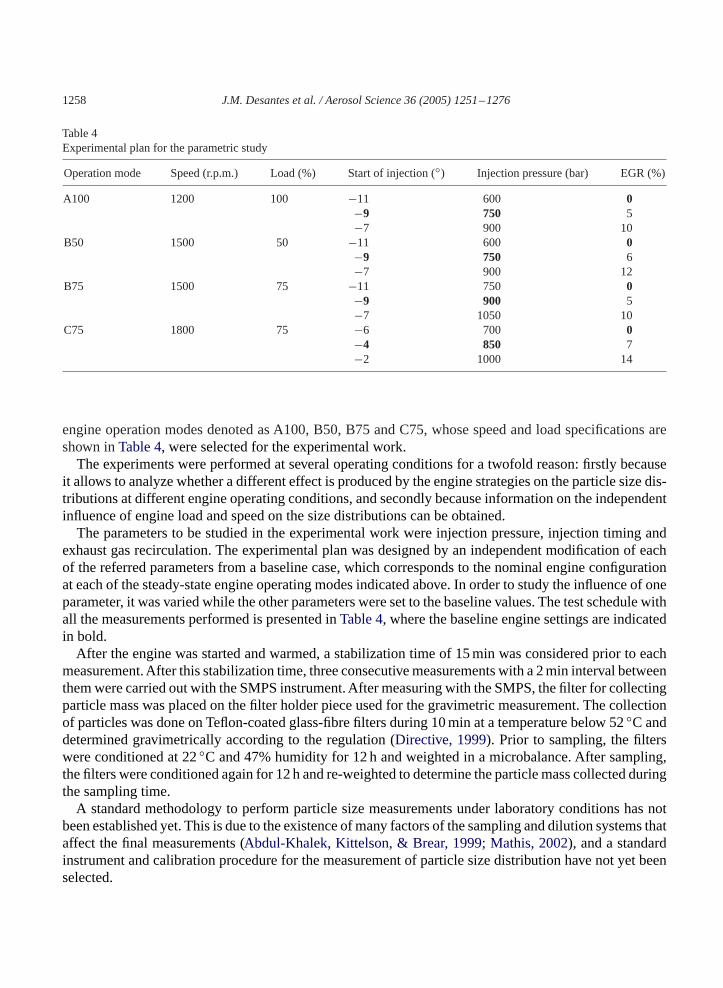
engine operation modes denoted as A100, B50, B75 and C75, whose speed and load specifications areshown inTable 4, were selected for the experimental work.
The experiments were performed at several operating conditions for a twofold reason: firstly becauseit allows to analyze whether a different effect is produced by the engine strategies on the particle size dis-tributions at different engine operating conditions, and secondly because information on the independentinfluence of engine load and speed on the size distributions can be obtained.
The parameters to be studied in the experimental work were injection pressure, injection timing andexhaust gas recirculation. The experimental plan was designed by an independent modification of eachof the referred parameters from a baseline case, which corresponds to the nominal engine configurationat each of the steady-state engine operating modes indicated above. In order to study the influence of oneparameter, it was varied while the other parameters were set to the baseline values. The test schedule withall the measurements performed is presented inTable 4, where the baseline engine settings are indicatedin bold.
After the engine was started and warmed, a stabilization time of 15 min was considered prior to eachmeasurement.After this stabilization time, three consecutive measurements with a 2 min interval betweenthem were carried out with the SMPS instrument. After measuring with the SMPS, the filter for collectingparticle mass was placed on the filter holder piece used for the gravimetric measurement. The collectionof particles was done on Teflon-coated glass-fibre filters during 10 min at a temperature below 52◦C anddetermined gravimetrically according to the regulation (Directive, 1999). Prior to sampling, the filterswere conditioned at 22◦C and 47% humidity for 12 h and weighted in a microbalance. After sampling,the filters were conditioned again for 12 h and re-weighted to determine the particle mass collected duringthe sampling time.
A standard methodology to perform particle size measurements under laboratory conditions has notbeen established yet. This is due to the existence of many factors of the sampling and dilution systems thataffect the final measurements (Abdul-Khalek, Kittelson, & Brear, 1999; Mathis, 2002), and a standardinstrument and calibration procedure for the measurement of particle size distribution have not yet beenselected.

J.M. Desantes et al. / Aerosol Science 36 (2005) 1251–1276 1259
Table 5Operation thresholds and procedures applied in the measurement methodology, according toDesantes et al. (2004)
Parameter Operation value/procedure
Scan-up time 90 sScan-down time 30 sSMPS sample flow 0.8 lpmDilution ratio 20Residence time in the dilution system 360 msDilution air offset Substracted from measurementsEngine preconditioning at high load Prior to measurement sessionStabilization time prior to sampling 15 min
The measurement methodology described byDesantes, Bermúdez, Pastor, and Fuentes (2004)wasapplied in this study. Such measurement procedure was developed in order to reduce the sensitivity ofparticle size measurements to dilution, sampling and measurement factors at typical laboratory conditions.The measurement procedure specifications for the performance of experiments in this study, according torecommendations ofDesantes et al. (2004), are shown inTable 5. The dilution ratio used in this study was20, which is very low value compared with real atmospheric dilution conditions.Kittelson et al. (1998b)reported that a dilution ratio of 1000 is typical for an atmospheric dilution process of the exhaust flow.However, such a dilution ratio cannot be applied for many laboratory studies due to the high requirementsof the dilution ratio control. The low values of dilution ratio used at laboratory conditions could beassociated with the artefact formation of nuclei mode particles. However, as the nuclei mode particleshave been observed in both laboratory and at real road atmospheric conditions in chasing experiments(Kittelson & Watts, 2002, Vogt, Scheer, Casati, & Benter, 2003), it could not be concluded that nucleiparticles measured at laboratory conditions are only a product of critical dilution conditions. Moreover,laboratory studies can facilitate a better principle understanding of the effect of different parameterson the engine exhaust aerosol particle size distribution without the necessity of replicating real dilutionconditions. On that basis, the influence of engine strategies is analyzed in this study.
4. Results
4.1. Influence of injection pressure
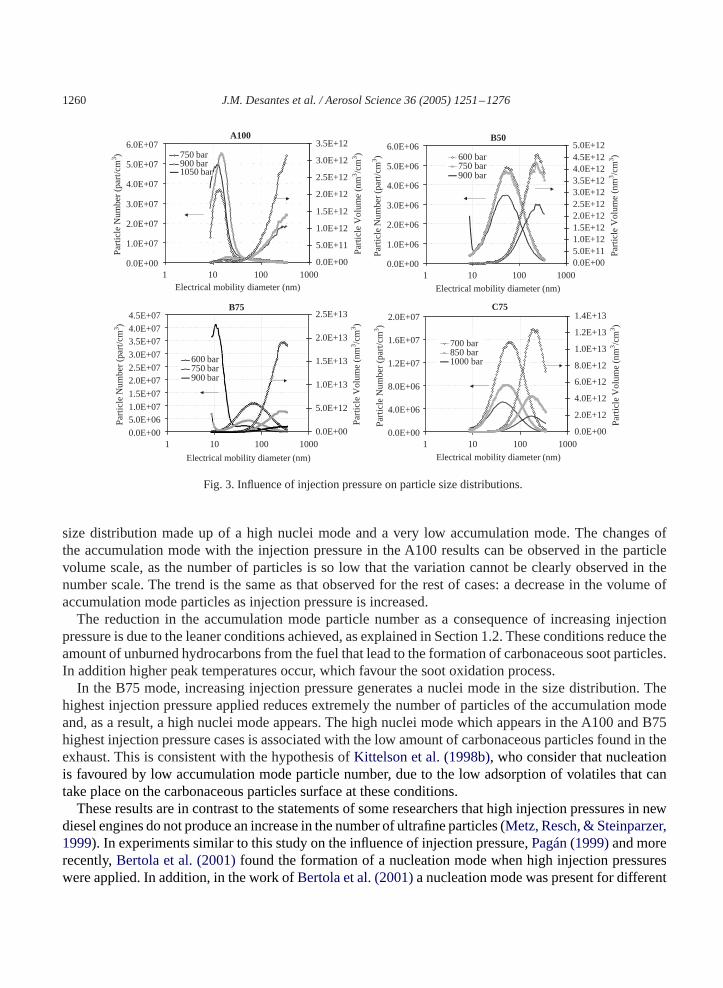
The results of the experimental analysis of the influence of injection pressure are shown inFig. 3.Normalized particle size distributions obtained by averaging three SMPS consecutive scans are presentedin number and volume weights. The particle size distribution corresponding only to the dilution air wassubstracted from the average size distributions, although in some cases the offset was negligible due tothe low amount of particles carried by the dilution air (4.5 × 10⁵ part/cm3). Volumetric concentrationswere calculated assuming that particles are spherical.
A reduction in the accumulation mode particle number with increasing injection pressure is observed forB50, B75 and C75 operation modes. Along with this decrease, the size distributions are shifted to smallersizes as the injection pressure is increased. A100 operation mode results inFig. 3show a characteristic
1260 J.M. Desantes et al. / Aerosol Science 36 (2005) 1251–1276
A100
0.0E+00
1.0E+07
2.0E+07
3.0E+07
4.0E+07
5.0E+07
6.0E+07
1 10 100 1000Electrical mobility diameter (nm)
Par
ticle
Num
ber
(par
t/cm3 )
0.0E+00
5.0E+11
1.0E+12
1.5E+12
2.0E+12
2.5E+12
3.0E+12
3.5E+12
Par
ticle
Vol
ume
(nm3 /c
m3 )750 bar
900 bar1050 bar
B75
0.0E+00
5.0E+061.0E+07
1.5E+07
2.0E+072.5E+07
3.0E+07
3.5E+074.0E+07
4.5E+07
1 10 100 1000
Electrical mobility diameter (nm)
Par
ticle
Num
ber
(par
t/cm3 )
0.0E+00
5.0E+12
1.0E+13
1.5E+13
2.0E+13
2.5E+13
Par
ticle
Vol
ume
(nm3 /c
m3 )
600 bar750 bar900 bar
C75
0.0E+00
4.0E+06
8.0E+06
1.2E+07
1.6E+07
2.0E+07
1 10 100 1000
Electrical mobility diameter (nm)
Par
ticle
Num
ber
(par
t/cm3 )
0.0E+00
2.0E+12
4.0E+12
6.0E+12
8.0E+12
1.0E+13
1.2E+13
1.4E+13
Par
ticle
Vol
ume
(nm3 /c
m3 )
700 bar850 bar1000 bar
B50
0.0E+00
1.0E+06
2.0E+06
3.0E+06
4.0E+06
5.0E+06
6.0E+06
1 10 100 1000
Electrical mobility diameter (nm)
Par
ticle
Num
ber
(par
t/cm3 )
0.0E+005.0E+111.0E+121.5E+122.0E+122.5E+123.0E+123.5E+124.0E+124.5E+125.0E+12
Par
ticle
Vol
ume
(nm3 /c
m3 )600 bar
750 bar 900 bar
Fig. 3. Influence of injection pressure on particle size distributions.
size distribution made up of a high nuclei mode and a very low accumulation mode. The changes ofthe accumulation mode with the injection pressure in the A100 results can be observed in the particlevolume scale, as the number of particles is so low that the variation cannot be clearly observed in thenumber scale. The trend is the same as that observed for the rest of cases: a decrease in the volume ofaccumulation mode particles as injection pressure is increased.
The reduction in the accumulation mode particle number as a consequence of increasing injectionpressure is due to the leaner conditions achieved, as explained in Section 1.2. These conditions reduce theamount of unburned hydrocarbons from the fuel that lead to the formation of carbonaceous soot particles.In addition higher peak temperatures occur, which favour the soot oxidation process.
In the B75 mode, increasing injection pressure generates a nuclei mode in the size distribution. Thehighest injection pressure applied reduces extremely the number of particles of the accumulation modeand, as a result, a high nuclei mode appears. The high nuclei mode which appears in the A100 and B75highest injection pressure cases is associated with the low amount of carbonaceous particles found in theexhaust. This is consistent with the hypothesis ofKittelson et al. (1998b), who consider that nucleationis favoured by low accumulation mode particle number, due to the low adsorption of volatiles that cantake place on the carbonaceous particles surface at these conditions.
These results are in contrast to the statements of some researchers that high injection pressures in newdiesel engines do not produce an increase in the number of ultrafine particles (Metz, Resch, & Steinparzer,1999). In experiments similar to this study on the influence of injection pressure,Pagán (1999)and morerecently,Bertola et al. (2001)found the formation of a nucleation mode when high injection pressureswere applied. In addition, in the work ofBertola et al. (2001)a nucleation mode was present for different

J.M. Desantes et al. / Aerosol Science 36 (2005) 1251–1276 1261
A100
0.0E+00
1.0E+10
2.0E+10
3.0E+10
4.0E+10
5.0E+10
700 800 900 1000 1100IP (bar)
IPA
RT
(pa
rt/k
gfue
l)
40-60nm60-100nm>100nm
B50
0.0E+00
5.0E+10
1.0E+11
1.5E+11
2.0E+11
500 600 700 800 900 1000
IP (bar)
IPA
RT
(pa
rt/k
g fu
el)
0-20nm20-40nm40-60nm60-100nm>100nm
B75 C75
0.0E+00
4.0E+11
8.0E+11
1.2E+12
1.6E+12
500 600 700 800 900 1000
IP (bar)
IPA
RT
nuc
(pa
rt/k
g fu
el)
0.0E+00
5.0E+10
1.0E+11
1.5E+11
2.0E+11
2.5E+11
3.0E+11
IPA
RT
(pa
rt/k
g fu
el)
<20 nm20-40nm40-60nm60-100nm>100nm
0.0E+00
1.0E+11
2.0E+11
3.0E+11
4.0E+11
600 700 800 900 1000 1100IP (bar)
IPA
RT
(pa
rt/k
gfue
l)
< 20nm20-40nm40-60nm60-100nm>100nm
Fig. 4. Influence of injection pressure on the number concentration of particle size classes.
sulphur content fuels when the engine was operated at the highest injection pressures. This indicates thatthe reduction in the particle carbonaceous matter due to the use of high injection pressures is a factorpromoting the nuclei mode formation, and that this effect can be independent of the fuel sulphur content.
Fig. 4shows the influence of injection pressure on the different particle size classes composing the sizemeasurement region. For the comparisons an emission factor denoted as IPART is defined as the numberof particles emitted per mass of fuel consumed (part/kg fuel).
As injection pressure is increased the most frequent size classes correspond to sizes below 60 nm for allthe operating conditions, which means that the size of the particles emitted by the engine mostly belongsto the nanoparticle size range (< 50 nm according toKittelson et al., 1998b). For A100 experiments areduction in the number of particles above 60 nm is observed as injection pressure increases. For thiscase, particles classes below 40 nm are not represented, since their variation is not associated with theinjection pressure modifications, but with the variations in the nucleation process. In the C75 and B50operation modes the number of particles of size classes above 20 nm is reduced as the injection pressureis increased, while the lowest size class (< 20 nm) is less affected. In the B75 operation mode, althoughthe size classes above 20 nm are reduced with increasing injection pressure, the number of particles of thelowest size range (0–20 nm) experiments a sharp increase (indicated with the axis scale IPART nuc). Thisis due to the reduction in the number of particles of the highest classes, associated with carbonaceousparticles of the accumulation mode, and the resultant generation of a nuclei mode.
The degree of influence of injection pressure on each of the size classes is different for the four operationmodes. Comparison of sensitivities of each size class to 150 bar increments in injection pressure is shownin Fig. 5. The percentage variations were calculated on a number basis.

1262 J.M. Desantes et al. / Aerosol Science 36 (2005) 1251–1276
A100
-200
-150
-100
-50
0
50
100
150
200
<20 20-40 40-60 60-100 >100
Sizeclass range (nm)
+300 bar+150 bar
B50
-50
-40
-30
-20
-10
0
10
20
30
40
<20 20-40 40-60 60-100 >100
Size class range (nm)
Sen
sitiv
ity (
%)
+300 bar+150 bar
B75
-100
-80
-60
-40
-20
0
20
40
60
80
100
<20 20-40 40-60 60-100 >100
Size class range (nm)
+300 bar+150 bar
C75
-80
-60
-40
-20
0
20
40
60
80
100
<20 20-40 40-60 60-100 >100
Size class range (nm)
+300 bar+150 bar
Sen
sitiv
ity (
%)
Sen
sitiv
ity (
%)
Sen
sitiv
ity (
%)
Fig. 5. Sensitivity of particle size classes to variations in injection pressure.
For all the cases, above 20 nm (above 40 nm in the A100 case), the reduction caused by increasinginjection pressure is more pronounced, the higher the size class. This could be explained by consideringthat increasing injection pressure reduces the number of primary particles that make up the soot aggregates(Heimgärtner, Schraml, Will, & Leipertz, 2001). Thus, the collision frequency between primary particlesand cluster-primary particles and the agglomeration rate are also reduced. As a consequence, a strongerreduction in the number of large particles takes place in comparison with particles of smaller sizes, wheninjection pressure is increased.
The least affected operation mode by injection pressure changes is the B50 case with maximumreductions of 40%, while the most affected one is the B75 mode with maximum reductions of nearly70%. For B75, C75 and A100 operation modes, the first increment in injection pressure is more effectivethan further increase. The effect of injection pressure is not observed for the A100 mode at the+300 barinjection pressure increment. Moreover, in the B50 case there does not seem to be significant effect below750 bar.
A special trend is observed for sizes below 20 nm in the B50 and C75 operation modes. For the+150 barinjection pressure, a reduction in the particle number is achieved, while further increase in injectionpressure causes a rise in the number of particles. The same effect is observed in the B75 operation modewith extension to the 20–40 nm size range. For this operating conditions the first increment in injectionpressure produces a reduction in the particle number of the 20–40 nm size class, along with an increase

J.M. Desantes et al. / Aerosol Science 36 (2005) 1251–1276 1263
in the particle number of the size class below 20 nm. Further increment of injection pressure to 900 barcauses an increase in the 20–40 nm size class particle number and a sharp increase in the lowest sizeclass. An explanation for this behaviour could be that increasing injection pressure produces a reductionin the amount of carbonaceous particles in the small sizes region but conversely, high injection pressurescause a simultaneous augment in the number of volatile particles coexisting with carbonaceous particlesin sizes ranges below 40 nm. The variability observed in the A100 case for size classes below 40 nmcannot be clearly correlated to injection pressure changes, as the nuclei mode is subdue to uncontrollednucleation processes.
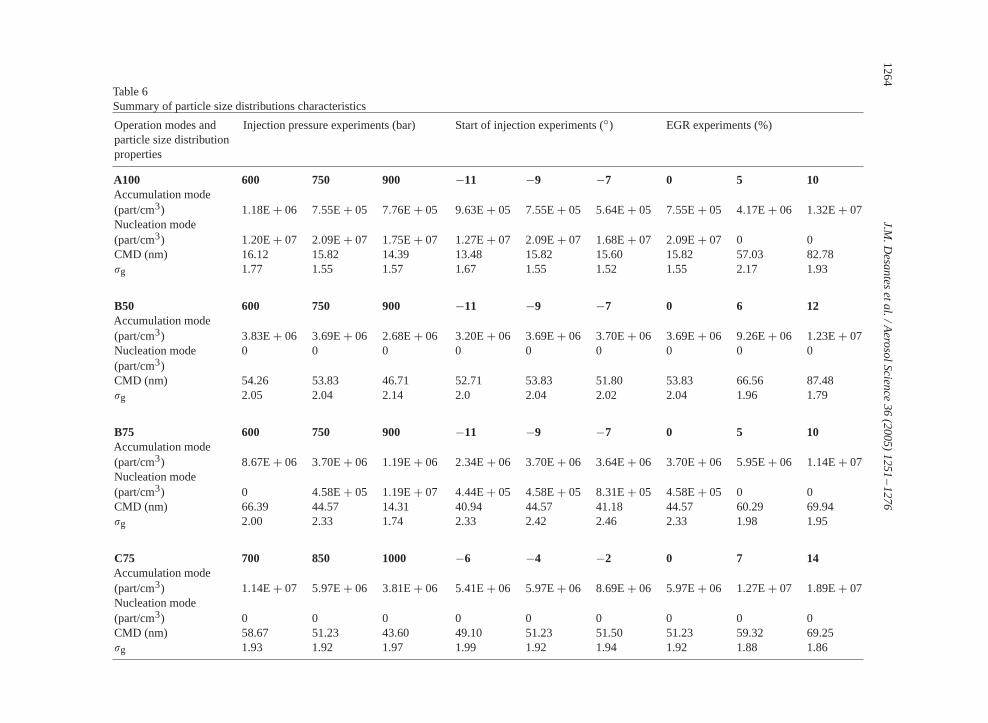
Even though the changes were more pronounced under some conditions, the general effect of increasinginjection pressure was a decrease in the number of particles with sizes above 40 nm which belong to theaccumulation mode.Along with this effect an increase in the number of the smallest particles is produced,due to the generation of nuclei mode particles.Table 6summarizes the particle size distributions maincharacteristics data for each experiment conducted. The results show a reduction in the CMD withincreasing injection pressure, while the particle number is reduced excepting for those conditions inwhich a nuclei mode was generated.
4.2. Influence of start of injection
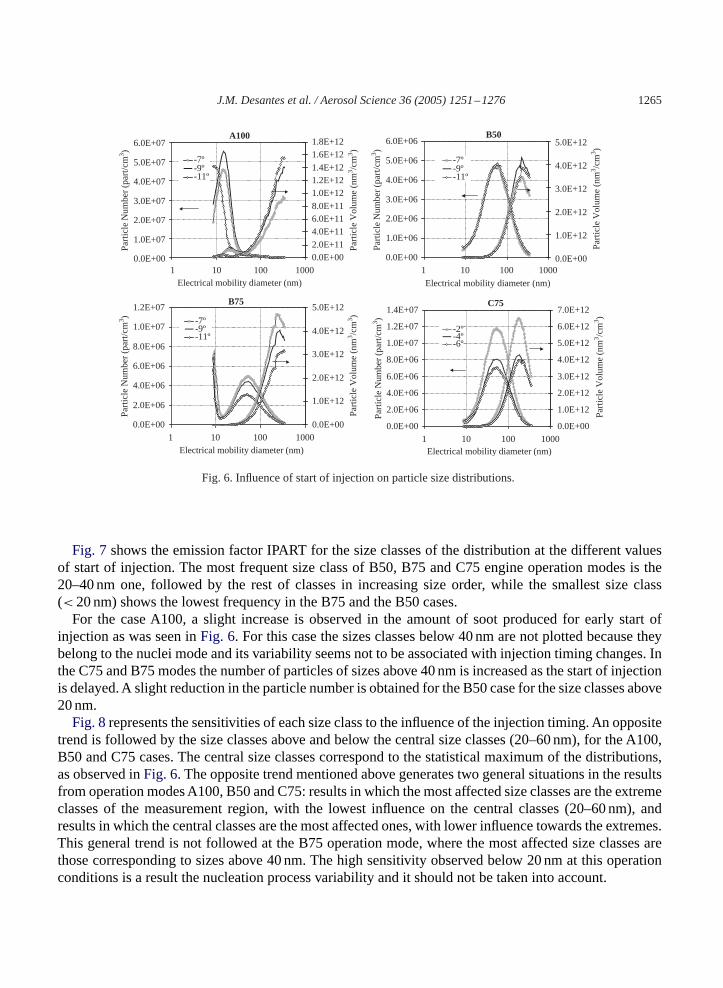
The particle size distributions obtained from the experimental study on the influence of the start ofinjection are shown inFig. 6. As a general trend, a reduction in the number of particles is observed forearly start of injection in the B75 and C75 operation modes. TheA100 case results are not easy to interpretbecause the accumulation mode is very low. By observing the volume scale a reduction is observed as theinjection timing is delayed. The changes of nucleation mode in this case cannot be attributed to changesin the start of injection, but to the variability of the nuclei mode formation process. The results from theB50 case shows no significant variation under changes of the injection timing.
Due to primary particles are precursors of aggregates, modifications in the number of primary particlesimply a change in the mean diameter of the distributions, since agglomeration is dependent on the initialnumber of primary particles. Thus, a small number of primary particles will lead to smaller aggregatesthan a high number of primary particles. This was observed in the case of injection pressure in the previoussection. Highest injection pressures are linked to a reduction of soot precursors and, consequently, to adecrease in the number of primary particles originally formed in the combustion process. Hence, the sizeof the aggregates formed was smaller, and a shift of the distributions to smaller sizes was observed. Fromthis shift to the small size region a reduction in the CMD was produced. However, in the study of theinjection timing influence, the sizes distributions are not shifted, even if the particle number is modified(Fig. 6), which means that the CMD of the size distributions remains constant (Table 6). Injection timingmay influence the combustion peak temperatures and hence the formation of primary particles. In addition,injection timing has an influence on the residence time before expansion freezes soot oxidation. Sincethe CMD of the distributions remains constant independently of the injection timing applied, it seemsthat the main controlling factor causing the differences between the size distributions is the residencetime for the particles oxidation and not the change in the initial number of primary particles. Advancinginjection timing for cases B75 and C75 reduces the particle number due to an increase of residence timefor soot oxidation. Moreover, such an oxidation occurs uniformly for the different particle sizes since thesize distribution is homogeneously reduced as the injection timing is advanced.
1264J.M
.Desantesetal./A
erosolS
cience
36(2005)1251–1276
Table 6Summary of particle size distributions characteristics
Operation modes and Injection pressure experiments (bar) Start of injection experiments (◦) EGR experiments (%)particle size distributionproperties
A100 600 750 900 −11 −9 −7 0 5 10Accumulation mode(part/cm3) 1.18E+ 06 7.55E+ 05 7.76E+ 05 9.63E+ 05 7.55E+ 05 5.64E+ 05 7.55E+ 05 4.17E+ 06 1.32E+ 07Nucleation mode(part/cm3) 1.20E+ 07 2.09E+ 07 1.75E+ 07 1.27E+ 07 2.09E+ 07 1.68E+ 07 2.09E+ 07 0 0CMD (nm) 16.12 15.82 14.39 13.48 15.82 15.60 15.82 57.03 82.78�g 1.77 1.55 1.57 1.67 1.55 1.52 1.55 2.17 1.93
B50 600 750 900 −11 −9 −7 0 6 12Accumulation mode(part/cm3) 3.83E+ 06 3.69E+ 06 2.68E+ 06 3.20E+ 06 3.69E+ 06 3.70E+ 06 3.69E+ 06 9.26E+ 06 1.23E+ 07Nucleation mode 0 0 0 0 0 0 0 0 0(part/cm3)CMD (nm) 54.26 53.83 46.71 52.71 53.83 51.80 53.83 66.56 87.48�g 2.05 2.04 2.14 2.0 2.04 2.02 2.04 1.96 1.79
B75 600 750 900 −11 −9 −7 0 5 10Accumulation mode(part/cm3) 8.67E+ 06 3.70E+ 06 1.19E+ 06 2.34E+ 06 3.70E+ 06 3.64E+ 06 3.70E+ 06 5.95E+ 06 1.14E+ 07Nucleation mode(part/cm3) 0 4.58E+ 05 1.19E+ 07 4.44E+ 05 4.58E+ 05 8.31E+ 05 4.58E+ 05 0 0CMD (nm) 66.39 44.57 14.31 40.94 44.57 41.18 44.57 60.29 69.94�g 2.00 2.33 1.74 2.33 2.42 2.46 2.33 1.98 1.95
C75 700 850 1000 −6 −4 −2 0 7 14Accumulation mode(part/cm3) 1.14E+ 07 5.97E+ 06 3.81E+ 06 5.41E+ 06 5.97E+ 06 8.69E+ 06 5.97E+ 06 1.27E+ 07 1.89E+ 07Nucleation mode(part/cm3) 0 0 0 0 0 0 0 0 0CMD (nm) 58.67 51.23 43.60 49.10 51.23 51.50 51.23 59.32 69.25�g 1.93 1.92 1.97 1.99 1.92 1.94 1.92 1.88 1.86
J.M. Desantes et al. / Aerosol Science 36 (2005) 1251–1276 1265
A100
0.0E+00
1.0E+07
2.0E+07
3.0E+07
4.0E+07
5.0E+07
6.0E+07
1 10 100 1000Electrical mobility diameter (nm)
Par
ticle
Num
ber
(par
t/cm3 )
0.0E+002.0E+11
4.0E+116.0E+118.0E+11
1.0E+121.2E+121.4E+12
1.6E+121.8E+12
Par
ticle
Vol
ume
(nm3 /c
m3 )
-7º-9º-11º
B75
0.0E+00
2.0E+06
4.0E+06
6.0E+06
8.0E+06
1.0E+07
1.2E+07
1 10 100 1000Electrical mobility diameter (nm)
Par
ticle
Num
ber
(par
t/cm3 )
0.0E+00
1.0E+12
2.0E+12
3.0E+12
4.0E+12
5.0E+12
Par
ticle
Vol
ume
(nm3 /c
m3 )
-7º-9º-11º
C75
0.0E+00
2.0E+06
4.0E+06
6.0E+06
8.0E+06
1.0E+07
1.2E+07
1.4E+07
1 10 100 1000Electrical mobility diameter (nm)
Par
ticle
Num
ber
(par
t/cm3 )
0.0E+00
1.0E+12
2.0E+12
3.0E+12
4.0E+12
5.0E+12
6.0E+12
7.0E+12
Par
ticle
Vol
ume
(nm3 /c
m3 )
-2º-4º-6º
B50
0.0E+00
1.0E+06
2.0E+06
3.0E+06
4.0E+06
5.0E+06
6.0E+06
1 10 100 1000Electrical mobility diameter (nm)
Par
ticle
Num
ber
(par
t/cm3 )
0.0E+00
1.0E+12
2.0E+12
3.0E+12
4.0E+12
5.0E+12
Par
ticle
Vol
ume
(nm3 /c
m3 )
-7º-9º-11º
Fig. 6. Influence of start of injection on particle size distributions.
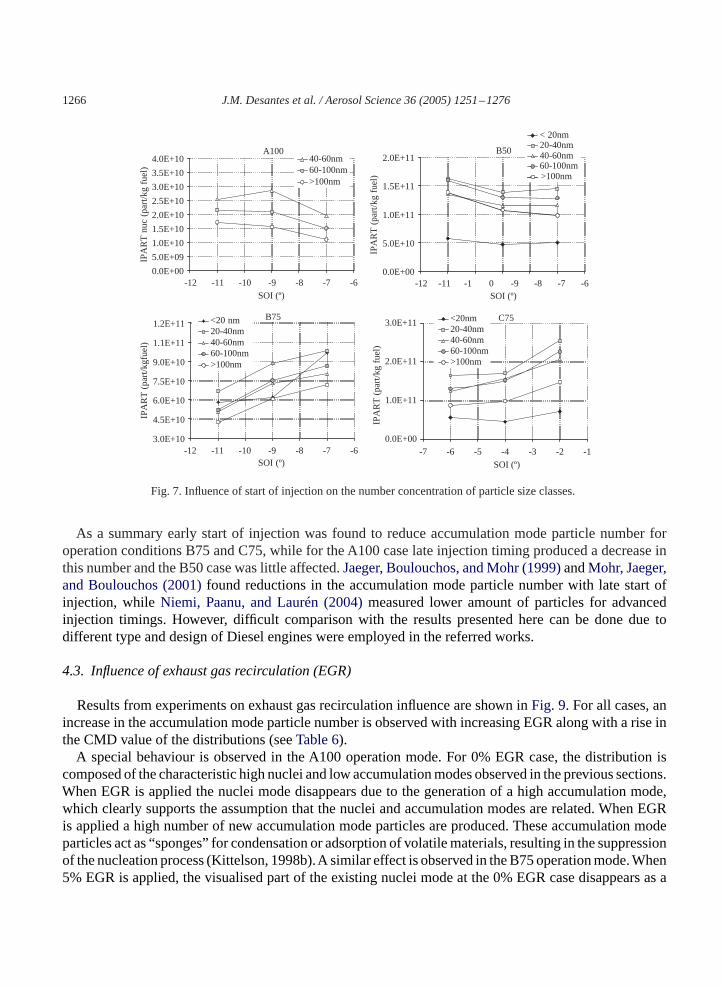
Fig. 7 shows the emission factor IPART for the size classes of the distribution at the different valuesof start of injection. The most frequent size class of B50, B75 and C75 engine operation modes is the20–40 nm one, followed by the rest of classes in increasing size order, while the smallest size class(< 20 nm) shows the lowest frequency in the B75 and the B50 cases.
For the case A100, a slight increase is observed in the amount of soot produced for early start ofinjection as was seen inFig. 6. For this case the sizes classes below 40 nm are not plotted because theybelong to the nuclei mode and its variability seems not to be associated with injection timing changes. Inthe C75 and B75 modes the number of particles of sizes above 40 nm is increased as the start of injectionis delayed. A slight reduction in the particle number is obtained for the B50 case for the size classes above20 nm.
Fig. 8represents the sensitivities of each size class to the influence of the injection timing. An oppositetrend is followed by the size classes above and below the central size classes (20–60 nm), for the A100,B50 and C75 cases. The central size classes correspond to the statistical maximum of the distributions,as observed inFig. 6. The opposite trend mentioned above generates two general situations in the resultsfrom operation modes A100, B50 and C75: results in which the most affected size classes are the extremeclasses of the measurement region, with the lowest influence on the central classes (20–60 nm), andresults in which the central classes are the most affected ones, with lower influence towards the extremes.This general trend is not followed at the B75 operation mode, where the most affected size classes arethose corresponding to sizes above 40 nm. The high sensitivity observed below 20 nm at this operationconditions is a result the nucleation process variability and it should not be taken into account.
1266 J.M. Desantes et al. / Aerosol Science 36 (2005) 1251–1276
A100
0.0E+00
5.0E+09
1.0E+10
1.5E+10
2.0E+10
2.5E+10
3.0E+10
3.5E+10
4.0E+10
-12 -11 -10 -9 -8 -7 -6SOI (º)
IPA
RT
nuc
(pa
rt/k
g fu
el) 40-60nm
60-100nm>100nm
B75
3.0E+10
4.5E+10
6.0E+10
7.5E+10
9.0E+10
1.1E+11
1.2E+11
-12 -11 -10 -9 -8 -7 -6SOI (º)
IPA
RT
(pa
rt/k
gfue
l)
<20 nm20-40nm40-60nm60-100nm>100nm
C75
0.0E+00
1.0E+11
2.0E+11
3.0E+11
-7 -6 -5 -4 -3 -2 -1
SOI (º)
IPA
RT
(pa
rt/k
g fu
el)
<20nm20-40nm40-60nm60-100nm>100nm
B50
0.0E+00
5.0E+10
1.0E+11
1.5E+11
2.0E+11
-12 -11 -1 0 -9 -8 -7 -6SOI (º)
IPA
RT
(pa
rt/k
g fu
el)
< 20nm20-40nm40-60nm60-100nm>100nm
Fig. 7. Influence of start of injection on the number concentration of particle size classes.
As a summary early start of injection was found to reduce accumulation mode particle number foroperation conditions B75 and C75, while for the A100 case late injection timing produced a decrease inthis number and the B50 case was little affected.Jaeger, Boulouchos, and Mohr (1999)andMohr, Jaeger,and Boulouchos (2001)found reductions in the accumulation mode particle number with late start ofinjection, whileNiemi, Paanu, and Laurén (2004)measured lower amount of particles for advancedinjection timings. However, difficult comparison with the results presented here can be done due todifferent type and design of Diesel engines were employed in the referred works.
4.3. Influence of exhaust gas recirculation (EGR)
Results from experiments on exhaust gas recirculation influence are shown inFig. 9. For all cases, anincrease in the accumulation mode particle number is observed with increasing EGR along with a rise inthe CMD value of the distributions (seeTable 6).
A special behaviour is observed in the A100 operation mode. For 0% EGR case, the distribution iscomposed of the characteristic high nuclei and low accumulation modes observed in the previous sections.When EGR is applied the nuclei mode disappears due to the generation of a high accumulation mode,which clearly supports the assumption that the nuclei and accumulation modes are related. When EGRis applied a high number of new accumulation mode particles are produced. These accumulation modeparticles act as “sponges” for condensation or adsorption of volatile materials, resulting in the suppressionof the nucleation process (Kittelson, 1998b).A similar effect is observed in the B75 operation mode.When5% EGR is applied, the visualised part of the existing nuclei mode at the 0% EGR case disappears as a

J.M. Desantes et al. / Aerosol Science 36 (2005) 1251–1276 1267
A100
-35
-30
-25
-20
-15
-10
-5
0
<20 20-40 40-60 60-100 >100
Size class range (nm)
+4º+2º
B50
-25
-20
-15
-10
-5
0
5
10
<20 20-40 40-60 60-100 >100
Size class range (nm)
+4º+2º
B75
0
10
20
30
40
50
60
<20 20-40 40-60 60-100 >100Size class range (nm)
+4º+2º
C75
-30
-20
-10
0
10
20
30
40
50
60
70
<20 20-40 40-60 60-100 >100Size class range (nm)
+4º+2º
Fig. 8. Sensitivity of particle size classes to variations in start of injection.
A100
0.0E+00
1.0E+07
2.0E+07
3.0E+07
4.0E+07
5.0E+07
6.0E+07
1 10 100 1000Electrical mobility diameter (nm)
Par
ticle
Num
ber
(par
t/cm3 )
0.0E+00
1.0E+13
2.0E+13
3.0E+13
4.0E+13
5.0E+13
6.0E+13
7.0E+13
Par
ticle
Vol
ume
(nm3 /c
m3 )0% EGR
5% EGR
B50
0.0E+002.0E+064.0E+066.0E+068.0E+061.0E+071.2E+071.4E+071.6E+071.8E+072.0E+07
1 10 100 1000
Electrical mobility diameter (nm)
Par
ticle
Num
ber
(par
t/cm3 )
0.0E+00
5.0E+12
1.0E+13
1.5E+13
2.0E+13
2.5E+13
3.0E+13
3.5E+13
Par
ticle
Vol
ume
(nm3 /c
m3 )
0% EGR6% EGR12% EGR
B75
0.0E+002.0E+064.0E+066.0E+068.0E+061.0E+071.2E+071.4E+071.6E+071.8E+072.0E+07
1 10 100 1000Electrical mobility diameter (nm)
Par
ticle
Num
ber
(par
t/cm3 )
0.0E+00
5.0E+12
1.0E+13
1.5E+13
2.0E+13
2.5E+13
3.0E+13
Par
ticle
Vol
ume
(nm3 /c
m3 )
0% EGR5% EGR10% EGR
C75
0.0E+00
5.0E+06
1.0E+07
1.5E+07
2.0E+07
2.5E+07
3.0E+07
1 10 100 1000Electrical mobility diameter (nm)
Par
ticle
Num
ber
(par
t/cm3 )
0.0E+00
5.0E+12
1.0E+13
1.5E+13
2.0E+13
2.5E+13
3.0E+13
3.5E+13
4.0E+13
Par
ticle
Vol
ume
(nm3 /c
m3 )
0% EGR7% EGR
10% EGR
14%EGR
Fig. 9. Influence of exhaust gas recirculation on particle size distributions.
1268 J.M. Desantes et al. / Aerosol Science 36 (2005) 1251–1276
A100
0.0E+00
5.0E+11
1.0E+12
1.5E+12
2.0E+12
0 4 8 10 12EGR (%)
IPA
RT
nuc
(pa
rt/k
g fu
el)
0.0E+00
1.0E+11
2.0E+11
3.0E+11
4.0E+11
5.0E+11
IPA
RT
(pa
rt/k
g fu
el)0-20nm
20-40nm40-60nm60-100nm>100nm
B50
0.0E+00
2.0E+11
4.0E+11
6.0E+11
8.0E+11
0 6 10 12 14
EGR (%)
IPA
RT
(pa
rt/k
g fu
el)
0-20nm20-40nm40-60nm60-100nm>100nm
B75
0.0E+00
1.0E+11
2.0E+11
3.0E+11
4.0E+11
0 2 8 10 12EGR (%)
IPA
RT
(pa
rt/k
gfue
l)
< 20nm20-40nm40-60nm60-100nm>100nm
C75
0.0E+00
1.0E+11
2.0E+11
3.0E+11
4.0E+11
5.0E+11
6.0E+11
0 4 10 12 14EGR (%)
IPA
RT
(pa
rt/k
g fu
el)
0-20nm20-40nm40-60nm60-100nm>100nm
62 42 8
2 8664
Fig. 10. Influence of exhaust gas recirculation on the number concentration of particle size classes.
consequence of the formation of new accumulation mode particles. Although some previous works havebeen carried out on the effect of EGR on particle size distributions (Kreso et al., 1999;Aufdenblatten etal., 2002), to the authors’ knowledge, this special behaviour has not been previously reported.
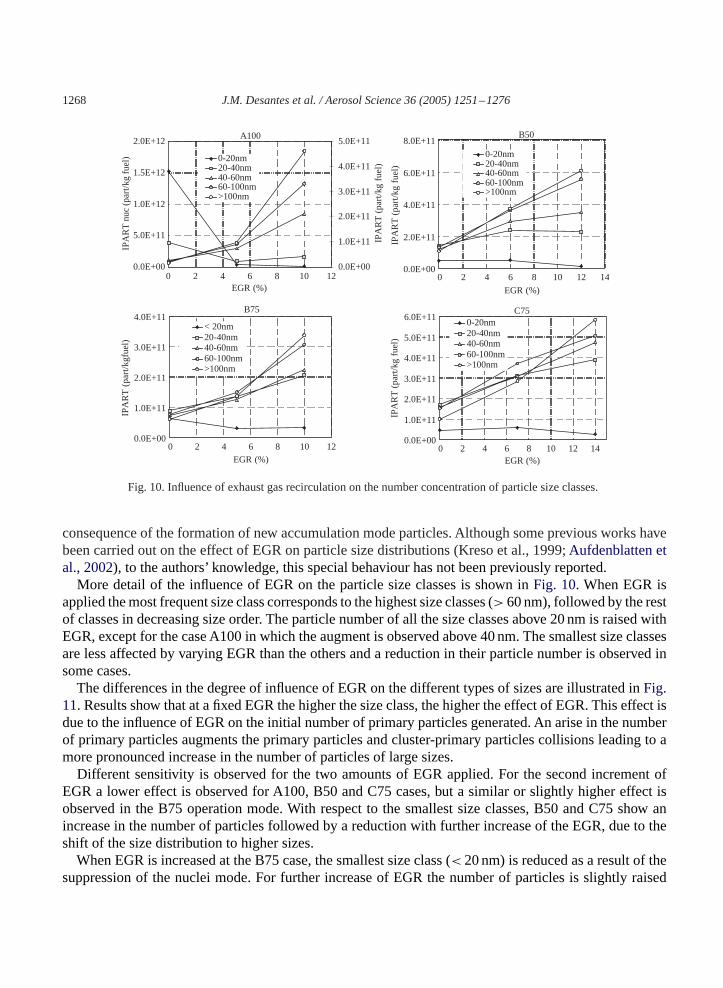
More detail of the influence of EGR on the particle size classes is shown inFig. 10. When EGR isapplied the most frequent size class corresponds to the highest size classes (> 60 nm), followed by the restof classes in decreasing size order. The particle number of all the size classes above 20 nm is raised withEGR, except for the case A100 in which the augment is observed above 40 nm. The smallest size classesare less affected by varying EGR than the others and a reduction in their particle number is observed insome cases.
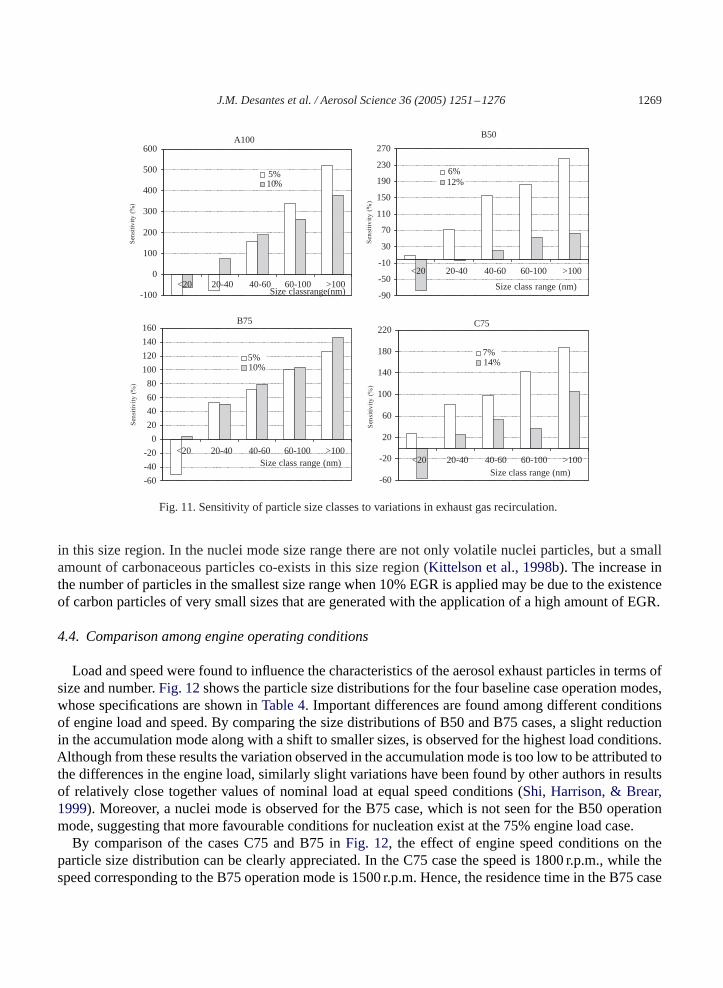
The differences in the degree of influence of EGR on the different types of sizes are illustrated inFig.11. Results show that at a fixed EGR the higher the size class, the higher the effect of EGR. This effect isdue to the influence of EGR on the initial number of primary particles generated. An arise in the numberof primary particles augments the primary particles and cluster-primary particles collisions leading to amore pronounced increase in the number of particles of large sizes.
Different sensitivity is observed for the two amounts of EGR applied. For the second increment ofEGR a lower effect is observed for A100, B50 and C75 cases, but a similar or slightly higher effect isobserved in the B75 operation mode. With respect to the smallest size classes, B50 and C75 show anincrease in the number of particles followed by a reduction with further increase of the EGR, due to theshift of the size distribution to higher sizes.
When EGR is increased at the B75 case, the smallest size class (< 20 nm) is reduced as a result of thesuppression of the nuclei mode. For further increase of EGR the number of particles is slightly raised
J.M. Desantes et al. / Aerosol Science 36 (2005) 1251–1276 1269
A100
-100
0
100
200
300
400
500
600
<20 20-40 40-60 60-100 >100Size classrange(nm)
5%10%
B50
-90
-50
-10
30
70
110
150
190
230
270
<20 20-40 40-60 60-100 >100
Size class range (nm)
6%12%
C75
-60
-20
20
60
100
140
180
220
<20 20-40 40-60 60-100 >100Size class range (nm)
7%
B75
-60
-40
-20
0
20
40
60
80
100
120
140
160
<20 20-40 40-60 60-100 >100Size class range (nm)
5%10% 14%
Fig. 11. Sensitivity of particle size classes to variations in exhaust gas recirculation.
in this size region. In the nuclei mode size range there are not only volatile nuclei particles, but a smallamount of carbonaceous particles co-exists in this size region (Kittelson et al., 1998b). The increase inthe number of particles in the smallest size range when 10% EGR is applied may be due to the existenceof carbon particles of very small sizes that are generated with the application of a high amount of EGR.
4.4. Comparison among engine operating conditions
Load and speed were found to influence the characteristics of the aerosol exhaust particles in terms ofsize and number.Fig. 12shows the particle size distributions for the four baseline case operation modes,whose specifications are shown inTable 4. Important differences are found among different conditionsof engine load and speed. By comparing the size distributions of B50 and B75 cases, a slight reductionin the accumulation mode along with a shift to smaller sizes, is observed for the highest load conditions.Although from these results the variation observed in the accumulation mode is too low to be attributed tothe differences in the engine load, similarly slight variations have been found by other authors in resultsof relatively close together values of nominal load at equal speed conditions (Shi, Harrison, & Brear,1999). Moreover, a nuclei mode is observed for the B75 case, which is not seen for the B50 operationmode, suggesting that more favourable conditions for nucleation exist at the 75% engine load case.
By comparison of the cases C75 and B75 inFig. 12, the effect of engine speed conditions on theparticle size distribution can be clearly appreciated. In the C75 case the speed is 1800 r.p.m., while thespeed corresponding to the B75 operation mode is 1500 r.p.m. Hence, the residence time in the B75 case

1270 J.M. Desantes et al. / Aerosol Science 36 (2005) 1251–1276
0.0E+00
1.0E+06
2.0E+06
3.0E+06
4.0E+06
5.0E+06
6.0E+06
7.0E+06
8.0E+06
9.0E+06
1 10 100 1000Electrical mobility diameter (nm)
Par
ticle
Num
ber
dN/d
log(
Dp)
, Ope
ratio
n m
odes
B50
, B75
and
C75
. (
part
/cm3 )
0.0E+00
1.0E+07
2.0E+07
3.0E+07
4.0E+07
5.0E+07
6.0E+07
Par
ticle
Num
ber
dN/d
log(
Dp)
. Ope
ratio
n m
ode
A10
0. (p
art/c
m3 )
B50B75C75A100
Fig. 12. Particle size distributions at baseline operating conditions.
is longer than in the C75 operation mode, and more time is available for soot oxidation. Along withthis, measured exhaust temperatures for the B75 case were higher than for the C75 case, which indicatesthat soot oxidation is more favoured at the B75 operating conditions. Consequently, for the latter casethe accumulation mode particle number is the lowest. The high load and low speed at A100 operatingconditions produced the highest exhaust temperatures and the longest residence time compared with therest of operating conditions studied. These conditions favour soot oxidation, resulting in a size distributionmade up of a extremely low accumulation mode, and a consequently high nuclei mode.
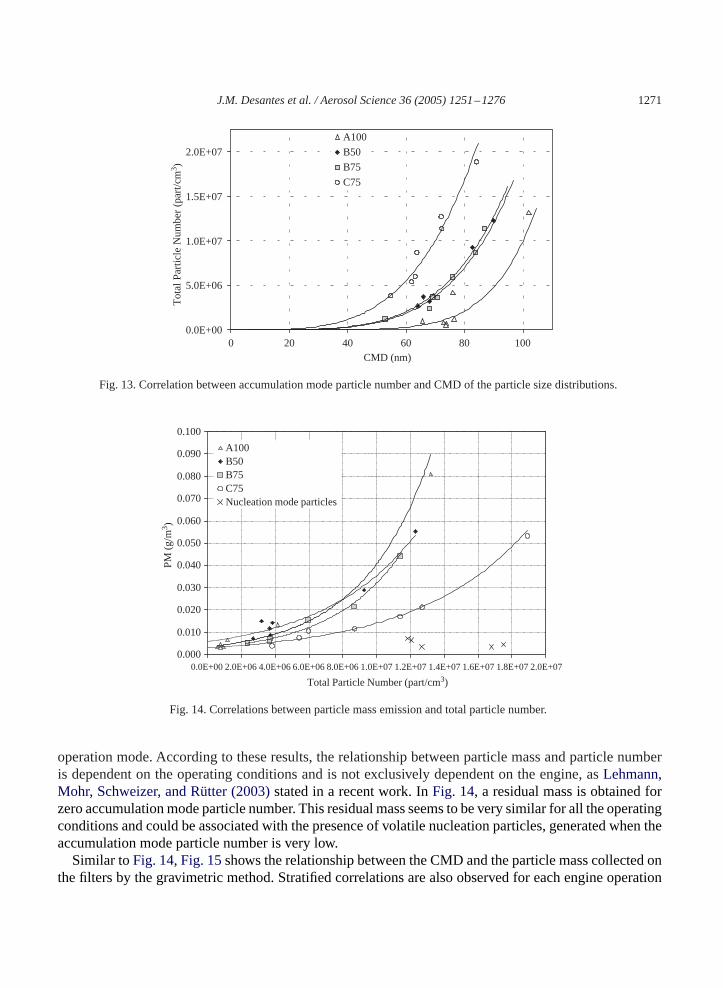
Fig. 13 shows the accumulation mode total particle number for each test versus the CMD of thedistributions. For the calculation of the CMD only the accumulation mode was considered. For thosedistributions made up of both nuclei and accumulation modes, the accumulation mode size range forthe calculation of its particle number was delimited from the inflexion point linking both modes to themaximum particle size measured. The results inFig. 13appear stratified for the different engine operationmodes, with the highest number of particles observed in the C75 case, followed by B75 and B50, andfinally A100. The stratification indicates that a correlation exists between the CMD and the total particlenumber of the accumulation mode at the same engine operating conditions. Particle number and CMD ofthe distributions obtained with the application of different strategies at the same engine operation modeall collapse on the same curve, suggesting that a single function relates all the particle size distributionsobtained at the same conditions of speed and load, independently of the strategy applied. As it is obvious,the correlations show that the higher the number of particles, the higher the CMD due to the fact thatlarger aggregates are formed when the particle number is higher.
Fig. 14shows the accumulation mode total particle mass collected on filters by the gravimetric methodversus the accumulation mode total particle number from each test. The nuclei mode particle number isalso represented for the same tests in a separate plot. Similarly to the previous figure, a correlation wasfound between the particle number of accumulation mode and the particle mass, stratified for each engine
J.M. Desantes et al. / Aerosol Science 36 (2005) 1251–1276 1271
0.0E+00
5.0E+06
1.0E+07
1.5E+07
2.0E+07
0 20 40 60 80 100CMD (nm)
Tot
al P
artic
le N
umbe
r (p
art/c
m3 )
A100
B50
B75
C75
Fig. 13. Correlation between accumulation mode particle number and CMD of the particle size distributions.
0.000
0.010
0.020
0.030
0.040
0.050
0.060
0.070
0.080
0.090
0.100
0.0E+00 2.0E+06 4.0E+06 6.0E+06 8.0E+06 1.0E+07 1.2E+07 1.4E+07 1.6E+07 1.8E+07 2.0E+07
Total Particle Number (part/cm3)
PM
(g/
m3 )
A100B50B75C75Nucleation mode particles
Fig. 14. Correlations between particle mass emission and total particle number.
operation mode. According to these results, the relationship between particle mass and particle numberis dependent on the operating conditions and is not exclusively dependent on the engine, asLehmann,Mohr, Schweizer, and Rütter (2003)stated in a recent work. InFig. 14, a residual mass is obtained forzero accumulation mode particle number. This residual mass seems to be very similar for all the operatingconditions and could be associated with the presence of volatile nucleation particles, generated when theaccumulation mode particle number is very low.
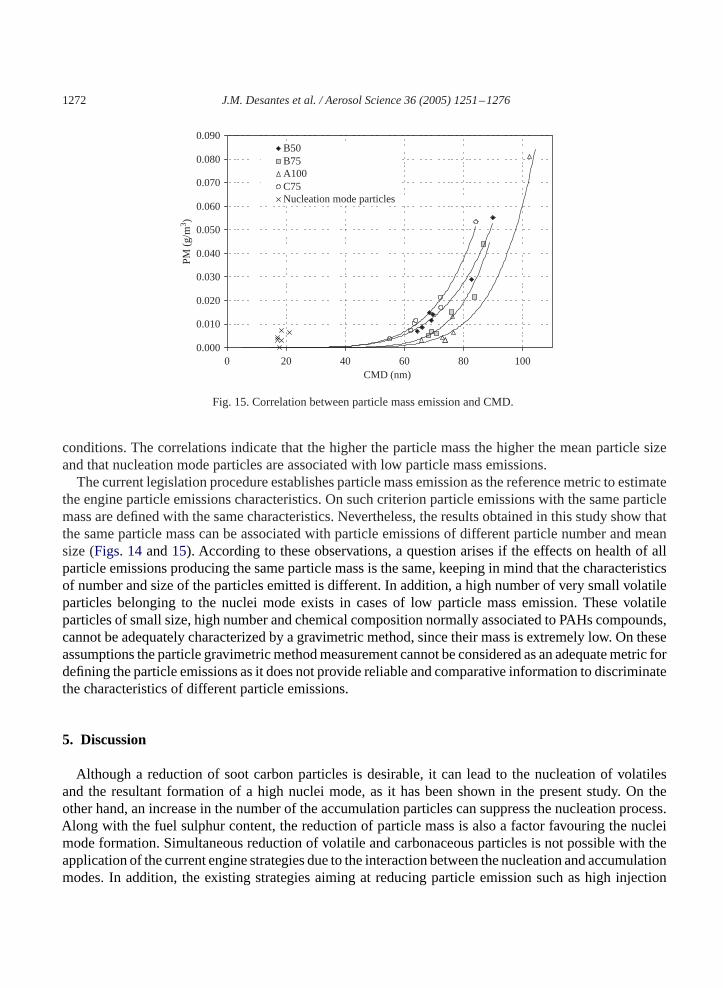
Similar toFig. 14, Fig. 15shows the relationship between the CMD and the particle mass collected onthe filters by the gravimetric method. Stratified correlations are also observed for each engine operation
1272 J.M. Desantes et al. / Aerosol Science 36 (2005) 1251–1276
0.000
0.010
0.020
0.030
0.040
0.050
0.060
0.070
0.080
0.090
0 20 40 60 80 100CMD (nm)
PM
(g/
m3 )
B50B75A100C75Nucleation mode particles
Fig. 15. Correlation between particle mass emission and CMD.
conditions. The correlations indicate that the higher the particle mass the higher the mean particle sizeand that nucleation mode particles are associated with low particle mass emissions.
The current legislation procedure establishes particle mass emission as the reference metric to estimatethe engine particle emissions characteristics. On such criterion particle emissions with the same particlemass are defined with the same characteristics. Nevertheless, the results obtained in this study show thatthe same particle mass can be associated with particle emissions of different particle number and meansize (Figs. 14and15). According to these observations, a question arises if the effects on health of allparticle emissions producing the same particle mass is the same, keeping in mind that the characteristicsof number and size of the particles emitted is different. In addition, a high number of very small volatileparticles belonging to the nuclei mode exists in cases of low particle mass emission. These volatileparticles of small size, high number and chemical composition normally associated to PAHs compounds,cannot be adequately characterized by a gravimetric method, since their mass is extremely low. On theseassumptions the particle gravimetric method measurement cannot be considered as an adequate metric fordefining the particle emissions as it does not provide reliable and comparative information to discriminatethe characteristics of different particle emissions.
5. Discussion
Although a reduction of soot carbon particles is desirable, it can lead to the nucleation of volatilesand the resultant formation of a high nuclei mode, as it has been shown in the present study. On theother hand, an increase in the number of the accumulation particles can suppress the nucleation process.Along with the fuel sulphur content, the reduction of particle mass is also a factor favouring the nucleimode formation. Simultaneous reduction of volatile and carbonaceous particles is not possible with theapplication of the current engine strategies due to the interaction between the nucleation and accumulationmodes. In addition, the existing strategies aiming at reducing particle emission such as high injection
J.M. Desantes et al. / Aerosol Science 36 (2005) 1251–1276 1273
pressure are focused on the reduction of carbonaceous particles emission, which is bound to generatea high amount of small volatile particles. The composition of small volatile particles is associated withorganic compounds such as the PAHs (Kittelson et al., 1998a), which are substances normally associatedwith adverse health effects on lungs (Li et al., 2003). Current engine strategies applied may be modifyingthe composition and characteristics of particle emissions. In this context, finding an equilibrium in theapplication of the strategies to reduce the accumulation mode particle number and avoid the generationof nuclei mode particles, becomes important.
As a result of the increasing concern on the size and number of particle emissions, current legislationconcerning particle standards is under reconsideration in order to introduce a procedure for particle sizeand number measurements. From the research work in the GRPE European Particle Measurement Program(PMP) (2004), a draft has been proposed with the purpose of introducing a new method to measure particlenumber in the European engines certification procedures. In the draft, removal of volatiles prior to particlenumber measurement by pre-heating the sample flow is proposed. The removal of nucleation mode is notso close to reality, keeping in mind that nuclei mode particles have been measured in real road conditions(Kittelson & Watts, 2002). It must also be taken into account that even though nucleation particles arenot emitted directly by the engine, the gaseous precursors responsible for nucleation are direct productsfrom engine combustion. Thus, future Diesel engine designers should work to reduce not only regulatedgaseous and soot particle emissions, but also the precursors that may lead to the formation of the nucleationmode when exhaust gases are evacuated into the atmosphere.
Further research on health effects and on the nature and formation process of volatile nucleation modeparticles is necessary in order to find solutions in the right direction.These new solutions should be focusedtowards the control of factors promoting nucleation of volatile particles. With the current knowledge thesesolutions seem to be directed towards fuel sulphur content reduction, control of the way the current enginestrategies are applied and the development of new engine strategies and post-treatment methods able toachieve simultaneous reduction of nucleation and accumulation modes particle number.
6. Summary and conclusions
The effects of injection pressure, start of injection and exhaust gas recirculation on the exhaust aerosolparticle size distribution from a state-of-the-art Heavy Duty Diesel engine were experimentally investi-gated. The impact of each of the studied parameters on the different size classes that compose the total sizemeasurement region was evaluated, and the sensitivity of the size distributions to progressive variationsof the parameters was also examined for each engine operation mode considered.
Increasing injection pressure was generally found to reduce the accumulation mode particle numberand the CMD of the distributions. A sharp increase in the nucleation mode particle number was observedin the case of highest injection pressure for some engine conditions. The higher the size class, the higherthe sensitivity observed to increasing injection pressure.
Not defined trend was found in the study of the influence of injection timing, but a reduction in theaccumulation mode particle number was found in some cases for early start of injection, while notrelated change was observed in the nuclei mode. The distributions were not shifted by varying the startof injection. Generally, the size classes most affected by variations of start of injection were either thecentral or the extreme ones. Injection timing turned out to be less influential on the size distributions thanEGR and injection pressure.
1274 J.M. Desantes et al. / Aerosol Science 36 (2005) 1251–1276
Increasing exhaust gas recirculation increased the particle number of the accumulation mode and shiftedthe size distributions to higher sizes, resulting in an increase of the CMD. Nuclei mode was eliminatedby the application of EGR, due to the suppression of the nucleation process. The higher the accumulationmode particle size class, the higher the sensitivity to changes in EGR, resulting in an arise in the numberof particles. Moreover, the small size classes were greatly affected by EGR application, when a nucleimode was observed. An interaction was found between the nucleation and the accumulation mode, whichsupports the hypothesis than a low accumulation mode particle number is a factor favouring the nucleationprocess. This influence has been shown to be important for the formation of the nuclei mode, as well asthe fuel sulphur content.
Engine speed and load conditions were also found to influence particle size distributions greatly, withspecial importance of the effect of the engine speed on accumulation mode particles oxidation. A corre-lation was found between accumulation mode particle number and the CMD of the distributions emittedfor each engine operation mode, suggesting that each engine operation conditions produce particles ofrelated characteristics in terms of size and number, independently of the engine strategy applied. Simi-lar correlations were found between particle mass, and accumulation mode particle number and CMD,separately. Although other authors (Lehmann et al., 2003) recently stated that a single correlation existsbetween particle number and particulate mass for an specific engine, in this study stratified relationshipswere found for each engine operation mode.
Acknowledgements
This work was done within the frame of the project PARTSIZE (NNE5-2001-00108), financed byEuropean Commission and the Spanish Government (DPI2002-11471-E).
References
Abdul-Khalek, I., Kittelson, D. B., & Brear, F. (1999).The influence of dilution conditions on diesel exhaust particle sizedistribution measurements. SAE Technical paper series, 1999-01-1142.
Aufdenblatten, K., Schänzlin, A., Bertola, A., Mohr, M., Przybilla, K., & Lutz, T. (2001). Charakterisierung der Partikelemissionvon modernen Verbrennungsmotoren.Motortechnische Zeitschrift, 63(Nr.11.S), 962–974.
Andersson, J., Wedekind, B., Hall, D., Stradling, R., & Wilson, G., (2001).DETR/SMMT/CONCAWE Particulate ResearchProgramme: Light Duty Results. SAE Technical paper series, 2001-01-3577.
Bagley, S. T., Baumgard, K. J, Gratz, L. D., Johnson, J. H., & Leddy, D. G. (1996).Characterization of fuel and aftertreatmentdevice effects on diesel emissions. Research Report 76 Health Effects Institute, USA. URL:http://www.healtheffects.org/
Baumgard, K. J., Johnson, J. H. (1996).The Effect of Fuel and Engine Design on Diesel Exhaust Particle Size Distributions.SAE Technical paper series, 960131.
Bertola, A., Schubiger, R., Kasper, A., Matter, U., Forss, A. M., Mohr, M., Boulouchos, K., Lutz, T. (2001).Characterization ofdiesel particulate emissions in heavy duty DI diesel engines with common rail fuel injection. Influence of injection parametersand fuel composition. SAE Technical paper series, 2001-01-3573.
Desantes, J. M., Bermúdez, V., Pastor, J. V., & Fuentes, E. (2004). Methodology for measuring exhaust aerosol size distributionsby means of a scanning mobility particle sizer.Measurement Science and Technology, 15, 2083–2098.
Directive 1999/96/EC of the European Parliament and the Council of December 13, 1999.Official Journal of the EuropeanCommunities, L 44, 1–155.
Heimgärtner, C., Schraml, S., Will, S., & Leipertz, A. (2001). Laser-induced incandescence soot analyzer (LI2SA) for sootmass concentration and primary particle size measurement in engine exhaust gases.The fifth international symposium ondiagnostics and modeling of combustion in internal combustion engines (COMODIA 2001), July 1–4, 2001, Nagoya.

J.M. Desantes et al. / Aerosol Science 36 (2005) 1251–1276 1275
Heywood, J. B. (1988).Internal combustion engine fundamentals. New York: McGraw-Hill International Editions.Jaeger, L. W., Boulouchos, K., & Mohr, M., 1999.Analysis of factors influencing particulate matter emissions of a compression-
ignition direction-injection engine. SAE Technical paper series, 1999-01-3492.Katsouyanni, K., Zmirou, D., & Spix, C. (1996). Short term effects of air pollution on health: An European approach using
epidemiological time series data. The APHEA protocol.Journal of Epidemiology and Community Health, 50, 12–18.Kim, S., Jaques, P., Chang, M., & Sioutas, C. (2001). Versatile aerosol concentration enrichment systems (VACES) for
simultaneous in vitro and in vivo evaluation of toxic effects of ultrafine, fine and coarse ambient particles. Part II: fieldevaluation.Journal of Aerosol Science, 11, 1299–1314.
Kittelson, D. B. (1998a). Engines and nanoparticles: A review.Journal of Aerosol Science, 29, 575–588.Kittelson, D. B., Watts, W. F., & Arnold, M. (1998b).Review of diesel particulate sampling methods. Department of Mechanical
Engineering: University of Minnesota.Kittelson, D. B., & Watts, W. F. (2002).Diesel Aerosol Sampling Methodology (CRC E-43). URL: http://www.crcao.com/.Kreso, A. M., Johnson, J. H., Gratz, L. D., Bagley, S. T., & Leddy, D. G. (1998).A study of the effects of exhaust gas recirculation
on heavy-duty diesel engine emissions. SAE Technical paper series, 981422.Ladommatos, N., Balian, R., Horrocks, R., & Cooper, L. (1996a).The effect of exhaust gas recirculation on combustion and
NOx emissions in a high-speed direct-injection diesel engine. SAE Technical paper series, 960840.Ladommatos, N., Balian, R., Horrocks, R., & Cooper, L. (1996b).The effect of exhaust gas recirculation on soot formation in a
high-speed direct-injection diesel engine. SAE Technical paper series, 960841.Lehmann, U., Mohr, D. B., Schweizer, T., & Rütter, J. (2003). Number size distribution of particulate emissions of heavy-duty
engine in real world test cycles.Atmospheric Environment, 37, 5247–5259.Li, N., Hao, M., Phalen, R. F., Hinds, W. C., & Nel, A. E. (2003). Particulate air pollutants and asthma. A paradigm for the role
of oxidative stress in PM-induced adverse health effects.Clinical Inmunology, 109, 250–265.Li, N., Kim, S., Wang, M., Froines, J., Sioutas, C., & Nel, A. (2002). Use of a stratified oxidative stress model to study the
biological effects of ambient concentrated and diesel exhaust particulate matter.Inhalation Toxicology, 14, 459–486.Mathis, U. (2002). Influencing parameters of nanoparticles formation from diesel exhaust.Proceedings of the 6th international
ETH-conference on nanoparticle measurements, 19–21, August, 2002.McAughey, J. J. (1997).Regional lung deposition and dose of ambient particulate in humans by particle mass and number. AEA
Technology, Aerosol Science Centre.Metz, N., Resch, G., & Steinparzer, F. (1999). Characterization of particulate matter emission of modern diesel passenger cars.
Symposium “Transport and Air Pollution”. COST 310 Final Conference, Graz, 31.5-2-6.1999.Mohr, M., Jaeger, L. W., & Boulouchos, K. (2001). The influence of engine parameters on particulate emissions.Motortechnische
Zeitschrift Worldwide, 62, 686–692.Nehmer, D. A., & Reitz, R. D. (1994).Measurement of the effect of injection rate and split injections on diesel engine soot and
NOx emissions. SAE Technical paper series, 940668.Niemi, S. A., Paanu, T. P. J., & Laurén, M. J. (2004). Effect of injection timing, EGR and EGR cooling on the exhaust particle
number and size distribution of an off-road Diesel engine.SAE Technical paper series, 2004-01-1988.Oberdörster, G., Ferin, J., & Lehnert, B. E. (1994a). Correlation between particle size and in vivo particle persistence and lung
injury. Environmental Health Perspectives, 102, S5.Oberdörster, G., Gelein, R. M., Ferin, J., & Weiss, B. (1994b). Association of particulate air pollution and acute mortality:
Involvement of ultrafine particles.Inhalation Toxicology, 7, 111–124.Oberdörster, G., & Utell, M. J. (2002). Ultrafine particles in the urban air: To the respiratory track and beyond.Environmental
Health Perspectives, 110, A440–A441.Pagán, J. (1999).Study of particle size distributions emitted by a diesel engine. SAE Technical paper series, 1999-01-1141.Pickett, L. M., & Siebers, D. L. (2004). Soot in diesel fuel jets: Effects of ambient temperature, ambient density, and injection
pressure.Combustion and Flame, 138, 114–135.Pope, C. A., Thun, M. J., Namboodiri, M. M., Dockery, D. W., Evans, J. S., Speizer, F. E., & Heath, C. W. (1995). Particulate air
pollution as a predictor of mortality in a prospective study of US adults.American Journal of Respiratory and Critical CareMedicine, 151, 669–674.
Ristovski, Z. D., & Morawska L. (2002). Final Report of a Comparative Investigation of Particle and Gaseous Emissions FromTwelve In-Service B.C.C Buses Operating on 50 and 500 ppm Sulfur Diesel Fuel, QUT, Report prepared for BCC and BPAustralia, August 2002.
1276 J.M. Desantes et al. / Aerosol Science 36 (2005) 1251–1276
Shi, J. P., Harrison, R. M., & Brear, F. (1999). Particle size distribution from a modern heavy duty diesel engine.The Science ofthe Total Environment, 235, 305–317.
Spix, C., Anderson, H. R., Schwartz, J., Vigotti, M. A., LeTetre, A., Vonk, J. M., Toulami, G., Balducci, F., Piekarski, T.,Bacharova, L., Tobias, A., Ponka, A., & Katsouyanni, K. (1998). Short term effects of air pollution on hospital admissions ofrespiratory diseases in Europe: A quantitative summary of APHEA project results.Archives of Environmental Health, 53(1),54–64.
Suresh, A. & Johnson, J. H. (2001).A study of the dilution effects on particle size measurement from a heavy-duty diesel enginewith EGR. SAE Technical paper series, 2001-01-0220.
Vogt, R., Scheer, V., Casati, R., & Benter, T. (2003). On-road measurements of particle emission in the exhaust plume of a dieselpassenger car.Environmental Science and Technology, 37, 4070–4076.
Wedekind, B.,Andersson, J., Hall, D., Stradling, R., Barnes, C., &Wilson, G. (2000).DETR/SMMT/CONCAWEParticleResearchProgramme: Heavy Duty Results. SAE Technical paper series, 2000-01-2851.
Copyright © 2022 FDOKUMEN