Effects of chemical preservation on bulk and amino acid ...
11
RESEARCH ARTICLE Effects of chemical preservation on bulk and amino acid isotope ratios of zooplankton, fish, and squid tissues Elizabeth D. Hetherington 1,2 | Carolyn M. Kurle 1 | Mark D. Ohman 2 | Brian N. Popp 3 1 Division of Biological Sciences, University of California, San Diego, La Jolla, CA, USA 2 Scripps Institution of Oceanography, University of California San Diego, La Jolla, CA, USA 3 Department of Earth Sciences, University of Hawaii at Manoa, Honolulu, HI, USA Correspondence E. D. Hetherington, Scripps Institution of Oceanography, University of California, San Diego, 8622 Kennel Way, La Jolla, CA 92037, USA. Email: [email protected] Funding information Frontiers of Innovation Scholarship (University of California San Diego); National Science Foundation, Grant/Award Number: OCE1041329 Rationale: It is imperative to understand how chemical preservation alters tissue isotopic compositions before using historical samples in ecological studies. Specifically, although compound‐specific isotope analysis of amino acids (CSIA‐AA) is becoming a widely used tool, there is little information on how preservation techniques affect amino acid δ 15 N values. Methods: We evaluated the effects of chemical preservatives on bulk tissue δ 13 C and δ 15 N and amino acid δ 15 N values, measured by gas chromatography/isotope ratio mass spectrometry (GC/IRMS), of (a) tuna (Thunnus albacares) and squid (Dosidicus gigas) muscle tissues that were fixed in formaldehyde and stored in ethanol for 2 years and (b) two copepod species, Calanus pacificus and Eucalanus californicus, which were preserved in formaldehyde for 24–25 years. Results: Tissues in formaldehyde‐ethanol had higher bulk δ 15 N values (+1.4, D. gigas; +1.6‰, T. albacares), higher δ 13 C values for D. gigas (+0.5‰), and lower δ 13 C values for T. albacares (-0.8‰) than frozen samples. The bulk δ 15 N values from copepods were not different those from frozen samples, although the δ 13 C values from both species were lower (-1.0‰ for E. californicus and -2.2‰ for C. pacificus) than those from frozen samples. The mean amino acid δ 15 N values from chemically preserved tissues were largely within 1‰ of those of frozen tissues, but the phenylalanine δ 15 N values were altered to a larger extent (range: 0.5–4.5‰). Conclusions: The effects of preservation on bulk δ 13 C values were variable, where the direction and magnitude of change varied among taxa. The changes in bulk δ 15 N values associated with chemical preservation were mostly minimal, suggesting that storage in formaldehyde or ethanol will not affect the interpretation of δ 15 N values used in ecological studies. The preservation effects on amino acid δ 15 N values were also mostly minimal, mirroring bulk δ 15 N trends, which is promising for future CSIA‐AA studies of archived specimens. However, there were substantial differences in phenylalanine and valine δ 15 N values, which we speculate resulted from interference in the chromatographic resolution of unknown compounds rather than alteration of tissue isotopic composition due to chemical preservation. Received: 11 September 2018 Revised: 31 December 2018 Accepted: 31 January 2019 DOI: 10.1002/rcm.8408 Rapid Commun Mass Spectrom. 2019;33:935–945. © 2019 John Wiley & Sons, Ltd. wileyonlinelibrary.com/journal/rcm 935
-
Upload
khangminh22 -
Category
Documents
-
view
4 -
download
0
Transcript of Effects of chemical preservation on bulk and amino acid ...
Received: 11 September 2018 Revised: 31 December 2018 Accepted: 31 January 2019
DOI: 10.1002/rcm.8408
R E S E A R CH AR T I C L E
Effects of chemical preservation on bulk and amino acidisotope ratios of zooplankton, fish, and squid tissues
Elizabeth D. Hetherington1,2 | Carolyn M. Kurle1 | Mark D. Ohman2 | Brian N. Popp3
1Division of Biological Sciences, University of
California, San Diego, La Jolla, CA, USA
2Scripps Institution of Oceanography,
University of California San Diego, La Jolla,
CA, USA
3Department of Earth Sciences, University of
Hawaii at Manoa, Honolulu, HI, USA
Correspondence
E. D. Hetherington, Scripps Institution of
Oceanography, University of California, San
Diego, 8622 Kennel Way, La Jolla, CA 92037,
USA.
Email: [email protected]
Funding information
Frontiers of Innovation Scholarship (University
of California San Diego); National Science
Foundation, Grant/Award Number:
OCE1041329
Rapid Commun Mass Spectrom. 2019;33:935–945.
Rationale: It is imperative to understand how chemical preservation alters tissue
isotopic compositions before using historical samples in ecological studies.
Specifically, although compound‐specific isotope analysis of amino acids (CSIA‐AA)
is becoming a widely used tool, there is little information on how preservation
techniques affect amino acid δ15N values.
Methods: We evaluated the effects of chemical preservatives on bulk tissue δ13C
and δ15N and amino acid δ15N values, measured by gas chromatography/isotope
ratio mass spectrometry (GC/IRMS), of (a) tuna (Thunnus albacares) and squid
(Dosidicus gigas) muscle tissues that were fixed in formaldehyde and stored in
ethanol for 2 years and (b) two copepod species, Calanus pacificus and Eucalanus
californicus, which were preserved in formaldehyde for 24–25 years.
Results: Tissues in formaldehyde‐ethanol had higher bulk δ15N values (+1.4, D.
gigas; +1.6‰, T. albacares), higher δ13C values for D. gigas (+0.5‰), and lower
δ13C values for T. albacares (−0.8‰) than frozen samples. The bulk δ15N values
from copepods were not different those from frozen samples, although the δ13C
values from both species were lower (−1.0‰ for E. californicus and−2.2‰ for C.
pacificus) than those from frozen samples. The mean amino acid δ15N values from
chemically preserved tissues were largely within 1‰ of those of frozen
tissues, but the phenylalanine δ15N values were altered to a larger extent (range:
0.5–4.5‰).
Conclusions: The effects of preservation on bulk δ13C values were variable, where
the direction and magnitude of change varied among taxa. The changes in bulk δ15N
values associated with chemical preservation were mostly minimal, suggesting that
storage in formaldehyde or ethanol will not affect the interpretation of δ15N values
used in ecological studies. The preservation effects on amino acid δ15N values
were also mostly minimal, mirroring bulk δ15N trends, which is promising for future
CSIA‐AA studies of archived specimens. However, there were substantial
differences in phenylalanine and valine δ15N values, which we speculate resulted
from interference in the chromatographic resolution of unknown compounds rather
than alteration of tissue isotopic composition due to chemical preservation.
© 2019 John Wiley & Sons, Ltd.wileyonlinelibrary.com/journal/rcm 935
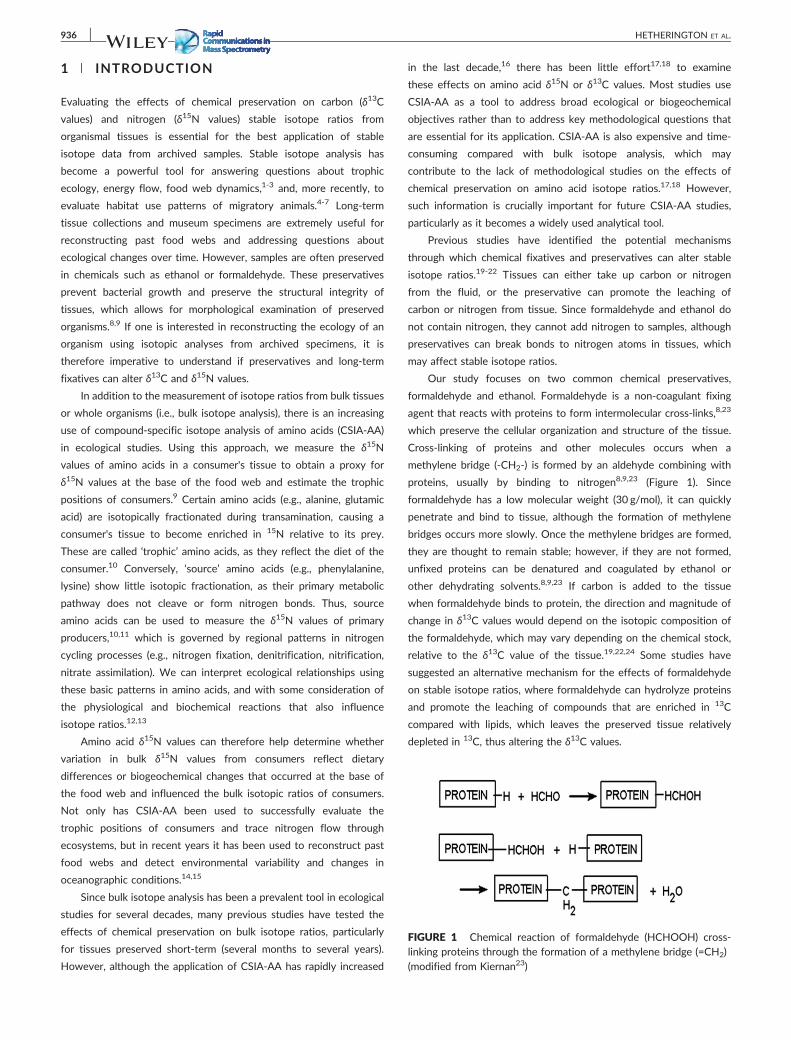
FIGURE 1 Chemical reaction of formaldehyde (HCHOOH) cross‐linking proteins through the formation of a methylene bridge (=CH2)(modified from Kiernan23)
936 HETHERINGTON ET AL.
1 | INTRODUCTION
Evaluating the effects of chemical preservation on carbon (δ13C
values) and nitrogen (δ15N values) stable isotope ratios from
organismal tissues is essential for the best application of stable
isotope data from archived samples. Stable isotope analysis has
become a powerful tool for answering questions about trophic
ecology, energy flow, food web dynamics,1-3 and, more recently, to
evaluate habitat use patterns of migratory animals.4-7 Long‐term
tissue collections and museum specimens are extremely useful for
reconstructing past food webs and addressing questions about
ecological changes over time. However, samples are often preserved
in chemicals such as ethanol or formaldehyde. These preservatives
prevent bacterial growth and preserve the structural integrity of
tissues, which allows for morphological examination of preserved
organisms.8,9 If one is interested in reconstructing the ecology of an
organism using isotopic analyses from archived specimens, it is
therefore imperative to understand if preservatives and long‐term
fixatives can alter δ13C and δ15N values.
In addition to the measurement of isotope ratios from bulk tissues
or whole organisms (i.e., bulk isotope analysis), there is an increasing
use of compound‐specific isotope analysis of amino acids (CSIA‐AA)
in ecological studies. Using this approach, we measure the δ15N
values of amino acids in a consumer's tissue to obtain a proxy for
δ15N values at the base of the food web and estimate the trophic
positions of consumers.9 Certain amino acids (e.g., alanine, glutamic
acid) are isotopically fractionated during transamination, causing a
consumer's tissue to become enriched in 15N relative to its prey.
These are called ‘trophic’ amino acids, as they reflect the diet of the
consumer.10 Conversely, ‘source’ amino acids (e.g., phenylalanine,
lysine) show little isotopic fractionation, as their primary metabolic
pathway does not cleave or form nitrogen bonds. Thus, source
amino acids can be used to measure the δ15N values of primary
producers,10,11 which is governed by regional patterns in nitrogen
cycling processes (e.g., nitrogen fixation, denitrification, nitrification,
nitrate assimilation). We can interpret ecological relationships using
these basic patterns in amino acids, and with some consideration of
the physiological and biochemical reactions that also influence
isotope ratios.12,13
Amino acid δ15N values can therefore help determine whether
variation in bulk δ15N values from consumers reflect dietary
differences or biogeochemical changes that occurred at the base of
the food web and influenced the bulk isotopic ratios of consumers.
Not only has CSIA‐AA been used to successfully evaluate the
trophic positions of consumers and trace nitrogen flow through
ecosystems, but in recent years it has been used to reconstruct past
food webs and detect environmental variability and changes in
oceanographic conditions.14,15
Since bulk isotope analysis has been a prevalent tool in ecological
studies for several decades, many previous studies have tested the
effects of chemical preservation on bulk isotope ratios, particularly
for tissues preserved short‐term (several months to several years).
However, although the application of CSIA‐AA has rapidly increased
in the last decade,16 there has been little effort17,18 to examine
these effects on amino acid δ15N or δ13C values. Most studies use
CSIA‐AA as a tool to address broad ecological or biogeochemical
objectives rather than to address key methodological questions that
are essential for its application. CSIA‐AA is also expensive and time‐
consuming compared with bulk isotope analysis, which may
contribute to the lack of methodological studies on the effects of
chemical preservation on amino acid isotope ratios.17,18 However,
such information is crucially important for future CSIA‐AA studies,
particularly as it becomes a widely used analytical tool.
Previous studies have identified the potential mechanisms
through which chemical fixatives and preservatives can alter stable
isotope ratios.19-22 Tissues can either take up carbon or nitrogen
from the fluid, or the preservative can promote the leaching of
carbon or nitrogen from tissue. Since formaldehyde and ethanol do
not contain nitrogen, they cannot add nitrogen to samples, although
preservatives can break bonds to nitrogen atoms in tissues, which
may affect stable isotope ratios.
Our study focuses on two common chemical preservatives,
formaldehyde and ethanol. Formaldehyde is a non‐coagulant fixing
agent that reacts with proteins to form intermolecular cross‐links,8,23
which preserve the cellular organization and structure of the tissue.
Cross‐linking of proteins and other molecules occurs when a
methylene bridge (‐CH2‐) is formed by an aldehyde combining with
proteins, usually by binding to nitrogen8,9,23 (Figure 1). Since
formaldehyde has a low molecular weight (30 g/mol), it can quickly
penetrate and bind to tissue, although the formation of methylene
bridges occurs more slowly. Once the methylene bridges are formed,
they are thought to remain stable; however, if they are not formed,
unfixed proteins can be denatured and coagulated by ethanol or
other dehydrating solvents.8,9,23 If carbon is added to the tissue
when formaldehyde binds to protein, the direction and magnitude of
change in δ13C values would depend on the isotopic composition of
the formaldehyde, which may vary depending on the chemical stock,
relative to the δ13C value of the tissue.19,22,24 Some studies have
suggested an alternative mechanism for the effects of formaldehyde
on stable isotope ratios, where formaldehyde can hydrolyze proteins
and promote the leaching of compounds that are enriched in 13C
compared with lipids, which leaves the preserved tissue relatively
depleted in 13C, thus altering the δ13C values.
HETHERINGTON ET AL. 937
Ethanol is a non‐cross‐linking reagent, which preserves nucleic
acids better than aldehydes, and is therefore a common preservation
medium for samples that may be used for genetic analyses.
However, ethanol may also affect the carbon content and δ13C
values of tissues.9 Ethanol can extract lipids and partition them into
ethanol based on their solubility.25 Lipids are depleted in 13C relative
to proteins, carbohydrates, and nucleic acids that comprise animal
tissues.22,26 If ethanol removes lipids from samples, we would expect
a decrease in the carbon content and C/N ratios, and an increase in
the δ13C values of preserved samples.27
Although previous studies have examined the mechanisms
through which chemical preservation can alter bulk isotope ratios,
the results have been somewhat inconsistent across taxa,
preservation method, and length of preservation. Generally, previous
research (see19,20,22 for comprehensive reviews on preservation
effects on bulk isotope ratios) demonstrates that formaldehyde or
ethanol preservation has little effect on bulk δ15N values (<1.5‰),
but can substantially alter bulk δ13C values, where the direction and
magnitude of change vary across studies.19-22,28,29 The few studies
(e.g.,18) that have examined preservation effects on amino acid δ15N
values have reported no effect, but these studies have been limited
in scope, preservation technique, time (~ 1 year), and taxa (fish).
The primary motivation for this study is to perform experiments
that test the effects of preservation on amino acid δ15N values and
contribute to a better overall understanding of the effects of
chemical preservation techniques on stable isotope ratios. For the
bulk component of our study, we add to existing data and aim to
converge on likely mechanistic explanations of preservation effects,
as previous studies have reported somewhat conflicting results. In
addition, we have the rare opportunity to examine the effects of
longer‐term (>10 years) preservation on isotope ratios. These
experiments are logistically challenging, as they require sampling of
paired specimens that were stored using different methods of
preservation for many years. Testing the potential long‐term effects
of formaldehyde on stable isotope ratios is particularly important, as
formaldehyde‐preserved specimens are common in government,
university, and museum collections. These specimens may be
particularly useful, as an increasingly common objective in CSIA‐AA
studies is to reconstruct past trophic baselines and oceanic
conditions based on source amino acid δ15N values.15
In this study, we first evaluate the effects of formaldehyde
fixation followed by storage in ethanol for up to 2 years on bulk
δ15N and δ13C values and amino acid δ15N values from tuna and
squid. We also determine the δ15N and δ13C values from copepods
preserved frozen or stored in formaldehyde for 24–25 years. Since
carbon from formaldehyde can be added to tissues during the
fixation process, we expect to observe higher carbon content and
carbon‐to‐nitrogen (C/N) ratios, and a change in δ13C values, in
chemically preserved tissues compared with frozen samples. Based
on previous studies, we hypothesize that formaldehyde and
formaldehyde‐ethanol preservation will have little effect on the δ15N
values of organismal tissues, including those of amino acids. We
expect that patterns in amino acid δ15N values will mirror those
found in bulk δ15N values, which can aid in our prediction
and application of how chemical preservatives alter bulk and CSIA‐
AA samples.
2 | EXPERIMENTAL
2.1 | Sampling method and preservation techniques
It is often necessary to preserve samples following their collection, and
freezing is a widely used method of storing samples with minimal
effects on stable isotope ratios. However, freezing is often
unavailable during field studies and is typically not the method used
for archiving museum specimens when the preservation of
anatomical features is required. To investigate effects of
formaldehyde fixation‐ethanol preservation on organismal isotope
ratios, we compared this protocol with preservation via freezing,
using three specimens each of yellowfin tuna (Thunnus albacares) and
Humboldt squid (Dosidicus gigas), both of which are commercially
and ecologically significant consumers in marine food webs. Tuna
and squid specimens were collected on recreational fishing vessels
and frozen intact until later processing. To test for differences
between frozen and formaldehyde‐ethanol preserved samples within
each specimen, we collected a muscle tissue sample from each
individual (n = 3 T. albacares and n = 3 D. gigas) and divided each
sample into six, approximately 1 g subsamples. We collected samples
from the dorsal side adjacent to the dorsal fin for each T. albacares
and from the dorsal mantle muscle (with skin removed) for each D.
gigas. We followed the protocol for preservation of tissues from
Scripps Institution of Oceanography's marine vertebrate collection.
All non‐frozen samples were initially fixed in 3.7% formaldehyde (the
deionized water to 37% formaldehyde ratio was 1:9) for
approximately 48 h. To wash formalin out of the tissue, we
performed rinses, where samples were placed in deionized water for
48 h and the deionized water was replaced after 24 h. The samples
were then stored in 95% ethanol for specific time intervals: 1 week,
1month, 3months, 6months, and 2 years.
Following the analysis of isotopic data from the formaldehyde‐
ethanol experiment, we separately tested the effects of
formaldehyde and ethanol on tuna and squid muscle. Our sampling
procedures were similar to our initial experiment, although a
different bottle of formaldehyde was used, as this experiment was
conducted 2 years after our initial experiment. We recognize that the
δ13C values of formaldehyde can vary between individual bottles
and suppliers. Since the 2‐year experiment indicated that the length
of preservation was not a significant factor, we collected three 1‐g
muscle samples from new specimens (tuna: n = 3; squid: n = 3). The
first sample from each specimen was frozen, the second was stored
in formaldehyde for 1month, and the third sample was stored in
ethanol for 1month. For both experiments, after samples were
removed from the preservatives or thawed, they were lyophilized for
24 h, homogenized, and weighed into tin capsules for bulk stable
nitrogen and carbon isotope analysis.
938 HETHERINGTON ET AL.
We also investigated the effects of longer‐term storage in
formaldehyde on bulk isotope ratios from marine zooplankton, as very
few studies have examined these effects on specimens preserved for
longer than several years. These samples were collected by the
California Cooperative Oceanic Fisheries Investigations (CalCOFI;
www.calcofi.org) off central California in March and April of 1991 and
1992 on lines 80 and 83 of the CalCOFI sampling grid (see calcofi.org
for map of sampling locations). Zooplankton were collected by bongo
tows, consisting of two nets with a 0.71‐m diameter31 that uses
oblique tows (the detailed method description for bongo
deployment can be found on the Southwest Fisheries Science Center
website at http://swfsc.noaa.gov/textblock.aspx?Division=FRD&id=
1341). Following collection, one bongo net was fixed in a 3.7%
formaldehyde‐seawater solution, buffered with sodium borate, and
the other was frozen at −80°C until further analysis.
In 2016, we slowly thawed frozen samples and selected adult
females of two copepod species, Calanus pacificus and Eualanus
californicus. These species were selected for several reasons. First, C.
pacificus and E. californicus are abundant zooplankton species in our
collection area and are easily identifiable, even when smaller
anatomical structures are obscured by the freezing and thawing
process. Second, we could compare our results with those from a
previous experiment that tested the effects of 11 years of
preservation on the bulk isotope ratios of these same species.30 We
measured the isotope ratios of these zooplankton species from five
paired bongo samples and, due to the small body size of copepods,
we separately pooled 20 C. pacificus and 10 E. californicus from each
sample to ensure that we had an adequate mass for each species,
required for both bulk and CSIA‐AA. We lyophilized the samples for
24 h, then homogenized and weighed them into tin capsules for
stable isotope analyses.
To evaluate the effects of formaldehyde fixation‐ethanol
preservation on the amino acid δ15N values, we selected samples for
CSIA‐AA based on the results of the bulk isotope analysis. We
selected two each of the T. albacares and D. gigas specimens and
analyzed matched samples that were either frozen or preserved for
2 years following the formaldehyde‐ethanol protocol, and one each
of the tuna and squid that were preserved for 6months in
formaldehyde‐ethanol (n = 10). For zooplankton, we selected two
frozen C. pacificus samples and their paired formaldehyde‐preserved
samples (n = 4) for CSIA‐AA.
2.2 | Sample and data analysis
Wemeasured δ15N and δ13C values, %C, %N, and the ratio of carbon to
nitrogen (C/N molar ratio) at the Stable Isotope Laboratory at the
University of California, Santa Cruz (Santa Cruz, CA, USA). We report
stable isotope ratios in δ notation relative to PDB and atmospheric
N2 for carbon and nitrogen, respectively. The subset of T. albacares,
D. gigas, and C. pacificus samples selected for nitrogen CSIA‐AA was
analyzed at the University of Hawaii Stable Isotope Biogeochemistry
Laboratories (Honolulu, HI, USA). Samples were prepared for CSIA‐
AA by acid hydrolysis followed by derivatization of the amino acids
(see10,32 for details). Samples were hydrolyzed (6 N HCl, 150°C for
70min), esterified (4:1 isopropanol/acetyl chloride), derivatized (3:1
methylene chloride/trifluoroacetyl anhydride), and then measured by
GC/IRMS (Gas Chromatography/Isotope Ratio Mass Spectrometry)
using a Trace gas chromatograph (Thermo Fisher, Waltham, MA, USA)
and a Delta V Plus isotope ratio mass spectrometer (Thermo Fisher)
through a GC‐C III (Thermo Fisher) combustion furnace (980°C), a
reduction furnace (680°C), and a liquid nitrogen cold trap. Samples
were injected (split/splitless, 5:1 split ratio) with a 180°C injector
temperature and a constant helium flow rate of 1.4mLmin−1.
We analyzed samples for CSIA‐AA in triplicate. For quality
control, we co‐injected each sample with internal reference
compounds (norleucine and aminoadipic acid) with known δ15N
values and corrected the sample amino acid δ15N values relative to
these internal references. We also measured an amino acid suite of
12 amino acids with known δ15N values, before and after each
triplicate sample run to ensure that the δ15N measurements were
accurate and within <1‰ of their known values. Our objective was
to measure the δ15N values of 18 amino acids; however, some
amino acids were not abundant enough in our samples to quantify
their δ15N values. Here, we report results from 13 amino acids
grouped into three categories: metabolic, source, and trophic amino
acids.33 The analytical errors (±1 standard deviation) for bulk isotope
ratios were ±0.1‰. The amino acid δ15N values were based on
triplicate sample analysis, where the analytical errors (±1 SD) were
mostly <1.0‰ but ranged from <0.1 to 1.4‰.
We conducted data analyses using the statistical software R.34 We
tested the effects of formaldehyde‐ethanol preservation onT. albacares
and D. gigas muscle first by testing the potential for an interactive
effect of time and species (δ15N ~Time*Species and δ13C
~Time*Species) to determine whether we could group samples from
T. albacares and D. gigas together or analyze them independently. We
then used one‐way repeated measures ANOVA, using the ‘Anova’
function in the car package in R, to evaluate the isotopic differences
between frozen samples and those that were chemically preserved
for different lengths of time. For the long‐term zooplankton
formaldehyde experiment, we used paired t‐tests to compare the
δ13C and δ15N values between frozen and formaldehyde‐preserved C.
pacificus and E. californicus. For the amino acid δ15N data, we used
paired t‐tests to compare isotope ratios from frozen and
formaldehyde‐ethanol preserved samples and used a sequential
Bonferroni (Holm‐Bonferroni) correction for multiple‐comparisons.
3 | RESULTS
3.1 | Tuna and squid preservation experiment (bulkisotope ratios)
We found significant differences between frozen and chemically
preserved tissues (Figure 2, Table 1). There was no significant
interaction between time and species, so we analyzed the bulk δ15N
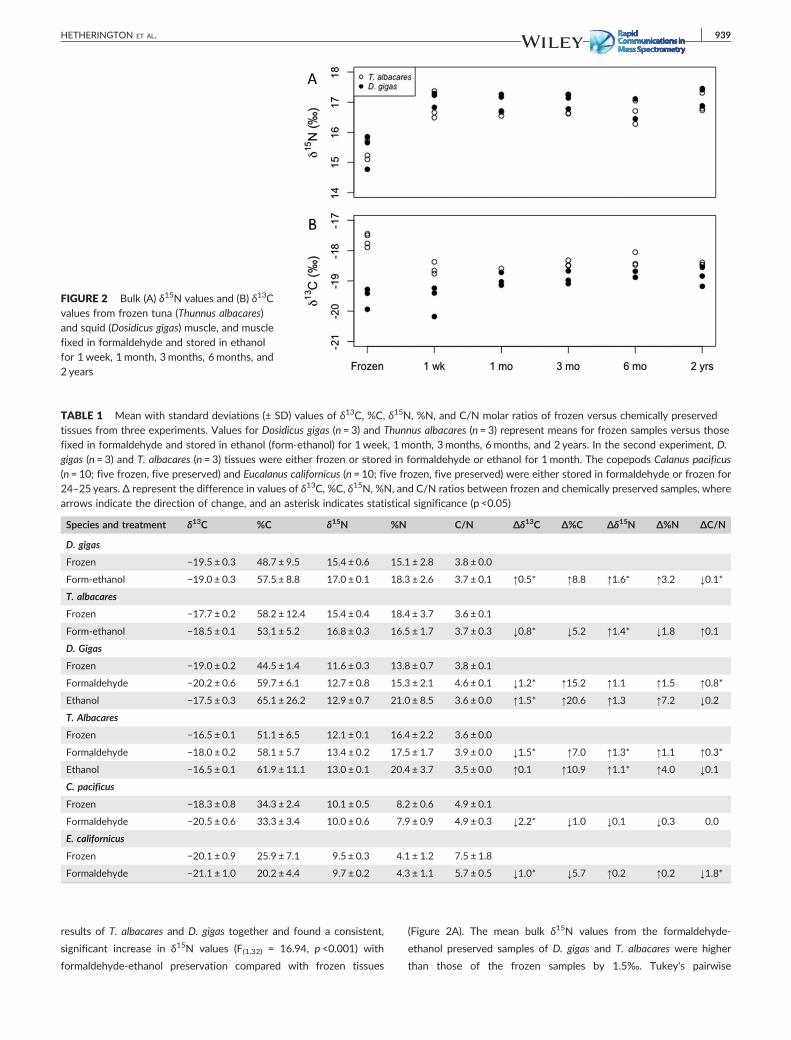
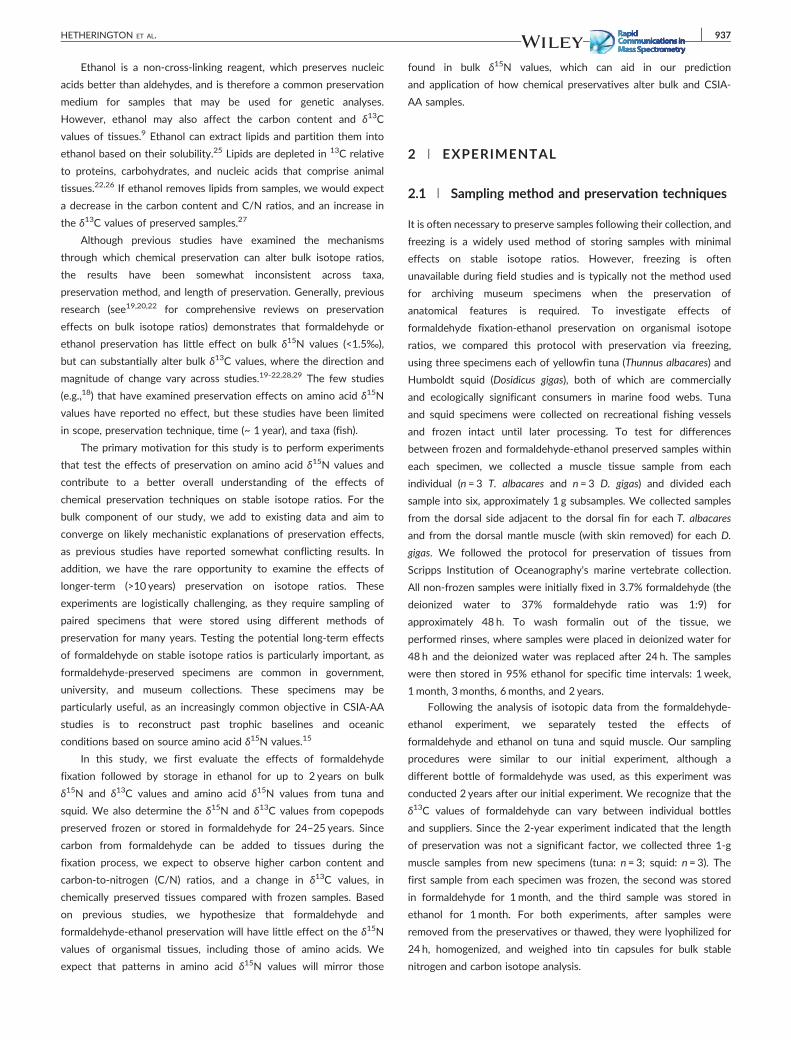
FIGURE 2 Bulk (A) δ15N values and (B) δ13Cvalues from frozen tuna (Thunnus albacares)and squid (Dosidicus gigas) muscle, and musclefixed in formaldehyde and stored in ethanolfor 1 week, 1month, 3months, 6months, and2 years
TABLE 1 Mean with standard deviations (± SD) values of δ13C, %C, δ15N, %N, and C/N molar ratios of frozen versus chemically preservedtissues from three experiments. Values for Dosidicus gigas (n = 3) and Thunnus albacares (n = 3) represent means for frozen samples versus thosefixed in formaldehyde and stored in ethanol (form‐ethanol) for 1week, 1month, 3months, 6 months, and 2 years. In the second experiment, D.gigas (n = 3) and T. albacares (n = 3) tissues were either frozen or stored in formaldehyde or ethanol for 1month. The copepods Calanus pacificus(n = 10; five frozen, five preserved) and Eucalanus californicus (n = 10; five frozen, five preserved) were either stored in formaldehyde or frozen for24–25 years. Δ represent the difference in values of δ13C, %C, δ15N, %N, and C/N ratios between frozen and chemically preserved samples, wherearrows indicate the direction of change, and an asterisk indicates statistical significance (p <0.05)
Species and treatment δ13C %C δ15N %N C/N Δδ13C Δ%C Δδ15N Δ%N ΔC/N
D. gigas
Frozen −19.5 ± 0.3 48.7 ± 9.5 15.4 ± 0.6 15.1 ± 2.8 3.8 ± 0.0
Form‐ethanol −19.0 ± 0.3 57.5 ± 8.8 17.0 ± 0.1 18.3 ± 2.6 3.7 ± 0.1 ↑0.5* ↑8.8 ↑1.6* ↑3.2 ↓0.1*
T. albacares
Frozen −17.7 ± 0.2 58.2 ± 12.4 15.4 ± 0.4 18.4 ± 3.7 3.6 ± 0.1
Form‐ethanol −18.5 ± 0.1 53.1 ± 5.2 16.8 ± 0.3 16.5 ± 1.7 3.7 ± 0.3 ↓0.8* ↓5.2 ↑1.4* ↓1.8 ↑0.1
D. Gigas
Frozen −19.0 ± 0.2 44.5 ± 1.4 11.6 ± 0.3 13.8 ± 0.7 3.8 ± 0.1
Formaldehyde −20.2 ± 0.6 59.7 ± 6.1 12.7 ± 0.8 15.3 ± 2.1 4.6 ± 0.1 ↓1.2* ↑15.2 ↑1.1 ↑1.5 ↑0.8*
Ethanol −17.5 ± 0.3 65.1 ± 26.2 12.9 ± 0.7 21.0 ± 8.5 3.6 ± 0.0 ↑1.5* ↑20.6 ↑1.3 ↑7.2 ↓0.2
T. Albacares
Frozen −16.5 ± 0.1 51.1 ± 6.5 12.1 ± 0.1 16.4 ± 2.2 3.6 ± 0.0
Formaldehyde −18.0 ± 0.2 58.1 ± 5.7 13.4 ± 0.2 17.5 ± 1.7 3.9 ± 0.0 ↓1.5* ↑7.0 ↑1.3* ↑1.1 ↑0.3*
Ethanol −16.5 ± 0.1 61.9 ± 11.1 13.0 ± 0.1 20.4 ± 3.7 3.5 ± 0.0 ↑0.1 ↑10.9 ↑1.1* ↑4.0 ↓0.1
C. pacificus
Frozen −18.3 ± 0.8 34.3 ± 2.4 10.1 ± 0.5 8.2 ± 0.6 4.9 ± 0.1
Formaldehyde −20.5 ± 0.6 33.3 ± 3.4 10.0 ± 0.6 7.9 ± 0.9 4.9 ± 0.3 ↓2.2* ↓1.0 ↓0.1 ↓0.3 0.0
E. californicus
Frozen −20.1 ± 0.9 25.9 ± 7.1 9.5 ± 0.3 4.1 ± 1.2 7.5 ± 1.8
Formaldehyde −21.1 ± 1.0 20.2 ± 4.4 9.7 ± 0.2 4.3 ± 1.1 5.7 ± 0.5 ↓1.0* ↓5.7 ↑0.2 ↑0.2 ↓1.8*
HETHERINGTON ET AL. 939
results of T. albacares and D. gigas together and found a consistent,
significant increase in δ15N values (F(1,32) = 16.94, p <0.001) with
formaldehyde‐ethanol preservation compared with frozen tissues
(Figure 2A). The mean bulk δ15N values from the formaldehyde‐
ethanol preserved samples of D. gigas and T. albacares were higher
than those of the frozen samples by 1.5‰. Tukey's pairwise
940 HETHERINGTON ET AL.
comparisons demonstrated that the δ15N values of frozen samples
were significantly lower than those of formaldehyde‐ethanol
preserved samples (all p <0.0001), but there were no differences
between the δ15N values of frozen tissues and tissues stored only in
ethanol over the five different time periods (p >0.1).
The effects of formaldehyde‐ethanol preservation on the δ13C
values fromT. albacares and D. gigas muscle were more variable. There
was a significant interaction between species (Adj. R2 = 0.71,
p <0.0001), so we measured the δ13C values separately for each. We
found opposite trends, where the δ13C values of formaldehyde‐
ethanol preserved D. gigas muscle were significantly higher than those
of frozen tissue, by ameanof 0.5‰ (F(1,14) = 19.45, p <0.001; Figure 2B;
Table 1), whereas the δ13C values from formaldehyde‐ethanol
preserved T. albacares tissues were lower by 0.6‰ to 0.9‰ than
those of frozen tissues (F(1,14) = 5.23, p = 0.04; Tukey's pairwise
comparisons: p≤0.02; Figure 2B). There were no differences in the
δ13C values of frozen tissues from those of tissues stored in ethanol
over the five different time periods (p >0.1).
We found no differences in %C or %N between formaldehyde‐
ethanol preserved and frozen samples for T. albacares (%C: F(1,15) =
0.90, p = 0.36; %N: F(1,15) = 0.96, p = 0.34) or D. gigas (% C: F(1,14) =
0.56, p >0.1; % N: F(1,14) = 0.27, p >0.1). We used C/N molar ratios
as a proxy for lipid content, where higher ratios indicate more lipid‐
rich tissues. The C/N ratios for squids and tuna were low (<4), and
were fairly uniform, ranging from 3.6 to 3.8 for both species. There
was no difference in C/N ratios between formaldehyde‐ethanol and
frozen samples for T. albacares (F(1,15) = 0.38, p >0.1). However, the
C/N ratios of D. gigas were lower in formaldehyde‐ethanol
preserved samples than in frozen samples (F(1,14) = 9.50, p <0.01),
although the change was small (0.1; Table 1).
In a subsequent experiment where we separately tested the
effects of formaldehyde and ethanol on squid and tuna muscle
tissue, we found that the δ15N values significantly increased with
preservation in both formaldehyde and ethanol by ~1‰ (Table S1,
supporting information). The effects of formaldehyde or ethanol
preservation on δ13C values were mixed; the δ13C values of
formaldehyde‐fixed tissues decreased in both species but those from
samples preserved in ethanol increased by 1.5‰ in D. gigas and
did not change in T. albacares (Table S1, supporting information). The
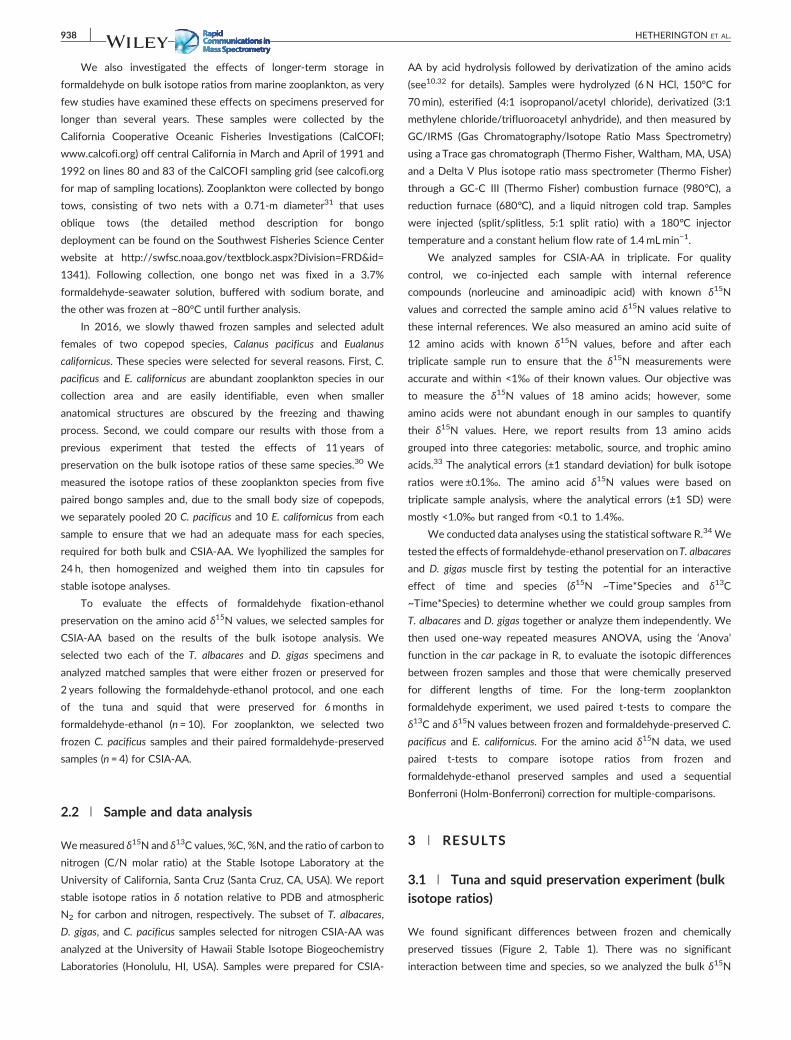
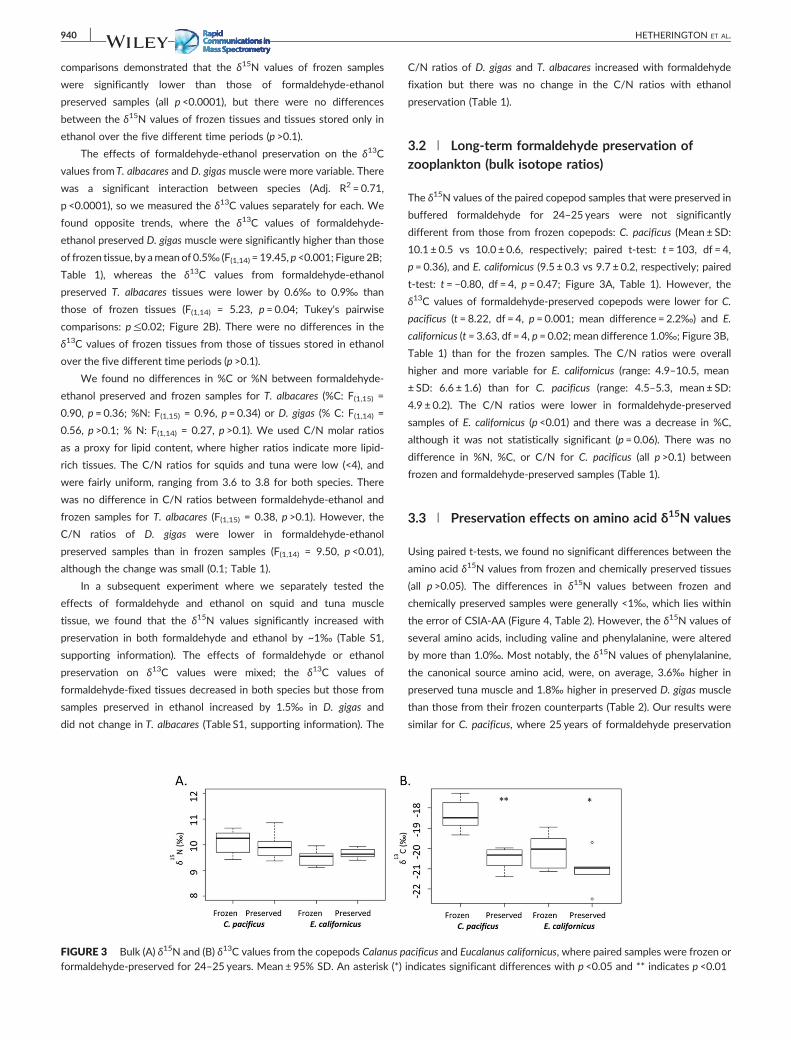
FIGURE 3 Bulk (A) δ15N and (B) δ13C values from the copepods Calanus pformaldehyde‐preserved for 24–25 years. Mean ± 95% SD. An asterisk (*)
C/N ratios of D. gigas and T. albacares increased with formaldehyde
fixation but there was no change in the C/N ratios with ethanol
preservation (Table 1).
3.2 | Long‐term formaldehyde preservation ofzooplankton (bulk isotope ratios)
The δ15N values of the paired copepod samples that were preserved in
buffered formaldehyde for 24–25 years were not significantly
different from those from frozen copepods: C. pacificus (Mean ± SD:
10.1 ± 0.5 vs 10.0 ± 0.6, respectively; paired t‐test: t = 103, df = 4,
p = 0.36), and E. californicus (9.5 ± 0.3 vs 9.7 ± 0.2, respectively; paired
t‐test: t = −0.80, df = 4, p = 0.47; Figure 3A, Table 1). However, the
δ13C values of formaldehyde‐preserved copepods were lower for C.
pacificus (t = 8.22, df = 4, p = 0.001; mean difference = 2.2‰) and E.
californicus (t = 3.63, df = 4, p = 0.02; mean difference 1.0‰; Figure 3B,
Table 1) than for the frozen samples. The C/N ratios were overall
higher and more variable for E. californicus (range: 4.9–10.5, mean
± SD: 6.6 ± 1.6) than for C. pacificus (range: 4.5–5.3, mean ± SD:
4.9 ± 0.2). The C/N ratios were lower in formaldehyde‐preserved
samples of E. californicus (p <0.01) and there was a decrease in %C,
although it was not statistically significant (p = 0.06). There was no
difference in %N, %C, or C/N for C. pacificus (all p >0.1) between
frozen and formaldehyde‐preserved samples (Table 1).
3.3 | Preservation effects on amino acid δ15N values
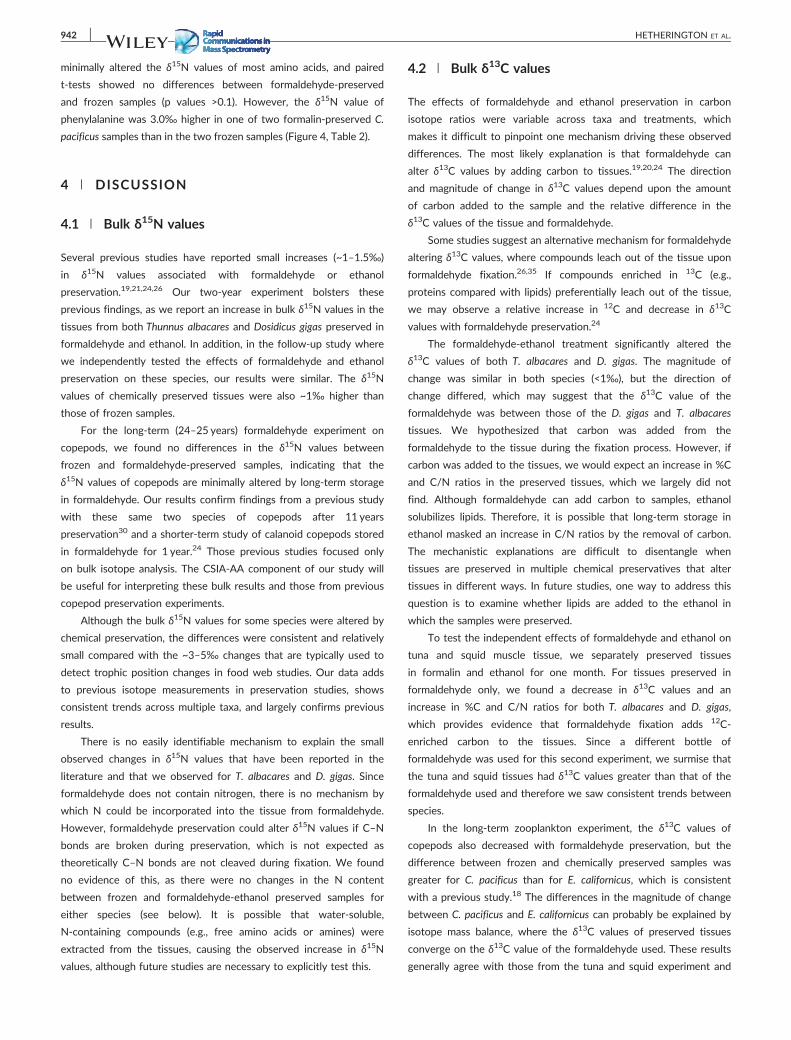
Using paired t‐tests, we found no significant differences between the
amino acid δ15N values from frozen and chemically preserved tissues
(all p >0.05). The differences in δ15N values between frozen and
chemically preserved samples were generally <1‰, which lies within
the error of CSIA‐AA (Figure 4, Table 2). However, the δ15N values of
several amino acids, including valine and phenylalanine, were altered
by more than 1.0‰. Most notably, the δ15N values of phenylalanine,
the canonical source amino acid, were, on average, 3.6‰ higher in
preserved tuna muscle and 1.8‰ higher in preserved D. gigas muscle
than those from their frozen counterparts (Table 2). Our results were
similar for C. pacificus, where 25 years of formaldehyde preservation
acificus and Eucalanus californicus, where paired samples were frozen orindicates significant differences with p <0.05 and ** indicates p <0.01
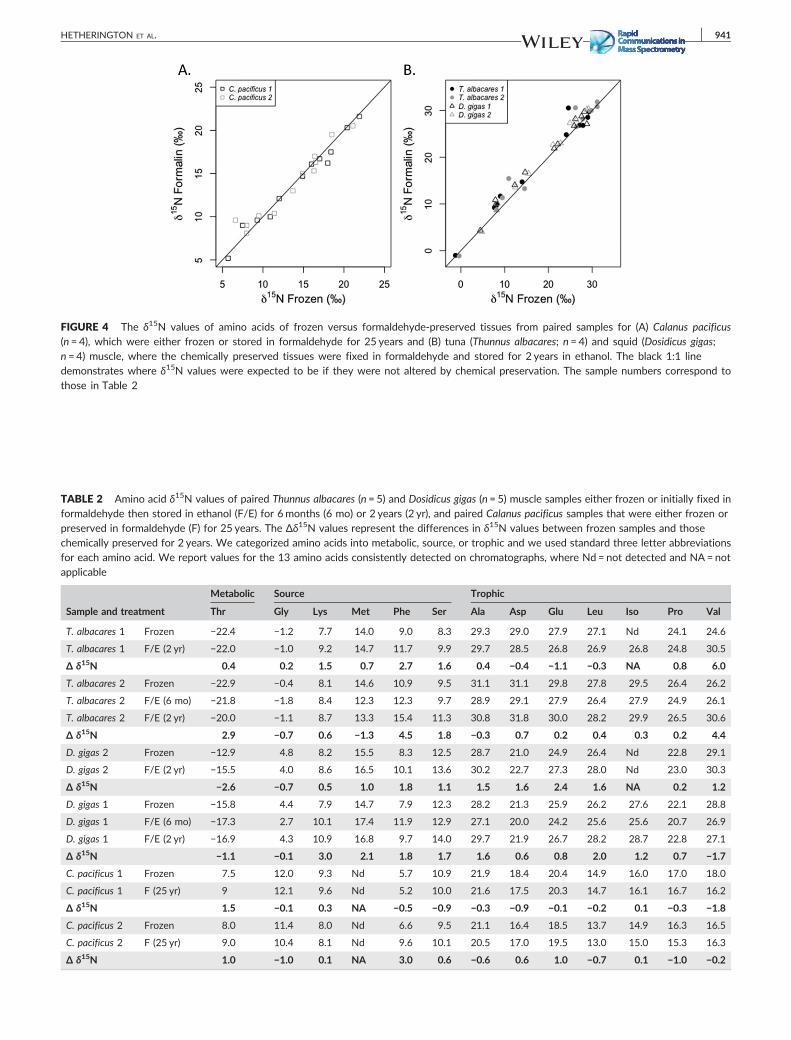
FIGURE 4 The δ15N values of amino acids of frozen versus formaldehyde‐preserved tissues from paired samples for (A) Calanus pacificus(n = 4), which were either frozen or stored in formaldehyde for 25 years and (B) tuna (Thunnus albacares; n = 4) and squid (Dosidicus gigas;n = 4) muscle, where the chemically preserved tissues were fixed in formaldehyde and stored for 2 years in ethanol. The black 1:1 linedemonstrates where δ15N values were expected to be if they were not altered by chemical preservation. The sample numbers correspond tothose in Table 2
TABLE 2 Amino acid δ15N values of paired Thunnus albacares (n = 5) and Dosidicus gigas (n = 5) muscle samples either frozen or initially fixed informaldehyde then stored in ethanol (F/E) for 6months (6 mo) or 2 years (2 yr), and paired Calanus pacificus samples that were either frozen orpreserved in formaldehyde (F) for 25 years. The Δδ15N values represent the differences in δ15N values between frozen samples and thosechemically preserved for 2 years. We categorized amino acids into metabolic, source, or trophic and we used standard three letter abbreviationsfor each amino acid. We report values for the 13 amino acids consistently detected on chromatographs, where Nd = not detected and NA = notapplicable
Sample and treatment
Metabolic Source Trophic
Thr Gly Lys Met Phe Ser Ala Asp Glu Leu Iso Pro Val
T. albacares 1 Frozen −22.4 −1.2 7.7 14.0 9.0 8.3 29.3 29.0 27.9 27.1 Nd 24.1 24.6
T. albacares 1 F/E (2 yr) −22.0 −1.0 9.2 14.7 11.7 9.9 29.7 28.5 26.8 26.9 26.8 24.8 30.5
Δ δ15N 0.4 0.2 1.5 0.7 2.7 1.6 0.4 −0.4 −1.1 −0.3 NA 0.8 6.0
T. albacares 2 Frozen −22.9 −0.4 8.1 14.6 10.9 9.5 31.1 31.1 29.8 27.8 29.5 26.4 26.2
T. albacares 2 F/E (6 mo) −21.8 −1.8 8.4 12.3 12.3 9.7 28.9 29.1 27.9 26.4 27.9 24.9 26.1
T. albacares 2 F/E (2 yr) −20.0 −1.1 8.7 13.3 15.4 11.3 30.8 31.8 30.0 28.2 29.9 26.5 30.6
Δ δ15N 2.9 −0.7 0.6 −1.3 4.5 1.8 −0.3 0.7 0.2 0.4 0.3 0.2 4.4
D. gigas 2 Frozen −12.9 4.8 8.2 15.5 8.3 12.5 28.7 21.0 24.9 26.4 Nd 22.8 29.1
D. gigas 2 F/E (2 yr) −15.5 4.0 8.6 16.5 10.1 13.6 30.2 22.7 27.3 28.0 Nd 23.0 30.3
Δ δ15N −2.6 −0.7 0.5 1.0 1.8 1.1 1.5 1.6 2.4 1.6 NA 0.2 1.2
D. gigas 1 Frozen −15.8 4.4 7.9 14.7 7.9 12.3 28.2 21.3 25.9 26.2 27.6 22.1 28.8
D. gigas 1 F/E (6 mo) −17.3 2.7 10.1 17.4 11.9 12.9 27.1 20.0 24.2 25.6 25.6 20.7 26.9
D. gigas 1 F/E (2 yr) −16.9 4.3 10.9 16.8 9.7 14.0 29.7 21.9 26.7 28.2 28.7 22.8 27.1
Δ δ15N −1.1 −0.1 3.0 2.1 1.8 1.7 1.6 0.6 0.8 2.0 1.2 0.7 −1.7
C. pacificus 1 Frozen 7.5 12.0 9.3 Nd 5.7 10.9 21.9 18.4 20.4 14.9 16.0 17.0 18.0
C. pacificus 1 F (25 yr) 9 12.1 9.6 Nd 5.2 10.0 21.6 17.5 20.3 14.7 16.1 16.7 16.2
Δ δ15N 1.5 −0.1 0.3 NA −0.5 −0.9 −0.3 −0.9 −0.1 −0.2 0.1 −0.3 −1.8
C. pacificus 2 Frozen 8.0 11.4 8.0 Nd 6.6 9.5 21.1 16.4 18.5 13.7 14.9 16.3 16.5
C. pacificus 2 F (25 yr) 9.0 10.4 8.1 Nd 9.6 10.1 20.5 17.0 19.5 13.0 15.0 15.3 16.3
Δ δ15N 1.0 −1.0 0.1 NA 3.0 0.6 −0.6 0.6 1.0 −0.7 0.1 −1.0 −0.2
HETHERINGTON ET AL. 941
942 HETHERINGTON ET AL.
minimally altered the δ15N values of most amino acids, and paired
t‐tests showed no differences between formaldehyde‐preserved
and frozen samples (p values >0.1). However, the δ15N value of
phenylalanine was 3.0‰ higher in one of two formalin‐preserved C.
pacificus samples than in the two frozen samples (Figure 4, Table 2).
4 | DISCUSSION
4.1 | Bulk δ15N values
Several previous studies have reported small increases (~1–1.5‰)
in δ15N values associated with formaldehyde or ethanol
preservation.19,21,24,26 Our two‐year experiment bolsters these
previous findings, as we report an increase in bulk δ15N values in the
tissues from both Thunnus albacares and Dosidicus gigas preserved in
formaldehyde and ethanol. In addition, in the follow‐up study where
we independently tested the effects of formaldehyde and ethanol
preservation on these species, our results were similar. The δ15N
values of chemically preserved tissues were also ~1‰ higher than
those of frozen samples.
For the long‐term (24–25 years) formaldehyde experiment on
copepods, we found no differences in the δ15N values between
frozen and formaldehyde‐preserved samples, indicating that the
δ15N values of copepods are minimally altered by long‐term storage
in formaldehyde. Our results confirm findings from a previous study
with these same two species of copepods after 11 years
preservation30 and a shorter‐term study of calanoid copepods stored
in formaldehyde for 1 year.24 Those previous studies focused only
on bulk isotope analysis. The CSIA‐AA component of our study will
be useful for interpreting these bulk results and those from previous
copepod preservation experiments.
Although the bulk δ15N values for some species were altered by
chemical preservation, the differences were consistent and relatively
small compared with the ~3–5‰ changes that are typically used to
detect trophic position changes in food web studies. Our data adds
to previous isotope measurements in preservation studies, shows
consistent trends across multiple taxa, and largely confirms previous
results.
There is no easily identifiable mechanism to explain the small
observed changes in δ15N values that have been reported in the
literature and that we observed for T. albacares and D. gigas. Since
formaldehyde does not contain nitrogen, there is no mechanism by
which N could be incorporated into the tissue from formaldehyde.
However, formaldehyde preservation could alter δ15N values if C–N
bonds are broken during preservation, which is not expected as
theoretically C–N bonds are not cleaved during fixation. We found
no evidence of this, as there were no changes in the N content
between frozen and formaldehyde‐ethanol preserved samples for
either species (see below). It is possible that water‐soluble,
N‐containing compounds (e.g., free amino acids or amines) were
extracted from the tissues, causing the observed increase in δ15N
values, although future studies are necessary to explicitly test this.
4.2 | Bulk δ13C values
The effects of formaldehyde and ethanol preservation in carbon
isotope ratios were variable across taxa and treatments, which
makes it difficult to pinpoint one mechanism driving these observed
differences. The most likely explanation is that formaldehyde can
alter δ13C values by adding carbon to tissues.19,20,24 The direction
and magnitude of change in δ13C values depend upon the amount
of carbon added to the sample and the relative difference in the
δ13C values of the tissue and formaldehyde.
Some studies suggest an alternative mechanism for formaldehyde
altering δ13C values, where compounds leach out of the tissue upon
formaldehyde fixation.26,35 If compounds enriched in 13C (e.g.,
proteins compared with lipids) preferentially leach out of the tissue,
we may observe a relative increase in 12C and decrease in δ13C
values with formaldehyde preservation.24
The formaldehyde‐ethanol treatment significantly altered the
δ13C values of both T. albacares and D. gigas. The magnitude of
change was similar in both species (<1‰), but the direction of
change differed, which may suggest that the δ13C value of the
formaldehyde was between those of the D. gigas and T. albacares
tissues. We hypothesized that carbon was added from the
formaldehyde to the tissue during the fixation process. However, if
carbon was added to the tissues, we would expect an increase in %C
and C/N ratios in the preserved tissues, which we largely did not
find. Although formaldehyde can add carbon to samples, ethanol
solubilizes lipids. Therefore, it is possible that long‐term storage in
ethanol masked an increase in C/N ratios by the removal of carbon.
The mechanistic explanations are difficult to disentangle when
tissues are preserved in multiple chemical preservatives that alter
tissues in different ways. In future studies, one way to address this
question is to examine whether lipids are added to the ethanol in
which the samples were preserved.
To test the independent effects of formaldehyde and ethanol on
tuna and squid muscle tissue, we separately preserved tissues
in formalin and ethanol for one month. For tissues preserved in
formaldehyde only, we found a decrease in δ13C values and an
increase in %C and C/N ratios for both T. albacares and D. gigas,
which provides evidence that formaldehyde fixation adds 12C‐
enriched carbon to the tissues. Since a different bottle of
formaldehyde was used for this second experiment, we surmise that
the tuna and squid tissues had δ13C values greater than that of the
formaldehyde used and therefore we saw consistent trends between
species.
In the long‐term zooplankton experiment, the δ13C values of
copepods also decreased with formaldehyde preservation, but the
difference between frozen and chemically preserved samples was
greater for C. pacificus than for E. californicus, which is consistent
with a previous study.18 The differences in the magnitude of change
between C. pacificus and E. californicus can probably be explained by
isotope mass balance, where the δ13C values of preserved tissues
converge on the δ13C value of the formaldehyde used. These results
generally agree with those from the tuna and squid experiment and
HETHERINGTON ET AL. 943
also bolster results from previous studies that reported a decrease in
δ13C values with formaldehyde preservation.20,22,24 Specifically, one
study reported a decrease of ~1‰ in the δ13C values of
formaldehyde‐preserved copepods.24
If differences in δ13C were attributed to proteins leaching out of
the tissue from the formalin, we would expect that %N would
decrease if proteins were removed from tissues, which we did not
find. The most probable explanation is that formalin added carbon to
our samples, which resulted in the alteration of δ13C values.
However, we only found significant increases in %C for some of our
samples, although there may have been small changes in %C that
were below our detection limit. The mechanistic driver of the
observed changes in δ13C values is therefore somewhat unclear.
Generally, the magnitude of the change in δ13C values that we
observed from preserved tissues was slightly lower than the changes
observed in the δ15N values; however, small changes in δ13C values
are more likely to affect the interpretation of δ13C values, as shifts
of ~1‰ can represent differences in carbon sources that the
consumer is relying on. Therefore, our results are in general
agreement with previous studies19,20,22 that report variable but
significant changes in δ13C values with chemical preservation.
4.3 | Amino acid δ15N values
The isotopic compositions of C and N are largely controlled by the
ratios of nucleic acids:proteins:carbohydrates:lipids in the tissues.25 In
our samples, particularly for muscle tissue that is protein‐rich with
relatively high N concentrations (15–20%), we expected that the bulk
δ15N values would be largely reflective of the amino acid δ15N values
because amino acids are a substantial contributor to the total N pool.
The paired amino acid δ15N values illustrate that 1–1.5‰ increase in
bulk preservation studies may be explained by small changes (<1‰)
in amino acid isotope ratios. Overall, our study illustrates that
patterns in bulk isotope ratios largely mirror those of amino acid values.
The δ15N values of most amino acids were minimally altered by
chemical preservation, both in the formaldehyde‐ethanol preserved
tuna and squid samples and in copepod samples preserved in
formaldehyde. These results are promising for future CSIA‐AA
studies and provide further evidence that formaldehyde preservation
does not generally affect the δ15N values of amino acids. These
results agree with the few studies17,18 that have evaluated the
effects of formaldehyde on δ15N values, which reported no
difference between frozen and chemically preserved samples.
However, we found a surprising trend in the δ15N values of valine,
which were up to 6.0‰ higher in formaldehyde‐preserved samples for
T. albacares, but for D. gigas there was only a 1–2‰ difference
between preserved and frozen samples (Table 2; Figure S2,
supporting information). In addition, the δ15N values of
phenylalanine from preserved samples ranged from 0.5 to 4.5‰
different from those of frozen samples (see Table 2; Figure S2,
supporting information). These differences were larger than the
0.5–1.0‰ differences that we generally found for most other amino
acid δ15N values. The results for phenylalanine are especially
relevant, as it is frequently used as the canonical source amino acid
to estimate the trophic positions of species and to evaluate changes
in baseline δ15N values. Thus, understanding how and the degree to
which δ15N values of phenylalanine are altered by chemical
preservation is pertinent to many CSIA‐AA studies.
There is no mechanism by which 15N‐enriched phenylalanine
could be added to the sample from formaldehyde. A potential
explanation for how chemical preservation could alter the δ15N
values of phenylalanine is through the breaking of C–N bonds.
During this process, phenylalanine would be lost from the analytical
pool, and thus we would expect a decrease in the peak area of
phenylalanine and an enrichment of 15N in the preserved samples.
To evaluate this possibility, we calculated the ratios of peak areas of
phenylalanine to other amino acids that were minimally altered by
preservation (e.g., glutamic acid and proline). These ratios were
relatively constant, which implies there was no preferential loss of
phenylalanine in the formaldehyde‐preserved samples and this is not
a likely explanation for the difference in δ15N values between
chemically preserved and frozen tissues.
The discrepancy in the δ15N values of phenylalanine between
frozen and chemically preserved samples may reflect our inability to
chromatographically separate phenylalanine from other amino acids
and N‐containing compounds in order to measure δ15N values,
rather than phenylalanine being altered by chemical preservation.
Measurement of amino acid δ15N values using GC/IRMS techniques
requires baseline chromatographic separation of peaks of different
compounds.36,37 This is essential, as the peak areas of masses 28
and 29 are used to calculate ion‐current ratios, which are then
compared with those of reference materials of known isotopic
composition to calculate the 15N/14N ratio of individual
compounds.36,37 Thus, to determine isotope ratios it is imperative to
separate and accurately measure the entire peak without
interference from fully co‐eluting or partially co‐eluting compounds.
In many of our samples, there were unknown N‐containing
compounds (e.g., natural polyamines) that appeared on the mass 28
and 29 chromatograms near phenylalanine and valine in the frozen
samples, and these peaks limited our ability to accurately quantify
the δ15N values of these compounds. Interestingly, the unknown
N‐containing peaks, which eluted between glutamic acid and
phenylalanine and that co‐eluted with the tail of the valine peak
using our derivatization method and chromatographic column, were
significantly more abundant relative to phenylalanine and valine in
the frozen sample and were lowest in the tissue that had been
preserved in ethanol for 2 years. There was, however, no evidence in
either the mass 28 or the mass 29 trace or in the 29/28 mass trace
of the N‐containing compound that co‐eluted with valine in the
chemically preserved samples. Therefore, it is possible that the 95%
ethanol solution solubilized the interfering compounds and improved
our ability to achieve baseline chromatographic separation of
phenylalanine and valine for nitrogen isotope analysis. Unfortunately,
the identification of the small interfering compounds was beyond
the scope of this work.
944 HETHERINGTON ET AL.
The performance of compound‐specific isotope analyses using
GC/IRMS is commonly limited by chromatographic resolution of
individual compounds.16,36,38 Our results underscore the importance
of the preparative chromatographic steps necessary to isolate a
pure amino acid fraction from hydrolyzed tissues (e.g., see
recommendations by Ohkouchi et al16). Although we included a
solvent extraction of our hydrolysate, these results suggest that we
might have further purified our tissue samples or the amino acid
fraction by extraction using 95% ethanol. We hypothesize that
changes in the δ15N values of phenylalanine and valine can be
attributed to chromatographic isolation and our ability to measure the
δ15N values rather than formaldehyde alteration of the δ15N values
of these amino acids. We recognize that amino acids other than
phenylalanine and valine are not immune to co‐elution in samples. It
has been recognized that examination of the mass ratio trace can
reveal even minor co‐eluting peaks (e.g., see Figure 4 in Hayes et al36)
and we strongly recommend careful review of all chromatograms.
Future studies might focus on testing GC columns with different
stationary phases, which could result in greater chromatographic
separation of the interfering peaks and phenylalanine, or employ
alternative or multiple derivatization techniques in samples where
co‐elution with amino acids occurs (see Ohkouchi et al16).
5 | CONCLUSIONS
The results from the bulk portion of our study largely bolster previous
work. Since the δ13C values were altered in inconsistent ways, using
δ13C values from preserved tissues should be avoided unless there is
a mechanistic understanding of how the preservative specifically
alters the tissue of interest. Future studies evaluating the
preservation effects on amino acid δ13C values would be useful to
determine if and how these values are altered with preservation.
Formaldehyde and ethanol can produce small changes in the δ15N
values of tissues.26,29,35 However, formaldehyde by itself or in
combination with 95% ethanol may promote leaching or
solubilization of compounds in tissues and thus alter δ15N
values.26,35 These findings generally concur with the literature,
where changes in δ15N values associated with formaldehyde or
ethanol preservation are less than the 2 to 5‰ variation used to
detect trophic level differences in food web studies.
This study provides both promise and reason for caution for
future studies that aim to use CSIA‐AA on frozen and chemically
preserved specimens. Most measurements of amino acid δ15N values
from preserved tissues were within the typical 1‰ error associated
with CSIA‐AA. These small differences are consistent with the
results from the bulk component of the study, where the δ15N
values were minimally altered by preservation. However, future
studies that illuminate the differences that we found in some valine
and phenylalanine δ15N values would be useful.
We hypothesize that the differences that we found are reflective
of analytical uncertainty associated with co‐eluting compounds rather
than preservation altering δ15N values, but future studies testing this
hypothesis would helpful for the best use of stable isotope data in
ecological studies. Our results suggest that formaldehyde‐ethanol
preservation followed by rinsing of frozen (and perhaps fresh) tissues
with deionized water prior to hydrolysis might remove some of the
unknown N‐compounds that interfered with our ability to measure
the δ15N values of phenylalanine and valine.
ACKNOWLEDGEMENTS
The authors would like to thank Dr Robert J. Olson and Leanne Duffy
at the Inter‐American Tropical Tuna Commission for assistance with
acquiring Thunnus albacares and Dosidicus gigas samples for this
study and setting up the initial experiments. They would also like to
thank Linsey Sala at Scripps Institution of Oceanography for
assistance with proper identification of Calanus pacificus and
Eucalanus californicus. Lastly, they would like to thank Natalie
Wallsgrove and the University of Hawaii's Stable Isotope
Biogeochemistry Laboratories with assistance with AA‐CSIA. This
research was partially funded by the Frontiers of Innovation
Scholarship Program through the University of California San Diego,
and was supported by the National Science Foundation,
OCE1041329 to Brian N. Popp and Jeffrey C. Drazen. This is School
of Ocean Science and Technology contribution number 10670.
ORCID
Elizabeth D. Hetherington https://orcid.org/0000-0001-7114-398X
Brian N. Popp https://orcid.org/0000-0001-7021-5478
REFERENCES
1. DeNiro MJ, Epstein S. Influence of diet on the distribution of nitrogen
isotopes in animals. Geochim Cosmochim Acta. 1981;45(3):341‐351.
2. Hansson S, Hobbie JE, Elmgren R, Larsson U, Fry B, Johansson S. The
stable nitrogen isotope ratio as a marker of food‐web interactions
and fish migration. Ecology. 1997;78(7):2249‐2257.
3. Hobson KA. Tracing origins and migration of wildlife using stable
isotopes: A review. Oecologia. 1999;120(3):314‐326.
4. Olson RJ, Popp BN, Graham BS, et al. Food‐web inferences of stable
isotope spatial patterns in copepods and yellowfin tuna in the pelagic
eastern Pacific Ocean. Prog Oceanogr. 2010;86(1):124‐138.
5. Seminoff JA, Benson SR, Arthur KE, et al. Stable isotope tracking of
endangered sea turtles: Validation with satellite telemetry and δ15Nanalysis of amino acids. PLoS ONE. 2012;7(5):e37403.
6. Tomaszewicz T, Calandra N, Seminoff JA, Peckham SH, Avens L, Kurle
CM. Intrapopulation variability in the timing of ontogenetic habitat
shifts in sea turtles revealed using δ15N values from bone growth
rings. J Anim Ecol. 2017;86(3):694‐704.
7. Vander Zanden HB, Tucker AD, Hart KM, et al. Determining origin in a
migratory marine vertebrate: A novel method to integrate stable
isotopes and satellite tracking. Ecol Appl. 2015;25(2):320‐335.
8. Huang BQ, Yeung EC. Chemical and physical fixation of cells and
tissues: An overview. In: Yeung ECT, Stasolla C, Sumner MJ, Huang
BQ, eds. Plant Microtechniques and Protocols. Cham: Springer
International Publishing; 2015:23‐43.
9. Srinivasan M, Sedmak D, Jewell S. Effect of fixatives and tissue
processing on the content and integrity of nucleic acids. Am J Pathol.
2002;161(6):1961‐1971.
HETHERINGTON ET AL. 945
10. Popp BN, Graham BS, Olson RJ, et al. Insight into the trophic ecology
of yellowfin tuna, Thunnus albacares, from compound‐specific nitrogen
isotope analysis of proteinaceous amino acids. Terr Ecol.
2007;1:173‐190.
11. Chikaraishi Y, Ogawa NO, KashiyamaY, et al. Determination of aquatic
food‐web structure based on compound‐specific nitrogen isotopic
composition of amino acids. Limnol Oceanogr Methods.
2009;7(11):740‐750.
12. Fuller BT, Petzke JK. The dietary protein paradox and threonine 15N‐depletion: Pyridoxal‐5′‐phosphate enzyme activity as a mechanism
for the δ15N trophic level effect. Rapid Commun Mass Spectrom.
2017;31(8):705‐718.
13. O'Connell TC. ‘Trophic’ and ‘source’ amino acids in trophic estimation:
A likely metabolic explanation. Oecologia. 2017;184(2):317‐326.
14. Décima M, Landry MR, Popp BN. Environmental perturbation effects
on baseline δ15N values and zooplankton trophic flexibility in the
southern California current ecosystem. Limnol Oceanogr.
2013;58(2):624‐634.
15. Sherwood OA, Lehmann MF, Schubert CJ, Scott DB, McCarthy MD.
Nutrient regime shift in the western North Atlantic indicated by
compound‐specific δ15N of deep‐sea gorgonian corals. Proc Natl Acad
Sci. 2011;108(3):1011‐1015.
16. Ohkouchi N, Chikaraishi Y, Close HG, et al. Advances in the application
of amino acid nitrogen isotopic analysis in ecological and
biogeochemical studies. Org Geochem. 2017;113:150‐174.
17. Hannides CCS, Popp BN, Landry MR, Graham BS. Quantification of
zooplankton trophic position in the North Pacific subtropical gyre
using stable nitrogen isotopes. Limnol Oceanogr. 2009;54(1):50‐61.
18. Ogawa NO, Chikaraishi Y, Ohkouchi N. Trophic position estimates of
formalin‐fixed samples with nitrogen isotopic compositions of amino
acids: An application to gobiid fish (Isaza) in Lake Biwa, Japan. Ecol
Res. 2013;28(5):697‐702.
19. Ruiz‐Cooley RI, Garcia KY, Hetherington ED. Effects of lipid removal
and preservatives on carbon and nitrogen stable isotope ratios of
squid tissues: Implications for ecological studies. J Exp Mar Biol Ecol.
2011;407(1):101‐107.
20. Barrow LM, Bjorndal KA, Reich KJ. Effects of preservation method on
stable carbon and nitrogen isotope values. Physiol Biochem Zool.
2008;81(5):688‐693.
21. Sweeting CJ, Polunin NV, Jennings S. Tissue and fixative dependent
shifts of δ13C and δ15N in preserved ecological material. Rapid
Commun Mass Spectrom. 2004;18(21):2587‐2592.
22. Sarakinos HC, Johnson ML, Zanden MJV. A synthesis of tissue‐preservation effects on carbon and nitrogen stable isotope
signatures. Can J Zool. 2002;80(2):381‐387.
23. Kiernan J. Formaldehyde, formalin, paraformaldehyde and
glutaraldehyde: What they are and what they do. Microscopy Today.
2000;8(1):8‐12.
24. Bicknell AW, Campbell M, Knight ME, Bilton DT, Newton J, Votier SC.
Effects of formalin preservation on stable carbon and nitrogen isotope
signatures in Calanoid copepods: Implications for the use of
continuous plankton recorder survey samples in stable isotope
analyses. Rapid Commun Mass Spectrom. 2011;25(13):1794‐1800.
25. Hayes JM. Fractionation of the isotopes of carbon and hydrogen in
biosynthetic processes. Reviews in Mineralogy Stable Isotopic
Geochemistry 2001. https://www.whoi.edu/fileserver.do?id=
73288&pt=2&p=74886
26. Bosley KL, Wainright SC. Effects of preservatives and acidification on
the stable isotope ratios (15N:14N, 13C:12C) of two species of marine
animals. Can J Fish Aquat Sci. 1999;56(11):2181‐2185.
27. McConnaughey T, McRoy CP. Food‐web structure and the
fractionation of carbon isotopes in the Bering Sea. Mar Biol.
1979;53(3):257‐262.
28. Arrington DA, Winemiller KO. Preservation effects on stable isotope
analysis of fish muscle. Trans Am Fish Soc. 2002;131(2):337‐342.
29. Kaehler S, Pakhomov EA. Effects of storage and preservation on the
δ13C and δ15N signatures of selected marine organisms. Mar Ecol
Prog Ser. 2001;219:299‐304.
30. Rau GH, Ohman MD, Pierrot‐Bults A. Linking nitrogen dynamics to
climate variability off Central California: A 51 year record based on15N/14N in CalCOFI zooplankton. Deep‐Sea Res II Top Stud Oceanogr.
2003;50(14–16):2431‐2447.
31. Ohman MD, Smith P. A comparison of zooplankton sampling methods
in the CalCOFI time series. CalCOFI Rep. 1995;36:153‐158.
32. Hannides CCS, Popp BN, Choy CA, Drazen JC. Midwater zooplankton
and suspended particle dynamics in the North Pacific subtropical gyre:
A stable isotope perspective. Limnol Oceanogr. 2013;58(6):1931‐1946.
33. Germain LR, Koch PL, Garvey J, McCarthy MD. Nitrogen isotope
fractionation in amino acids from harbor seals: Implications for
compound‐specific trophic position calculations. Mar Ecol Prog Ser.
2013;482:265‐277.
34. Team RC. R: A language and environment for statistical computing. R
Foundation for Statistical Computing, Vienna, Austria. https://www.r‐project.org/. 2016.
35. Hobson KA, Gloutney ML, Gibbs HL. Preservation of blood and tissue
samples for stable‐carbon and stable‐nitrogen isotope analysis. Can J
Zool. 1997;75(10):1720‐1723.
36. Hayes JM, Freeman KH, Popp BN, Hoham CH. Compound‐specificisotopic analyses: A novel tool for reconstruction of ancient
biogeochemical processes. Org Geochem. 1990;16(4–6):1115‐1128.
37. Sessions AL. Isotope‐ratio detection for gas chromatography. J Sep Sci.
2006;29(12):1946‐1961.
38. Kenig F, Popp BN, Summons RE. Preparative HPLC with ultrastable‐Yzeolite for compound‐specific carbon isotopic analyses. Org Geochem.
2000;31(11):1087‐1094.
SUPPORTING INFORMATION
Additional supporting information may be found online in the
Supporting Information section at the end of the article.
How to cite this article: Hetherington ED, Kurle CM, Ohman
MD, Popp BN. Effects of chemical preservation on bulk and
amino acid isotope ratios of zooplankton, fish, and squid
tissues. Rapid Commun Mass Spectrom. 2019;33:935‐945.
https://doi.org/10.1002/rcm.8408