Effects of cellular phone use on ear canal temperature measured by NTC thermistors
11
Effects of cellular phone use on ear canal temperature measured by NTC thermistors Kari Tahvanainen 1,2 , Juanita Nin ˜o 1,3 , Pirjo Halonen 4 , Tom Kuusela 5 , Tommi Alanko 1 , Tomi Laitinen 3 , Esko La ¨nsimies 3 , Maila Hietanen 1 and Harri Lindholm 2 1 New Technologies and Risks and 2 Physical Work Capacity, Finnish Institute of Occupational Health, Helsinki, 3 Department of Clinical Physiology, Kuopio University Hospital, Kuopio, 4 Computing Center, Kuopio University, Kuopio, and 5 Department of Physics, Turku University, Turku, Finland Correspondence Kari Tahvanainen, New Technologies and Risks, Finnish Institute of Occupational Health, Topeliuksenkatu 41 a A, FIN-00250 Helsinki, Finland E-mail: kari.tahvanainen@TTL.fi Accepted for publication Received 20 September 2006; accepted 18 January 2007 Key words ear canal; GSM; human; radiofrequency; temperature Summary The earlier studies using phantom models and human subjects concerning warming effects during cellular phone use have been controversial, partly because radiofrequency (RF) exposures have been variable. In this randomized, double- blind, placebo-controlled crossover trial, 30 healthy subjects were submitted to 900 MHz (2W) and 1800 MHz (1W) cellular phone RF exposure, and to sham exposure in separate study sessions. Temperature signals were recorded continuously in both ear canals before, during and after the 35-min RF exposure and the 35-min sham exposure sessions. Temperature was measured by using small-sized NTC thermistors placed in the ear canals through disposable ear plugs. The mean temperature changes were determined during a set cardiovascular autonomic function studies: during a 5-min controlled breathing test, during a 5-min spontaneous breathing test, during 7-min head-up tilting, 1-min before, during and after two consecutive Valsalva manoeuvres and during a deep breathing test. Temperatures in the exposed ear were significantly higher during RF exposures compared with sham exposure in both 900 and 1800 MHz studies with maximum differences of 1 2 ± 0 5°C (900 MHz exposure) and 1 3 ± 0 7°C (1800 MHz exposure). Temperatures in the RF-exposed ear were also significantly higher during the postexposure period compared with post-sham exposure period with maximum differences of 0 6 ± 0 3°C for 900 MHz and 0 5 ± 0 5°C for 1800 MHz. The results of this study suggest that RF exposure to a cellular phone, either using 900 or 1800 MHz with their maximal allowed antenna powers, increases the temperature in the ear canal. The reason for the ear canal temperature rising is a consequence of mobile phone battery warming during maximal antenna power use. The earlier published articles do not indicate that temperature rising in the ear canal has any significant contribution from the RF fields emitted from mobile phones. Introduction Mobile personal phones are now a mass market product. The billionth GSM user was connected in the first quarter of 2004 and the second billionth connection on the GSM family was made in June 2006. Widespread use of cellular (mobile) phones has raised public and scientific concern about their possible adverse effects on health. The research interest has been focused mainly on brain activity, on subjective symptoms perceived by some users and on the development of malignant tumours (Mann & Ro ¨schke, 1996; Borbely et al., 1999; Preece et al., 1999; Hietanen et al., 2000; Koivisto et al., 2000; Krause et al., 2000; Muscat et al., 2000; Inskip et al., 2001; Johansen et al., 2001; Sandstro ¨m et al., 2001; Auvinen et al., 2002; Hietanen et al., 2002). Despite of research efforts, the clinical and epidemio- logical findings are discrepant and do not provide a clear pattern of adverse health effects related to RF exposure emitted by the cellular phones (Krewski et al., 2001). The major barriers in interpreting the studies are the relatively short time of the cellular phones on the markets making impossible to infer epidemio- logical cause-effect relationships, the difficulties in measuring the changes in the human body and its biosignals, and the difficulties to carry out studies on humans under controlled laboratory conditions. Overcoming those difficulties, some theories have been drawn in the scenario of possible deleterious effects on human health involving thermal, athermal and non- Clin Physiol Funct Imaging (2007) 27, pp162–172 doi: 10.1111/j.1475-097X.2007.00730.x Ó 2007 The Authors Journal compilation Ó 2007 Blackwell Publishing Ltd • Clinical Physiology and Functional Imaging 27, 3, 162–172 162
-
Upload
independent -
Category
Documents
-
view
2 -
download
0
Transcript of Effects of cellular phone use on ear canal temperature measured by NTC thermistors

Effects of cellular phone use on ear canal temperaturemeasured by NTC thermistorsKari Tahvanainen1,2, Juanita Nino1,3, Pirjo Halonen4, Tom Kuusela5, Tommi Alanko1, Tomi Laitinen3,Esko Lansimies3, Maila Hietanen1 and Harri Lindholm2
1New Technologies and Risks and 2Physical Work Capacity, Finnish Institute of Occupational Health, Helsinki, 3Department of Clinical Physiology, Kuopio University
Hospital, Kuopio, 4Computing Center, Kuopio University, Kuopio, and 5Department of Physics, Turku University, Turku, Finland
CorrespondenceKari Tahvanainen, New Technologies and Risks,
Finnish Institute of Occupational Health,
Topeliuksenkatu 41 a A, FIN-00250 Helsinki,
Finland
E-mail: [email protected]
Accepted for publicationReceived 20 September 2006;
accepted 18 January 2007
Key wordsear canal; GSM; human; radiofrequency; temperature
Summary
The earlier studies using phantom models and human subjects concerning warmingeffects during cellular phone use have been controversial, partly becauseradiofrequency (RF) exposures have been variable. In this randomized, double-blind, placebo-controlled crossover trial, 30 healthy subjects were submitted to900 MHz (2W) and 1800 MHz (1W) cellular phone RF exposure, and to shamexposure in separate study sessions. Temperature signals were recorded continuouslyin both ear canals before, during and after the 35-min RF exposure and the 35-minsham exposure sessions. Temperature was measured by using small-sized NTCthermistors placed in the ear canals through disposable ear plugs. The meantemperature changes were determined during a set cardiovascular autonomicfunction studies: during a 5-min controlled breathing test, during a 5-minspontaneous breathing test, during 7-min head-up tilting, 1-min before, during andafter two consecutive Valsalva manoeuvres and during a deep breathing test.Temperatures in the exposed ear were significantly higher during RF exposurescompared with sham exposure in both 900 and 1800 MHz studies with maximumdifferences of 1Æ2 ± 0Æ5�C (900 MHz exposure) and 1Æ3 ± 0Æ7�C (1800 MHzexposure). Temperatures in the RF-exposed ear were also significantly higher duringthe postexposure period compared with post-sham exposure period with maximumdifferences of 0Æ6 ± 0Æ3�C for 900 MHz and 0Æ5 ± 0Æ5�C for 1800 MHz. The resultsof this study suggest that RF exposure to a cellular phone, either using 900 or1800 MHz with their maximal allowed antenna powers, increases the temperaturein the ear canal. The reason for the ear canal temperature rising is a consequence ofmobile phone battery warming during maximal antenna power use. The earlierpublished articles do not indicate that temperature rising in the ear canal has anysignificant contribution from the RF fields emitted from mobile phones.
Introduction
Mobile personal phones are now a mass market product. The
billionth GSM user was connected in the first quarter of 2004
and the second billionth connection on the GSM family was
made in June 2006. Widespread use of cellular (mobile) phones
has raised public and scientific concern about their possible
adverse effects on health. The research interest has been focused
mainly on brain activity, on subjective symptoms perceived by
some users and on the development of malignant tumours
(Mann & Roschke, 1996; Borbely et al., 1999; Preece et al., 1999;
Hietanen et al., 2000; Koivisto et al., 2000; Krause et al., 2000;
Muscat et al., 2000; Inskip et al., 2001; Johansen et al., 2001;
Sandstrom et al., 2001; Auvinen et al., 2002; Hietanen et al.,
2002). Despite of research efforts, the clinical and epidemio-
logical findings are discrepant and do not provide a clear pattern
of adverse health effects related to RF exposure emitted by the
cellular phones (Krewski et al., 2001). The major barriers in
interpreting the studies are the relatively short time of the cellular
phones on the markets making impossible to infer epidemio-
logical cause-effect relationships, the difficulties in measuring
the changes in the human body and its biosignals, and the
difficulties to carry out studies on humans under controlled
laboratory conditions. Overcoming those difficulties, some
theories have been drawn in the scenario of possible deleterious
effects on human health involving thermal, athermal and non-
Clin Physiol Funct Imaging (2007) 27, pp162–172 doi: 10.1111/j.1475-097X.2007.00730.x
� 2007 The AuthorsJournal compilation � 2007 Blackwell Publishing Ltd • Clinical Physiology and Functional Imaging 27, 3, 162–172162

thermal biological effects produced during the use of cellular
phones (Krewski et al., 2001).
While some studies have reported biological effects in the
absence of heat, warming of tissues is the major effect of
exposure to RF fields. Some studies have been carried out to
evaluate temperature changes during mobile phone use (An-
derson & Joyner, 1995; Van Leeuwen et al., 1999; Wainwright,
2000; Paredi et al., 2001). In the experimental study by Van
Leeuwen et al. the authors found a maximum rise in brain
temperature of 0Æ11�C when a head phantom was exposed to
915 MHz with 0Æ25 W. Anderson et al. found an increase of
0Æ034�C in a head phantom during analog mobile phone RF
exposure. In a recently published study by Paredi et al. the
authors found an increase of 2Æ3�C in the skin temperature of
the nostril and occipital area after 6 min of 900 MHz exposure.
Knowing that rises in temperature above 1�C might lead to
behavioural or stress effects, it is important to try to establish to
what extent the use of cellular phones increase the temperature
in the locally exposed head area. At this moment there are no
published studies on human exposure to cellular phones and
simultaneous measurements of temperature changes in the ear
canal. The theoretical calculations by Bernardi et al. (2001) and
Gandhi et al. (2001) have indicated that the temperature
increases on skin from RF fields emitted by mobile phones are
negligible (a few tenths of a degree Celsius). Those observations
have been argued in a recent study by Straume et al. (2005),
where temperature rises up to 5Æ0�C were measured using
infrared camera measurements. The observations in Straume
et al. (900 MHz mobile with the exposure of 0Æ21 W maximum
output power for 30 min) indicate that the reason for cheek and
ear warming is from the mobile phone battery. When currents
are drawn from the mobile phone battery, some electrical
energy is dissipated in the electronics of the mobile phone. This
elevates the temperature of mobile phone and subsequently also
raises the skin and head tissue temperature, when the mobile
phone is in contact with skin surface.
The objective of this study was to measure temperature
changes in the ear canal before, during and after a 35-min RF
exposure emitted by cellular phone at frequencies of 900 and
1800 MHz with peak powers of 2 and 1 W and average powers
of 0Æ25 and 0Æ125 W respectively. Evaluation of ear canal
temperature was chosen due to proximity of the ear canal to the
brain tissues, and because small-sized NTC thermistor wires can
be easily applied to ear canal through disposable ear plugs in
clinical settings. Monitoring of ear canal temperature was made
in our study parallel to several other signal measurements
involved to the cardiopulmonary system during cellular phone
RF exposure (Tahvanainen et al., 2004).
Materials and methods
Subjects
Thirty-four healthy volunteers, 16 females and 18 males with an
average age of 38Æ8 ± 10Æ3 years (SD) were enrolled in the
study, where the objectives were to evaluate human cardiovas-
cular responses and ear canal temperature changes during
mobile phone use. Written informed consent was obtained from
all subjects. The experimental design of the study was approved
by the ethics committee of the Kuopio University Hospital and
by the ethics committee of the Finnish Institute of Occupational
Health. The clinical experiments were carried out in a quiet
laboratory with a well-regulated temperature (21–23�C) and
relative humidity (35–45%) at the Department of Clinical
Physiology, Kuopio University Hospital. The studies were
always started between 1 PM and 3 PM to control circadian
effects.
Study design
The subjects in this randomized, double-blinded and placebo-
controlled crossover study were exposed during two different
days, 1 week apart, to 900 and 1800 MHz cellular phones. The
total duration of each study (900 MHz with the antenna power
of 2 W and 1800 MHz with the antenna power of 1 W) was
2 h including one 35-min RF exposure and one 35-min sham
exposure.
Double randomization, one to predefine the order of the RF
exposures (900 MHz followed by 1800 MHz, or 1800 MHz
followed by 900 MHz) and one to define the order of the
interventions (sham exposure followed by RF exposure, or RF
exposure followed by sham exposure) was used. A random digit
table was used to generate the random lists (Altman, 1999).
Study protocol
The detailed study protocol has been described in our earlier
report (Tahvanainen et al., 2004), where blood pressure and
heart rate responses to mobile phone RF exposure was
evaluated. Simultaneous recordings of temperature from the
left and right ear canals, electrocardiogram (ECG), non-
invasively measured arterial blood pressure signal from the
finger (finger cuff method) and intermittently from the arm,
pneumotachometrically measured respiration signal and relative
RF signal intensity produced by cellular phone was conducted.
The multi-signal recording was made during physiological
challenges, when a set of different autonomic function tests
were conducted during and after a 35-min 900 and 1800 MHz
RF exposure and sham exposure session. After the RF exposure
was switched ON or sham exposure session was started, a 6-min
controlled breathing test (CBT) and a 6-min spontaneous
breathing test (SBT) were performed in supine position. Next, a
7-min head-up tilt table test (HUT) in 70� head-up position was
followed by two consecutive Valsalva manoeuvres (VM), where
the subject performed forced expirations against a close glottis
with a strain of 40 mmHg for 15 s in supine position during the
exposure period. After the 35-min RF or sham exposure period,
a 6-min CBT, a 6-min SBT and a deep breathing test (DBT),
were conducted in supine position. Each test was separated by a
2-min resting period.
Cellular telephones and ear canal temperature, K. Tahvanainen et al.
� 2007 The AuthorsJournal compilation � 2007 Blackwell Publishing Ltd • Clinical Physiology and Functional Imaging 27, 3, 162–172
163

A questionnaire on subjective feelings of the test subjects was
applied at the end of RF and sham exposure periods. The
questionnaire included three questions: (1) Could you distin-
guish, whether the cellular phone was ON or OFF during the
previous period?, (2) If ‘Yes’ to the previous question, which
one of the two phones was ON?, and (3) How did you feel
when the cellular phone was ON?
Exposure and data acquisition
Ear canal temperatures were measured using two identical high-
precision miniature NTC thermistors (BetaTHERM Corp.,
Shrewsbury, MA, USA). The diameter of the drop-shaped
thermistors was 2Æ4 mm, and the resistance at 25�C was
3000 ohms. Thermistors were introduced symmetrically 1Æ5–
2 cm deep to the ear canals through disposable, plasticized PVC
foam ear plugs (E-A-R Classic; Aearo Limited, Stockport, UK) in
an attempt to create a closed space inside the ear canal without
the influence of environmental temperature. The wires of the
thermistors were fixed to the skin of the face with micropore.
The very thin isolated but non-shielded thermistor wires (length
200 mm) were connected to a custom amplifier with analog
output (WinTemp; Absolute Aliens Oy, Turku, Finland)
(Fig. 1). The accuracy of the absolute temperature thus
measured is about 0Æ3�C and precision of the relative changes
is about 0Æ05�C in the temperature range of 25–40�C. Both ear
canal temperatures were measured simultaneously before,
during and after the RF exposure and sham exposure periods.
Because the 900 MHz RF field generated a small (0Æ1–0Æ2�C)
shift in temperature signal upwards due to direct RF field
interference on the thermistor wires when the phone was
switched ON, the mean temperature values during the 900 MHz
exposure were corrected by using a correction term as follows.
The mean values of the ear canal temperature from two 10 s
periods (just before and just after the phone was switched ON)
were calculated. The difference between both mean temperature
values from the 10 s periods, called as ‘correction term’, was
then subtracted from all the temperature results measured
during the 900 MHz exposure in the exposed ear canal.
A PC-controlled dual band mobile phone (Nokia 6150; Nokia
Corporation, Helsinki, Finland) was used for providing the RF
exposure with maximal antenna powers for the two operational
frequencies. Another physically identical but inactive phone
without battery was located on the opposite ear. A notebook
computer (HP OmniBook XE2; Hewlett-Packard, Inc., Taipei,
Taiwan) equipped with a mobile phone service software
package (WinTesla; Nokia Corporation, Helsinki, Finland) was
used to control the functions of the mobile phone providing RF
exposure. The active mobile phone was connected via serial port
to the notebook computer.
The mobile phones were located symmetrically on the ears by
using a plastic head helmet. The plastic helmet was positioned in
the head such that the active phone was leaning to the ear on the
dominant hand side of the head, and the inactive phone was
leaning to the ear on the non-dominant hand side of the head.
Two specially designed antennas were used to measure the
relative intensity of 900 and 1800 MHz fields. Each antenna was
connected to a microwave detector (Model 4503A-03; NARDA
Microwave-East, Hauppauge, NY, USA) and to an amplifier with
analogue output (WinRF; Absolute Aliens Oy) to obtain the RF
Figure 1 Set-up for head area instrumentation. Small-sized NTC thermistors were applied to ear canals through ear plugs (left figure), thermistorswires were fixed to skin and thermistors wires were connected to analog amplifiers. Instrumentation of head area (right figure) including thermistorsapplied to both ears canals and the thermistors amplifiers with analog outputs on the neck. Respiration was measured using heated Fleisch-typepneumotachometer connected to face mask.
Cellular telephones and ear canal temperature, K. Tahvanainen et al.
� 2007 The AuthorsJournal compilation � 2007 Blackwell Publishing Ltd • Clinical Physiology and Functional Imaging 27, 3, 162–172
164
field amplitude signal. The RF field-recording instrumentation
was firmly positioned in a holder attached to the tilt table. The
RF field-recording antenna was kept at a distance of 20 cm from
the active mobile phone during the study.
A notebook computer (HP 4150; Hewlett-Packard, Inc.,
Lyon, France) equipped with data acquisition and analysis
software for signal processing (WinCPRS; Absolute Aliens Oy)
was used to record the temperature signals, the relative RF field
intensity signal and the biosignals described above during the
clinical experiments.
SAR characteristics of the test phone
Specific absorption rate (SAR) measurements for the two
operational frequencies (900 and 1800 MHz) of the dual-band
cellular phone (Nokia 6150; Nokia Corporation), used for the
RF exposure, were conducted inside a head phantom. The
details of RF dosimetry measurements are described in detail in
our earlier communication (Tahvanainen et al., 2004). Liquid
with tissue equivalent dielectric properties was used in the head
phantom in an EMF-shielded laboratory during robotic RF field
measurements (DASYS3; Schmid & Partner Engineering AG,
Zurich, Switzerland). During the SAR measurements the same
dual-band mobile phone as used during the clinical studies was
programmed to operate when the battery was fully loaded with
identical settings. A calibrated RF field scanning probe, moving
in a robotic arm, recorded the spatial values of electric field
strength (E, in V m)1) within a 7 cm · 7 cm · 7 cm cubic
volume in the head phantom in the vicinity of mobile phone
carefully positioned just below the head phantom. The
measured maximal SAR values within the 7 cm · 7 cm · 7 cm
cubic volume of the dual-band phone were 1Æ58 W kg)1 at the
frequency of 900 MHz and 0Æ70 W kg)1 at 1800 MHz. The
corresponding penetration depths in the head phantom were
12Æ4 mm (900 MHz) and 11Æ4 mm (1800 MHz).
During the robotic SAR measurements in the head phantom,
the relative intensity of the RF field for the 900 and 1800 MHz
exposures were also monitored for 35 min using the same
geometry and with the same recording antennas and amplifier
and PC-based data acquisition software as during the clinical
Tests performed
1800
MH
z st
udy
34·0
34·5
35·0
35·5
36·0
36·5
37·0
37·5
38·0
During RF exposureAfter RF exposureDuring sham exposureAfter sham exposure
Exposed ear
900
MH
z st
udy
Tem
pera
ture
(°C
)T
empe
ratu
re (
°C)
34·0
34·5
35·0
35·5
36·0
36·5
37·0
37·5
38·0
CBT HUT V2SBT V1 V3
CBT DBT1 DBT3SBT DBT2
Non-exposed ear
34·0
34·5
35·0
35·5
36·0
36·5
37·0
37·5
38·0
CBT HUT V2SBT V1 V3
CBT DBT1 DBT3SBT DBT2
** **
** ** ** ** ** ** ** **
*
Tests performed
34·0
34·5
35·0
35·5
36·0
36·5
37·0
37·5
38·0
** ** ** **** ** ****
**
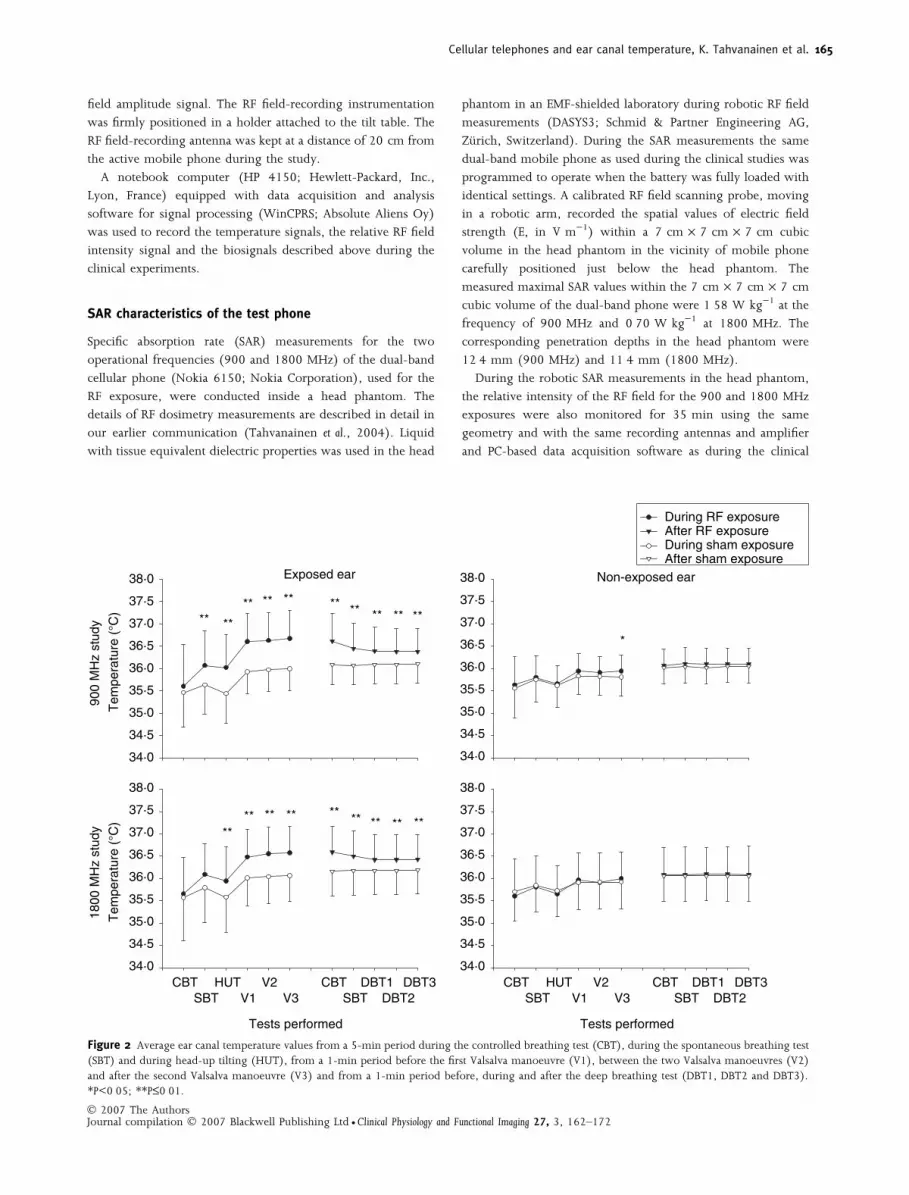
Figure 2 Average ear canal temperature values from a 5-min period during the controlled breathing test (CBT), during the spontaneous breathing test(SBT) and during head-up tilting (HUT), from a 1-min period before the first Valsalva manoeuvre (V1), between the two Valsalva manoeuvres (V2)and after the second Valsalva manoeuvre (V3) and from a 1-min period before, during and after the deep breathing test (DBT1, DBT2 and DBT3).*P<0Æ05; **P£0Æ01.
Cellular telephones and ear canal temperature, K. Tahvanainen et al.
� 2007 The AuthorsJournal compilation � 2007 Blackwell Publishing Ltd • Clinical Physiology and Functional Imaging 27, 3, 162–172
165

studies. The RF field intensity indicated excellent stability (±2%)
throughout the 35-min period for both 900 and 1800 MHz
frequencies.
Statistical analysis
For the statistical analysis, carry-over effect (P<0Æ1) and the
period effect (P<0Æ05) were checked by using repeated
measures analysis (general linear model). Carry-over effect
means that the physical effects of the first treatment are still
partly present when the subject enters the second treatment
period. Period effect means that there is a systematic difference
between the two periods of trial (Altman, 1999).
Student’s t-test for paired data was used in the comparisons
between both interventions (RF exposure versus sham exposure)
for temperature measures. Subgroup comparisons were carried
out by independent t-tests. Non-continuous variables were
analysed by using the McNemar test. Two-sided P-values were
considered statistically significant at P<0Æ05. All data in the figures
and tables are presented as mean values and standard deviations
(SD). SPSS software package was used for the statistical analyses
(SPSS for Windows, version 9.0; SPSS Inc., Chicago, IL, USA).
Results
Subjects
From the initial 34 subjects, 30 subjects (15 males, 15 females)
with an average age of 39Æ5 years (SD 10Æ3 and range 23–
55 years) and a mean body mass index (BMI) of
23Æ7 ± 2Æ1 kg m)2 were included into the statistical analyses.
The reasons for the three exclusions were shoulder pain (one
subject), hypertension (one subject), pain in the ear channel
(one subject). The fourth subject, an airplane pilot, was
excluded from ear canal temperature measurements because of
safety risks for his profession. Twenty-six (87%) right-handed
subjects received the RF exposure on the right side of the head
and four (13%) left-handed on the left side.
Exposed ear
There were statistically significant differences in the ear canal
temperatures between RF exposure and sham exposure, both for
900 and 1800 MHz phones. Accordingly, there were statistically
significant differences in the ear temperatures between post-
exposure and post-sham conditions both at 900 and 1800 MHz.
When subjects were exposed to 900 MHz, temperature was
significantly higher during SBT, HUT and VM compared with
sham exposure intervention (P<0Æ01) (Fig. 2 left upper panel,
Table 1). The mean differences between both interventions
were 0Æ5 ± 0Æ9�C during SBT, 0Æ6 ± 0Æ7�C during HUT and
0Æ7 ± 0Æ5�C, 0Æ7 ± 0Æ5�C and 0Æ7 ± 0Æ5�C during the three
analysis periods of VM (P<0Æ01). The mean differences between
post-RF exposure and post-sham exposure temperatures were
0Æ5 ± 0Æ5�C during CBT, 0Æ4 ± 0Æ5�C during SBT and 0Æ3 ±
0Æ4�C, 0Æ3 ± 0Æ4�C and 0Æ3 ± 0Æ4�C during the three analysis
periods of DBT (P<0Æ01) (Fig. 2 left upper panel, Table 1).
The same pattern in temperature dynamics was observed in
the 1800 MHz study. With RF exposure, temperature was
significantly higher during the HUT (mean difference of
0Æ4 ± 0Æ7�C) and during the three analysis periods of VM
(mean differences of 0Æ5 ± 0Æ4�C, 0Æ5 ± 0Æ4�C and
0Æ5 ± 0Æ4�C) compared with sham exposure (P<0Æ01) (Fig. 2
left lower panel, Table 2). The mean differences between post-
Table 1 Mean ± SD ear canal temperature values in the RF-exposed and non-exposed ear in the 900 MHz study. Temperatures were calculated from a5-min period during the controlled breathing test (CBT), during the spontaneous breathing test (SBT) and during head-up tilting (HUT), from a 1-minperiod before the first Valsalva manoeuvre (V1), between the two Valsalva manoeuvres (V2) and after the second Valsalva manoeuvre (V3) and from a1-min period before, during and after the deep breathing test (DBT1, DBT2 and DBT3).
Tests
performed
TemperatureRF-exposed ear
P
TemperatureNon-exposed ear
P
During RF
exposure (�C)
During sham
exposure (�C)
During RF
exposure (�C)
During sham
exposure (�C)
CBT 35Æ6 ± 0Æ9 35Æ5 ± 0Æ8 0Æ59 35Æ6 ± 0Æ6 35Æ6 ± 0Æ7 0Æ76SBT 36Æ1 ± 0Æ8 35Æ6 ± 0Æ7 0Æ01 35Æ8 ± 0Æ5 35Æ7 ± 0Æ5 0Æ68HUT 36Æ0 ± 0Æ7 35Æ4 ± 0Æ7 0Æ00 35Æ7 ± 0Æ4 35Æ6 ± 0Æ5 0Æ66V1 36Æ6 ± 0Æ6 35Æ9 ± 0Æ5 0Æ00 35Æ9 ± 0Æ4 35Æ8 ± 0Æ4 0Æ08V2 36Æ6 ± 0Æ6 35Æ9 ± 0Æ5 0Æ00 35Æ9 ± 0Æ4 35Æ8 ± 0Æ4 0Æ06V3 36Æ6 ± 0Æ6 35Æ9 ± 0Æ5 0Æ00 35Æ9 ± 0Æ4 35Æ8 ± 0Æ4 0Æ02
After RF exposure (�C) After sham exposure (�C) After RF exposure (�C) After sham exposure (�C)CBT 36Æ6 ± 0Æ6 36Æ1 ± 0Æ4 0Æ00 36Æ1 ± 0Æ4 36Æ0 ± 0Æ4 0Æ19SBT 36Æ4 ± 0Æ6 36Æ1 ± 0Æ4 0Æ00 36Æ1 ± 0Æ4 36Æ0 ± 0Æ4 0Æ10DBT1 36Æ4 ± 0Æ5 36Æ1 ± 0Æ4 0Æ00 36Æ1 ± 0Æ4 36Æ0 ± 0Æ4 0Æ19DBT2 36Æ4 ± 0Æ5 36Æ1 ± 0Æ4 0Æ00 36Æ1 ± 0Æ4 36Æ1 ± 0Æ4 0Æ34DBT3 36Æ4 ± 0Æ5 36Æ0 ± 0Æ4 0Æ00 36Æ1 ± 0Æ4 36Æ1 ± 0Æ4 0Æ33
Data were mean ± SD.
Cellular telephones and ear canal temperature, K. Tahvanainen et al.
� 2007 The AuthorsJournal compilation � 2007 Blackwell Publishing Ltd • Clinical Physiology and Functional Imaging 27, 3, 162–172
166

RF exposure and post-sham exposure temperatures were
0Æ4 ± 0Æ3�C during CBT, 0Æ3 ± 0Æ3�C during SBT and
0Æ2 ± 0Æ3�C, 0Æ2 ± 0Æ3�C and 0Æ2 ± 0Æ3�C during the three
analysis periods of DBT (P<0Æ01) (Fig. 2 left lower panel,
Table 2).
No carry-over effects were observed either during the
900 MHz study or during the 1800 MHz study. A period effect
was observed during the 900 MHz study as well as during the
1800 MHz study. Temperature of the ear canal increased at the
beginning of the study independent of the intervention (RF
exposure or sham exposure) (Figs 3 and 4, Tables 3 and 4).
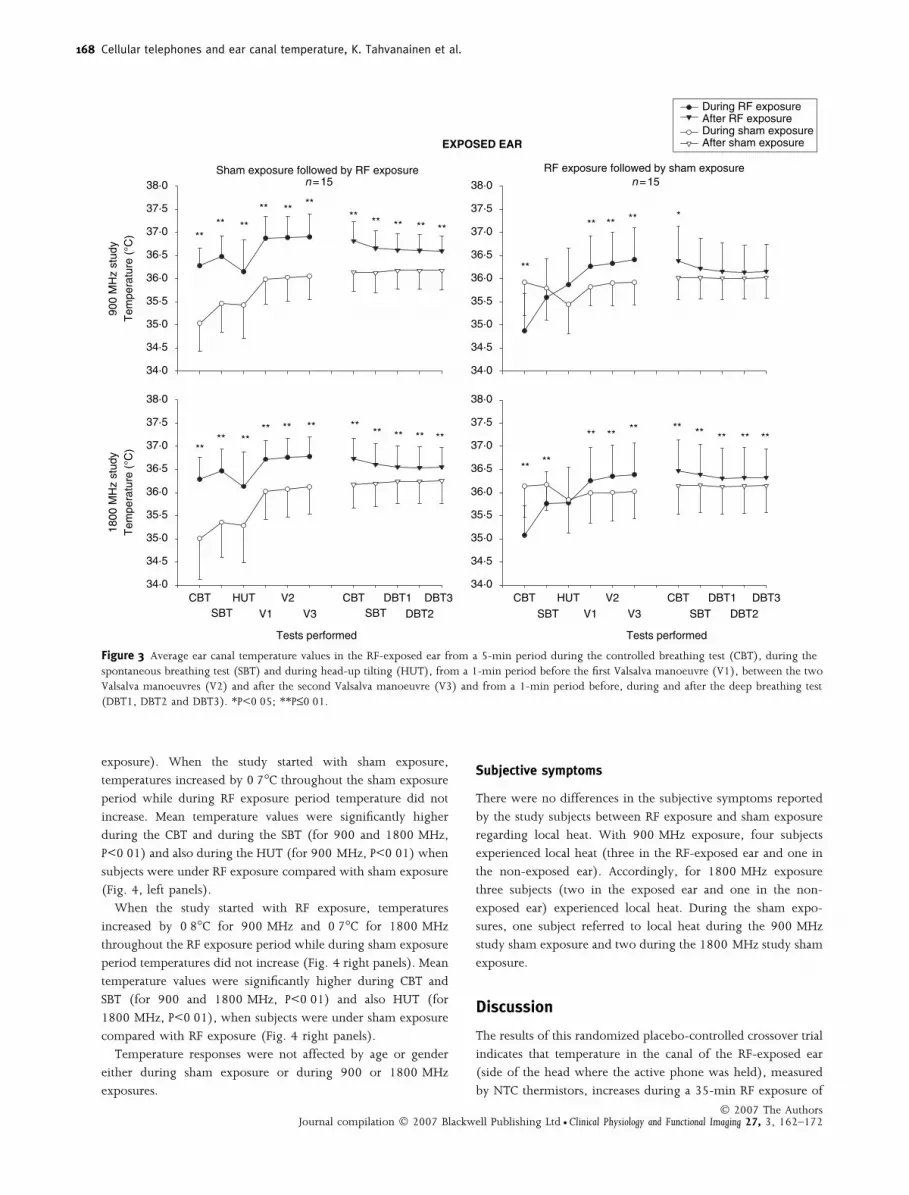
When the study started with sham exposure, the mean
temperature increased throughout the sham exposure period
by 1Æ0�C in the study with 900 MHz and by 1Æ2�C in the study
with 1800 MHz. When the study started with RF exposure, the
ear canal temperature on the exposed side increased throughout
the exposure period by 1Æ5�C during the study with 900 MHz
and by 1Æ3�C during the study with 1800 MHz.
When the studies (900 and 1800 MHz) started with sham
exposure, the mean temperature values were significantly higher
in every study performed when subjects were under RF
exposure compared with sham exposure. Moreover during the
postexposure period temperatures were significantly higher
compared with post-sham exposure period (P<0Æ01) (Fig. 3 left
panels, Tables 3 and 4). In the 900 MHz study, the differences
between both interventions range from 0Æ7 ± 0Æ5�C to 1Æ2 ±
0Æ5�C during the intervention period and from 0Æ4 ± 0Æ2�C to
0Æ6 ± 0Æ3�C during postintervention period (P<0Æ01) (Fig. 3
left upper panel, Table 3). In the 1800 MHz study, the
differences range from 0Æ6 ± 0Æ4�C to 1Æ3 ± 0Æ7�C during
intervention period and from 0Æ3 ± 0Æ3�C to 0Æ5 ± 0Æ4�Cduring postintervention period (P<0Æ01) (Fig. 3 left lower
panel, Table 4).
When the studies were started with RF exposure, mean
temperature values of sham exposure were significantly higher
than RF exposure during CBT (for 900 and 1800 MHz,
P < 0Æ01) and during SBT (for 1800 MHz, P<0Æ01) (Fig. 3
right panels). Mean temperature values were significantly higher
during RF exposure compared with sham exposure during the
VM. The differences ranged from 0Æ4 ± 0Æ5�C to 0Æ5 ± 0Æ5�C for
the 900 MHz study and from 0Æ3 ± 0Æ2�C to 0Æ4 ± 0Æ3�C for
the 1800 MHz study (P<0Æ01) (Fig. 3 right panels, Tables 3 and
4). In the 900 MHz study, temperature was higher also during
the CBT of the postexposure period compared with the post-
sham exposure (0Æ4 ± 0Æ6�C, P<0Æ05) (Fig. 3 right upper panel,
Table 3). In the 1800 MHz study, temperature was higher
during the whole postexposure period compared with the post-
sham exposure period. The differences ranged from 0Æ2 ± 0Æ2�Cto 0Æ3 ± 0Æ3�C (P<0Æ01) (Fig. 3 right lower panel, Table 4).
Non-exposed ear
There were no statistically significant differences in the ear canal
temperature between the sham exposure and 1800 MHz RF
exposure (Fig. 2 right lower panel, Table 2). During the
900 MHz study the temperature at the end of VM was
0Æ1 ± 0Æ2�C higher during exposure compared with sham
exposure (P<0Æ05) (Fig. 2 right upper panel, Table 1). There
were no statistically significant differences between postexpo-
sure and post-sham exposure periods neither during 900 MHz
nor during 1800 MHz studies (Fig. 2 right panels, Tables 1 and
2). No carry-over effects were observed either during 900 MHz
study or during 1800 MHz study.
A period effect was present in both studies (900 and
1800 MHz). Temperatures increased at the beginning of the
study independent of the intervention (RF exposure or sham
Table 2 Mean ± SD ear canal temperature values in the RF-exposed and non-exposed ear in the 1800 MHz study. Temperatures were calculated froma 5-min period during the controlled breathing test (CBT), during the spontaneous breathing test (SBT) and during head-up tilting (HUT), from a 1-min period before the first Valsalva manoeuvre (V1), between the two Valsalva manoeuvres (V2) and after the second Valsalva manoeuvre (V3) andfrom a 1-min period before, during and after the deep breathing test (DBT1, DBT2 and DBT3).
Testsperformed
Temperature
RF-exposed ear
P
Temperature
Non-exposed ear
P
During RF
exposure (�C)
During sham
exposure (�C)
During RF
exposure (�C)
During sham
exposure (�C)
CBT 35Æ7 ± 0Æ8 35Æ6 ± 1Æ0 0Æ78 35Æ6 ± 0Æ8 35Æ7 ± 0Æ7 0Æ63SBT 36Æ1 ± 0Æ7 35Æ8 ± 0Æ8 0Æ11 35Æ8 ± 0Æ7 35Æ8 ± 0Æ6 0Æ81HUT 35Æ9 ± 0Æ8 35Æ6 ± 0Æ8 0Æ01 35Æ7 ± 0Æ6 35Æ7 ± 0Æ6 0Æ35V1 36Æ5 ± 0Æ6 36Æ0 ± 0Æ6 0Æ00 36Æ0 ± 0Æ6 35Æ9 ± 0Æ6 0Æ38V2 36Æ6 ± 0Æ6 36Æ0 ± 0Æ6 0Æ00 35Æ9 ± 0Æ7 35Æ9 ± 0Æ6 0Æ89V3 36Æ6 ± 0Æ7 36Æ1 ± 0Æ6 0Æ00 36Æ0 ± 0Æ6 35Æ9 ± 0Æ6 0Æ18
After RF exposure (�C) After sham exposure (�C) After RF exposure (�C) After sham exposure (�C)CBT 36Æ6 ± 0Æ6 36Æ2 ± 0Æ6 0Æ00 36Æ1 ± 0Æ6 36Æ1 ± 0Æ6 0Æ58SBT 36Æ5 ± 0Æ6 36Æ2 ± 0Æ6 0Æ00 36Æ1 ± 0Æ6 36Æ1 ± 0Æ6 0Æ67DBT1 36Æ4 ± 0Æ6 36Æ2 ± 0Æ5 0Æ00 36Æ1 ± 0Æ6 36Æ1 ± 0Æ6 0Æ47DBT2 36Æ4 ± 0Æ6 36Æ2 ± 0Æ5 0Æ00 36Æ1 ± 0Æ6 36Æ1 ± 0Æ6 0Æ45DBT3 36Æ4 ± 0Æ6 36Æ2 ± 0Æ5 0Æ00 36Æ1 ± 0Æ6 36Æ1 ± 0Æ6 0Æ58
Data were mean ± SD.
Cellular telephones and ear canal temperature, K. Tahvanainen et al.
� 2007 The AuthorsJournal compilation � 2007 Blackwell Publishing Ltd • Clinical Physiology and Functional Imaging 27, 3, 162–172
167
exposure). When the study started with sham exposure,
temperatures increased by 0Æ7�C throughout the sham exposure
period while during RF exposure period temperature did not
increase. Mean temperature values were significantly higher
during the CBT and during the SBT (for 900 and 1800 MHz,
P<0Æ01) and also during the HUT (for 900 MHz, P<0Æ01) when
subjects were under RF exposure compared with sham exposure
(Fig. 4, left panels).
When the study started with RF exposure, temperatures
increased by 0Æ8�C for 900 MHz and 0Æ7�C for 1800 MHz
throughout the RF exposure period while during sham exposure
period temperatures did not increase (Fig. 4 right panels). Mean
temperature values were significantly higher during CBT and
SBT (for 900 and 1800 MHz, P<0Æ01) and also HUT (for
1800 MHz, P<0Æ01), when subjects were under sham exposure
compared with RF exposure (Fig. 4 right panels).
Temperature responses were not affected by age or gender
either during sham exposure or during 900 or 1800 MHz
exposures.
Subjective symptoms
There were no differences in the subjective symptoms reported
by the study subjects between RF exposure and sham exposure
regarding local heat. With 900 MHz exposure, four subjects
experienced local heat (three in the RF-exposed ear and one in
the non-exposed ear). Accordingly, for 1800 MHz exposure
three subjects (two in the exposed ear and one in the non-
exposed ear) experienced local heat. During the sham expo-
sures, one subject referred to local heat during the 900 MHz
study sham exposure and two during the 1800 MHz study sham
exposure.
Discussion
The results of this randomized placebo-controlled crossover trial
indicates that temperature in the canal of the RF-exposed ear
(side of the head where the active phone was held), measured
by NTC thermistors, increases during a 35-min RF exposure of
Tests performed
34·0
34·5
35·0
35·5
36·0
36·5
37·0
37·5
38·0
Tests performed
1800
MH
z st
udy
34·0
34·5
35·0
35·5
36·0
36·5
37·0
37·5
38·0
Sham exposure followed by RF exposuren =15
900
MH
z st
udy
Tem
pera
ture
(°C
)T
empe
ratu
re (
°C)
34·0
34·5
35·0
35·5
36·0
36·5
37·0
37·5
38·0
During RF exposure After RF exposure During sham exposureAfter sham exposure
CBT HUT V2SBT
CBT DBT1 DBT3 SBT DBT2
RF exposure followed by sham exposuren =15
34·0
34·5
35·0
35·5
36·0
36·5
37·0
37·5
38·0
CBT HUT V2 SBT V1 V3V1 V3
CBT DBT1 DBT3SBT DBT2
** **
** ** **** ** ** ** **
EXPOSED EAR
**
**
** ** ** *
**** **
** ** ** **** ** ** **
** **
** ** ** ** ** ** ** **
Figure 3 Average ear canal temperature values in the RF-exposed ear from a 5-min period during the controlled breathing test (CBT), during thespontaneous breathing test (SBT) and during head-up tilting (HUT), from a 1-min period before the first Valsalva manoeuvre (V1), between the twoValsalva manoeuvres (V2) and after the second Valsalva manoeuvre (V3) and from a 1-min period before, during and after the deep breathing test(DBT1, DBT2 and DBT3). *P<0Æ05; **P£0Æ01.
Cellular telephones and ear canal temperature, K. Tahvanainen et al.
� 2007 The AuthorsJournal compilation � 2007 Blackwell Publishing Ltd • Clinical Physiology and Functional Imaging 27, 3, 162–172
168

900 and 1800 MHz, the operational frequencies used in the
European cellular phones. Although temperatures were signifi-
cantly higher also during the postexposure period, the maximal
increases were found during the last three tests performed
during the RF exposure period, reaching the maximum
increases of 1Æ2�C (for the 900 MHz) and 1Æ3�C (for the
1800 MHz). There were no increases in the ear canal tempera-
ture on the side of the head where the inactive phone was held,
suggesting that the increases in the temperature exist only in the
local area where the RF exposure was given. In the present
study, the temperature started to decrease immediately after the
RF exposure was switched OFF.
Temperature recordings in the present study were started
almost immediately after the NTC thermistors were inserted
through ear plugs into the ear canals. Independent that the air
volume in the ear canal between tympanus and the ear plug is
small, the time to obtain thermal equilibrium explains partly the
increase of temperature during the first minutes of recording.
This is due to normal thermal stabilization in the ear canal
between the core temperature and the environment. The
Table 3 Mean ± SD ear canal temperature values in the RF-exposed ear in the 900 MHz study according to order of intervention. Temperatures werecalculated from a 5-min period during the controlled breathing test (CBT), during the spontaneous breathing test (SBT) and during head-up tilting(HUT), from a 1-min period before the first Valsalva manoeuvre (V1), between the two Valsalva manoeuvres (V2) and after the second Valsalvamanoeuvre (V3) and from a 1-min period before, during and after the deep breathing test (DBT1, DBT2 and DBT3).
Testsperformed
Temperature
Sham exposure followed by RF exposure
P
Temperature
RF exposure followed by sham exposure
P
During RF
exposure (�C)
During sham
exposure (�C)
During RF
exposure (�C)
During sham
exposure (�C)
CBT 36Æ3 ± 0Æ4 35Æ0 ± 0Æ6 0Æ00 34Æ9 ± 0Æ8 35Æ9 ± 0Æ7 0Æ00SBT 36Æ5 ± 0Æ4 35Æ5 ± 0Æ6 0Æ00 35Æ6 ± 0Æ8 35Æ8 ± 0Æ7 0Æ34HUT 36Æ1 ± 0Æ7 35Æ4 ± 0Æ7 0Æ00 35Æ9 ± 0Æ8 35Æ4 ± 0Æ6 0Æ12V1 36Æ9 ± 0Æ5 35Æ9 ± 0Æ5 0Æ00 36Æ3 ± 0Æ7 35Æ8 ± 0Æ4 0Æ00V2 36Æ9 ± 0Æ5 36Æ0 ± 0Æ5 0Æ00 36Æ3 ± 0Æ7 35Æ9 ± 0Æ5 0Æ01V3 36Æ9 ± 0Æ5 36Æ0 ± 0Æ5 0Æ00 36Æ4 ± 0Æ7 35Æ9 ± 0Æ5 0Æ01
After RF exposure (�C) After sham exposure (�C) After RF exposure (�C) After sham exposure (�C)CBT 36Æ8 ± 0Æ4 36Æ1 ± 0Æ4 0Æ00 36Æ4 ± 0Æ7 36Æ0 ± 0Æ5 0Æ04SBT 36Æ7 ± 0Æ4 36Æ1 ± 0Æ4 0Æ00 36Æ2 ± 0Æ7 36Æ0 ± 0Æ5 0Æ19DBT1 36Æ6 ± 0Æ3 36Æ2 ± 0Æ4 0Æ00 36Æ2 ± 0Æ6 36Æ0 ± 0Æ5 0Æ30DBT2 36Æ6 ± 0Æ3 36Æ2 ± 0Æ4 0Æ00 36Æ1 ± 0Æ6 36Æ0 ± 0Æ4 0Æ31DBT3 36Æ6 ± 0Æ3 36Æ2 ± 0Æ4 0Æ00 36Æ2 ± 0Æ6 36Æ0 ± 0Æ4 0Æ32
Data were mean ± SD.
Table 4 Mean ± SD ear canal temperature values in the RF-exposed ear in the 1800 MHz study according to order of intervention. Temperatures werecalculated from a 5-min period during the controlled breathing test (CBT), during the spontaneous breathing test (SBT) and during head-up tilting(HUT), from a 1-min period before the first Valsalva manoeuvre (V1), between the two Valsalva manoeuvres (V2) and after the second Valsalvamanoeuvre (V3) and from a 1-min period before, during and after the deep breathing test (DBT1, DBT2 and DBT3).
Tests
performed
Temperature
Sham exposure followed by RF exposure
P
Temperature
RF exposure followed by sham exposure
P
During RFexposure (�C)
During shamexposure (�C)
During RFexposure (�C)
During shamexposure (�C)
CBT 36Æ3 ± 0Æ5 34Æ9 ± 0Æ9 0Æ00 35Æ1 ± 0Æ6 36Æ1 ± 0Æ7 0Æ00SBT 36Æ5 ± 0Æ5 35Æ4 ± 0Æ8 0Æ00 35Æ8 ± 0Æ7 36Æ2 ± 0Æ6 0Æ01HUT 36Æ1 ± 0Æ7 35Æ3 ± 0Æ8 0Æ00 35Æ8 ± 0Æ8 35Æ8 ± 0Æ7 0Æ59V1 36Æ7 ± 0Æ4 36Æ0 ± 0Æ6 0Æ00 36Æ3 ± 0Æ7 36Æ0 ± 0Æ7 0Æ00V2 36Æ8 ± 0Æ4 36Æ1 ± 0Æ6 0Æ00 36Æ4 ± 0Æ7 36Æ0 ± 0Æ6 0Æ00V3 36Æ8 ± 0Æ4 36Æ1 ± 0Æ6 0Æ00 36Æ4 ± 0Æ7 36Æ0 ± 0Æ6 0Æ00
After RF exposure (�C) After sham exposure (�C) After RF exposure (�C) After sham exposure (�C)CBT 36Æ7 ± 0Æ4 36Æ2 ± 0Æ5 0Æ00 36Æ5 ± 0Æ7 36Æ2 ± 0Æ6 0Æ00SBT 36Æ6 ± 0Æ4 36Æ2 ± 0Æ5 0Æ00 36Æ4 ± 0Æ7 36Æ2 ± 0Æ6 0Æ00DBT1 36Æ6 ± 0Æ5 36Æ2 ± 0Æ5 0Æ00 36Æ3 ± 0Æ7 36Æ1 ± 0Æ6 0Æ01DBT2 36Æ5 ± 0Æ5 36Æ2 ± 0Æ5 0Æ01 36Æ3 ± 0Æ7 36Æ1 ± 0Æ6 0Æ01DBT3 36Æ6 ± 0Æ4 36Æ3 ± 0Æ5 0Æ01 36Æ3 ± 0Æ6 36Æ2 ± 0Æ6 0Æ01
Data were mean ± SD.
Cellular telephones and ear canal temperature, K. Tahvanainen et al.
� 2007 The AuthorsJournal compilation � 2007 Blackwell Publishing Ltd • Clinical Physiology and Functional Imaging 27, 3, 162–172
169
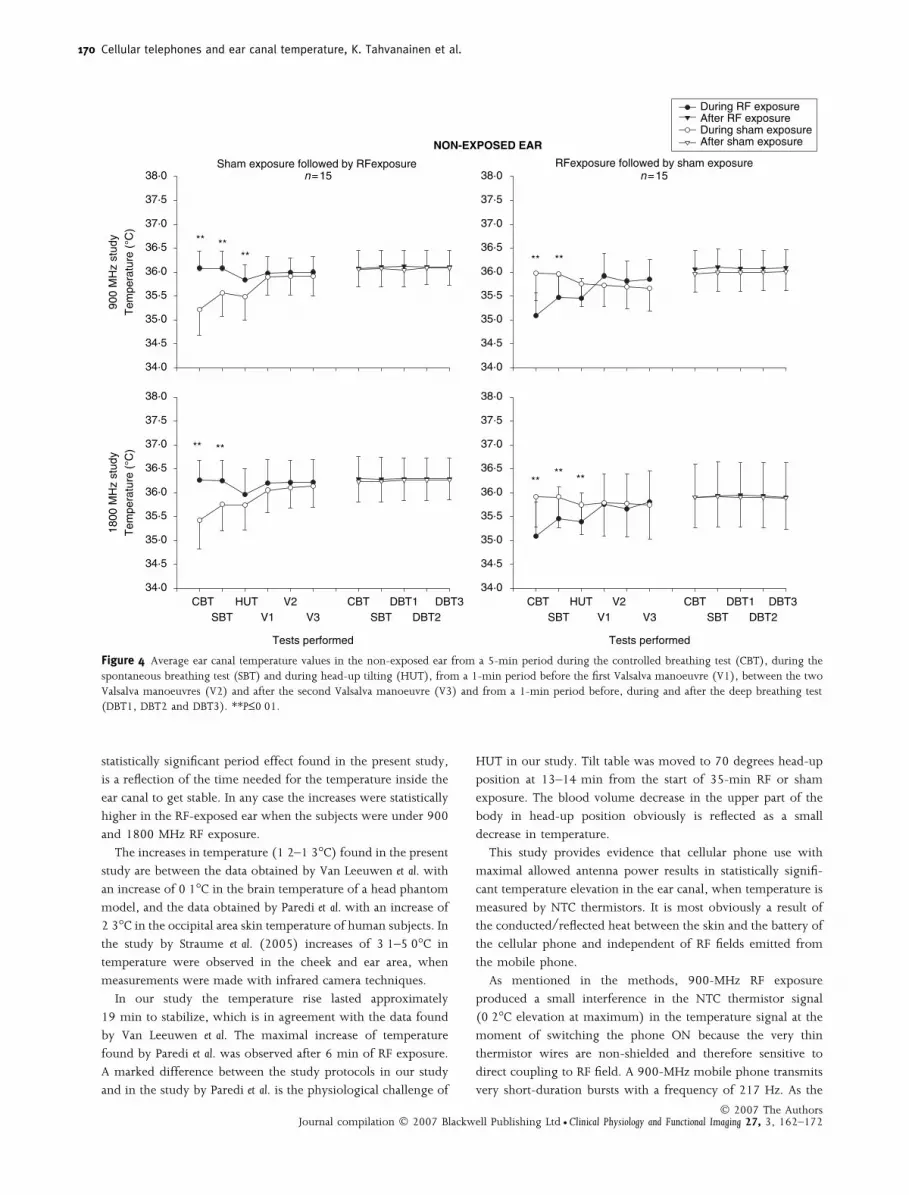
statistically significant period effect found in the present study,
is a reflection of the time needed for the temperature inside the
ear canal to get stable. In any case the increases were statistically
higher in the RF-exposed ear when the subjects were under 900
and 1800 MHz RF exposure.
The increases in temperature (1Æ2–1Æ3�C) found in the present
study are between the data obtained by Van Leeuwen et al. with
an increase of 0Æ1�C in the brain temperature of a head phantom
model, and the data obtained by Paredi et al. with an increase of
2Æ3�C in the occipital area skin temperature of human subjects. In
the study by Straume et al. (2005) increases of 3Æ1–5Æ0�C in
temperature were observed in the cheek and ear area, when
measurements were made with infrared camera techniques.
In our study the temperature rise lasted approximately
19 min to stabilize, which is in agreement with the data found
by Van Leeuwen et al. The maximal increase of temperature
found by Paredi et al. was observed after 6 min of RF exposure.
A marked difference between the study protocols in our study
and in the study by Paredi et al. is the physiological challenge of
HUT in our study. Tilt table was moved to 70 degrees head-up
position at 13–14 min from the start of 35-min RF or sham
exposure. The blood volume decrease in the upper part of the
body in head-up position obviously is reflected as a small
decrease in temperature.
This study provides evidence that cellular phone use with
maximal allowed antenna power results in statistically signifi-
cant temperature elevation in the ear canal, when temperature is
measured by NTC thermistors. It is most obviously a result of
the conducted/reflected heat between the skin and the battery of
the cellular phone and independent of RF fields emitted from
the mobile phone.
As mentioned in the methods, 900-MHz RF exposure
produced a small interference in the NTC thermistor signal
(0Æ2�C elevation at maximum) in the temperature signal at the
moment of switching the phone ON because the very thin
thermistor wires are non-shielded and therefore sensitive to
direct coupling to RF field. A 900-MHz mobile phone transmits
very short-duration bursts with a frequency of 217 Hz. As the
Tests performed
34·0
34·5
35·0
35·5
36·0
36·5
37·0
37·5
38·0
Tests performed
1800
MH
z st
udy
34·0
34·5
35·0
35·5
36·0
36·5
37·0
37·5
38·0
Sham exposure followed by RFexposuren=15 n=15
900
MH
z st
udy
Tem
pera
ture
(°C
)T
empe
ratu
re (
°C)
34·0
34·5
35·0
35·5
36·0
36·5
37·0
37·5
38·0
During RF exposureAfter RF exposureDuring sham exposure After sham exposure
CBT HUT V2SBT V1 V3
CBT DBT1 DBT3SBT DBT2
RFexposure followed by sham exposure
34·0
34·5
35·0
35·5
36·0
36·5
37·0
37·5
38·0
CBT HUT V2SBT V1 V3
CBT DBT1 DBT3 SBT DBT2
**** **
NON-EXPOSED EAR
**
**
** **
**** **
Figure 4 Average ear canal temperature values in the non-exposed ear from a 5-min period during the controlled breathing test (CBT), during thespontaneous breathing test (SBT) and during head-up tilting (HUT), from a 1-min period before the first Valsalva manoeuvre (V1), between the twoValsalva manoeuvres (V2) and after the second Valsalva manoeuvre (V3) and from a 1-min period before, during and after the deep breathing test(DBT1, DBT2 and DBT3). **P£0Æ01.
Cellular telephones and ear canal temperature, K. Tahvanainen et al.
� 2007 The AuthorsJournal compilation � 2007 Blackwell Publishing Ltd • Clinical Physiology and Functional Imaging 27, 3, 162–172
170

sampling rate of temperature signals was 200 Hz, the mobile
phone generated amplitude modulation was under-sampled
resulting spectral folding and the generation of the 17 Hz signal.
Thermistor amplifiers included heavy low-pass filtering for RF
interferences but such a very low modulation frequency could
not be eliminated totally, especially because the amplitude
modulation was so strong. This results to the need of
temperature correction, which was made carefully to the
temperature observations during 900 MHz exposure. It is
important to be aware of this kind of possible interference of
the RF fields with the instruments used to measure the
biosignals that may lead to biased conclusions without careful
evaluation.
The decrease in both ear canals’ temperature, both on
RF-exposed and non-exposed side, during HUT is a reflection
of blood volume changes in the head during orthostatic stress.
The findings encourage the possibility to use ear canal
temperature measurement as a signal that could provide
noninvasive data about blood volume changes in the central
nervous system.
With the increased public concern regarding RF field
exposures and potential adverse human health effects, different
authorities and scientific communities have been developing
safety guidelines (International Commission on Non-Ionizing
Radiation Protection (ICNIRP), 1998; Minister of Public Works
and Governmental Services, Canada, 1999). The temperature
changes in the tissues are the basis for SAR safety level
determination. The major difficulties on the safety level
determination are the acquisition of temperature signal and
the impossibility of obtaining SAR measurements in vivo.
Knowing that the major concern of deleterious health effect
of RF are the possible alterations in the central nervous system
function, changes in human brain temperature during mobile
phone use are of vital importance. As in vivo brain temperature
measurement at the moment is not available, the ear canal is the
closest, easiest and reachable way to get approximate picture of
core temperature changes during cellular phone use. In general,
measurements of temperature inside a human body are one of
the most difficult tasks in terms of accuracy. The increase in ear
canal temperature, which our study demonstrates, is mostly due
to warming of phone RF output amplifier at maximum antenna
powers, heat conduction from the phone, and the subsequent
warming of cheek and ear tissues. Direct RF heating by the
mobile phones has been modelled and estimated (Bernardi et al.,
2001; Gandhi et al., 2001) to cause only a negligible tempera-
ture rise (a few tenths of degree Celsius ) in the head area.
Finally, we note that the dual-band cellular phone model (Nokia
6150) used in this study was introduced to markets in 1998,
and may not be representative of current designs or battery
technologies.
More clinical studies on this topic are warranted with
alternative temperature measurement technologies and newest
mobile phone and battery technologies since the articles
published this far have provided some controversial results in
the thermal effects during cellular phone use.
Acknowledgments
This study was partially supported by granting from the
National Technology Agency (TEKES), Helsinki, Finland
References
Altman DG. Practical Statistics for Medical Research (1999), Appendix B,pp. 540–544. Chapman & Hall/CRC, London, UK.
Anderson V, Joyner KH. Specific absorption rate levels measured in aphantom head exposed to radio frequency transmissions from analog
hand-held mobile phones. Bioelectromagnetics (1995); 16: 60–69.
Auvinen A, Hietanen M, Luukkonen R, Koskela R-S. Brain tumors andsalivary gland cancers among cellular phone users. Epidemiology (2002);
13: 356–359.Bernardi P, Cavagnaro M, Pisa S, Piuzzi E. Power absorption and tem-
perature elevations induced in the human head by a dual-bandmonopole-helix antenna phone. IEEE Transductions Microwave Theory Tech
(2001); 49: 2539–2546.Borbely AA, Huber R, Graf T, Fuchs B, Gallmann E, Achermann P. Pulsed
high-frequency electromagnetic field affects human sleep and sleepelectroencephalogram. Neurosci Lett (1999); 275: 207–210.
Gandhi OP, Li QX, Kang G. Temperature rise for the human head forcellular telephones and for peak SARs prescribed in safety guidelines.
IEEE Transductions Microwave Theory Tech (2001); 49: 1607–1613.Hietanen M, Kovala T, Hamalainen A-M. Human brain activity during
exposure to radiofrequency fields emitted by cellular phones. Scand JWork Environ Health (2000); 26: 87–92.
Hietanen M, Hamalainen A-M, Husman T. Hypersensitivity symptomsassociated with exposure to cellular telephones: no causal link. Bio-
electromagnetics (2002); 23: 264–270.Inskip PD, Tarone RE, Hatch EE, Wilcosky TC, Shapiro WR, Selker RG,
Fine HA, Black PM, Loeffler JS, Linet MS. Cellular-telephone use andbrain tumors. N Engl J Med (2001); 344: 79–86.
International Commission on Non-Ionizing Radiation Protection(ICNIRP). Guidelines for limiting exposure to time-varying, electric,
magnetic and electromagnetic fields. Health Phys (1998); 74: 494–522.Johansen C, Boice J Jr, McLaughlin J, Olsen J. Cellular telephones and
cancer – a nationwide cohort study in Denmark. J Natl Cancer Inst(2001); 93: 203–207.
Koivisto M, Revonsuo A, Krause C, Haarala C, Sillanmaki L, Laine M,Hamalainen H. Effects of 900 MHz electromagnetic field emitted by
cellular telephones on response times in humans. Neuroreport (2000);11: 413–415.
Krause CM, Sillanmaki L, Koivisto M, Haggqvist A, Saarela C, Revonsuo
A, Laine M, Hamalainen H. Effects of electromagnetic field emitted bycellular phones on the EEG during a memory task. Neuroreport (2000);
11: 761–764.Krewski D, Byus CV, Glickman BW, Lotz WG, Mandeville R, McBride
ML, Prato FS, Weaver DF. Potential health risks of radiofrequencyfields from wireless telecommunication devices. J Toxicol Environ Health
(2001); 4: 1–143.Mann K, Roschke J. Effects of pulsed high-frequency electromagnetic
fields on human sleep. Neuropsychobiology (1996); 33: 41–47.Minister of Public Works and Governmental Services, Canada. Limits of
Human Exposure to Radiofrequency Range from 3 kHz to 300 GHz (1999).Minister of Public Works and Governmental Services, Canada, ISBN
0-662-28032-6.Muscat JE, Malkin MG, Thompson S, Shore RE, Stellman SD, McRee D,
Neugut AI, Wynder EL. Handheld cellular telephone use and risk ofbrain cancer. JAMA (2000); 284: 3001–3007.
Cellular telephones and ear canal temperature, K. Tahvanainen et al.
� 2007 The AuthorsJournal compilation � 2007 Blackwell Publishing Ltd • Clinical Physiology and Functional Imaging 27, 3, 162–172
171

Paredi P, Kharitonov SA, Hanazawa T, Barnes PJ. Local vasodilator
response to mobile phones. Laryngoscope (2001); 111: 159–162.Preece AW, Iwi G, Davies-Smith A, Wesnes K, Butler S, Lim E, Varey A.
Effect of a 915-MHz simulated mobile phone signal on cognitivefunction in man. Int J Radiat Biol (1999); 75: 447–456.
Sandstrom M, Wilen J, Oftedal G, Hansson Mild K. Mobile phone useand subjective symptoms. Comparison of symptoms experienced by
users of analogue and digital mobile phones. Occup Med (London)(2001); 51: 25–35.
Straume A, Oftedal G, Johansson A. Skin temperature increase caused by
a mobile phone: a methodological infrared camera study. Bioelectro-magnetics (2005); 26: 510–519.
Tahvanainen K, Nino J, Halonen P, Kuusela T, Laitinen T, Lansimies E,
Hartikainen J, Hietanen M, Lindholm H. Cellular phone use does notacutely affect blood pressure or heart rate of humans. Bioelectromagnetics
(2004); 25: 73–83.Van Leeuwen GMJ, Lagendijk JJW, Van Leersum BJAM, Zwamborn APM,
Hornsleth SN, Kotte ANTJ. Calculation of change in brain tempera-tures due to exposure to a mobile phone. Phys Med Biol (1999); 44:
2367–2379.Wainwright P. Thermal effects of radiation from cellular telephones. Phys
Med Biol (2000); 45: 2363–2372.
Cellular telephones and ear canal temperature, K. Tahvanainen et al.
� 2007 The AuthorsJournal compilation � 2007 Blackwell Publishing Ltd • Clinical Physiology and Functional Imaging 27, 3, 162–172
172