Effects of enrofloxacin on acepromazine-ketamine anaesthesia in rabbits.
Upload
carleton-caCategory
view
0download
0
This article appeared in a journal published by Elsevier. The attachedcopy is furnished to the author for internal non-commercial researchand education use, including for instruction at the authors institution
and sharing with colleagues.
Other uses, including reproduction and distribution, or selling orlicensing copies, or posting to personal, institutional or third party
websites are prohibited.
In most cases authors are permitted to post their version of thearticle (e.g. in Word or Tex form) to their personal website orinstitutional repository. Authors requiring further information
regarding Elsevier’s archiving and manuscript policies areencouraged to visit:
http://www.elsevier.com/copyright
Author's personal copy
Effects of castration-induced visceral obesity and antioxidant treatmenton lipid profile and insulin sensitivity in New Zealand white rabbits
Ivan Penchev Georgiev a,*, Teodora Mircheva Georgieva a, Veselin Ivanov b, Sylviya Dimitrova a,Ivan Kanelov a, Tatyana Vlaykova b, Stoyan Tanev c, Dimitrinka Zaprianova a, Evgenia Dichlianova a,Georgi Penchev d, Lazarin Lazarov e, Ekaterina Vachkova a, Anton Roussenov e
a Department of Pharmacology, Animal Physiology and Physiological Chemistry, Faculty of Veterinary Medicine, Trakia University, 6000 Stara Zagora, Bulgariab Department of Chemistry and Biochemistry, Faculty of Medicine, Trakia University, 6000 Stara Zagora, Bulgariac Integrative Innovation Management Unit, Department of Industrial and Civil Engineering, University of Southern Denmark, Niels Bohrs Alle 1, DK-5230, Odense M, Denmarkd Department of Veterinary Anatomy and Histology, Faculty of Veterinary Medicine, Trakia University, 6000 Stara Zagora, Bulgariae Department Internal Diseases, Faculty of Veterinary Medicine, Trakia University, 6000 Stara Zagora, Bulgaria
a r t i c l e i n f o
Article history:Received 2 October 2009Accepted 18 May 2010
Keywords:Visceral obesityFatty liverGlucose toleranceInsulin sensitivityBlood lipid profileAntioxidants, Rabbits
a b s t r a c t
Molecular mechanisms, responsible for the impaired insulin-sensitivity state due to the obesity are notfully understood in both humans and animals. The purpose of this study was to investigate the effectsof castration-induced visceral obesity and the influence of two antioxidants on constituents of blood lipidprofile and insulin sensitivity in New Zealand white rabbits. Twenty-six clinically healthy male NewZealand white rabbits were used in the experiment and were divided into 3 groups: first group (CI,n = 7) – castrated-obese and treated with antioxidants ‘‘Immunoprotect” for 2 months; second group(CO, n = 7) – castrated-obese; third group (NC, n = 12) – control group (non-castrated, non-obese). Atthe end of the follow-up period of 2 months after castration an intravenous glucose tolerance test (IVGTT)was performed after a 12-h fasting period as the blood samples for determination of glucose and insulinand their kinetic parameters were obtained at 5 and 0 min before and at 5, 10, 30, 60 and 120 min after theinfusion of the glucose. The constituents of lipid profile, triglycerides (TG), total cholesterol (TC) and HDL-cholesterol (HDL-C) were also assessed in the overnight fasting blood samples. The body weight (BW),body mass index (BMI), amount of the visceral fat (VF) and VF/BW ratio were both measured and calcu-lated before the IVGTT and at the end of the experimental period. All measured markers of obesity (BW,BMI, VF, VF/BW) were significantly higher in both groups of castrated rabbits than in the control group.Apart HDL-C, the plasma concentrations of all constituents of lipid profile (TG, TC, HDL-C) were the highestin CO group. There were generally no differences between CI and NC groups for the same traits. After glu-cose injection blood glucose concentrations and glucose and insulin kinetic parameters were considerablyhigher (except of glucose elimination rate) in CO rabbits than in NC ones. Castrated rabbits treated with‘‘Immunoprotect” showed lower fasting plasma insulin and improved glucose kinetics dynamics thanCO rabbits, but commensurable values of glucose and insulin kinetics parameters than NC group. Theresults of the current study clearly indicated that castration-induced visceral obesity affected negativelythe lipid profile and insulin sensitivity and/or responsiveness. Treatment with antioxidant supplementa-tion, consisted of d-limonene and vitamin E, improved blood lipid profile, fatty liver, glucose homeostasisand insulin sensitivity in obese rabbits. In addition, based on our results we may suggest that castratedmale New Zealand white rabbits might be considered as an appropriate animal model to study variousmetabolic abnormalities related to visceral obesity, such as dyslipidemia and impaired insulin sensitivity.
� 2010 Elsevier Ltd. All rights reserved.
1. Introduction
Many features of lipid metabolism in rabbits are similar tohumans (so-called LDL mammals), but differ from the most widely
used experimental animals – rats and mice, which are predomi-nantly HDL animals (Fan et al., 2001; Kawai et al., 2006). Like hu-mans, rabbits have higher concentrations of cholesterol estertransfer proteins and higher levels of apoB-containing LDL particlescompared to rats and mice (Ichikawa et al., 2004; Kawai et al.,2006; Zhao et al., 2007). Moreover, analogously to humans, but dif-ferent from mice, rabbits can develop cholesterol-diet-inducedatherosclerotic lesions (Zhao et al., 2007).
0034-5288/$ - see front matter � 2010 Elsevier Ltd. All rights reserved.doi:10.1016/j.rvsc.2010.05.023
* Corresponding author. Tel.: +359 887064791.E-mail address: [email protected] (I.P. Georgiev).
Research in Veterinary Science 90 (2011) 196–204
Contents lists available at ScienceDirect
Research in Veterinary Science
journal homepage: www.elsevier .com/locate / rvsc
Author's personal copy
Despite the increasing number of studies in the last years themolecular mechanisms responsible for the insulin-resistant statedue to the obesity are not fully understood in both humans andanimals. It has been demonstrated that obesity and insulin resis-tance, the main features of metabolic syndrome, are closely associ-ated with a state of low-grade inflammation and low expression ofperoxisome proliferator activated receptor-c (PPAR-c) in adiposetissues (Schwartz and Kahn, 1999; Odegaard et al., 2007). In Hu-mans, visceral or central obesity (due to increased intra-abdominalfat accumulation) is considered as the main predisposing factor forthe development of dyslipidemia and insulin resistance (IR), whichmay progress into metabolic syndrome and type 2 diabetes melli-tus (DMT2) (Kawai et al., 2006; Zhao et al., 2007; Hays et al., 2008).Recently, a model of diet-induced central obesity in male Japanesewhite rabbit has been developed which was accompanied byimpairment of glucose metabolism and IR (Zhao et al., 2007).Usually, the typical features of IR are found too late, when b-cellfunction has been already affected. Therefore, rabbits could be con-sidered as a good animal model to study the early changes ofperipheral insulin sensitivity and blood lipid profile in obesityand metabolic syndrome.
In the last years, it has been found that the obesity is accompa-nied by the development of oxidative stress characterized by in-creased plasma and tissue concentration of reactive oxygenspecies (ROS) and free radicals (Anderson et al., 2009). Thus, theoxidative stress, along with other etiological factors, such as in-tra-myocellular lipid accumulation, increased concentrations offree fatty acids, pro-inflammatory cytokines and adipokines, is pro-posed to be an important factor for insulin resistance (Keaney etal., 2003; Ceriello and Motz, 2004; Furukawa et al., 2004). How-ever, it is uncertain whether the use of antioxidants in obese indi-viduals leads to improvement of insulin sensitivity and/or othermetabolic parameters associated with obesity.
Therefore, the main purpose of the current study was to inves-tigate the effects of castration-induced visceral obesity and theinfluence of two antioxidants on constituents of blood lipid profileand insulin sensitivity and/or responsiveness in New Zealandwhite (NZW) rabbits.
2. Materials and methods
2.1. Experimental animals
The experimental procedure was approved by the Commissionof Ethics at the Faculty of Veterinary Medicine of Trakia University,Stara Zagora, and during the entire study period the recommenda-tions for caring and treatment of rabbits reared as experimentalanimals were followed.
Twenty-six clinically healthy male NZW rabbits were used inthe experiment. Rabbits were provided by the Agricultural Insti-tute in Stara Zagora, Bulgaria. At the beginning of the experimentthey were 2–2.5 months old. The animals were housed in individ-ual metal cages (80 � 60 � 40 cm) in a temperature-controlledroom (20–22 �C). The light/dark regime corresponded to the circa-dian cycle.
The rabbits were given free access to food and water. They werefed a commercially available standard chow diet for adult rabbits,given as dry pellets. The composition of chow diet (% dry matter)was: dry matter: 88.86; crude protein: 16.08; fat: 3.43; crude fiber:13; neutral detergent fiber: 34.44; acid detergent fiber: 18.29; aciddetergent lignin: 4.68; ash: 5.05 and digestibility energy: 10.47 MJ.The chemical composition of diet ingredients expressed as g/MJwas: dry matter: 84.9; crude protein: 15.39; crude fat: 3.28; crudefiber: 12.40; neutral detergent fiber: 32.90; acid detergent fiber:17.47; acid detergent lignin: 4.47 and ash: 4.82. During the exper-
imental period of 2 months the rabbits were determined to behealthy on the basis of results of routine physical examinationand daily monitoring of their behavior, food and water intakeand consistency of their faeces. Erythrocyte and leukocyte num-bers and hemoglobin concentration were determined twice: beforeand 2 months after the castration.
The rabbits were divided into 3 groups: (i) First group (CI, n = 7)– castrated-obese and treated with Imunoprotect for 2 months; (ii)Second group (CO, n = 7) – castrated-obese; and (iii) Third group(NC, n = 12) – control group (non-castrated non-obese).
The castration of the rabbits was performed under general anes-thesia. The premedication included atropine (Atropini sulphas;‘‘Vetprom”, Radomir, Bulgaria), administered subcutaneously(0.02 mg/kg) and 10 min afterwards followed by intramuscularinjection (i.m.) of Xylazine (Alfasan, Woerden, The Netherlands;2 mg/kg). The anesthesia was accomplished 10 min later by i.m.injection of Ketamine (Alfasan; 20 mg/kg). For surgery the rabbitswere laid on their backs, the fur in the scrotal area was depilatedand the skin was disinfected. The scrotal wounds after castrationremained open.
‘‘Immunoprotect” is a nutritional supplement in oil state. It con-sists of two components: – vitamin E (10 mg equivalent to 15 IU)(Bieri and McKenna, 1981) and organic extract from citrus fruitspeel (90 mg), which contains in high proportion limonene (Mich-aelakis et al., 2009). ‘‘Immunoprotect” was produced and giftedby Pharmaray, Sofia, Bulgaria in the form of gelatinous pearls.The rabbits from the first group received two pearls per os daily be-fore the morning feeding for 2 months (Penchev Georgiev et al.,2009).
2.2. Experimental procedures
To investigate the obesity-induced insulin resistance, an intra-venous glucose tolerance test (IVGTT) was performed 2 monthsafter the castration. All rabbits were familiarized with daily han-dling in order to avoid the stress reaction during the injection ofglucose and blood sampling during IVGTT.
The changes in blood glucose and plasma insulin concentrationswere evaluated and kinetic parameters of glucose and insulin, suchas rate constant of glucose elimination from the blood (Kel glucose,min�1), plasma half-life of glucose (T1/2 glucose, min), area underthe concentration curve of glucose (AUCglucose 0 ? 120 min,mmol/l min), area under the concentration curve of insulin(AUCinsulin 0 ? 120 min, lU ml/min) and AUCinsulin 0 ? 120 min/AUCglucose 0 ? 120 min ratio were determined as measures of insulinresistance in IVGTT tests.
The IVGTT was performed as previously described (Liu et al.,2005; Zhao et al. 2007). Briefly, the following protocol wasadopted: food was removed from 12 h overnight and a bolus of40% glucose (0.6 g/kg) was injected through the ear vein and ablood sample was collected at 5 and 0 min before and at 5, 10,30, 60 and 120 min after glucose injection. Blood samples for thedetermination of the concentration of glucose, insulin and of lipidparameters: triglycerides (TG), total cholesterol (TC), HDL-choles-terol and LDL-cholesterol, were collected from the jugular veins.The concentration of the lipid parameters was determined onlyonce in the overnight fasting samples drawn before glucoseinfusion.
Heparin was used as an anticoagulant. The blood samples werecentrifuged immediately after the collection at 800g for 15 min.The plasma was stored in plastic tubes at �20 �C until assayed.Glucose concentration was measured in whole blood.
On the day before carrying out the IVGTT the rabbits from thethree groups were weighed and the body weight (BW) and bodymass index (BMI) were determined as a marker of obesity. BMI
I.P. Georgiev et al. / Research in Veterinary Science 90 (2011) 196–204 197
Author's personal copy
was calculated using a model adapted from cats (Appleton et al.,2001).
BMI ¼ body massðkgÞ=body lengthðmÞ � heightðmÞ;
where the body length was measured as the distance between theshoulder joint and tuber ischiadicum, and the hight as distance be-tween the shoulder joint and the end of the paw at the lateral posi-tion of the rabbit.
At the end of the experiment (2 months after the castration) 9rabbits from control group and all animals from the experimentalgroups were sacrificed by an overdose of thiopental sodium forthe quantification of visceral fat, comprising the fat from abdomi-nal cavity, mesenterium and retroperitoneal area as described byZhao et al. (2007). Adipose tissues were carefully removed andweighed while still wet and the data were expressed as totalweight (g) and as the ratio between the visceral fat and bodyweight (g/kg).
2.3. Laboratory methods
The blood glucose concentration was measured immediatelyafter collection of the samples with a glucosemeter (Home Diag-nostics, Inc. Ft. Lauderdate, Florida, USA) based on glucose oxidasemethod using one drop of whole blood. Plasma insulin concentra-tion was measured by radioimmunoassay with a commerciallyavailable kit adapted for rabbits (Immunotech, Prague, CzechRepublic).
Plasma concentrations of TG, TC, HDL-cholesterol and LDL-cho-lesterol were determined with an automatic chemical analyser CL-7000 SHIMADZU, Kyoto, Japan with BIOLABO SA kits (Maizy,France).
2.4. Histological examination
Material for a histological examination was taken from the liverof each rabbit after the animals were sacrificed as described above.The obtained tissue specimens were fixed in Bouin’s fixative and in10% neutral-buffered formalin. After fixation the tissue specimenswere embedded in paraffin, cut into 6 lm tick sections and stainedwith hematoxylin and eosin.
2.5. Determination of kinetic parameters of glucose after IVGTT
Using a non-compartmental analysis, selected kinetic parame-ters, indicative for the ‘‘fate” of glucose within the test rabbits werecalculated. Software from WinNonlin Professional 4.0.1 (PharsightCorporation, 800 West EI Camino Real, Mountain View, CA, USA)was used. AUCglucose 0–120 min and AUCinsulin 0 ? 120 min, was calcu-lated by the trapezoidal rule. Kel glucose and T½ glucose were calcu-lated by linear regression analysis of the semilogarithmic plot ofglucose concentration vs. time.
2.6. Statistical analysis
The statistical analyses were performed using Statistica v.6.1 forWindows (StatSoft Inc., USA, 1984–2002). The descriptive statisti-cal tests, including the mean and standard error of the mean werecalculated according to the standard methods. The ANOVA test wasused to evaluate the significance of the differences in the quantita-tive variables (concentrations of glucose, insulin, blood lipidparameters, markers of obesity) between independent groups(the three experimental animal groups). When the effect of groupswas significant the differences in the concentrations of glucose,insulin and blood lipid parameters between groups were deter-mined by means of the LSD test of the PostHoc procedure. Thepaired t-test was applied to assess the difference of quantitative
variables between dependent groups (concentrations of glucoseand insulin at different times of sampling). All data are presentedas means ± standard error of the mean (mean ± SEM). Correlationsbetween BW, BMI, amount of visceral fat, concentrations of glucoseand insulin and calculated parameters of insulin sensitivity werealso determined using the Pearson correlation analysis. All analy-ses and factors with p < 0.05 were considered statisticallysignificant.
3. Results
3.1. Effect of castration-induced obesity and ‘‘Immunoprotect” onblood lipid profile
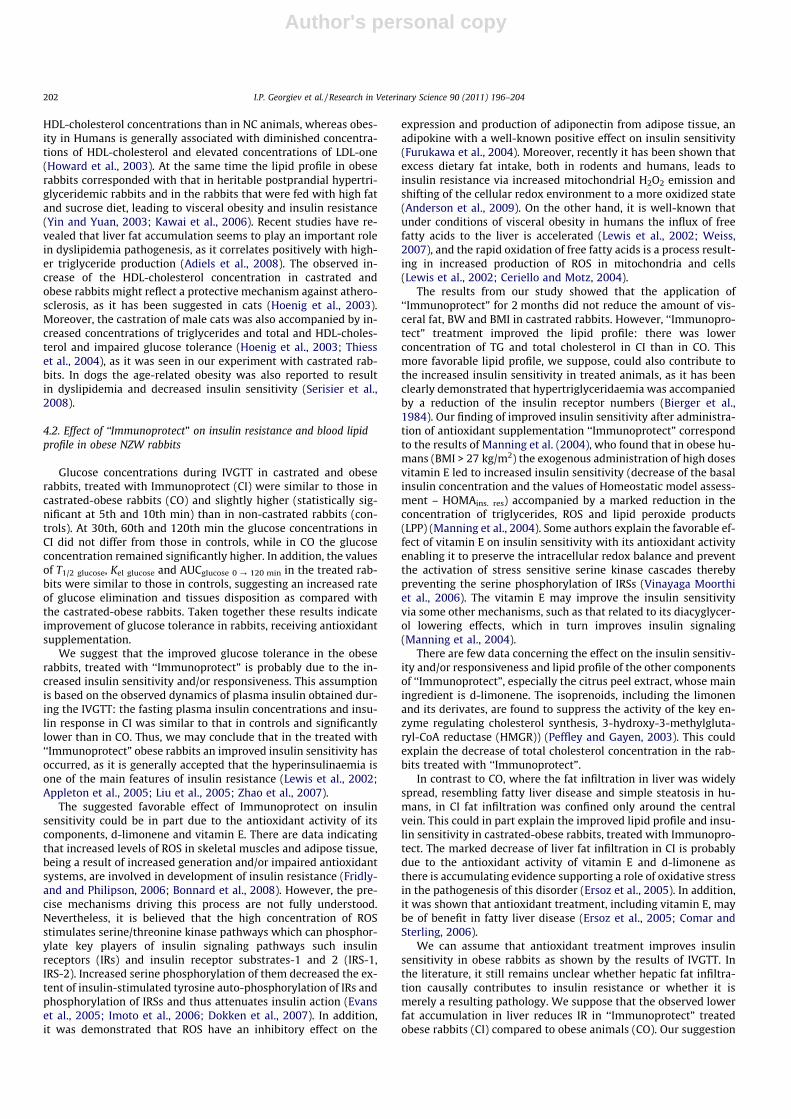
Body weight (BW), BMI, amount of visceral fat (VF) and ratio ofvisceral fat to body weight (VF/BW) in CO and CI were significantly(p < 0.05) higher than in NC Table 1. At the same time, no signifi-cant difference was observed between the two groups of castratedanimals (CO vs. CI, p > 0.05) Table 1. These data clearly indicatedthat visceral obesity was developed in 2 months after the castra-tion in the rabbits and independently of the administration of anti-oxidant supplementation. When the constituents of the lipidprofile were compared, we observed a marked difference betweenthe groups: the plasma TG, TC and HDL-cholesterol levels in COwere significantly higher than that in control group (NC) and withexception of HDL-cholesterol they were also significantly highercompared to that in CI (Fig. 1). Meanwhile, no difference in TG,TC, LDL-cholesterol and HDL-cholesterol were found between thecontrol group (NC) and that treated with ‘‘Immunoprotect” (CI)(Fig. 1).
3.2. Effect of castration-induced obesity on glucose and insulin kineticparapemetrs after IVGTT
As it was described above the IVGTT was performed in rabbits2 months after the castration. The basal blood glucose concentra-
Table 1Comparison of the evaluated markers of obesity in the experimental groups ofrabbits: CI – castrated-obese and treated with ‘‘Immunoprotect”; CO – castrated-obese; NC – non-castrated, non-obese (control).
Parameters CI (n = 7)Mean ± SEM
CO (n = 7)Mean ± SEM
NC (n = 9)Mean ± SEM
GroupsBody weight (BW) (kg) 3.89 ± 0.11a 4.09 ± 0.11a 2.89 ± 0.10b
Body mass index (BMI) 65.9 ± 1.24a 68.6 ± 0.89a 60.6 ± 1.31b
Visceral fat (VF) (g) 169.6 ± 7.89a 190.1 ± 8.88a 29.9 ± 3.97b
Visceral fat/body weightratio (VF/BW)
43.5 ± 0.98a 46.4 ± 1.12a 8.53 ± 1.41b
Means with different superscript letter in the same row differ (p < 0.05).
0
0.5
1
1.5
2
2.5
3
3.5
TG (mmol/l) TC (mmol/l) LDL-C (mmol/l) HDL-C (mmol/l)
CI CO NC
**
**
**
Fig. 1. Blood lipid profiles (Mean ± SEM) in three groups of rabbits: CI ( , n = 7) –castrated-obese and treated with ‘‘Immunoprotect”; CO ( , n = 7) – castrated-obese; NC ( , n = 12) – non-castrated, non-obese (control). TG – triglycerides; TC –total cholesterol; LDL-C – LDL-cholesterol: HDL-C – HDL-cholesterol *p < 0.05 CI orNC vs. CO; **p < 0.01, CI vs. CO.
198 I.P. Georgiev et al. / Research in Veterinary Science 90 (2011) 196–204
Author's personal copy
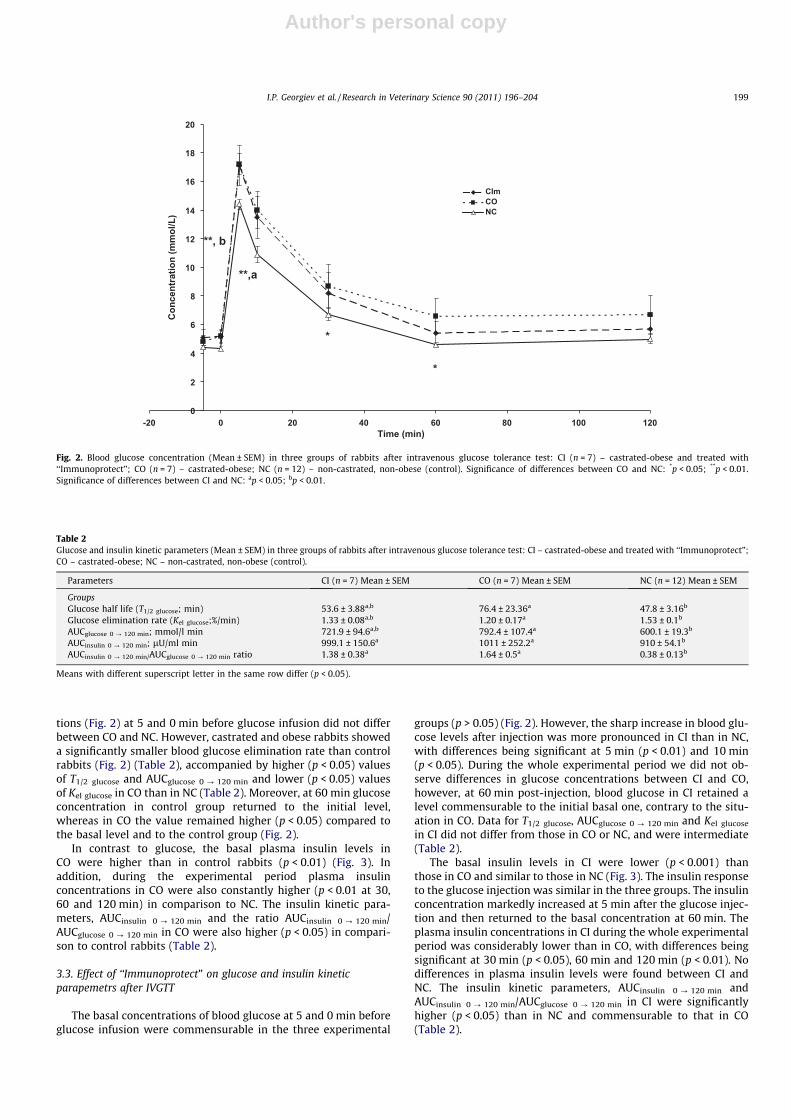
tions (Fig. 2) at 5 and 0 min before glucose infusion did not differbetween CO and NC. However, castrated and obese rabbits showeda significantly smaller blood glucose elimination rate than controlrabbits (Fig. 2) (Table 2), accompanied by higher (p < 0.05) valuesof T1/2 glucose and AUCglucose 0 ? 120 min and lower (p < 0.05) valuesof Kel glucose in CO than in NC (Table 2). Moreover, at 60 min glucoseconcentration in control group returned to the initial level,whereas in CO the value remained higher (p < 0.05) compared tothe basal level and to the control group (Fig. 2).
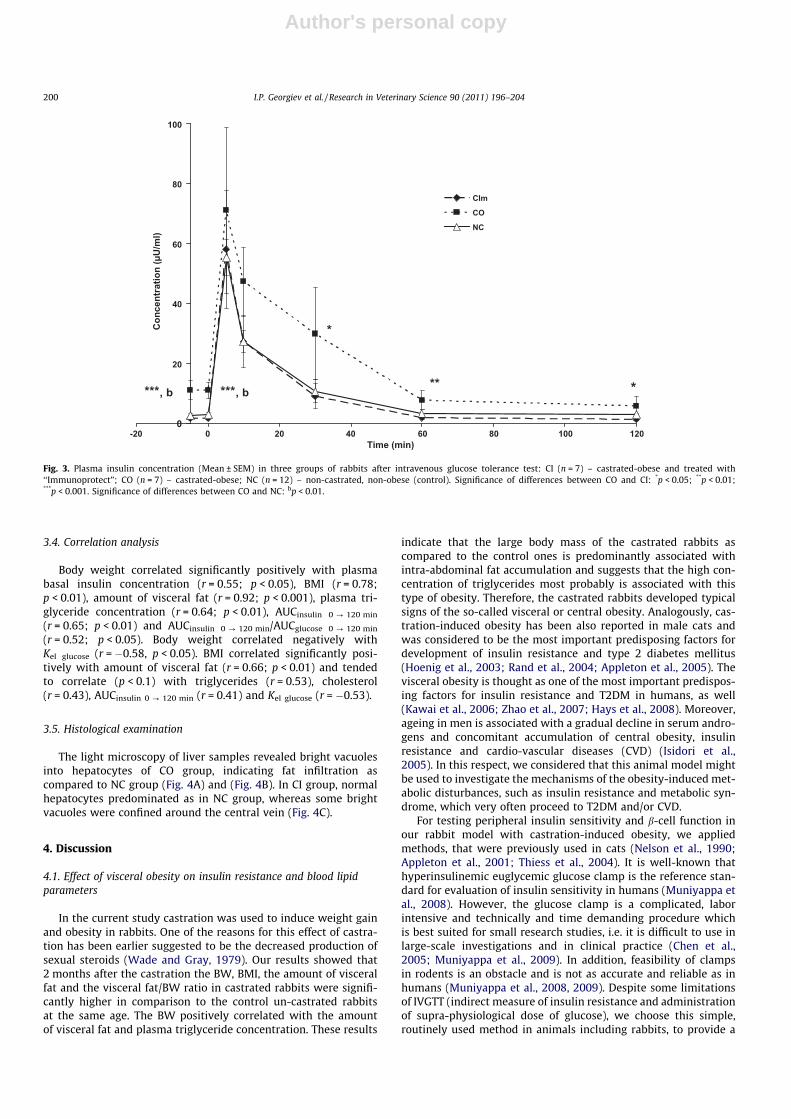
In contrast to glucose, the basal plasma insulin levels inCO were higher than in control rabbits (p < 0.01) (Fig. 3). Inaddition, during the experimental period plasma insulinconcentrations in CO were also constantly higher (p < 0.01 at 30,60 and 120 min) in comparison to NC. The insulin kinetic para-meters, AUCinsulin 0 ? 120 min and the ratio AUCinsulin 0 ? 120 min/AUCglucose 0 ? 120 min in CO were also higher (p < 0.05) in compari-son to control rabbits (Table 2).
3.3. Effect of ‘‘Immunoprotect” on glucose and insulin kineticparapemetrs after IVGTT
The basal concentrations of blood glucose at 5 and 0 min beforeglucose infusion were commensurable in the three experimental
groups (p > 0.05) (Fig. 2). However, the sharp increase in blood glu-cose levels after injection was more pronounced in CI than in NC,with differences being significant at 5 min (p < 0.01) and 10 min(p < 0.05). During the whole experimental period we did not ob-serve differences in glucose concentrations between CI and CO,however, at 60 min post-injection, blood glucose in CI retained alevel commensurable to the initial basal one, contrary to the situ-ation in CO. Data for T1/2 glucose, AUCglucose 0 ? 120 min and Kel glucose
in CI did not differ from those in CO or NC, and were intermediate(Table 2).
The basal insulin levels in CI were lower (p < 0.001) thanthose in CO and similar to those in NC (Fig. 3). The insulin responseto the glucose injection was similar in the three groups. The insulinconcentration markedly increased at 5 min after the glucose injec-tion and then returned to the basal concentration at 60 min. Theplasma insulin concentrations in CI during the whole experimentalperiod was considerably lower than in CO, with differences beingsignificant at 30 min (p < 0.05), 60 min and 120 min (p < 0.01). Nodifferences in plasma insulin levels were found between CI andNC. The insulin kinetic parameters, AUCinsulin 0 ? 120 min andAUCinsulin 0 ? 120 min/AUCglucose 0 ? 120 min in CI were significantlyhigher (p < 0.05) than in NC and commensurable to that in CO(Table 2).
0
2
4
6
8
10
12
14
16
18
20
-20 0 20 40 60 80 100 120Time (min)
Con
cent
ratio
n (m
mol
/L)
CImCONC
**, b
**,a
*
*
Fig. 2. Blood glucose concentration (Mean ± SEM) in three groups of rabbits after intravenous glucose tolerance test: CI (n = 7) – castrated-obese and treated with‘‘Immunoprotect”; CO (n = 7) – castrated-obese; NC (n = 12) – non-castrated, non-obese (control). Significance of differences between CO and NC: *p < 0.05; **p < 0.01.Significance of differences between CI and NC: ap < 0.05; bp < 0.01.
Table 2Glucose and insulin kinetic parameters (Mean ± SEM) in three groups of rabbits after intravenous glucose tolerance test: CI – castrated-obese and treated with ‘‘Immunoprotect”;CO – castrated-obese; NC – non-castrated, non-obese (control).
Parameters CI (n = 7) Mean ± SEM CO (n = 7) Mean ± SEM NC (n = 12) Mean ± SEM
GroupsGlucose half life (T1/2 glucose; min) 53.6 ± 3.88a,b 76.4 ± 23.36a 47.8 ± 3.16b
Glucose elimination rate (Kel glucose;%/min) 1.33 ± 0.08a,b 1.20 ± 0.17a 1.53 ± 0.1b
AUCglucose 0 ? 120 min; mmol/l min 721.9 ± 94.6a,b 792.4 ± 107.4a 600.1 ± 19.3b
AUCinsulin 0 ? 120 min; lU/ml min 999.1 ± 150.6a 1011 ± 252.2a 910 ± 54.1b
AUCinsulin 0 ? 120 min/AUCglucose 0 ? 120 min ratio 1.38 ± 0.38a 1.64 ± 0.5a 0.38 ± 0.13b
Means with different superscript letter in the same row differ (p < 0.05).
I.P. Georgiev et al. / Research in Veterinary Science 90 (2011) 196–204 199
Author's personal copy
3.4. Correlation analysis
Body weight correlated significantly positively with plasmabasal insulin concentration (r = 0.55; p < 0.05), BMI (r = 0.78;p < 0.01), amount of visceral fat (r = 0.92; p < 0.001), plasma tri-glyceride concentration (r = 0.64; p < 0.01), AUCinsulin 0 ? 120 min
(r = 0.65; p < 0.01) and AUCinsulin 0 ? 120 min/AUCglucose 0 ? 120 min
(r = 0.52; p < 0.05). Body weight correlated negatively withKel glucose (r = �0.58, p < 0.05). BMI correlated significantly posi-tively with amount of visceral fat (r = 0.66; p < 0.01) and tendedto correlate (p < 0.1) with triglycerides (r = 0.53), cholesterol(r = 0.43), AUCinsulin 0 ? 120 min (r = 0.41) and Kel glucose (r = �0.53).
3.5. Histological examination
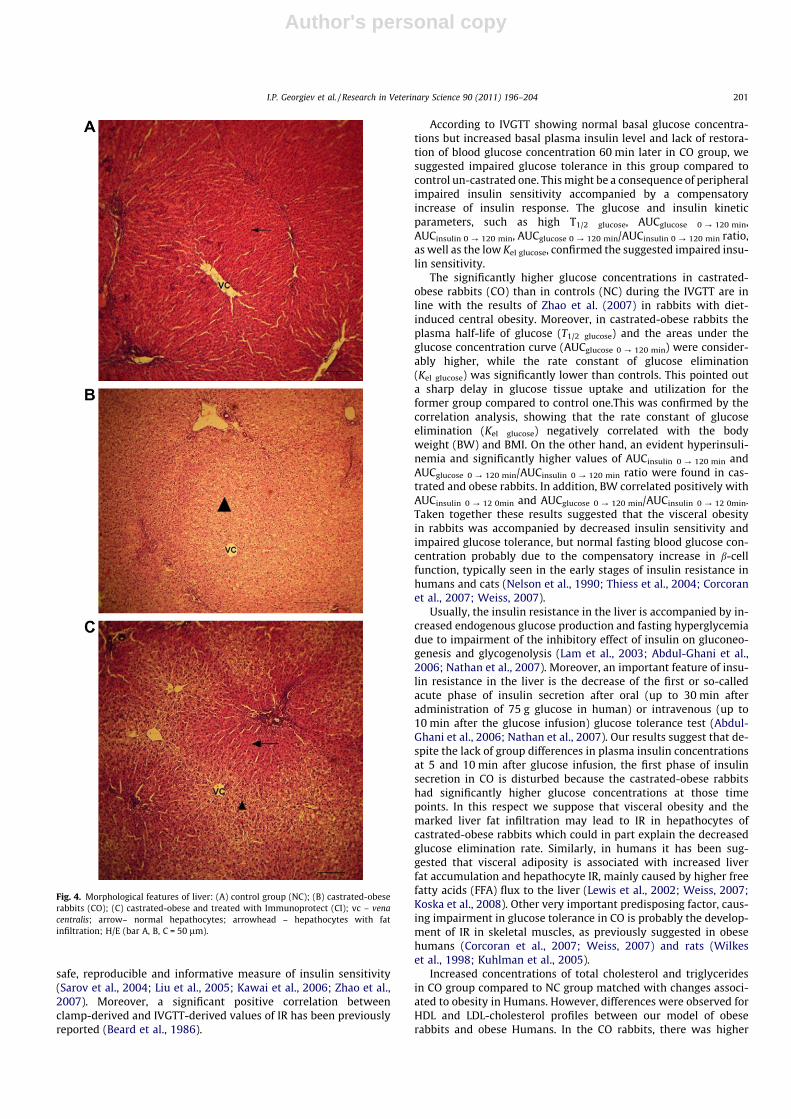
The light microscopy of liver samples revealed bright vacuolesinto hepatocytes of CO group, indicating fat infiltration ascompared to NC group (Fig. 4A) and (Fig. 4B). In CI group, normalhepatocytes predominated as in NC group, whereas some brightvacuoles were confined around the central vein (Fig. 4C).
4. Discussion
4.1. Effect of visceral obesity on insulin resistance and blood lipidparameters
In the current study castration was used to induce weight gainand obesity in rabbits. One of the reasons for this effect of castra-tion has been earlier suggested to be the decreased production ofsexual steroids (Wade and Gray, 1979). Our results showed that2 months after the castration the BW, BMI, the amount of visceralfat and the visceral fat/BW ratio in castrated rabbits were signifi-cantly higher in comparison to the control un-castrated rabbitsat the same age. The BW positively correlated with the amountof visceral fat and plasma triglyceride concentration. These results
indicate that the large body mass of the castrated rabbits ascompared to the control ones is predominantly associated withintra-abdominal fat accumulation and suggests that the high con-centration of triglycerides most probably is associated with thistype of obesity. Therefore, the castrated rabbits developed typicalsigns of the so-called visceral or central obesity. Analogously, cas-tration-induced obesity has been also reported in male cats andwas considered to be the most important predisposing factors fordevelopment of insulin resistance and type 2 diabetes mellitus(Hoenig et al., 2003; Rand et al., 2004; Appleton et al., 2005). Thevisceral obesity is thought as one of the most important predispos-ing factors for insulin resistance and T2DM in humans, as well(Kawai et al., 2006; Zhao et al., 2007; Hays et al., 2008). Moreover,ageing in men is associated with a gradual decline in serum andro-gens and concomitant accumulation of central obesity, insulinresistance and cardio-vascular diseases (CVD) (Isidori et al.,2005). In this respect, we considered that this animal model mightbe used to investigate the mechanisms of the obesity-induced met-abolic disturbances, such as insulin resistance and metabolic syn-drome, which very often proceed to T2DM and/or CVD.
For testing peripheral insulin sensitivity and b-cell function inour rabbit model with castration-induced obesity, we appliedmethods, that were previously used in cats (Nelson et al., 1990;Appleton et al., 2001; Thiess et al., 2004). It is well-known thathyperinsulinemic euglycemic glucose clamp is the reference stan-dard for evaluation of insulin sensitivity in humans (Muniyappa etal., 2008). However, the glucose clamp is a complicated, laborintensive and technically and time demanding procedure whichis best suited for small research studies, i.e. it is difficult to use inlarge-scale investigations and in clinical practice (Chen et al.,2005; Muniyappa et al., 2009). In addition, feasibility of clampsin rodents is an obstacle and is not as accurate and reliable as inhumans (Muniyappa et al., 2008, 2009). Despite some limitationsof IVGTT (indirect measure of insulin resistance and administrationof supra-physiological dose of glucose), we choose this simple,routinely used method in animals including rabbits, to provide a
0
20
40
60
80
100
Con
cent
ratio
n (µ
U/m
l)
CIm
CO
NC
***, b ***, b
*
** *
-20 0 20 40 60 80 100 120Time (min)
Fig. 3. Plasma insulin concentration (Mean ± SEM) in three groups of rabbits after intravenous glucose tolerance test: CI (n = 7) – castrated-obese and treated with‘‘Immunoprotect”; CO (n = 7) – castrated-obese; NC (n = 12) – non-castrated, non-obese (control). Significance of differences between CO and CI: *p < 0.05; **p < 0.01;***p < 0.001. Significance of differences between CO and NC: bp < 0.01.
200 I.P. Georgiev et al. / Research in Veterinary Science 90 (2011) 196–204
Author's personal copy
safe, reproducible and informative measure of insulin sensitivity(Sarov et al., 2004; Liu et al., 2005; Kawai et al., 2006; Zhao et al.,2007). Moreover, a significant positive correlation betweenclamp-derived and IVGTT-derived values of IR has been previouslyreported (Beard et al., 1986).
According to IVGTT showing normal basal glucose concentra-tions but increased basal plasma insulin level and lack of restora-tion of blood glucose concentration 60 min later in CO group, wesuggested impaired glucose tolerance in this group compared tocontrol un-castrated one. This might be a consequence of peripheralimpaired insulin sensitivity accompanied by a compensatoryincrease of insulin response. The glucose and insulin kineticparameters, such as high T1/2 glucose, AUCglucose 0 ? 120 min,AUCinsulin 0 ? 120 min, AUCglucose 0 ? 120 min/AUCinsulin 0 ? 120 min ratio,as well as the low Kel glucose, confirmed the suggested impaired insu-lin sensitivity.
The significantly higher glucose concentrations in castrated-obese rabbits (CO) than in controls (NC) during the IVGTT are inline with the results of Zhao et al. (2007) in rabbits with diet-induced central obesity. Moreover, in castrated-obese rabbits theplasma half-life of glucose (T1/2 glucose) and the areas under theglucose concentration curve (AUCglucose 0 ? 120 min) were consider-ably higher, while the rate constant of glucose elimination(Kel glucose) was significantly lower than controls. This pointed outa sharp delay in glucose tissue uptake and utilization for theformer group compared to control one.This was confirmed by thecorrelation analysis, showing that the rate constant of glucoseelimination (Kel glucose) negatively correlated with the bodyweight (BW) and BMI. On the other hand, an evident hyperinsuli-nemia and significantly higher values of AUCinsulin 0 ? 120 min andAUCglucose 0 ? 120 min/AUCinsulin 0 ? 120 min ratio were found in cas-trated and obese rabbits. In addition, BW correlated positively withAUCinsulin 0 ? 12 0min and AUCglucose 0 ? 120 min/AUCinsulin 0 ? 12 0min.Taken together these results suggested that the visceral obesityin rabbits was accompanied by decreased insulin sensitivity andimpaired glucose tolerance, but normal fasting blood glucose con-centration probably due to the compensatory increase in b-cellfunction, typically seen in the early stages of insulin resistance inhumans and cats (Nelson et al., 1990; Thiess et al., 2004; Corcoranet al., 2007; Weiss, 2007).
Usually, the insulin resistance in the liver is accompanied by in-creased endogenous glucose production and fasting hyperglycemiadue to impairment of the inhibitory effect of insulin on gluconeo-genesis and glycogenolysis (Lam et al., 2003; Abdul-Ghani et al.,2006; Nathan et al., 2007). Moreover, an important feature of insu-lin resistance in the liver is the decrease of the first or so-calledacute phase of insulin secretion after oral (up to 30 min afteradministration of 75 g glucose in human) or intravenous (up to10 min after the glucose infusion) glucose tolerance test (Abdul-Ghani et al., 2006; Nathan et al., 2007). Our results suggest that de-spite the lack of group differences in plasma insulin concentrationsat 5 and 10 min after glucose infusion, the first phase of insulinsecretion in CO is disturbed because the castrated-obese rabbitshad significantly higher glucose concentrations at those timepoints. In this respect we suppose that visceral obesity and themarked liver fat infiltration may lead to IR in hepathocytes ofcastrated-obese rabbits which could in part explain the decreasedglucose elimination rate. Similarly, in humans it has been sug-gested that visceral adiposity is associated with increased liverfat accumulation and hepathocyte IR, mainly caused by higher freefatty acids (FFA) flux to the liver (Lewis et al., 2002; Weiss, 2007;Koska et al., 2008). Other very important predisposing factor, caus-ing impairment in glucose tolerance in CO is probably the develop-ment of IR in skeletal muscles, as previously suggested in obesehumans (Corcoran et al., 2007; Weiss, 2007) and rats (Wilkeset al., 1998; Kuhlman et al., 2005).
Increased concentrations of total cholesterol and triglyceridesin CO group compared to NC group matched with changes associ-ated to obesity in Humans. However, differences were observed forHDL and LDL-cholesterol profiles between our model of obeserabbits and obese Humans. In the CO rabbits, there was higher
Fig. 4. Morphological features of liver: (A) control group (NC); (B) castrated-obeserabbits (CO); (C) castrated-obese and treated with Immunoprotect (CI); vc – venacentralis; arrow– normal hepathocytes; arrowhead – hepathocytes with fatinfiltration; H/E (bar A, B, C = 50 lm).
I.P. Georgiev et al. / Research in Veterinary Science 90 (2011) 196–204 201
Author's personal copy
HDL-cholesterol concentrations than in NC animals, whereas obes-ity in Humans is generally associated with diminished concentra-tions of HDL-cholesterol and elevated concentrations of LDL-one(Howard et al., 2003). At the same time the lipid profile in obeserabbits corresponded with that in heritable postprandial hypertri-glyceridemic rabbits and in the rabbits that were fed with high fatand sucrose diet, leading to visceral obesity and insulin resistance(Yin and Yuan, 2003; Kawai et al., 2006). Recent studies have re-vealed that liver fat accumulation seems to play an important rolein dyslipidemia pathogenesis, as it correlates positively with high-er triglyceride production (Adiels et al., 2008). The observed in-crease of the HDL-cholesterol concentration in castrated andobese rabbits might reflect a protective mechanism against athero-sclerosis, as it has been suggested in cats (Hoenig et al., 2003).Moreover, the castration of male cats was also accompanied by in-creased concentrations of triglycerides and total and HDL-choles-terol and impaired glucose tolerance (Hoenig et al., 2003; Thiesset al., 2004), as it was seen in our experiment with castrated rab-bits. In dogs the age-related obesity was also reported to resultin dyslipidemia and decreased insulin sensitivity (Serisier et al.,2008).
4.2. Effect of ‘‘Immunoprotect” on insulin resistance and blood lipidprofile in obese NZW rabbits
Glucose concentrations during IVGTT in castrated and obeserabbits, treated with Immunoprotect (CI) were similar to those incastrated-obese rabbits (CO) and slightly higher (statistically sig-nificant at 5th and 10th min) than in non-castrated rabbits (con-trols). At 30th, 60th and 120th min the glucose concentrations inCI did not differ from those in controls, while in CO the glucoseconcentration remained significantly higher. In addition, the valuesof T1/2 glucose, Kel glucose and AUCglucose 0 ? 120 min in the treated rab-bits were similar to those in controls, suggesting an increased rateof glucose elimination and tissues disposition as compared withthe castrated-obese rabbits. Taken together these results indicateimprovement of glucose tolerance in rabbits, receiving antioxidantsupplementation.
We suggest that the improved glucose tolerance in the obeserabbits, treated with ‘‘Immunoprotect” is probably due to the in-creased insulin sensitivity and/or responsiveness. This assumptionis based on the observed dynamics of plasma insulin obtained dur-ing the IVGTT: the fasting plasma insulin concentrations and insu-lin response in CI was similar to that in controls and significantlylower than in CO. Thus, we may conclude that in the treated with‘‘Immunoprotect” obese rabbits an improved insulin sensitivity hasoccurred, as it is generally accepted that the hyperinsulinaemia isone of the main features of insulin resistance (Lewis et al., 2002;Appleton et al., 2005; Liu et al., 2005; Zhao et al., 2007).
The suggested favorable effect of Immunoprotect on insulinsensitivity could be in part due to the antioxidant activity of itscomponents, d-limonene and vitamin E. There are data indicatingthat increased levels of ROS in skeletal muscles and adipose tissue,being a result of increased generation and/or impaired antioxidantsystems, are involved in development of insulin resistance (Fridly-and and Philipson, 2006; Bonnard et al., 2008). However, the pre-cise mechanisms driving this process are not fully understood.Nevertheless, it is believed that the high concentration of ROSstimulates serine/threonine kinase pathways which can phosphor-ylate key players of insulin signaling pathways such insulinreceptors (IRs) and insulin receptor substrates-1 and 2 (IRS-1,IRS-2). Increased serine phosphorylation of them decreased the ex-tent of insulin-stimulated tyrosine auto-phosphorylation of IRs andphosphorylation of IRSs and thus attenuates insulin action (Evanset al., 2005; Imoto et al., 2006; Dokken et al., 2007). In addition,it was demonstrated that ROS have an inhibitory effect on the
expression and production of adiponectin from adipose tissue, anadipokine with a well-known positive effect on insulin sensitivity(Furukawa et al., 2004). Moreover, recently it has been shown thatexcess dietary fat intake, both in rodents and humans, leads toinsulin resistance via increased mitochondrial H2O2 emission andshifting of the cellular redox environment to a more oxidized state(Anderson et al., 2009). On the other hand, it is well-known thatunder conditions of visceral obesity in humans the influx of freefatty acids to the liver is accelerated (Lewis et al., 2002; Weiss,2007), and the rapid oxidation of free fatty acids is a process result-ing in increased production of ROS in mitochondria and cells(Lewis et al., 2002; Ceriello and Motz, 2004).
The results from our study showed that the application of‘‘Immunoprotect” for 2 months did not reduce the amount of vis-ceral fat, BW and BMI in castrated rabbits. However, ‘‘Immunopro-tect” treatment improved the lipid profile: there was lowerconcentration of TG and total cholesterol in CI than in CO. Thismore favorable lipid profile, we suppose, could also contribute tothe increased insulin sensitivity in treated animals, as it has beenclearly demonstrated that hypertriglyceridaemia was accompaniedby a reduction of the insulin receptor numbers (Bierger et al.,1984). Our finding of improved insulin sensitivity after administra-tion of antioxidant supplementation ‘‘Immunoprotect” correspondto the results of Manning et al. (2004), who found that in obese hu-mans (BMI > 27 kg/m2) the exogenous administration of high dosesvitamin E led to increased insulin sensitivity (decrease of the basalinsulin concentration and the values of Homeostatic model assess-ment – HOMAins. res) accompanied by a marked reduction in theconcentration of triglycerides, ROS and lipid peroxide products(LPP) (Manning et al., 2004). Some authors explain the favorable ef-fect of vitamin E on insulin sensitivity with its antioxidant activityenabling it to preserve the intracellular redox balance and preventthe activation of stress sensitive serine kinase cascades therebypreventing the serine phosphorylation of IRSs (Vinayaga Moorthiet al., 2006). The vitamin E may improve the insulin sensitivityvia some other mechanisms, such as that related to its diacyglycer-ol lowering effects, which in turn improves insulin signaling(Manning et al., 2004).
There are few data concerning the effect on the insulin sensitiv-ity and/or responsiveness and lipid profile of the other componentsof ‘‘Immunoprotect”, especially the citrus peel extract, whose mainingredient is d-limonene. The isoprenoids, including the limonenand its derivates, are found to suppress the activity of the key en-zyme regulating cholesterol synthesis, 3-hydroxy-3-methylgluta-ryl-CoA reductase (HMGR)) (Peffley and Gayen, 2003). This couldexplain the decrease of total cholesterol concentration in the rab-bits treated with ‘‘Immunoprotect”.
In contrast to CO, where the fat infiltration in liver was widelyspread, resembling fatty liver disease and simple steatosis in hu-mans, in CI fat infiltration was confined only around the centralvein. This could in part explain the improved lipid profile and insu-lin sensitivity in castrated-obese rabbits, treated with Immunopro-tect. The marked decrease of liver fat infiltration in CI is probablydue to the antioxidant activity of vitamin E and d-limonene asthere is accumulating evidence supporting a role of oxidative stressin the pathogenesis of this disorder (Ersoz et al., 2005). In addition,it was shown that antioxidant treatment, including vitamin E, maybe of benefit in fatty liver disease (Ersoz et al., 2005; Comar andSterling, 2006).
We can assume that antioxidant treatment improves insulinsensitivity in obese rabbits as shown by the results of IVGTT. Inthe literature, it still remains unclear whether hepatic fat infiltra-tion causally contributes to insulin resistance or whether it ismerely a resulting pathology. We suppose that the observed lowerfat accumulation in liver reduces IR in ‘‘Immunoprotect” treatedobese rabbits (CI) compared to obese animals (CO). Our suggestion
202 I.P. Georgiev et al. / Research in Veterinary Science 90 (2011) 196–204
Author's personal copy
is based on the previously reported data in humans demonstratingthat the excess of intrahepatic fat deposition causes IR and glucoseintolerance in patients with T2DM (Banerji et al., 1995; Seppälä-Lindroos et al., 2002; Hwang et al., 2007).
However, our results are not sufficient to describe the exactmechanisms of improved insulin sensitivity by ‘‘Immonoprotect”treatment. It has been shown that a rat hepatocyte cell line treatedwith the saturated fatty acid (palmitate) had inhibiting effect onthe insulin-stimulated tyrosine phosphorylation cascade throughreactive oxygen species (ROS) activation of JNK (Nakamura et al.,2009). Thus, we suppose that the antioxidant supplements couldpotentially counterbalance the ROS levels, leading to improvementof liver insulin sensitivity. This is confirmed by liver histology data.On the other hand, our results show that antioxidant supplementsdecreased plasma triglycerides and total cholesterol levels, whichis also an important mechanism for improvement of insulin sensi-tivity. This in turn could cause the decrease in liver fat infiltration.Interestingly, no effect of antioxidant treatment on body weight,BMI and visceral fat was found although the observed lower IR.This is in line with the findings of Seppälä-Lindroos et al. (2002)that fat accumulation in the liver is, independent of body massindex and intra-abdominal and overall obesity, characterized byseveral features of insulin resistance in normal weight and moder-ately overweight subjects.
Therefore, additional studies are needed to better understand-ing the precise mechanisms by which antioxidants affect insulinsensitivity and liver fat accumulation in obesity. Even in humansthese questions are not well elucidated and therefore, animal mod-el studies could be very helpful.
In conclusion, the results of the current study indicated thatcastration-induced visceral obesity affected negatively the lipidprofile and insulin sensitivity and/or responsiveness, whereastreatment with antioxidant supplementation, consisted of d-limo-nene and vitamin E, improved blood lipid profile, fatty liver,glucose homeostasis and insulin sensitivity in obese rabbits. How-ever, additional studies on parameters of oxidative stress and anti-oxidant defense systems are required to clarify the role of vitaminE and d-limonene in improvement of insulin sensitivity in obesity.Finally, based on the results of our study we may suggest that cas-trated male New Zealand white rabbits could be considered as anappropriate animal model to study various metabolic abnormali-ties related to visceral obesity such as dyslipidemia and insulinresistance.
Acknowledgments
This study was supported by grant from the Ministry of Educa-tion and Science of Bulgaria and Trakia University, Stara Zagora,Bulgaria (Grant No. 10/06). We would like to greatly acknowledgeProf. Dr. Zahari Raikov from Medical Faculty of Trakia University,Stara Zagora, Bulgaria for providing ‘‘Immunoprotect” and for hisgreat and valuable scientific support, for his confidence and forthe successful collaboration.
References
Abdul-Ghani, M.A., Jenkinson, C.P., Richardson, D.K., Tripathy, D., DeFronzo, R.A.,2006. Insulin secretion and action in subjects with impaired fasting glucose andimpaired glucose tolerance results from the veterans administration geneticepidemiology study. Diabetes 55, 1430–1435.
Adiels, M., Taskinen, M., Borén, J., 2008. Fatty liver, insulin resistance anddyslipidemia. Current Diabetes Reports 8, 60–64.
Anderson, E.J., Lustig, M.E., Boyle, K.E., Woodlief, T.L., Kane, D.A., Lin, C.T., Price, J.W.,Kang, L., Rabinovitch, P.S., Szeto, H.H., Houmard, J.A., Cortright, R.N.,Wasserman, D.H., Neufer, P.D., 2009. Mitochondrial H2O2 emission andcellular redox state link excess fat intake to insulin resistance in both rodentsand humans. Journal Clinical Investigation. doi:10.1172/JCI37048.
Appleton, D.J., Rand, J.S., Sunvold, G.D., 2001. Insulin sensitivity decreases withobesity, and lean cats with low insulin sensitivity are at greatest risk of glucose
intolerance with weight gain. Journal of Feline Medicine and Surgery 3, 211–228.
Appleton, D.J., Rand, J.S., Sunvold, G.D., 2005. Basal plasma insulin and homeostasismodel assessment (HOMA) are indicators of insulin sensitivity in cats. Journal ofFeline Medicine and Surgery 7, 183–197.
Banerji, M.A., Buckley, M.C., Chaiken, R.L., Gordon, D., Lebovitz, H.E., Kral, J.G., 1995.Liver fat, serum triglycerides and visceral adipose tissue in insulin-sensitive andinsulin-resistant black men with NIDDM. International Journal of Obesity andRelated Metabolic Disorders 19, 846–850.
Beard, J.C., Bergman, R.N., Ward, W.K., Porte, J.R., 1986. The insulin sensitivity indexin nondiabetic man correlation between clamp-derived and IVGTT-derivedvalues. Diabetes 35, 362–369.
Bierger, W.P., Michel, G., Barwich, D., Wirth, A., 1984. Diminished insulin receptorsof monocytes and erythtrocytes in hypertrigliceridemia. Metabolism 33, 382–387.
Bieri, J.G., McKenna, M.C., 1981. Expressing dietary values for fat-soluble vitamins:changes in concepts and terminology. American Journal of Clinical Nutrition 34,289–295.
Bonnard, C., Durand, A., Peyrol, S., Chanseaume, E., Chauvin, M.A., Morio, B., Vidal,H., Rieusset, J., 2008. Mitochondrial dysfunction results from oxidative stress inthe skeletal muscle of diet-induced insulin-resistant mice. Journal of ClinicalInvestigation 118, 789–800.
Ceriello, A., Motz, E., 2004. Is oxidative stress the pathogenic mechanism underlyinginsulin resistance, diabetes, and cardiovascular disease? The common soilhypothesis revisited. Arterioscleosis, Thrombosis, and Vascular Biology 24, 816–823.
Chen, H., Sullivan, G., Quon, M.J., 2005. Assessing the predictive accuracy of QUCKIas a surrogate index for insulin sensitivity using a calibration model. Diabetes54, 1914–1925.
Comar, K., Sterling, R., 2006. Review article: drug therapy for non-alcoholicfatty liver disease. Alimentary Pharmacology and Therapeutics 23, 207–215.
Corcoran, M.P., Fava, S.L., Fielding, R.A., 2007. Skeletal muscle lipid deposition andinsulin resistance: effect of dietary fatty acids and exercise. American Journal ofClinical Nutrition 85, 662–677.
Dokken, B.B., Saengsirisuwan, V., Kim, J.S., Teachey, M.K., Henriksen, E.J., 2007.Oxidative stress-induced insulin resistance in rat skeletal muscle: role ofglycogen synthase kinase-3. American Journal of Physiology Endocrinology andMetabolism 294, E615–E621.
Ersoz, G., Gunsar, F., Karasu, Z., Akay, S., Batur, Y., Akarca, U., 2005. Management offatty liver disease with vitamin E and C compared to ursodeoxicholic acidtreatment. Turkish Journal of Gastroenterology 16, 124–128.
Evans, J.L., Maddux, B.A., Goldfine, I.D., 2005. The molecular basis foroxidative stress-induced insulin resistance. Antioxidant Redox Signal 7, 1040–1052.
Fan, J., Unoki, H., Kojima, N., Sun, H., Shimoyamada, H., Deng, H., Okazaki, M.,Shikama, H., Yamada, N., Watanabe, T., 2001. Overexpression of lipoproteinlipase in transgenic rabbits inhibits diet-induced hypercholesterolemia andatherosclerosis. Journal of Biological Chemistry 276, 40071–40079.
Fridlyand, L.E., Philipson, L.H., 2006. Reactive species and early manifestation ofinsulin resistance in type 2 diabetes. Diabetes Obesity and Metabolism 8, 136–145.
Furukawa, S., Fujita, T., Shimabukuro, M., Iwaki, M., Yamada, Y., Nakajima, Y.,Nakayama, O., Makishima, M., Matsuda, M., Shimomura, I., 2004. Increasedoxidative stress in obesity and impact on metabolic syndrome. Journal ofClinical Investigation 114, 1752–1761.
Hays, N., Galassetti, P., Coker, R., 2008. Prevention and treatment of type 2 diabetes:current role of lifestyle, natural product, and pharmacological intervention.Pharmacology and Therapeutics 118, 181–191.
Hoenig, M., Wilkins, C., Holson, J.C., Ferguson, D.C., 2003. Effects of obesity on lipidprofiles in neutered male and female cats. American Journal of VeterinaryResearch 64, 299–303.
Howard, B.V., Ruotolo, G., Robbins, D.C., 2003. Obesity and dyslipidemia.Endocrinology and Metabolism Clinics of North America 32, 855–894.
Hwang, J.H., Stein, D.T., Barzilai, N., Cui, M.H., Tonelli, J., Kishore, P., Hawkins, M.,2007. Increased intrahepatic triglyceride is associated with peripheral insulinresistance: in vivo MR imaging and spectroscopy studies. American Journal ofPhysiology – Endocrinology and Metabolism 293, 1663–1669.
Ichikawa, T., Kitajima, S., Liang, J., Koike, T., Wang, X., Sun, H., Okazaki, M.,Morimoto, M., Shikama, H., Watanabe, T., Yamada, H., Fan, J., 2004.Overexpression of lipoprotein lipase in transgenic rabbits leads to increasedsmall dense LDL in plasma and promotes atherosclerosis. LaboratoryInvestigation 84, 715–726.
Imoto, K., Kukidome, D., Nishikawa, T., Matsuhisa, T., Sonoda, K., Fujisawa, K., Yano,M., Motoshima, H., Taguchi, T., Tsuruzoe, K., Matsumura, T., Ichijo, H.,Araki, E., 2006. Impact of mitochondrial reactive oxygen species andapoptosis signal-regulating kinase 1 on insulin signaling. Diabetes 55, 1197–1204.
Isidori, A., Giannetta, E., Greco, E., Gianfrilli, D., Bonifacio, V., Isidori, A., Lenzi, A.,Fabbri, A., 2005. Effects of testosterone on body composition, bone metabolismand serum lipid profile in middle-aged men: a meta-analysis. ClinicalEndocrinology 63, 280–293.
Kawai, T., Ito, T., Ohwada, K., Mera, Y., Matsushita, M., Hitonobu, T., 2006. Hereditarypostprandial hypertriglyceridemic rabbit exhibits insulin resistance and centralobesity: a novel model of metabolic syndrome. Arteriosclerosis, Thrombosis,and Vascular Biology; 26, 2752–2757.
I.P. Georgiev et al. / Research in Veterinary Science 90 (2011) 196–204 203
Author's personal copy
Keaney, J.F., Larson, M.G., Vasan, R.S., Wilson, P.W.F., Lipinska, I., Corey, D., Massaro,J.M., Sutherland, P., Vita, J.A., Benjamin, E.J., 2003. Obesity and systemicoxidative stress: clinical correlates of oxidative stress in the Framingham study.Arteriosclerfsis Trombosis Vascular Biology 23, 434–439.
Koska, J., Stefan, N., Permana, P.A., Weyer, C., Sonoda, M., Bogardus, C., Smith, S.R.,Joanisse, D.R., Funahashi, T., Krakoff, J., Bunt, J.C., 2008. Increased fataccumulation in liver may link insulin resistance with subcutaneousabdominal adipocyte enlargement, visceral adiposity, andhypoadiponectinemia in obese individuals. American Journal of ClinicalNutrition 87, 295–302.
Kuhlman, J., Neurmann-Haefelin, C., Belz, U., Kramer, W., Juretschke, H.P., Herling,A.W., 2005. Correlation between insulin resistance and intramyocellular lipidlevels in rats. Magnetic Resonance in Medicine 55, 1275–1282.
Lam, T.K., van de Werve, G., Giacca, A., 2003. Free fatty acids increase basal hepaticglucose production and induce hepatic insulin resistance at different sites.American Journal of Physiology, Endocrinology and Metabolism 284, E281–E290.
Lewis, G.F., Carpentier, A., Adeli, K., Giacca, A., 2002. Disordered fat storage andmobilization in the pathogenesis of insulin resistance and type 2 diabetes.Endocrine Reviews 23, 201–229.
Liu, E., Kitajima, S., Higaki, Y., Morimoto, M., Sun, H., Watanabe, T., Yamada, N., Fan,J., 2005. High lipoprotein lipase activity increases insulin sensitivity intransgenic rabbits. Metabolism Clinical and Experimental 54, 132–138.
Manning, P.G., Sutherland, W.H.F., Walker, R.J., De Jong, S.A., Ryalls, A.R., Berry, E.A.,2004. Effect of high-dose vitamin E on insulin resistance and associatedparameters in overweight subjects. Diabetes Care 27, 2166–2171.
Michaelakis, A., Papachristos, D., Kimbaris, A., Koliopoulos, G., Giatropoulos, A.,Polissiou, M.G., 2009. Citrus essential oils and four enantiomeric pinenesagainst Culex pipiens (Diptera: Culicidae). Parasitological Research 105, 769–773.
Muniyappa, R., Lee, S., Chen, H., Quon, M.J., 2008. Current approaches for assessinginsulin sensitivity and resistance in vivo: advantages, limitations, andappropriate usage. American Journal of Physiology, Endocrinology andMetabolism 294, E15–E26.
Muniyappa, R., Chen, H., Muzumdar, R.H., Einstein, F.H., Yan, X., Quon, M.J., 2009.Comparison between surrogate indexes of insulin sensitivity/resistance andhyperisnulenimic euglycemic clamp estimates in rats. American Journal ofPhysiology, Endocrinology and Metabolism 297, E1023–E1029.
Nakamura, S., Takamura, T., Matsuzawa-Nagata, N., Takayama, H., Misu, H., Noda,H., Nabemoto, S., Kurita, S., Ota, T., Ando, H., Miyamoto, K., Kaneko, S., 2009.Palmitate induces insulin resistance in H4IIEC3 hepatocytes through reactiveoxygen species produced by mitochondria. Journal of Biological Chemistry 284,14809–14818.
Nathan, D.M., Davidson, M.B., DeFronzo, R.A., Heine, R.J., Henry, R.R., Pratley, R.,et al., 2007. Impaired fasting glucose and impaired glucose tolerance:implications for care. Diabetes Care 30, 753–759.
Nelson, R.W., Himsel, C.A., Feldman, E.C., Bottoms, G.D., 1990. Glucose tolerance andinsulin response in normal-weight and obese cats. American Journal ofVeterinary Research 51, 1357–1362.
Odegaard, J.I., Ricardo-Gonzalez, R.R., Goforth, M.H., Morel, C.R., Subramanian, V.,Mukundan, L., Eagle, A.R., Vats, D., Brombacher, F., Ferrante, A.W., Chawla, A.,2007. Macrophage-specific PPARc controls alternative activation and improvesinsulin resistance. Nature 477, 1116–1120.
Peffley, D.M., Gayen, A.K., 2003. Plant-derived monoterpenes suppress hamsterkidney cell 3-hydroxy-3 methylglutaryl coenzyme A reductase synthesis at thepost-transcriptional level. Journal of Nutrition 133, 38–44.
Penchev Georgiev, I., Kanelov, I., Mircheva Georgieva, T., Ivanov, V., Dimitrova, S.,Iliev, Y., Nikolov, J., Lazarov, L., Roussenov, A., 2009. Evaluation of insulinresistance in obese castrated New Zealand white rabbits. Revue de MédecineVétérinaire 170, 335–340.
Rand, J.S., Fleeman, L.M., Farrow, H.A., Appleton, D.J., Lederer, R., 2004. Canine andfeline diabetes mellitus: nature or nurture? Journal of Nutrition 134, 2072S–2080S.
Sarov, G.M., Ilieva, G.S., Vlaykova, T.I., 2004. A case with unusual blood chemistryparameters following a glucose tolerance test and stress. Bulgarian Journal ofVeterinary Medicine 7, 235–238.
Schwartz, M.W., Kahn, S.E., 1999. Diabetes: insulin resistance and obesity. Nature402, 860–861.
Seppälä-Lindroos, A., Vehkavaara, S., Häkkinen, A.M., Goto, T., Westerbacka, J.,Sovijärvi, A., Halavaara, J., Yki-Järvinen, H., 2002. Fat accumulation in the liver isassociated with defects in insulin suppression of glucose production and serumfree fatty acids independent of obesity in normal men. Journal of ClinicalEndocrinology and Metabolism 87, 3023–3028.
Serisier, S., Gayet, C., Leray, V., Le Bloc’h, J., Ouguerram, K., Magot, T., Nguyen, P.,2008. Hypertriglyceridemic insulin-resistant obese dog model: effects of high-fat diet depending on age. Journal of Animal Physiology and Animal Nutrition92, 419–425.
Thiess, S., Becskei, C., Tomsa, K., Lutz, T.A., Wanner, M., 2004. Effects of highcarbohydrate and high fat diet on plasma metabolite levels and on iv glucosetolerance test in intact and neutered male cats. Journal of Feline Medicine andSurgery 6, 207–218.
Vinayaga Moorthi, R., Bobby, Z., Selvaraj, N., Sridhar, M.G., 2006. Vitamin E protectsthe insulin sensitivity and redox balance in rat L6 muscle cells exposed tooxidative stress. Clinical Chemistry Acta 36, 132–136.
Wade, G., Gray, J., 1979. Gonadal effects on food intake and adiposity: a metabolichypothesis. Physiology and Behaviour 22, 583–593.
Weiss, R., 2007. Fat distribution and storage: how much, where, and how? EuropeanJournal of Endocrinology 157, S39–S45.
Wilkes, J., Bonen, A., Bell, R.C., 1998. A modified high-fat diet induces insulinresistance in rat skeletal muscle but not adipocytes. American Journal ofPhysiology 275, E679–E686 (Endocrinology and Metabolism 38).
Yin, W., Yuan, Y., 2003. A lipoprotein lipase-promoting agent, NO-1886, improvesglucose and lipid metabolism in high fat high sucrose-fed New Zealand whiterabbits. Experimental Diabetes Research 4, 27–34.
Zhao, S., Chu, Y., Zhang, C., Lin, Y., Xu, K., Yang, P., Fan, J., Liu, E., 2007. Diet-inducedcentral obesity and insulin resistance in rabbits. Journal of Animal Physiologyand Animal Nutrition 92, 105–111.
204 I.P. Georgiev et al. / Research in Veterinary Science 90 (2011) 196–204
Copyright © 2022 FDOKUMEN